Verona, VA Map & Demographics
Verona Map
Verona Overview
$26,354
PER CAPITA INCOME
$65,729
AVG FAMILY INCOME
$65,067
AVG HOUSEHOLD INCOME
34.2%
WAGE / INCOME GAP [ % ]
65.8¢/ $1
WAGE / INCOME GAP [ $ ]
0.30
INEQUALITY / GINI INDEX
4,582
TOTAL POPULATION
2,456
MALE POPULATION
2,126
FEMALE POPULATION
115.52
MALES / 100 FEMALES
86.56
FEMALES / 100 MALES
40.3
MEDIAN AGE
2.7
AVG FAMILY SIZE
2.4
AVG HOUSEHOLD SIZE
2,011
LABOR FORCE [ PEOPLE ]
52.2%
PERCENT IN LABOR FORCE
2.6%
UNEMPLOYMENT RATE
Verona Zip Codes
Verona Area Codes
Income in Verona
Income Overview in Verona
Per Capita Income in Verona is $26,354, while median incomes of families and households are $65,729 and $65,067 respectively.
| Characteristic | Number | Measure |
| Per Capita Income | 4,582 | $26,354 |
| Median Family Income | 1,225 | $65,729 |
| Mean Family Income | 1,225 | $77,586 |
| Median Household Income | 1,587 | $65,067 |
| Mean Household Income | 1,587 | $73,837 |
| Income Deficit | 1,225 | $0 |
| Wage / Income Gap (%) | 4,582 | 34.17% |
| Wage / Income Gap ($) | 4,582 | 65.83¢ per $1 |
| Gini / Inequality Index | 4,582 | 0.30 |
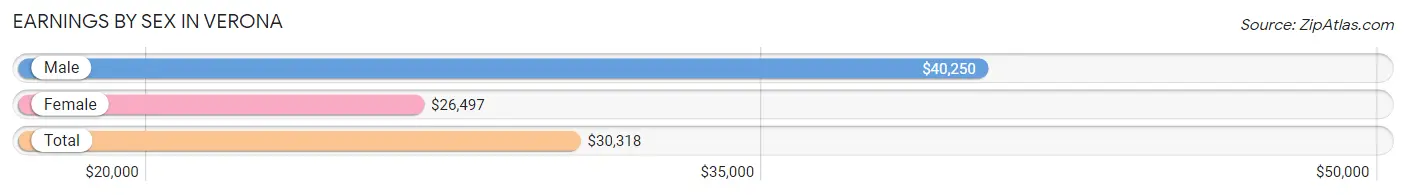
Earnings by Sex in Verona
Average Earnings in Verona are $30,318, $40,250 for men and $26,497 for women, a difference of 34.2%.
| Sex | Number | Average Earnings |
| Male | 1,365 (57.0%) | $40,250 |
| Female | 1,029 (43.0%) | $26,497 |
| Total | 2,394 (100.0%) | $30,318 |
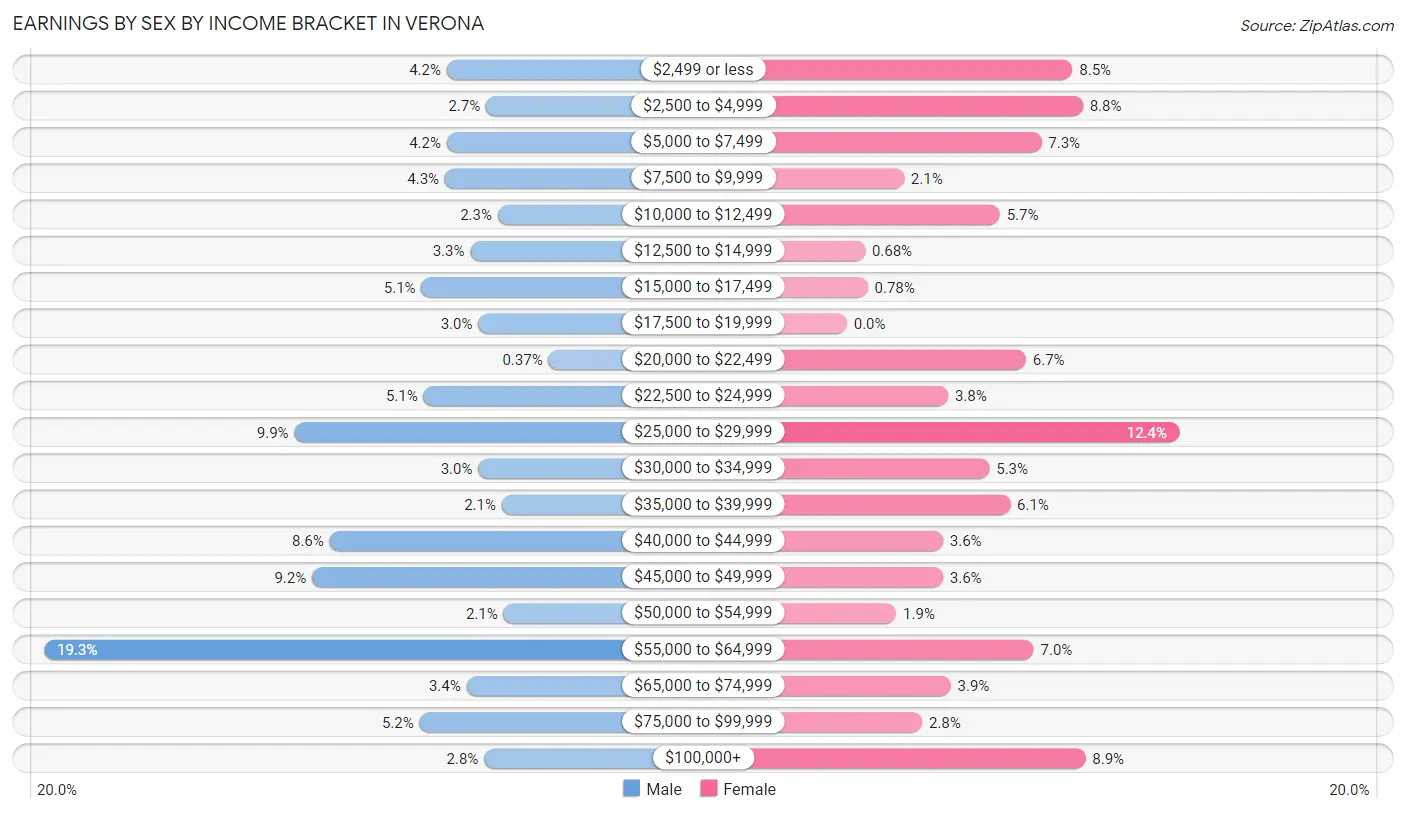
Earnings by Sex by Income Bracket in Verona
The most common earnings brackets in Verona are $55,000 to $64,999 for men (263 | 19.3%) and $25,000 to $29,999 for women (128 | 12.4%).
| Income | Male | Female |
| $2,499 or less | 57 (4.2%) | 87 (8.5%) |
| $2,500 to $4,999 | 37 (2.7%) | 91 (8.8%) |
| $5,000 to $7,499 | 57 (4.2%) | 75 (7.3%) |
| $7,500 to $9,999 | 58 (4.3%) | 22 (2.1%) |
| $10,000 to $12,499 | 31 (2.3%) | 59 (5.7%) |
| $12,500 to $14,999 | 45 (3.3%) | 7 (0.7%) |
| $15,000 to $17,499 | 70 (5.1%) | 8 (0.8%) |
| $17,500 to $19,999 | 41 (3.0%) | 0 (0.0%) |
| $20,000 to $22,499 | 5 (0.4%) | 69 (6.7%) |
| $22,500 to $24,999 | 69 (5.1%) | 39 (3.8%) |
| $25,000 to $29,999 | 135 (9.9%) | 128 (12.4%) |
| $30,000 to $34,999 | 41 (3.0%) | 55 (5.3%) |
| $35,000 to $39,999 | 29 (2.1%) | 63 (6.1%) |
| $40,000 to $44,999 | 117 (8.6%) | 37 (3.6%) |
| $45,000 to $49,999 | 126 (9.2%) | 37 (3.6%) |
| $50,000 to $54,999 | 28 (2.1%) | 19 (1.8%) |
| $55,000 to $64,999 | 263 (19.3%) | 72 (7.0%) |
| $65,000 to $74,999 | 47 (3.4%) | 40 (3.9%) |
| $75,000 to $99,999 | 71 (5.2%) | 29 (2.8%) |
| $100,000+ | 38 (2.8%) | 92 (8.9%) |
| Total | 1,365 (100.0%) | 1,029 (100.0%) |
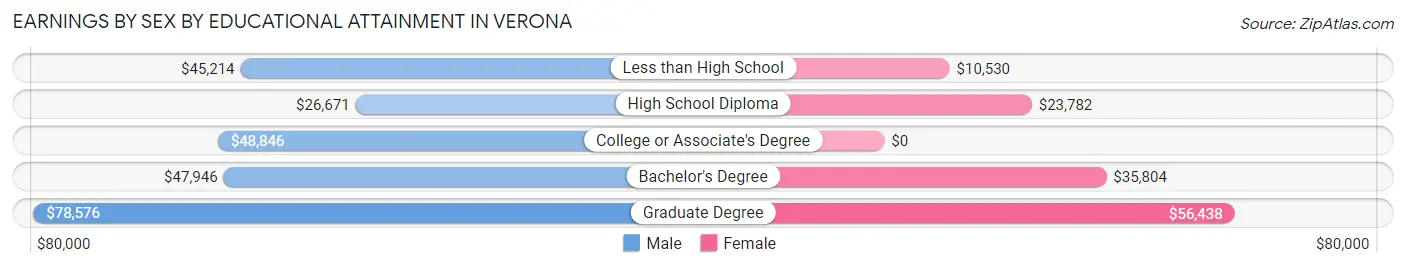
Earnings by Sex by Educational Attainment in Verona
Average earnings in Verona are $40,850 for men and $29,141 for women, a difference of 28.7%. Men with an educational attainment of graduate degree enjoy the highest average annual earnings of $78,576, while those with high school diploma education earn the least with $26,671. Women with an educational attainment of graduate degree earn the most with the average annual earnings of $56,438, while those with less than high school education have the smallest earnings of $10,530.
| Educational Attainment | Male Income | Female Income |
| Less than High School | $45,214 | $10,530 |
| High School Diploma | $26,671 | $23,782 |
| College or Associate's Degree | $48,846 | $0 |
| Bachelor's Degree | $47,946 | $35,804 |
| Graduate Degree | $78,576 | $56,438 |
| Total | $40,850 | $29,141 |
Family Income in Verona
Family Income Brackets in Verona
According to the Verona family income data, there are 347 families falling into the $50,000 to $74,999 income range, which is the most common income bracket and makes up 28.3% of all families.
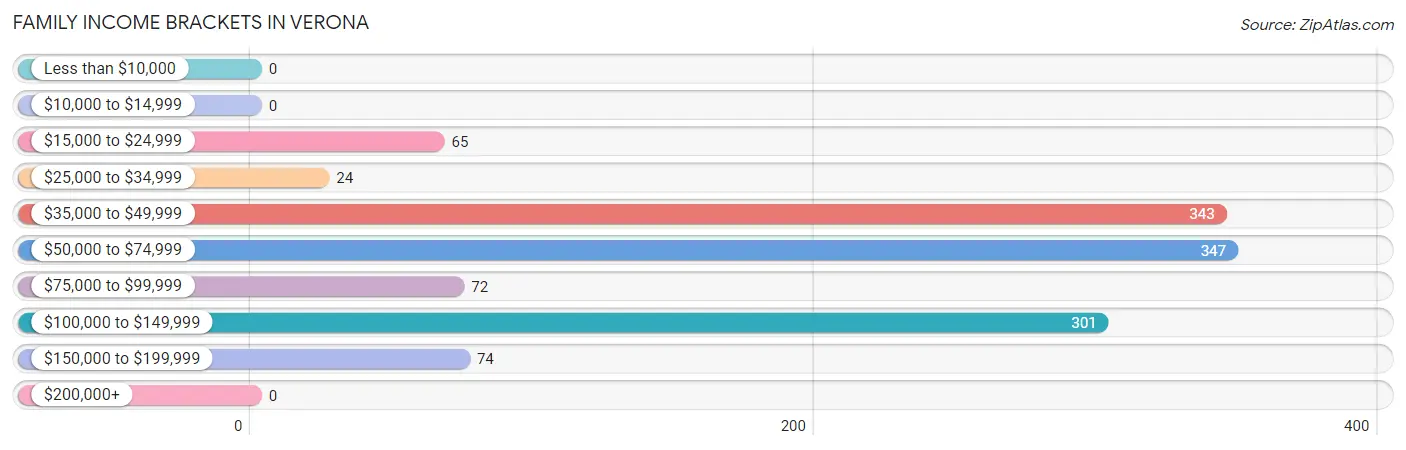
| Income Bracket | # Families | % Families |
| Less than $10,000 | 0 | 0.0% |
| $10,000 to $14,999 | 0 | 0.0% |
| $15,000 to $24,999 | 65 | 5.3% |
| $25,000 to $34,999 | 24 | 2.0% |
| $35,000 to $49,999 | 343 | 28.0% |
| $50,000 to $74,999 | 347 | 28.3% |
| $75,000 to $99,999 | 72 | 5.9% |
| $100,000 to $149,999 | 301 | 24.6% |
| $150,000 to $199,999 | 74 | 6.0% |
| $200,000+ | 0 | 0.0% |
Family Income by Famaliy Size in Verona
4-person families (245 | 20.0%) account for the highest median family income in Verona with $74,248 per family, while 2-person families (671 | 54.8%) have the highest median income of $29,062 per family member.
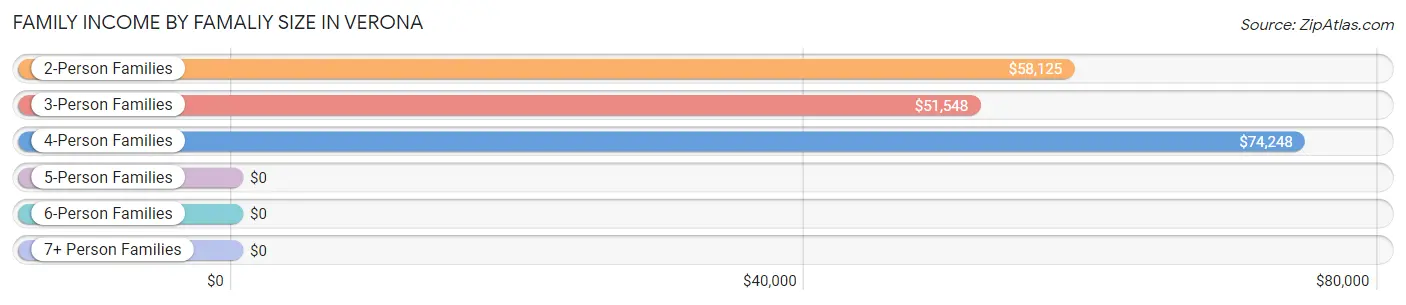
| Income Bracket | # Families | Median Income |
| 2-Person Families | 671 (54.8%) | $58,125 |
| 3-Person Families | 240 (19.6%) | $51,548 |
| 4-Person Families | 245 (20.0%) | $74,248 |
| 5-Person Families | 47 (3.8%) | $0 |
| 6-Person Families | 22 (1.8%) | $0 |
| 7+ Person Families | 0 (0.0%) | $0 |
| Total | 1,225 (100.0%) | $65,729 |
Family Income by Number of Earners in Verona
The median family income in Verona is $65,729, with families comprising 3+ earners (61) having the highest median family income of $127,875, while families with no earners (251) have the lowest median family income of $44,712, accounting for 5.0% and 20.5% of families, respectively.
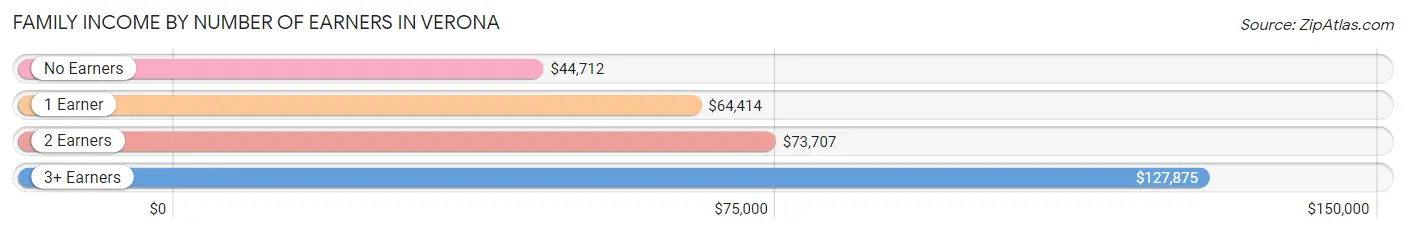
| Number of Earners | # Families | Median Income |
| No Earners | 251 (20.5%) | $44,712 |
| 1 Earner | 277 (22.6%) | $64,414 |
| 2 Earners | 636 (51.9%) | $73,707 |
| 3+ Earners | 61 (5.0%) | $127,875 |
| Total | 1,225 (100.0%) | $65,729 |
Household Income in Verona
Household Income Brackets in Verona
With 506 households falling in the category, the $50,000 to $74,999 income range is the most frequent in Verona, accounting for 31.9% of all households.
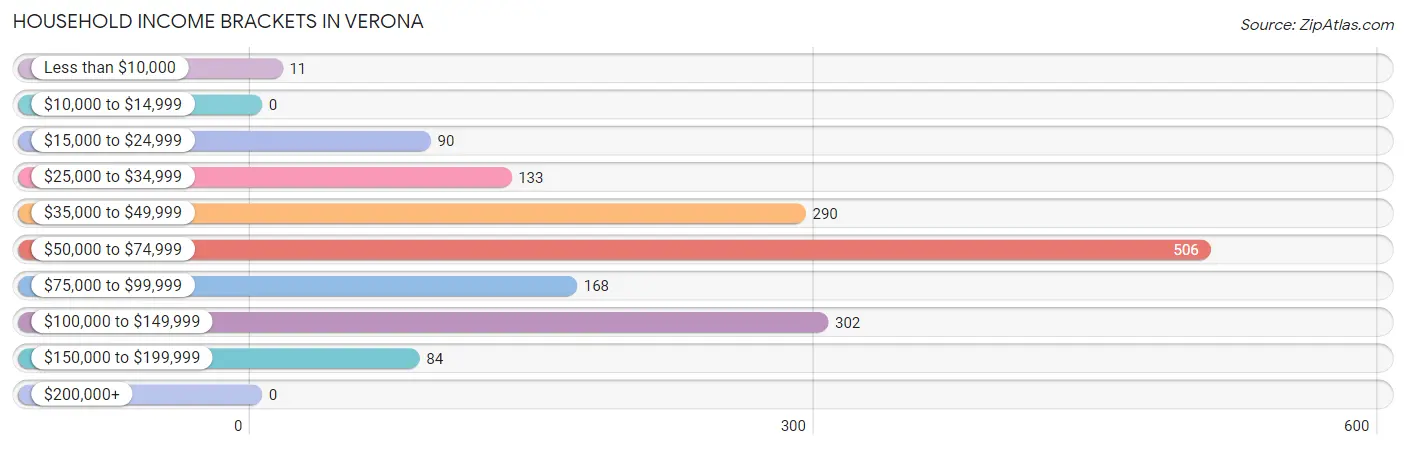
| Income Bracket | # Households | % Households |
| Less than $10,000 | 11 | 0.7% |
| $10,000 to $14,999 | 0 | 0.0% |
| $15,000 to $24,999 | 90 | 5.7% |
| $25,000 to $34,999 | 133 | 8.4% |
| $35,000 to $49,999 | 290 | 18.3% |
| $50,000 to $74,999 | 506 | 31.9% |
| $75,000 to $99,999 | 168 | 10.6% |
| $100,000 to $149,999 | 302 | 19.0% |
| $150,000 to $199,999 | 84 | 5.3% |
| $200,000+ | 0 | 0.0% |
Household Income by Householder Age in Verona
The median household income in Verona is $65,067, with the highest median household income of $76,250 found in the 45 to 64 years age bracket for the primary householder. A total of 500 households (31.5%) fall into this category. Meanwhile, the 15 to 24 years age bracket for the primary householder has the lowest median household income of $0, with 44 households (2.8%) in this group.
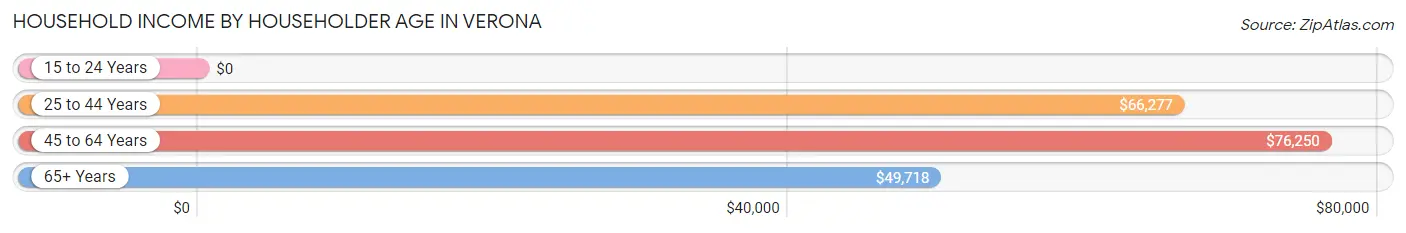
| Income Bracket | # Households | Median Income |
| 15 to 24 Years | 44 (2.8%) | $0 |
| 25 to 44 Years | 506 (31.9%) | $66,277 |
| 45 to 64 Years | 500 (31.5%) | $76,250 |
| 65+ Years | 537 (33.8%) | $49,718 |
| Total | 1,587 (100.0%) | $65,067 |
Poverty in Verona
Income Below Poverty by Sex and Age in Verona
With 3.8% poverty level for males and 6.6% for females among the residents of Verona, under 5 year old males and 15 year old females are the most vulnerable to poverty, with 34 males (27.2%) and 7 females (70.0%) in their respective age groups living below the poverty level.
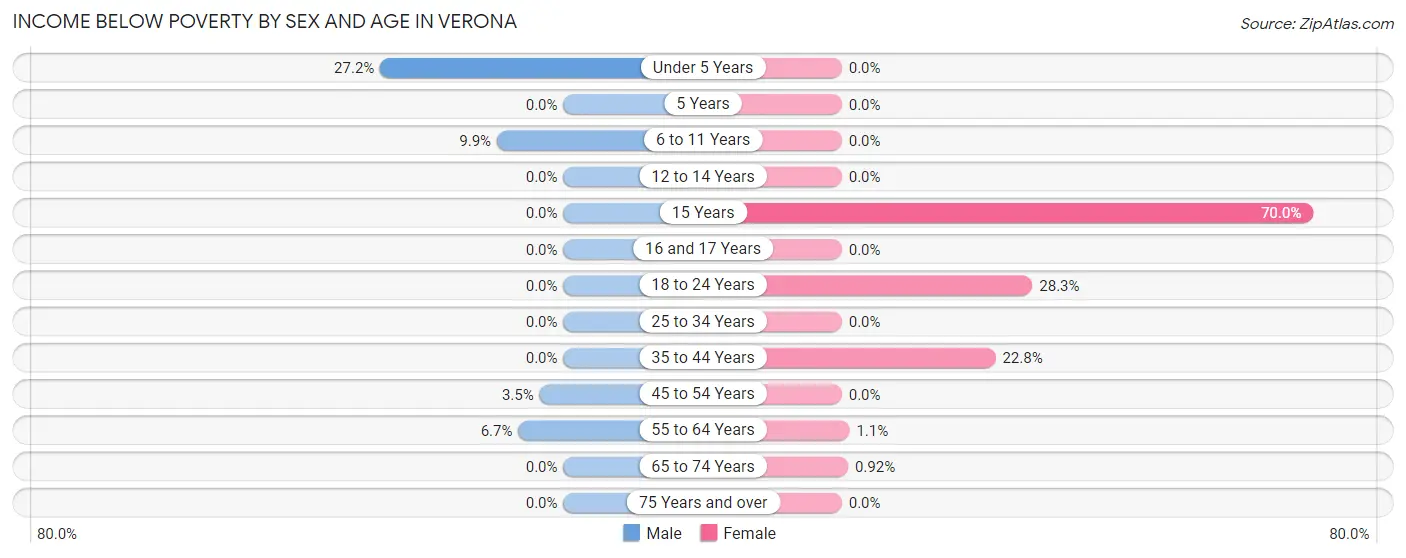
| Age Bracket | Male | Female |
| Under 5 Years | 34 (27.2%) | 0 (0.0%) |
| 5 Years | 0 (0.0%) | 0 (0.0%) |
| 6 to 11 Years | 7 (9.9%) | 0 (0.0%) |
| 12 to 14 Years | 0 (0.0%) | 0 (0.0%) |
| 15 Years | 0 (0.0%) | 7 (70.0%) |
| 16 and 17 Years | 0 (0.0%) | 0 (0.0%) |
| 18 to 24 Years | 0 (0.0%) | 45 (28.3%) |
| 25 to 34 Years | 0 (0.0%) | 0 (0.0%) |
| 35 to 44 Years | 0 (0.0%) | 76 (22.8%) |
| 45 to 54 Years | 9 (3.5%) | 0 (0.0%) |
| 55 to 64 Years | 18 (6.7%) | 3 (1.1%) |
| 65 to 74 Years | 0 (0.0%) | 2 (0.9%) |
| 75 Years and over | 0 (0.0%) | 0 (0.0%) |
| Total | 68 (3.8%) | 133 (6.6%) |
Income Above Poverty by Sex and Age in Verona
According to the poverty statistics in Verona, males aged 5 years and females aged under 5 years are the age groups that are most secure financially, with 100.0% of males and 100.0% of females in these age groups living above the poverty line.
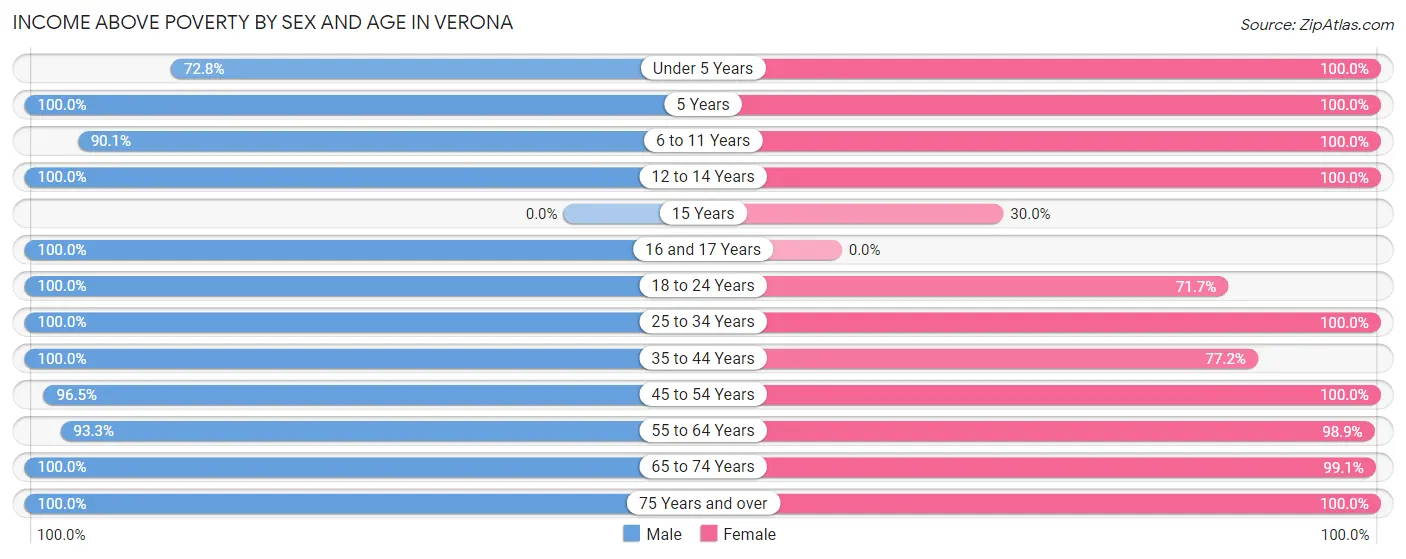
| Age Bracket | Male | Female |
| Under 5 Years | 91 (72.8%) | 134 (100.0%) |
| 5 Years | 69 (100.0%) | 45 (100.0%) |
| 6 to 11 Years | 64 (90.1%) | 186 (100.0%) |
| 12 to 14 Years | 77 (100.0%) | 10 (100.0%) |
| 15 Years | 0 (0.0%) | 3 (30.0%) |
| 16 and 17 Years | 41 (100.0%) | 0 (0.0%) |
| 18 to 24 Years | 139 (100.0%) | 114 (71.7%) |
| 25 to 34 Years | 176 (100.0%) | 130 (100.0%) |
| 35 to 44 Years | 286 (100.0%) | 257 (77.2%) |
| 45 to 54 Years | 245 (96.5%) | 195 (100.0%) |
| 55 to 64 Years | 251 (93.3%) | 260 (98.9%) |
| 65 to 74 Years | 237 (100.0%) | 216 (99.1%) |
| 75 Years and over | 36 (100.0%) | 334 (100.0%) |
| Total | 1,712 (96.2%) | 1,884 (93.4%) |
Income Below Poverty Among Married-Couple Families in Verona
The poverty statistics for married-couple families in Verona show that 2.3% or 18 of the total 791 families live below the poverty line. Families with 1 or 2 children have the highest poverty rate of 7.6%, comprising of 18 families. On the other hand, families with no children have the lowest poverty rate of 0.0%, which includes 0 families.
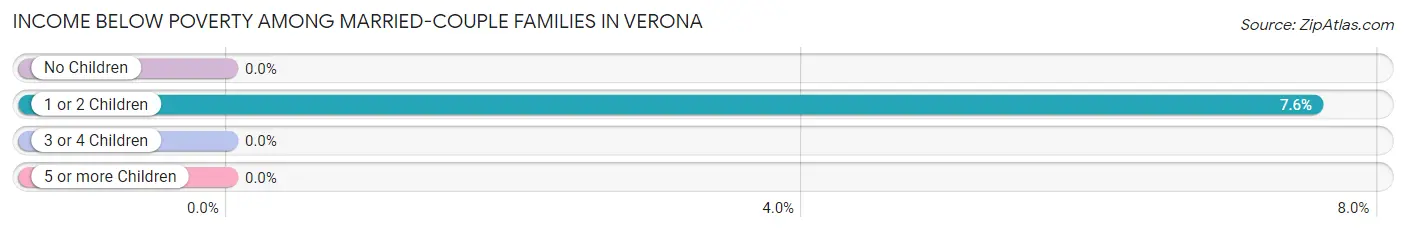
| Children | Above Poverty | Below Poverty |
| No Children | 506 (100.0%) | 0 (0.0%) |
| 1 or 2 Children | 220 (92.4%) | 18 (7.6%) |
| 3 or 4 Children | 47 (100.0%) | 0 (0.0%) |
| 5 or more Children | 0 (0.0%) | 0 (0.0%) |
| Total | 773 (97.7%) | 18 (2.3%) |
Income Below Poverty Among Single-Parent Households in Verona
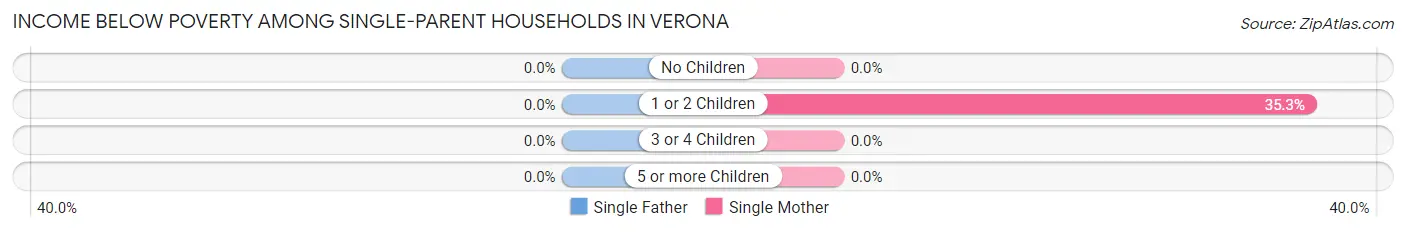
| Children | Single Father | Single Mother |
| No Children | 0 (0.0%) | 0 (0.0%) |
| 1 or 2 Children | 0 (0.0%) | 43 (35.2%) |
| 3 or 4 Children | 0 (0.0%) | 0 (0.0%) |
| 5 or more Children | 0 (0.0%) | 0 (0.0%) |
| Total | 0 (0.0%) | 43 (12.6%) |
Income Below Poverty Among Married-Couple vs Single-Parent Households in Verona
The poverty data for Verona shows that 18 of the married-couple family households (2.3%) and 43 of the single-parent households (9.9%) are living below the poverty level. Within the married-couple family households, those with 1 or 2 children have the highest poverty rate, with 18 households (7.6%) falling below the poverty line. Among the single-parent households, those with 1 or 2 children have the highest poverty rate, with 43 household (20.1%) living below poverty.
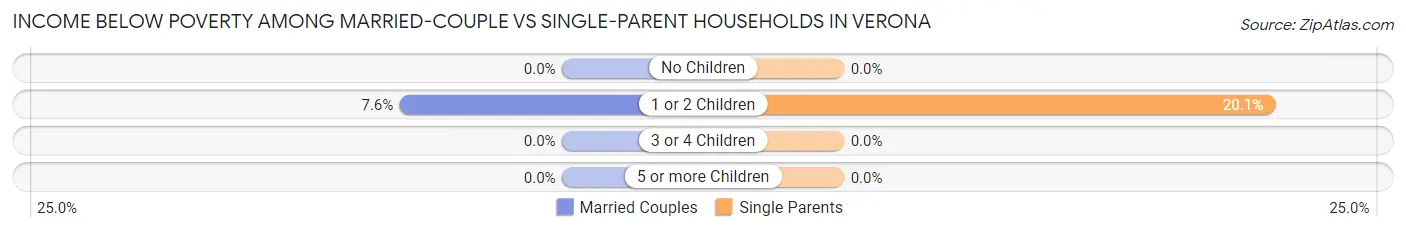
| Children | Married-Couple Families | Single-Parent Households |
| No Children | 0 (0.0%) | 0 (0.0%) |
| 1 or 2 Children | 18 (7.6%) | 43 (20.1%) |
| 3 or 4 Children | 0 (0.0%) | 0 (0.0%) |
| 5 or more Children | 0 (0.0%) | 0 (0.0%) |
| Total | 18 (2.3%) | 43 (9.9%) |
Race in Verona
The most populous races in Verona are White / Caucasian (4,196 | 91.6%), Black / African American (232 | 5.1%), and Hispanic or Latino (95 | 2.1%).
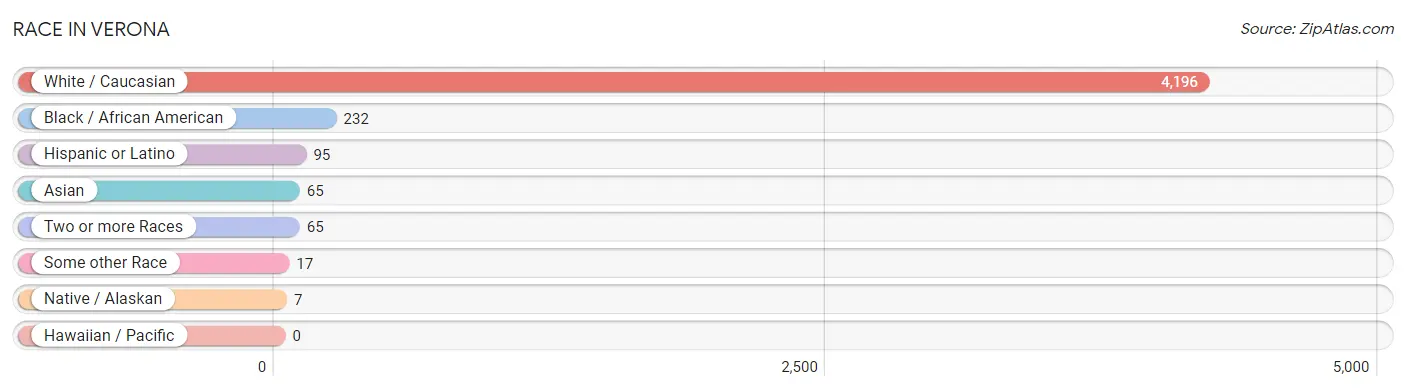
| Race | # Population | % Population |
| Asian | 65 | 1.4% |
| Black / African American | 232 | 5.1% |
| Hawaiian / Pacific | 0 | 0.0% |
| Hispanic or Latino | 95 | 2.1% |
| Native / Alaskan | 7 | 0.2% |
| White / Caucasian | 4,196 | 91.6% |
| Two or more Races | 65 | 1.4% |
| Some other Race | 17 | 0.4% |
| Total | 4,582 | 100.0% |
Ancestry in Verona
The most populous ancestries reported in Verona are German (669 | 14.6%), English (305 | 6.7%), American (251 | 5.5%), Irish (229 | 5.0%), and Italian (84 | 1.8%), together accounting for 33.6% of all Verona residents.
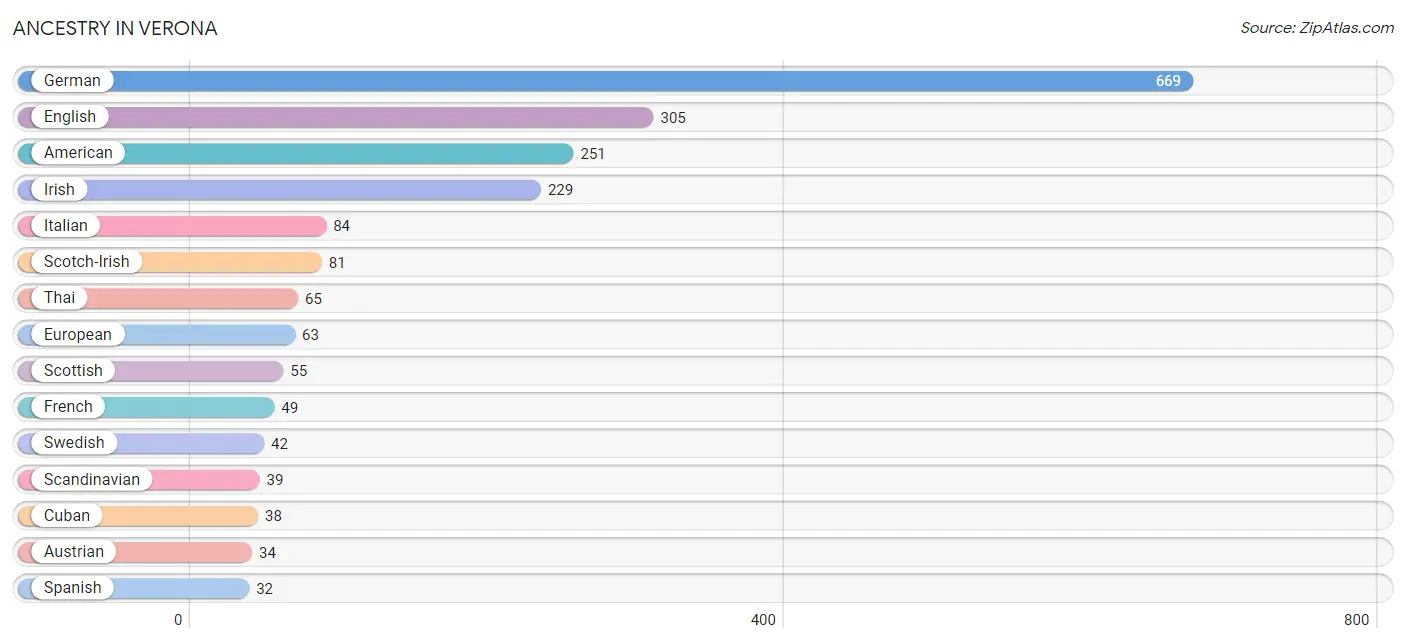
| Ancestry | # Population | % Population |
| African | 5 | 0.1% |
| American | 251 | 5.5% |
| Austrian | 34 | 0.7% |
| British | 15 | 0.3% |
| Central American | 8 | 0.2% |
| Cuban | 38 | 0.8% |
| Czech | 28 | 0.6% |
| Dutch | 19 | 0.4% |
| English | 305 | 6.7% |
| European | 63 | 1.4% |
| French | 49 | 1.1% |
| German | 669 | 14.6% |
| Honduran | 8 | 0.2% |
| Irish | 229 | 5.0% |
| Italian | 84 | 1.8% |
| Mexican | 8 | 0.2% |
| Norwegian | 24 | 0.5% |
| Polish | 5 | 0.1% |
| Portuguese | 25 | 0.5% |
| Puerto Rican | 9 | 0.2% |
| Scandinavian | 39 | 0.9% |
| Scotch-Irish | 81 | 1.8% |
| Scottish | 55 | 1.2% |
| Spanish | 32 | 0.7% |
| Subsaharan African | 5 | 0.1% |
| Swedish | 42 | 0.9% |
| Swiss | 11 | 0.2% |
| Thai | 65 | 1.4% |
| Welsh | 7 | 0.2% | View All 29 Rows |
Immigrants in Verona
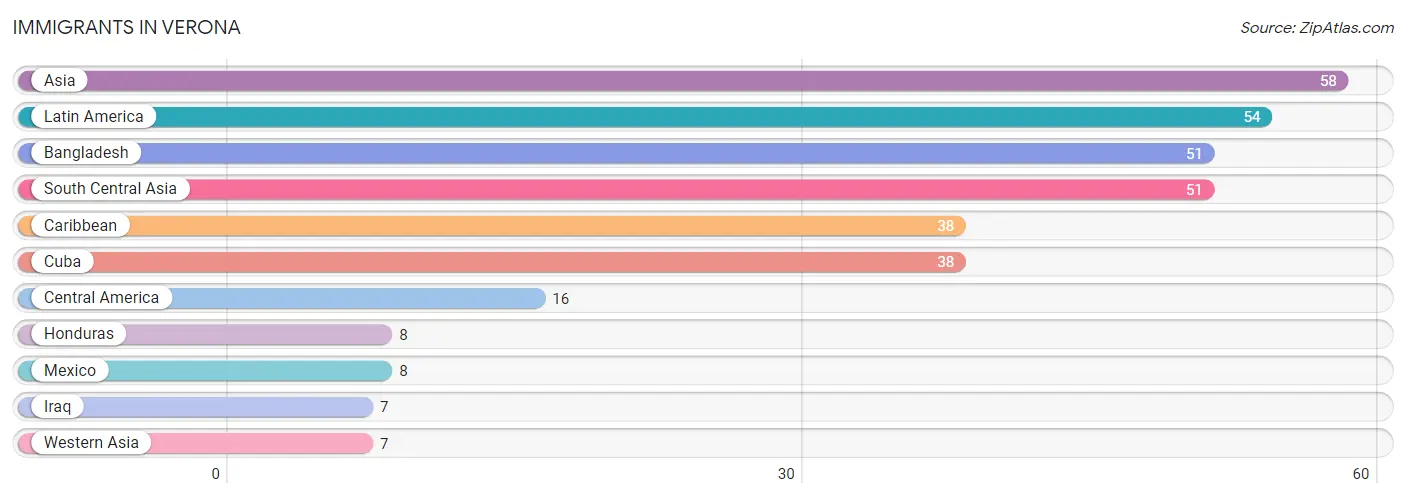
The most numerous immigrant groups reported in Verona came from Asia (58 | 1.3%), Latin America (54 | 1.2%), Bangladesh (51 | 1.1%), South Central Asia (51 | 1.1%), and Caribbean (38 | 0.8%), together accounting for 5.5% of all Verona residents.
| Immigration Origin | # Population | % Population |
| Asia | 58 | 1.3% |
| Bangladesh | 51 | 1.1% |
| Caribbean | 38 | 0.8% |
| Central America | 16 | 0.4% |
| Cuba | 38 | 0.8% |
| Honduras | 8 | 0.2% |
| Iraq | 7 | 0.2% |
| Latin America | 54 | 1.2% |
| Mexico | 8 | 0.2% |
| South Central Asia | 51 | 1.1% |
| Western Asia | 7 | 0.2% | View All 11 Rows |
Sex and Age in Verona
Sex and Age in Verona
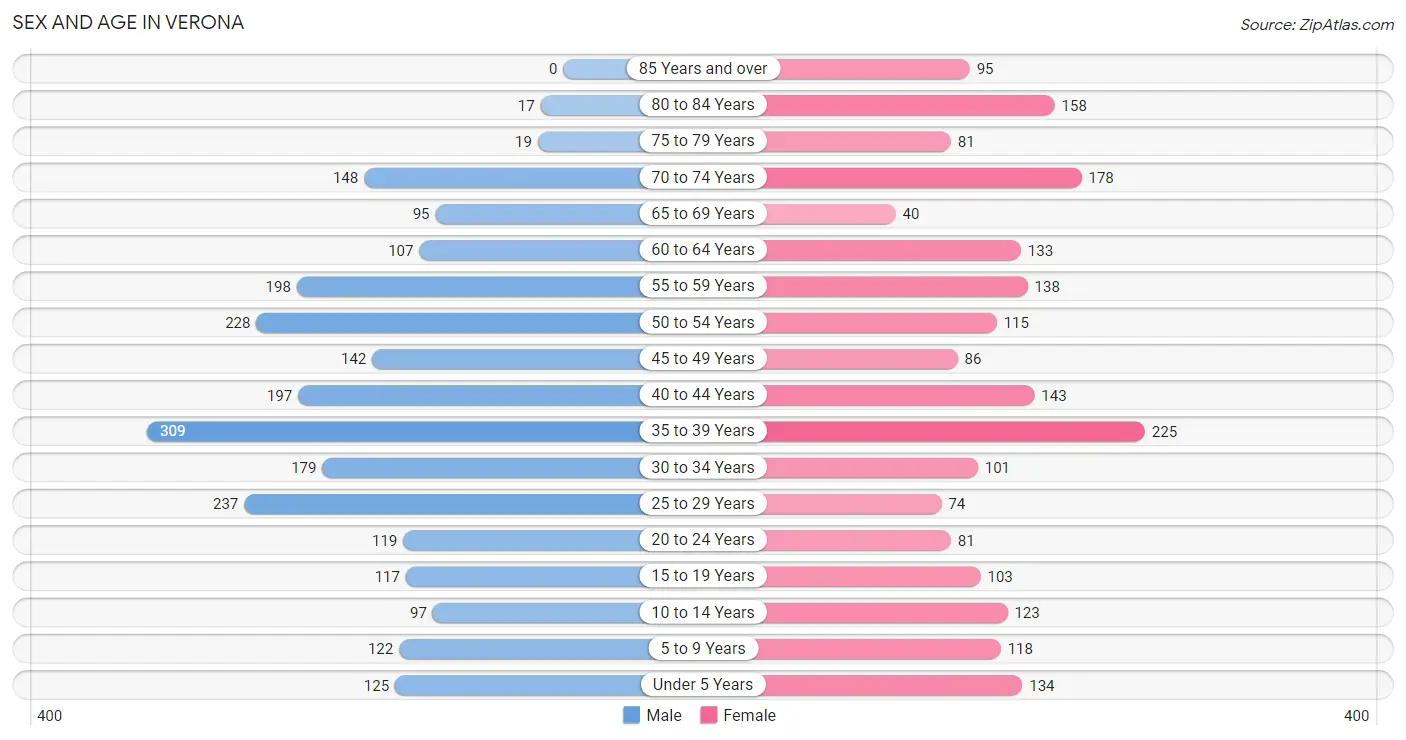
The most populous age groups in Verona are 35 to 39 Years (309 | 12.6%) for men and 35 to 39 Years (225 | 10.6%) for women.
| Age Bracket | Male | Female |
| Under 5 Years | 125 (5.1%) | 134 (6.3%) |
| 5 to 9 Years | 122 (5.0%) | 118 (5.6%) |
| 10 to 14 Years | 97 (4.0%) | 123 (5.8%) |
| 15 to 19 Years | 117 (4.8%) | 103 (4.8%) |
| 20 to 24 Years | 119 (4.9%) | 81 (3.8%) |
| 25 to 29 Years | 237 (9.7%) | 74 (3.5%) |
| 30 to 34 Years | 179 (7.3%) | 101 (4.8%) |
| 35 to 39 Years | 309 (12.6%) | 225 (10.6%) |
| 40 to 44 Years | 197 (8.0%) | 143 (6.7%) |
| 45 to 49 Years | 142 (5.8%) | 86 (4.1%) |
| 50 to 54 Years | 228 (9.3%) | 115 (5.4%) |
| 55 to 59 Years | 198 (8.1%) | 138 (6.5%) |
| 60 to 64 Years | 107 (4.4%) | 133 (6.3%) |
| 65 to 69 Years | 95 (3.9%) | 40 (1.9%) |
| 70 to 74 Years | 148 (6.0%) | 178 (8.4%) |
| 75 to 79 Years | 19 (0.8%) | 81 (3.8%) |
| 80 to 84 Years | 17 (0.7%) | 158 (7.4%) |
| 85 Years and over | 0 (0.0%) | 95 (4.5%) |
| Total | 2,456 (100.0%) | 2,126 (100.0%) |
Families and Households in Verona
Median Family Size in Verona
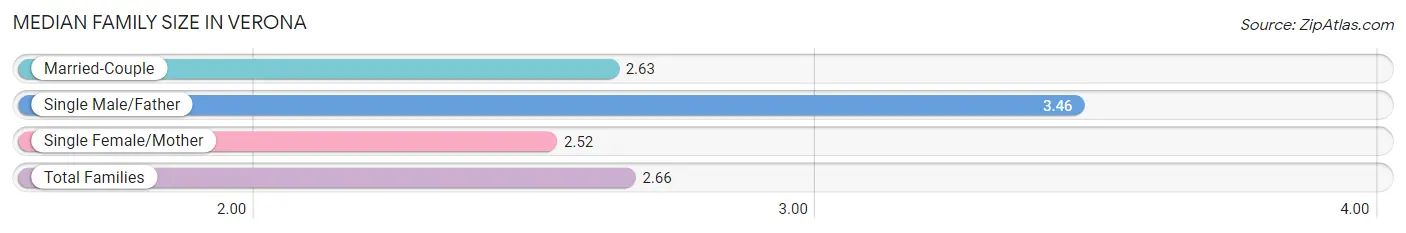
The median family size in Verona is 2.66 persons per family, with single male/father families (92 | 7.5%) accounting for the largest median family size of 3.46 persons per family. On the other hand, single female/mother families (342 | 27.9%) represent the smallest median family size with 2.52 persons per family.
| Family Type | # Families | Family Size |
| Married-Couple | 791 (64.6%) | 2.63 |
| Single Male/Father | 92 (7.5%) | 3.46 |
| Single Female/Mother | 342 (27.9%) | 2.52 |
| Total Families | 1,225 (100.0%) | 2.66 |
Median Household Size in Verona
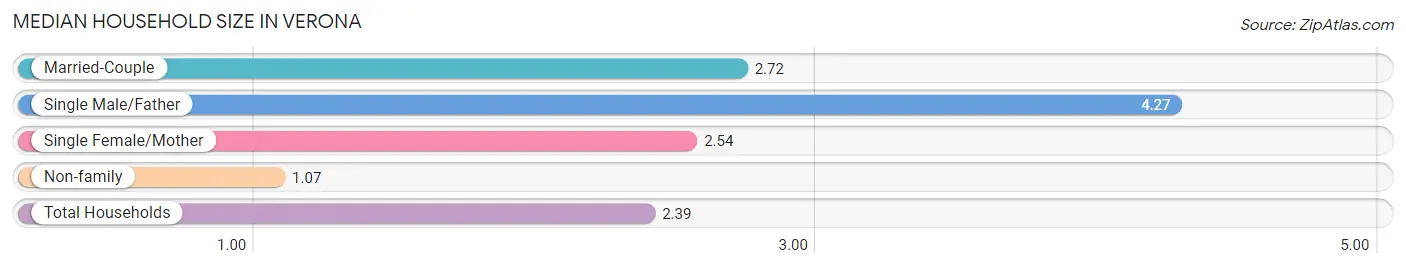
The median household size in Verona is 2.39 persons per household, with single male/father households (92 | 5.8%) accounting for the largest median household size of 4.27 persons per household. non-family households (362 | 22.8%) represent the smallest median household size with 1.07 persons per household.
| Household Type | # Households | Household Size |
| Married-Couple | 791 (49.8%) | 2.72 |
| Single Male/Father | 92 (5.8%) | 4.27 |
| Single Female/Mother | 342 (21.5%) | 2.54 |
| Non-family | 362 (22.8%) | 1.07 |
| Total Households | 1,587 (100.0%) | 2.39 |
Household Size by Marriage Status in Verona
Out of a total of 1,587 households in Verona, 1,225 (77.2%) are family households, while 362 (22.8%) are nonfamily households. The most numerous type of family households are 2-person households, comprising 554, and the most common type of nonfamily households are 1-person households, comprising 328.
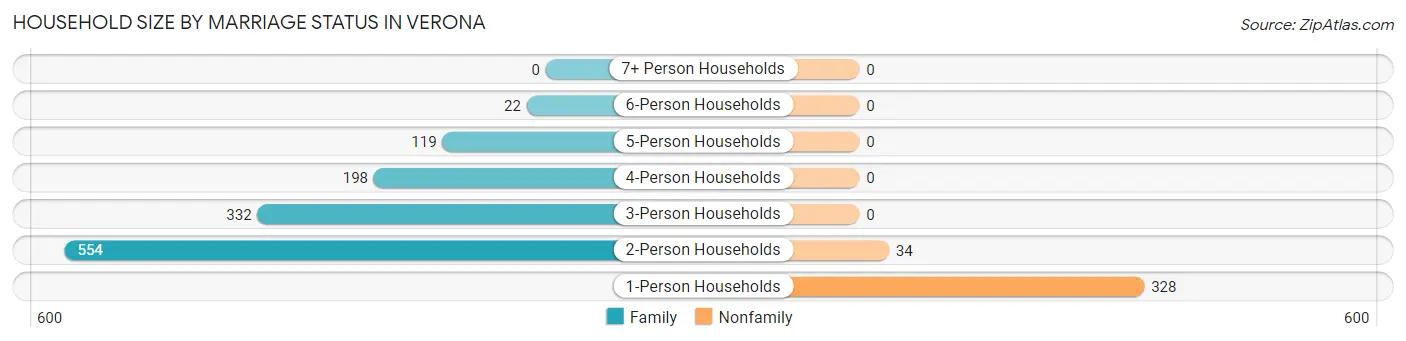
| Household Size | Family Households | Nonfamily Households |
| 1-Person Households | - | 328 (20.7%) |
| 2-Person Households | 554 (34.9%) | 34 (2.1%) |
| 3-Person Households | 332 (20.9%) | 0 (0.0%) |
| 4-Person Households | 198 (12.5%) | 0 (0.0%) |
| 5-Person Households | 119 (7.5%) | 0 (0.0%) |
| 6-Person Households | 22 (1.4%) | 0 (0.0%) |
| 7+ Person Households | 0 (0.0%) | 0 (0.0%) |
| Total | 1,225 (77.2%) | 362 (22.8%) |
Female Fertility in Verona
Fertility by Age in Verona
Average fertility rate in Verona is 111.0 births per 1,000 women. Women in the age bracket of 20 to 34 years have the highest fertility rate with 141.0 births per 1,000 women. Women in the age bracket of 35 to 50 years acount for 61.7% of all women with births.
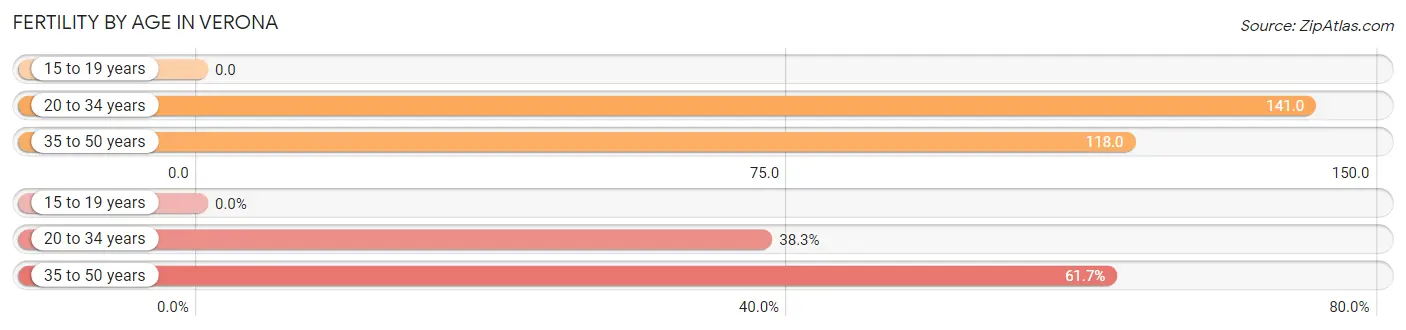
| Age Bracket | Women with Births | Births / 1,000 Women |
| 15 to 19 years | 0 (0.0%) | 0.0 |
| 20 to 34 years | 36 (38.3%) | 141.0 |
| 35 to 50 years | 58 (61.7%) | 118.0 |
| Total | 94 (100.0%) | 111.0 |
Fertility by Age by Marriage Status in Verona
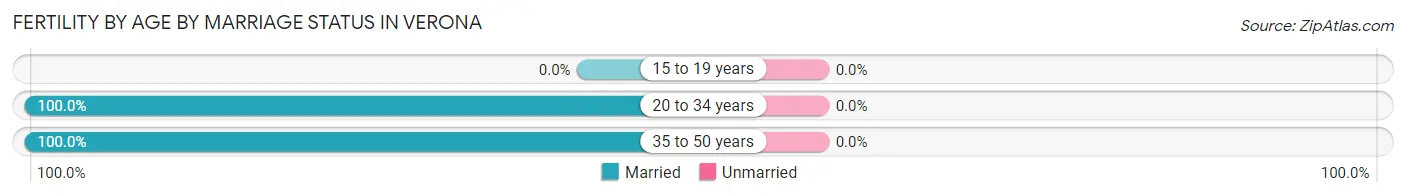
| Age Bracket | Married | Unmarried |
| 15 to 19 years | 0 (0.0%) | 0 (0.0%) |
| 20 to 34 years | 36 (100.0%) | 0 (0.0%) |
| 35 to 50 years | 58 (100.0%) | 0 (0.0%) |
| Total | 94 (100.0%) | 0 (0.0%) |
Fertility by Education in Verona
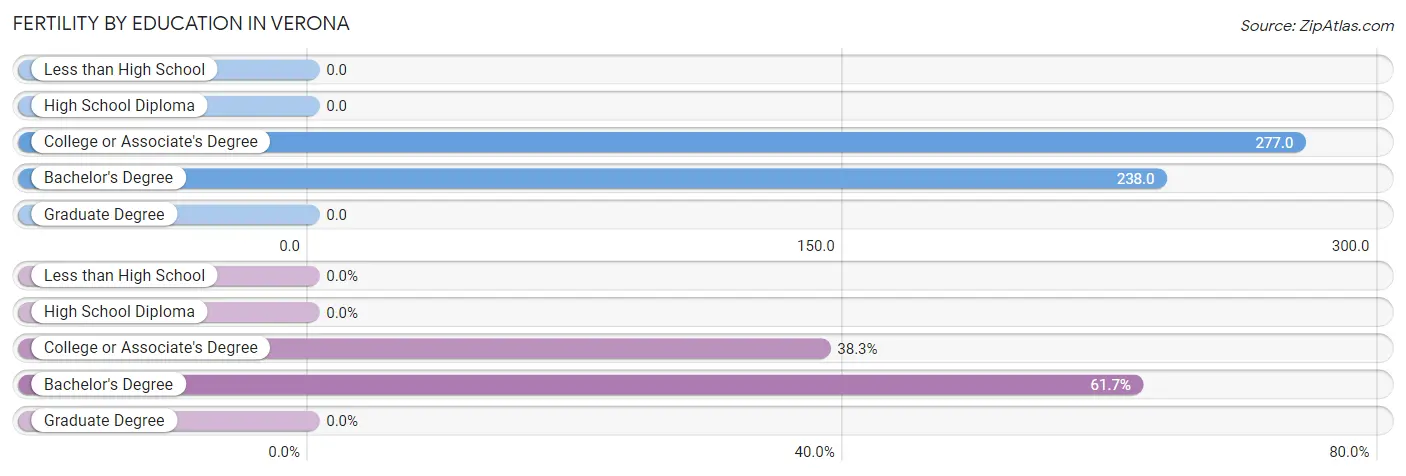
| Educational Attainment | Women with Births | Births / 1,000 Women |
| Less than High School | 0 (0.0%) | 0.0 |
| High School Diploma | 0 (0.0%) | 0.0 |
| College or Associate's Degree | 36 (38.3%) | 277.0 |
| Bachelor's Degree | 58 (61.7%) | 238.0 |
| Graduate Degree | 0 (0.0%) | 0.0 |
| Total | 94 (100.0%) | 111.0 |
Fertility by Education by Marriage Status in Verona
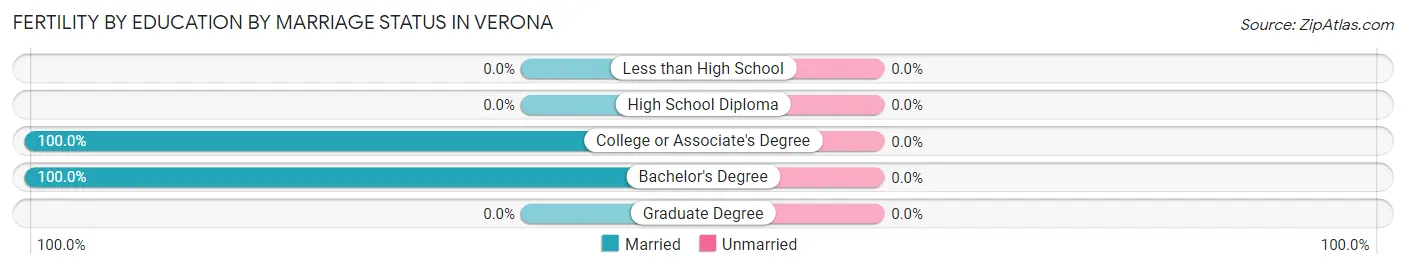
| Educational Attainment | Married | Unmarried |
| Less than High School | 0 (0.0%) | 0 (0.0%) |
| High School Diploma | 0 (0.0%) | 0 (0.0%) |
| College or Associate's Degree | 36 (100.0%) | 0 (0.0%) |
| Bachelor's Degree | 58 (100.0%) | 0 (0.0%) |
| Graduate Degree | 0 (0.0%) | 0 (0.0%) |
| Total | 94 (100.0%) | 0 (0.0%) |
Employment Characteristics in Verona
Employment by Class of Employer in Verona
Among the 1,959 employed individuals in Verona, private company employees (1,506 | 76.9%), local government employees (212 | 10.8%), and state government employees (69 | 3.5%) make up the most common classes of employment.
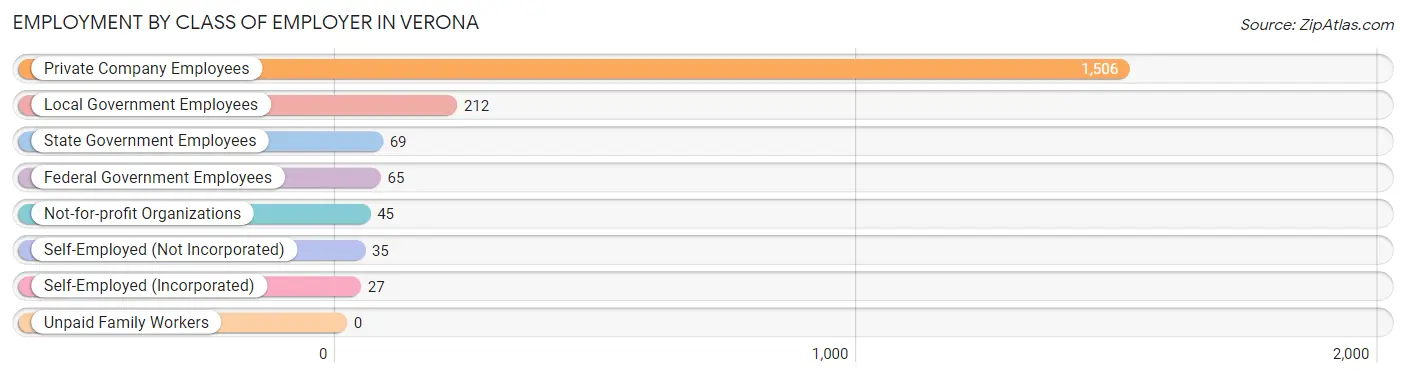
| Employer Class | # Employees | % Employees |
| Private Company Employees | 1,506 | 76.9% |
| Self-Employed (Incorporated) | 27 | 1.4% |
| Self-Employed (Not Incorporated) | 35 | 1.8% |
| Not-for-profit Organizations | 45 | 2.3% |
| Local Government Employees | 212 | 10.8% |
| State Government Employees | 69 | 3.5% |
| Federal Government Employees | 65 | 3.3% |
| Unpaid Family Workers | 0 | 0.0% |
| Total | 1,959 | 100.0% |
Employment Status by Age in Verona
According to the labor force statistics for Verona, out of the total population over 16 years of age (3,853), 52.2% or 2,011 individuals are in the labor force, with 2.6% or 52 of them unemployed. The age group with the highest labor force participation rate is 20 to 24 years, with 86.0% or 172 individuals in the labor force. Within the labor force, the 16 to 19 years age range has the highest percentage of unemployed individuals, with 25.6% or 22 of them being unemployed.
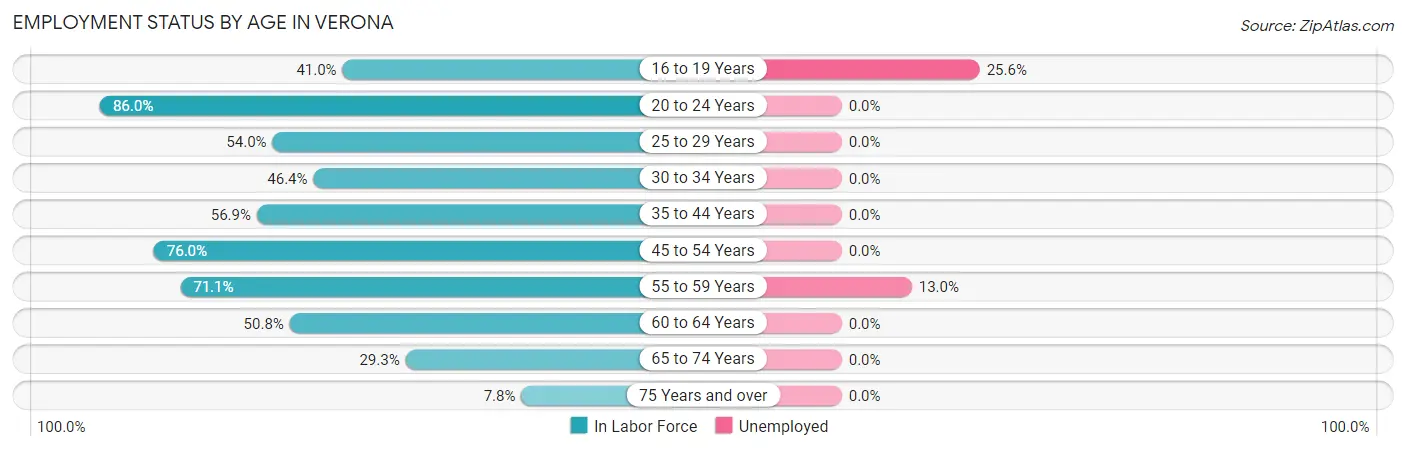
| Age Bracket | In Labor Force | Unemployed |
| 16 to 19 Years | 86 (41.0%) | 22 (25.6%) |
| 20 to 24 Years | 172 (86.0%) | 0 (0.0%) |
| 25 to 29 Years | 168 (54.0%) | 0 (0.0%) |
| 30 to 34 Years | 130 (46.4%) | 0 (0.0%) |
| 35 to 44 Years | 497 (56.9%) | 0 (0.0%) |
| 45 to 54 Years | 434 (76.0%) | 0 (0.0%) |
| 55 to 59 Years | 239 (71.1%) | 31 (13.0%) |
| 60 to 64 Years | 122 (50.8%) | 0 (0.0%) |
| 65 to 74 Years | 135 (29.3%) | 0 (0.0%) |
| 75 Years and over | 29 (7.8%) | 0 (0.0%) |
| Total | 2,011 (52.2%) | 52 (2.6%) |
Employment Status by Educational Attainment in Verona
According to labor force statistics for Verona, 60.9% of individuals (1,591) out of the total population between 25 and 64 years of age (2,612) are in the labor force, with 1.9% or 30 of them being unemployed. The group with the highest labor force participation rate are those with the educational attainment of bachelor's degree or higher, with 79.0% or 455 individuals in the labor force. Within the labor force, individuals with high school diploma education have the highest percentage of unemployment, with 4.3% or 31 of them being unemployed.
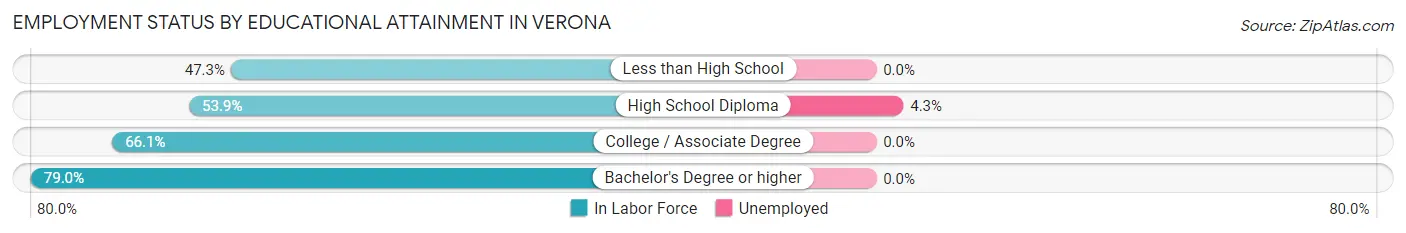
| Educational Attainment | In Labor Force | Unemployed |
| Less than High School | 124 (47.3%) | 0 (0.0%) |
| High School Diploma | 717 (53.9%) | 57 (4.3%) |
| College / Associate Degree | 293 (66.1%) | 0 (0.0%) |
| Bachelor's Degree or higher | 455 (79.0%) | 0 (0.0%) |
| Total | 1,591 (60.9%) | 50 (1.9%) |
Employment Occupations by Sex in Verona
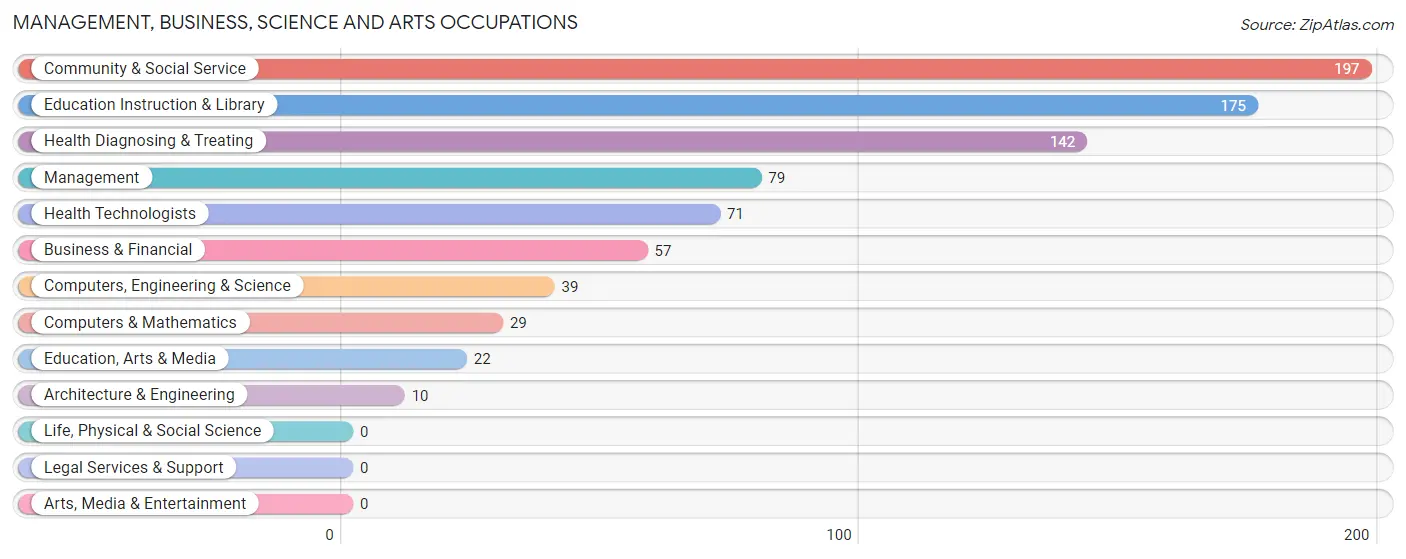
Management, Business, Science and Arts Occupations
The most common Management, Business, Science and Arts occupations in Verona are Community & Social Service (197 | 10.1%), Education Instruction & Library (175 | 8.9%), Health Diagnosing & Treating (142 | 7.2%), Management (79 | 4.0%), and Health Technologists (71 | 3.6%).
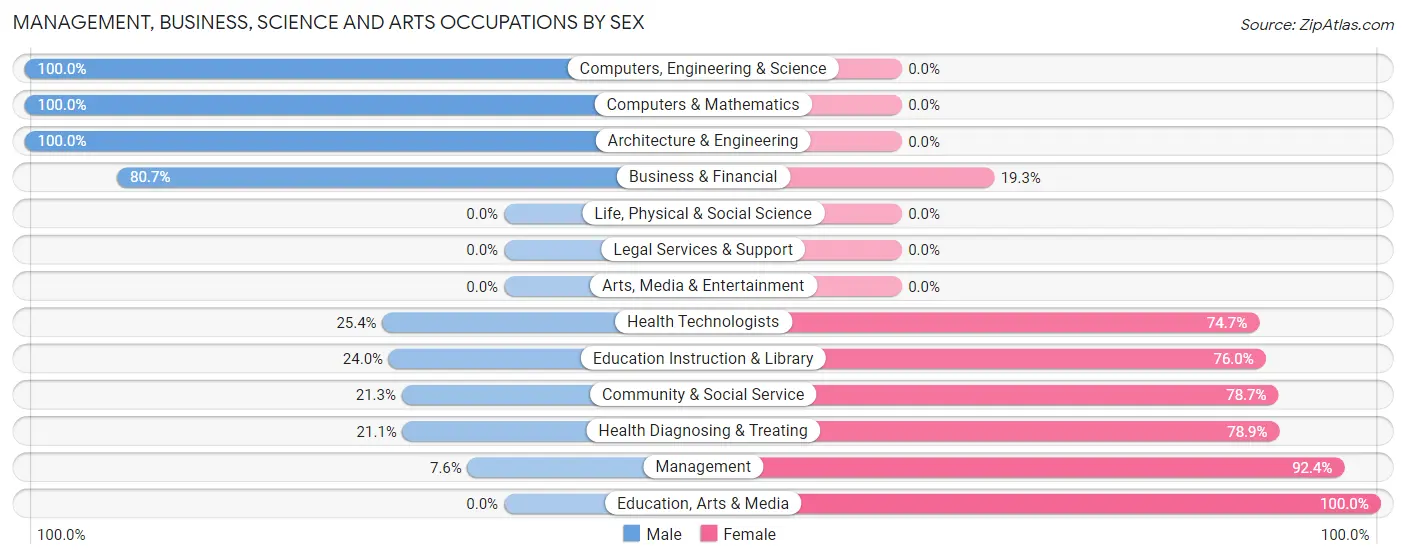
Management, Business, Science and Arts Occupations by Sex
Within the Management, Business, Science and Arts occupations in Verona, the most male-oriented occupations are Computers, Engineering & Science (100.0%), Computers & Mathematics (100.0%), and Architecture & Engineering (100.0%), while the most female-oriented occupations are Education, Arts & Media (100.0%), Management (92.4%), and Health Diagnosing & Treating (78.9%).
| Occupation | Male | Female |
| Management | 6 (7.6%) | 73 (92.4%) |
| Business & Financial | 46 (80.7%) | 11 (19.3%) |
| Computers, Engineering & Science | 39 (100.0%) | 0 (0.0%) |
| Computers & Mathematics | 29 (100.0%) | 0 (0.0%) |
| Architecture & Engineering | 10 (100.0%) | 0 (0.0%) |
| Life, Physical & Social Science | 0 (0.0%) | 0 (0.0%) |
| Community & Social Service | 42 (21.3%) | 155 (78.7%) |
| Education, Arts & Media | 0 (0.0%) | 22 (100.0%) |
| Legal Services & Support | 0 (0.0%) | 0 (0.0%) |
| Education Instruction & Library | 42 (24.0%) | 133 (76.0%) |
| Arts, Media & Entertainment | 0 (0.0%) | 0 (0.0%) |
| Health Diagnosing & Treating | 30 (21.1%) | 112 (78.9%) |
| Health Technologists | 18 (25.4%) | 53 (74.7%) |
| Total (Category) | 163 (31.7%) | 351 (68.3%) |
| Total (Overall) | 1,056 (53.9%) | 903 (46.1%) |
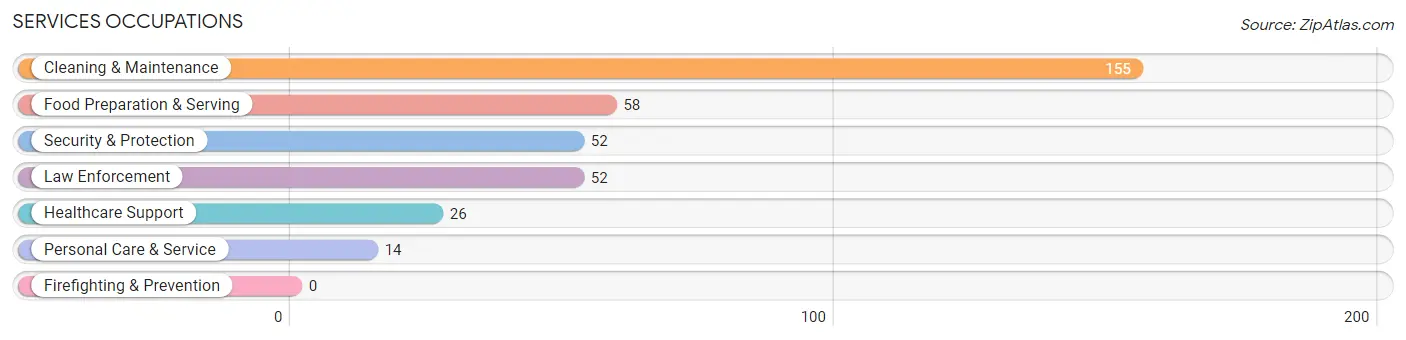
Services Occupations
The most common Services occupations in Verona are Cleaning & Maintenance (155 | 7.9%), Food Preparation & Serving (58 | 3.0%), Security & Protection (52 | 2.6%), Law Enforcement (52 | 2.6%), and Healthcare Support (26 | 1.3%).
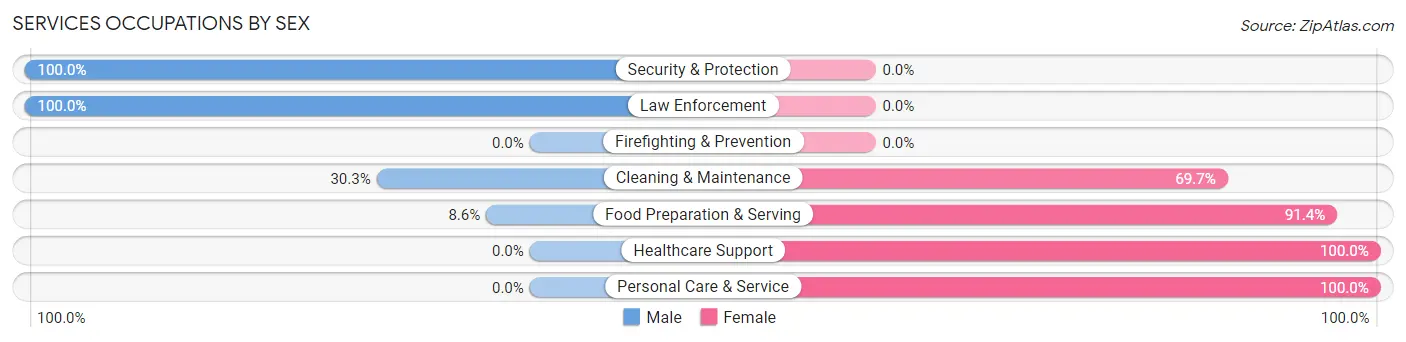
Services Occupations by Sex
Within the Services occupations in Verona, the most male-oriented occupations are Security & Protection (100.0%), Law Enforcement (100.0%), and Cleaning & Maintenance (30.3%), while the most female-oriented occupations are Healthcare Support (100.0%), Personal Care & Service (100.0%), and Food Preparation & Serving (91.4%).
| Occupation | Male | Female |
| Healthcare Support | 0 (0.0%) | 26 (100.0%) |
| Security & Protection | 52 (100.0%) | 0 (0.0%) |
| Firefighting & Prevention | 0 (0.0%) | 0 (0.0%) |
| Law Enforcement | 52 (100.0%) | 0 (0.0%) |
| Food Preparation & Serving | 5 (8.6%) | 53 (91.4%) |
| Cleaning & Maintenance | 47 (30.3%) | 108 (69.7%) |
| Personal Care & Service | 0 (0.0%) | 14 (100.0%) |
| Total (Category) | 104 (34.1%) | 201 (65.9%) |
| Total (Overall) | 1,056 (53.9%) | 903 (46.1%) |
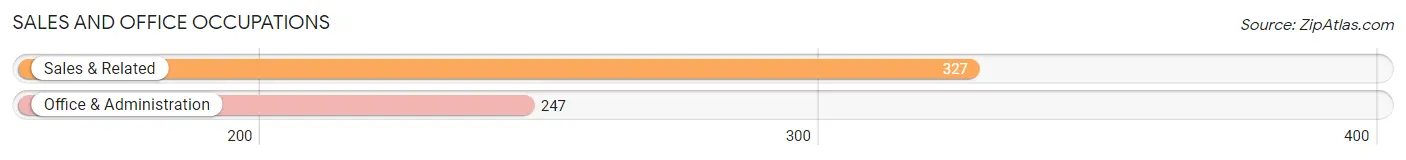
Sales and Office Occupations
The most common Sales and Office occupations in Verona are Sales & Related (327 | 16.7%), and Office & Administration (247 | 12.6%).
Sales and Office Occupations by Sex
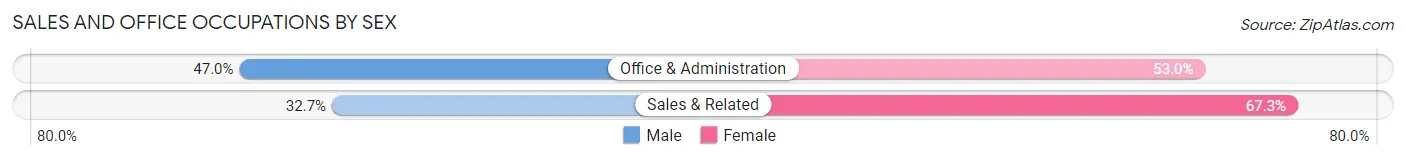
| Occupation | Male | Female |
| Sales & Related | 107 (32.7%) | 220 (67.3%) |
| Office & Administration | 116 (47.0%) | 131 (53.0%) |
| Total (Category) | 223 (38.9%) | 351 (61.2%) |
| Total (Overall) | 1,056 (53.9%) | 903 (46.1%) |
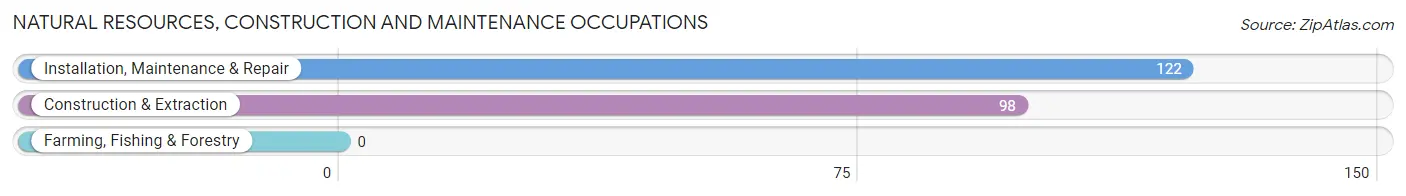
Natural Resources, Construction and Maintenance Occupations
The most common Natural Resources, Construction and Maintenance occupations in Verona are Installation, Maintenance & Repair (122 | 6.2%), and Construction & Extraction (98 | 5.0%).
Natural Resources, Construction and Maintenance Occupations by Sex
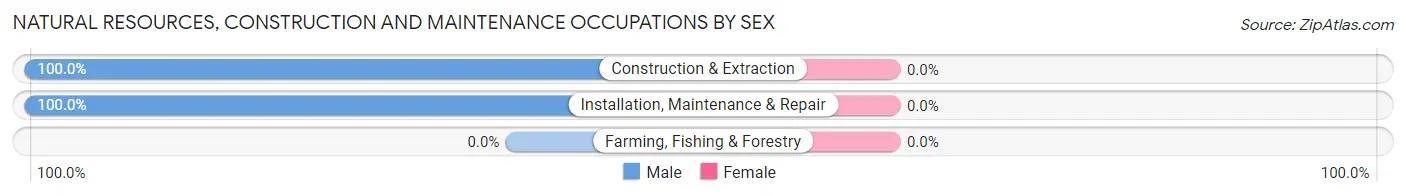
| Occupation | Male | Female |
| Farming, Fishing & Forestry | 0 (0.0%) | 0 (0.0%) |
| Construction & Extraction | 98 (100.0%) | 0 (0.0%) |
| Installation, Maintenance & Repair | 122 (100.0%) | 0 (0.0%) |
| Total (Category) | 220 (100.0%) | 0 (0.0%) |
| Total (Overall) | 1,056 (53.9%) | 903 (46.1%) |
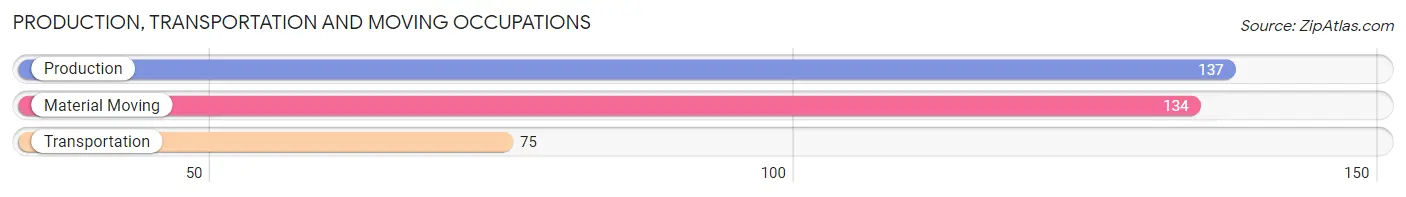
Production, Transportation and Moving Occupations
The most common Production, Transportation and Moving occupations in Verona are Production (137 | 7.0%), Material Moving (134 | 6.8%), and Transportation (75 | 3.8%).
Production, Transportation and Moving Occupations by Sex
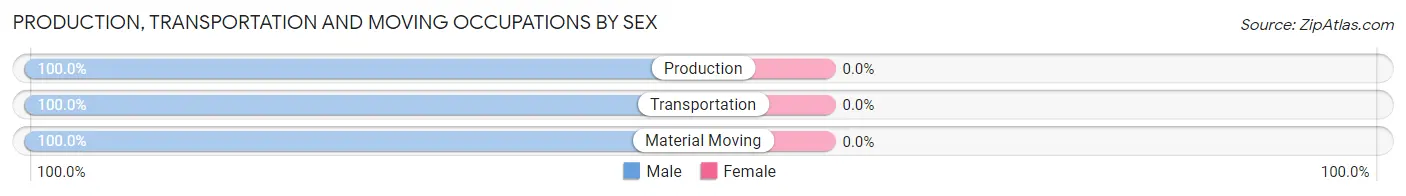
| Occupation | Male | Female |
| Production | 137 (100.0%) | 0 (0.0%) |
| Transportation | 75 (100.0%) | 0 (0.0%) |
| Material Moving | 134 (100.0%) | 0 (0.0%) |
| Total (Category) | 346 (100.0%) | 0 (0.0%) |
| Total (Overall) | 1,056 (53.9%) | 903 (46.1%) |
Employment Industries by Sex in Verona
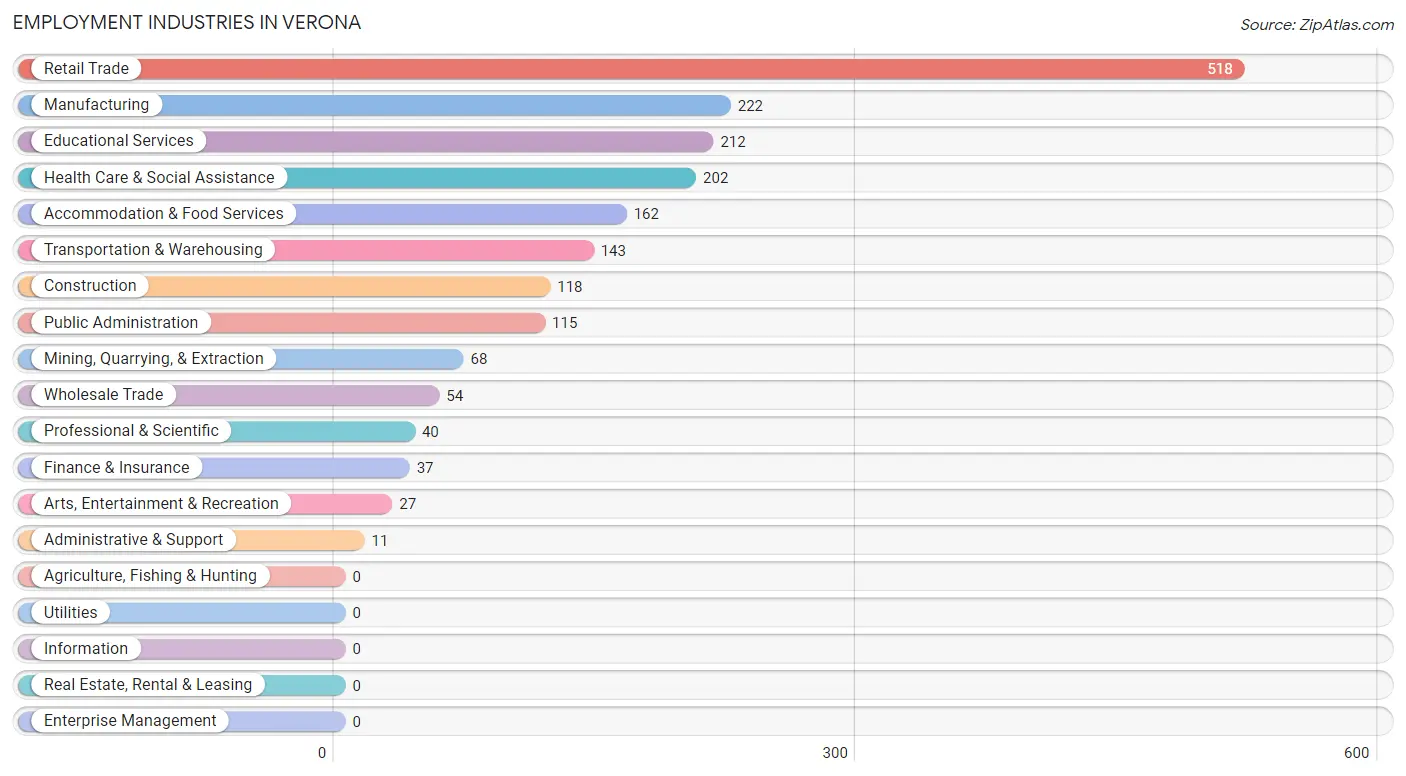
Employment Industries in Verona
The major employment industries in Verona include Retail Trade (518 | 26.4%), Manufacturing (222 | 11.3%), Educational Services (212 | 10.8%), Health Care & Social Assistance (202 | 10.3%), and Accommodation & Food Services (162 | 8.3%).
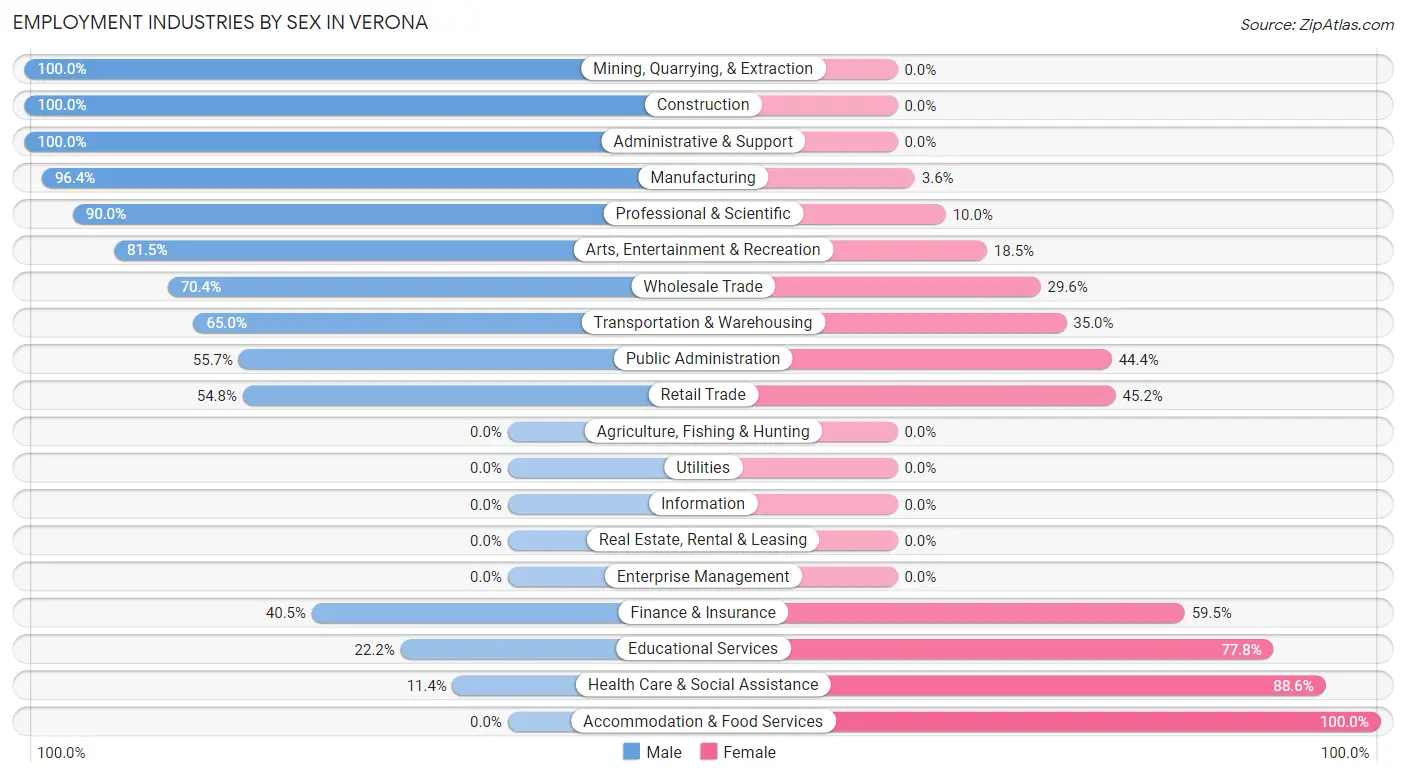
Employment Industries by Sex in Verona
The Verona industries that see more men than women are Mining, Quarrying, & Extraction (100.0%), Construction (100.0%), and Administrative & Support (100.0%), whereas the industries that tend to have a higher number of women are Accommodation & Food Services (100.0%), Health Care & Social Assistance (88.6%), and Educational Services (77.8%).
| Industry | Male | Female |
| Agriculture, Fishing & Hunting | 0 (0.0%) | 0 (0.0%) |
| Mining, Quarrying, & Extraction | 68 (100.0%) | 0 (0.0%) |
| Construction | 118 (100.0%) | 0 (0.0%) |
| Manufacturing | 214 (96.4%) | 8 (3.6%) |
| Wholesale Trade | 38 (70.4%) | 16 (29.6%) |
| Retail Trade | 284 (54.8%) | 234 (45.2%) |
| Transportation & Warehousing | 93 (65.0%) | 50 (35.0%) |
| Utilities | 0 (0.0%) | 0 (0.0%) |
| Information | 0 (0.0%) | 0 (0.0%) |
| Finance & Insurance | 15 (40.5%) | 22 (59.5%) |
| Real Estate, Rental & Leasing | 0 (0.0%) | 0 (0.0%) |
| Professional & Scientific | 36 (90.0%) | 4 (10.0%) |
| Enterprise Management | 0 (0.0%) | 0 (0.0%) |
| Administrative & Support | 11 (100.0%) | 0 (0.0%) |
| Educational Services | 47 (22.2%) | 165 (77.8%) |
| Health Care & Social Assistance | 23 (11.4%) | 179 (88.6%) |
| Arts, Entertainment & Recreation | 22 (81.5%) | 5 (18.5%) |
| Accommodation & Food Services | 0 (0.0%) | 162 (100.0%) |
| Public Administration | 64 (55.6%) | 51 (44.4%) |
| Total | 1,056 (53.9%) | 903 (46.1%) |
Education in Verona
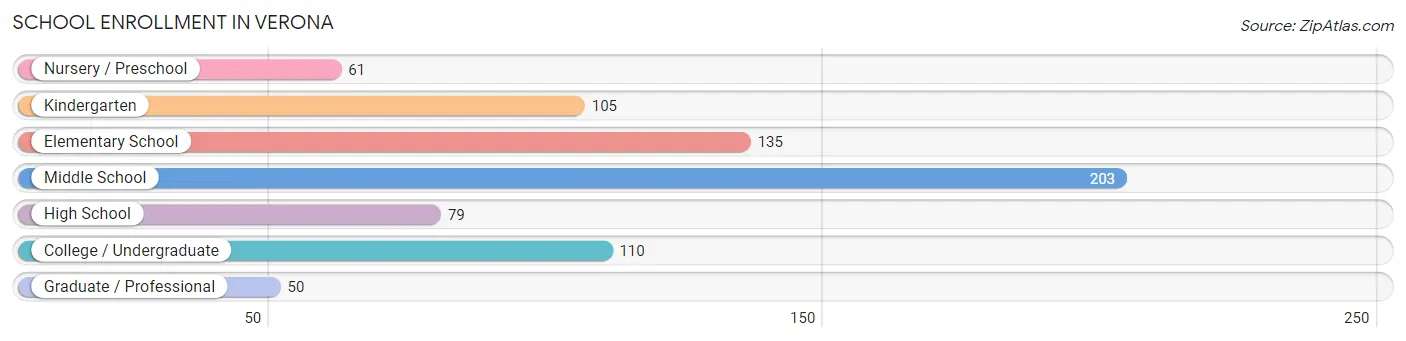
School Enrollment in Verona
The most common levels of schooling among the 743 students in Verona are middle school (203 | 27.3%), elementary school (135 | 18.2%), and college / undergraduate (110 | 14.8%).
| School Level | # Students | % Students |
| Nursery / Preschool | 61 | 8.2% |
| Kindergarten | 105 | 14.1% |
| Elementary School | 135 | 18.2% |
| Middle School | 203 | 27.3% |
| High School | 79 | 10.6% |
| College / Undergraduate | 110 | 14.8% |
| Graduate / Professional | 50 | 6.7% |
| Total | 743 | 100.0% |
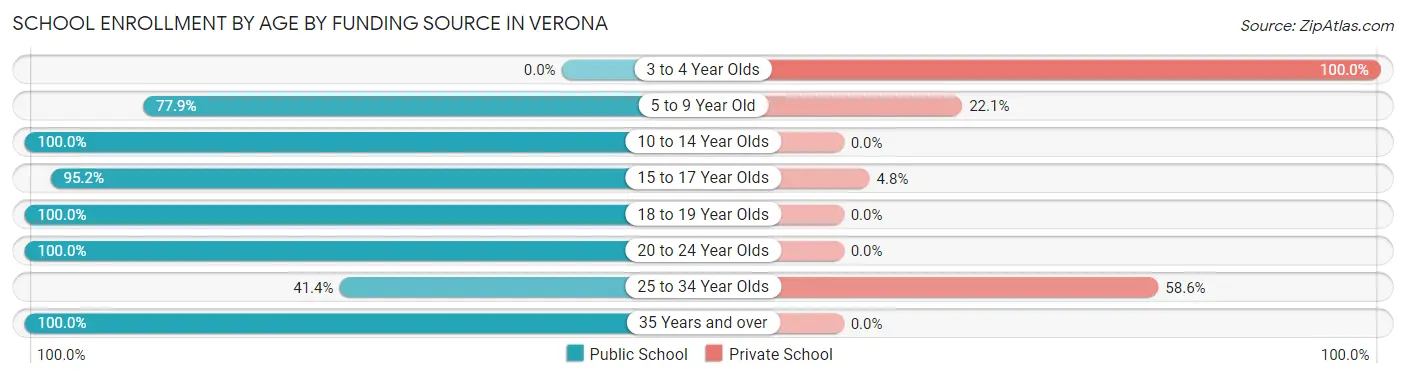
School Enrollment by Age by Funding Source in Verona
Out of a total of 743 students who are enrolled in schools in Verona, 134 (18.0%) attend a private institution, while the remaining 609 (82.0%) are enrolled in public schools. The age group of 3 to 4 year olds has the highest likelihood of being enrolled in private schools, with 61 (100.0% in the age bracket) enrolled. Conversely, the age group of 10 to 14 year olds has the lowest likelihood of being enrolled in a private school, with 220 (100.0% in the age bracket) attending a public institution.
| Age Bracket | Public School | Private School |
| 3 to 4 Year Olds | 0 (0.0%) | 61 (100.0%) |
| 5 to 9 Year Old | 187 (77.9%) | 53 (22.1%) |
| 10 to 14 Year Olds | 220 (100.0%) | 0 (0.0%) |
| 15 to 17 Year Olds | 59 (95.2%) | 3 (4.8%) |
| 18 to 19 Year Olds | 47 (100.0%) | 0 (0.0%) |
| 20 to 24 Year Olds | 22 (100.0%) | 0 (0.0%) |
| 25 to 34 Year Olds | 12 (41.4%) | 17 (58.6%) |
| 35 Years and over | 62 (100.0%) | 0 (0.0%) |
| Total | 609 (82.0%) | 134 (18.0%) |
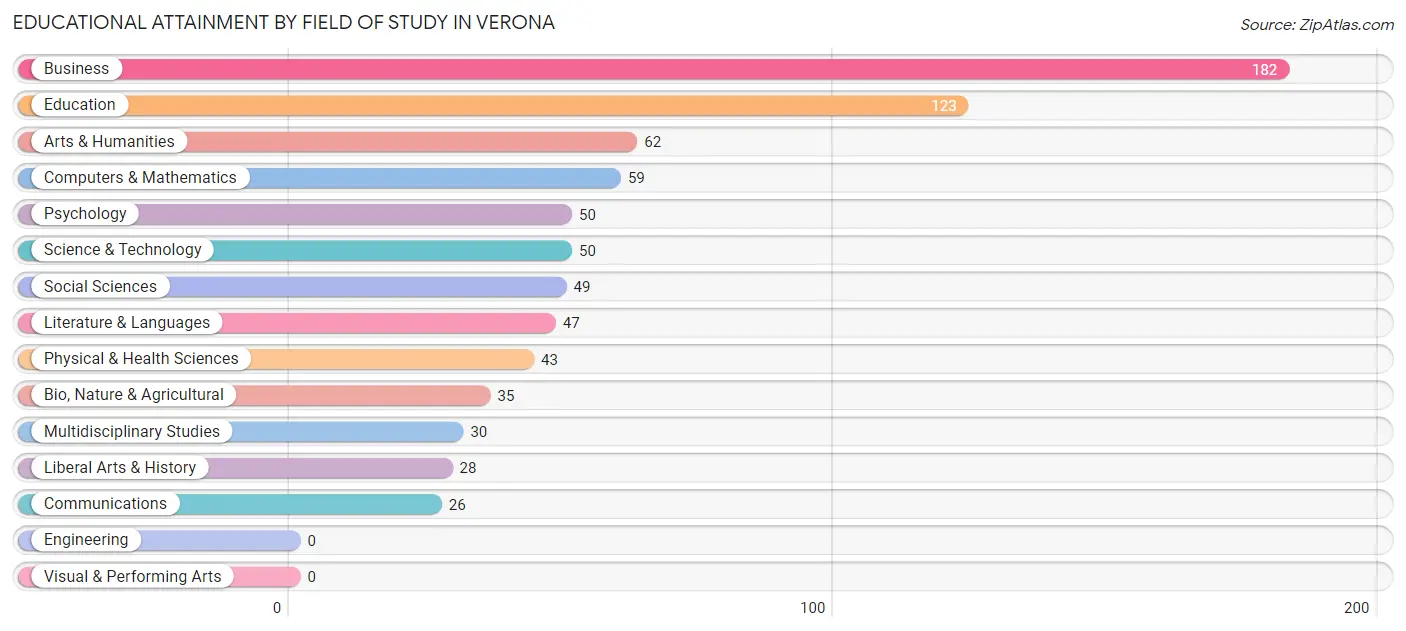
Educational Attainment by Field of Study in Verona
Business (182 | 23.2%), education (123 | 15.7%), arts & humanities (62 | 7.9%), computers & mathematics (59 | 7.5%), and psychology (50 | 6.4%) are the most common fields of study among 784 individuals in Verona who have obtained a bachelor's degree or higher.
| Field of Study | # Graduates | % Graduates |
| Computers & Mathematics | 59 | 7.5% |
| Bio, Nature & Agricultural | 35 | 4.5% |
| Physical & Health Sciences | 43 | 5.5% |
| Psychology | 50 | 6.4% |
| Social Sciences | 49 | 6.2% |
| Engineering | 0 | 0.0% |
| Multidisciplinary Studies | 30 | 3.8% |
| Science & Technology | 50 | 6.4% |
| Business | 182 | 23.2% |
| Education | 123 | 15.7% |
| Literature & Languages | 47 | 6.0% |
| Liberal Arts & History | 28 | 3.6% |
| Visual & Performing Arts | 0 | 0.0% |
| Communications | 26 | 3.3% |
| Arts & Humanities | 62 | 7.9% |
| Total | 784 | 100.0% |
Transportation & Commute in Verona
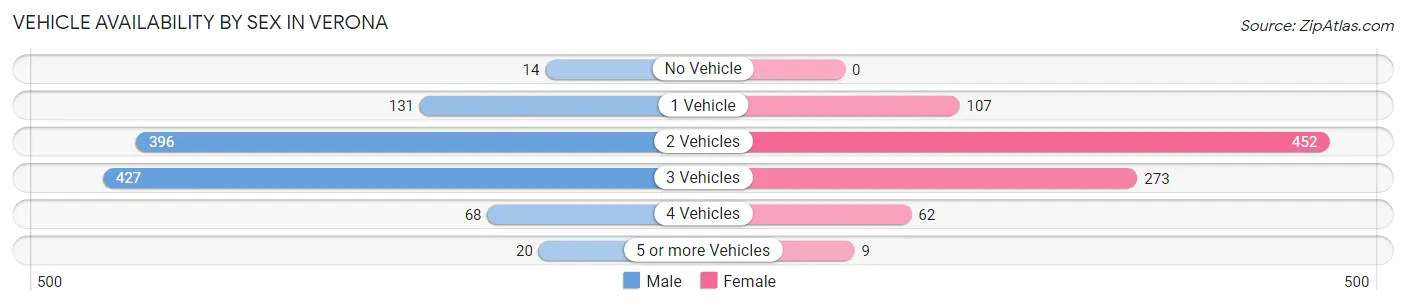
Vehicle Availability by Sex in Verona
The most prevalent vehicle ownership categories in Verona are males with 3 vehicles (427, accounting for 40.4%) and females with 3 vehicles (273, making up 47.3%).
| Vehicles Available | Male | Female |
| No Vehicle | 14 (1.3%) | 0 (0.0%) |
| 1 Vehicle | 131 (12.4%) | 107 (11.8%) |
| 2 Vehicles | 396 (37.5%) | 452 (50.1%) |
| 3 Vehicles | 427 (40.4%) | 273 (30.2%) |
| 4 Vehicles | 68 (6.4%) | 62 (6.9%) |
| 5 or more Vehicles | 20 (1.9%) | 9 (1.0%) |
| Total | 1,056 (100.0%) | 903 (100.0%) |
Commute Time in Verona
The most frequently occuring commute durations in Verona are 10 to 14 minutes (430 commuters, 22.6%), 15 to 19 minutes (390 commuters, 20.5%), and 20 to 24 minutes (304 commuters, 16.0%).
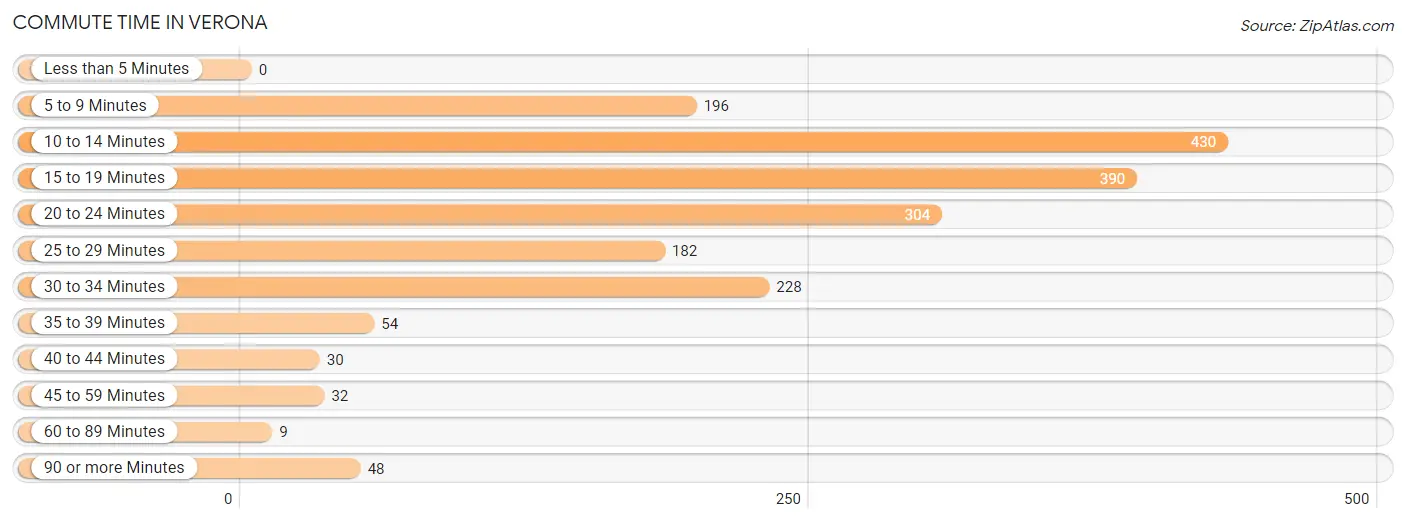
| Commute Time | # Commuters | % Commuters |
| Less than 5 Minutes | 0 | 0.0% |
| 5 to 9 Minutes | 196 | 10.3% |
| 10 to 14 Minutes | 430 | 22.6% |
| 15 to 19 Minutes | 390 | 20.5% |
| 20 to 24 Minutes | 304 | 16.0% |
| 25 to 29 Minutes | 182 | 9.6% |
| 30 to 34 Minutes | 228 | 12.0% |
| 35 to 39 Minutes | 54 | 2.8% |
| 40 to 44 Minutes | 30 | 1.6% |
| 45 to 59 Minutes | 32 | 1.7% |
| 60 to 89 Minutes | 9 | 0.5% |
| 90 or more Minutes | 48 | 2.5% |
Commute Time by Sex in Verona
The most common commute times in Verona are 15 to 19 minutes (273 commuters, 26.7%) for males and 10 to 14 minutes (163 commuters, 18.5%) for females.
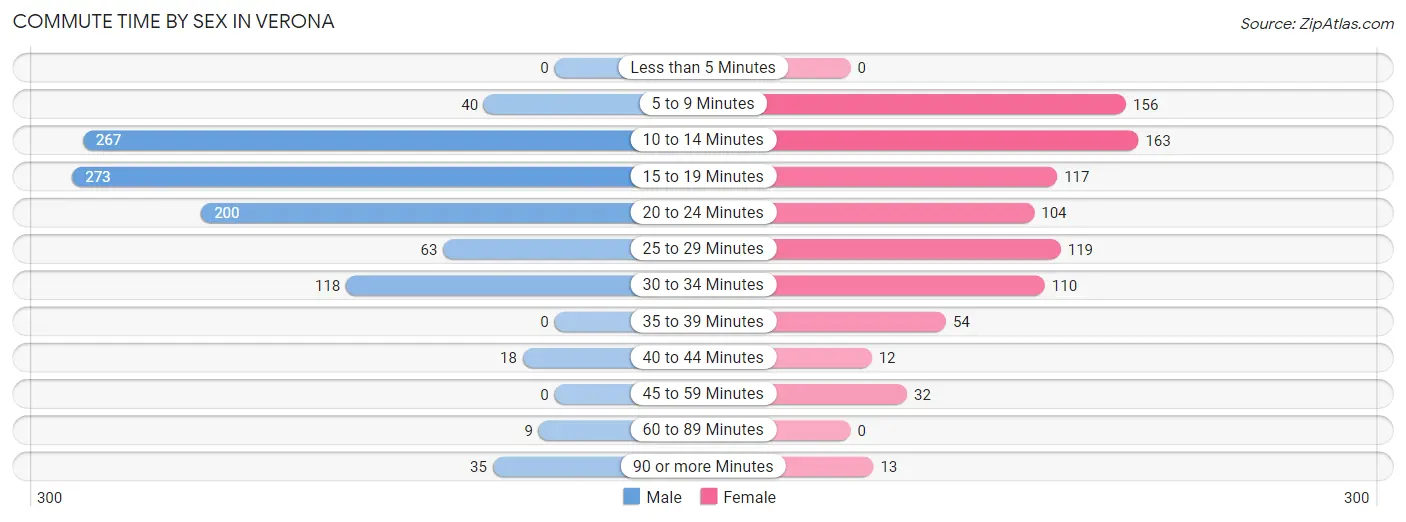
| Commute Time | Male | Female |
| Less than 5 Minutes | 0 (0.0%) | 0 (0.0%) |
| 5 to 9 Minutes | 40 (3.9%) | 156 (17.7%) |
| 10 to 14 Minutes | 267 (26.1%) | 163 (18.5%) |
| 15 to 19 Minutes | 273 (26.7%) | 117 (13.3%) |
| 20 to 24 Minutes | 200 (19.6%) | 104 (11.8%) |
| 25 to 29 Minutes | 63 (6.2%) | 119 (13.5%) |
| 30 to 34 Minutes | 118 (11.5%) | 110 (12.5%) |
| 35 to 39 Minutes | 0 (0.0%) | 54 (6.1%) |
| 40 to 44 Minutes | 18 (1.8%) | 12 (1.4%) |
| 45 to 59 Minutes | 0 (0.0%) | 32 (3.6%) |
| 60 to 89 Minutes | 9 (0.9%) | 0 (0.0%) |
| 90 or more Minutes | 35 (3.4%) | 13 (1.5%) |
Time of Departure to Work by Sex in Verona
The most frequent times of departure to work in Verona are 7:00 AM to 7:29 AM (193, 18.9%) for males and 7:30 AM to 7:59 AM (191, 21.7%) for females.
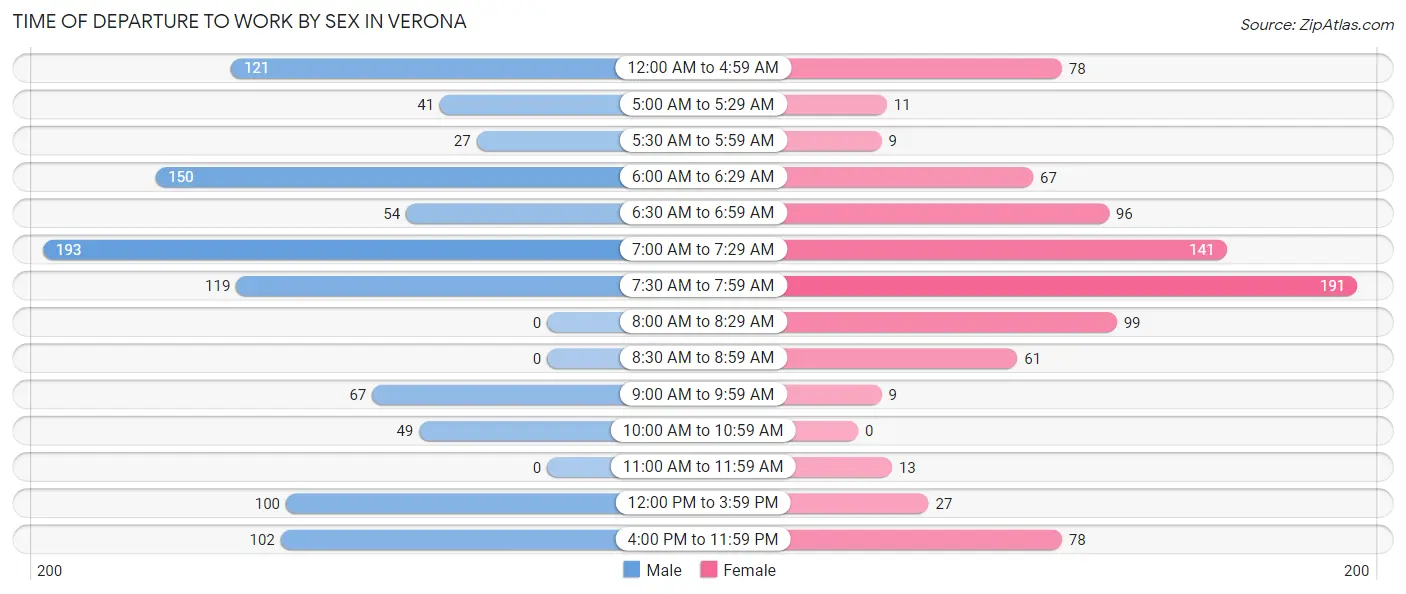
| Time of Departure | Male | Female |
| 12:00 AM to 4:59 AM | 121 (11.8%) | 78 (8.9%) |
| 5:00 AM to 5:29 AM | 41 (4.0%) | 11 (1.3%) |
| 5:30 AM to 5:59 AM | 27 (2.6%) | 9 (1.0%) |
| 6:00 AM to 6:29 AM | 150 (14.7%) | 67 (7.6%) |
| 6:30 AM to 6:59 AM | 54 (5.3%) | 96 (10.9%) |
| 7:00 AM to 7:29 AM | 193 (18.9%) | 141 (16.0%) |
| 7:30 AM to 7:59 AM | 119 (11.6%) | 191 (21.7%) |
| 8:00 AM to 8:29 AM | 0 (0.0%) | 99 (11.3%) |
| 8:30 AM to 8:59 AM | 0 (0.0%) | 61 (6.9%) |
| 9:00 AM to 9:59 AM | 67 (6.6%) | 9 (1.0%) |
| 10:00 AM to 10:59 AM | 49 (4.8%) | 0 (0.0%) |
| 11:00 AM to 11:59 AM | 0 (0.0%) | 13 (1.5%) |
| 12:00 PM to 3:59 PM | 100 (9.8%) | 27 (3.1%) |
| 4:00 PM to 11:59 PM | 102 (10.0%) | 78 (8.9%) |
| Total | 1,023 (100.0%) | 880 (100.0%) |
Housing Occupancy in Verona
Occupancy by Ownership in Verona
Of the total 1,587 dwellings in Verona, owner-occupied units account for 1,205 (75.9%), while renter-occupied units make up 382 (24.1%).
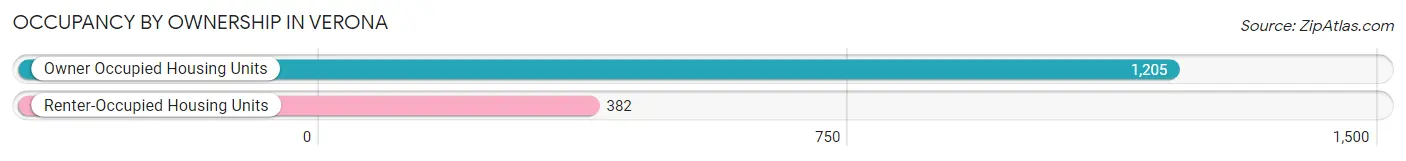
| Occupancy | # Housing Units | % Housing Units |
| Owner Occupied Housing Units | 1,205 | 75.9% |
| Renter-Occupied Housing Units | 382 | 24.1% |
| Total Occupied Housing Units | 1,587 | 100.0% |
Occupancy by Household Size in Verona
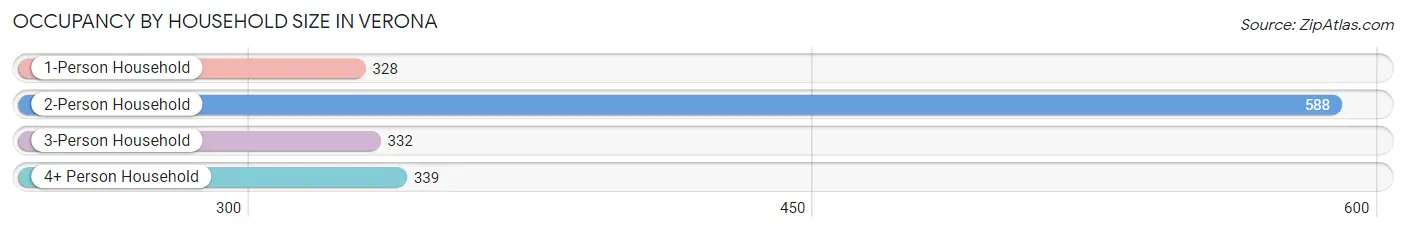
| Household Size | # Housing Units | % Housing Units |
| 1-Person Household | 328 | 20.7% |
| 2-Person Household | 588 | 37.0% |
| 3-Person Household | 332 | 20.9% |
| 4+ Person Household | 339 | 21.4% |
| Total Housing Units | 1,587 | 100.0% |
Occupancy by Ownership by Household Size in Verona
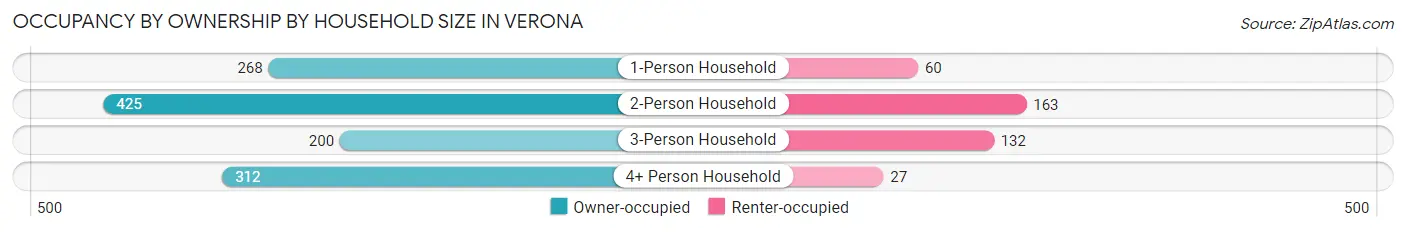
| Household Size | Owner-occupied | Renter-occupied |
| 1-Person Household | 268 (81.7%) | 60 (18.3%) |
| 2-Person Household | 425 (72.3%) | 163 (27.7%) |
| 3-Person Household | 200 (60.2%) | 132 (39.8%) |
| 4+ Person Household | 312 (92.0%) | 27 (8.0%) |
| Total Housing Units | 1,205 (75.9%) | 382 (24.1%) |
Occupancy by Educational Attainment in Verona
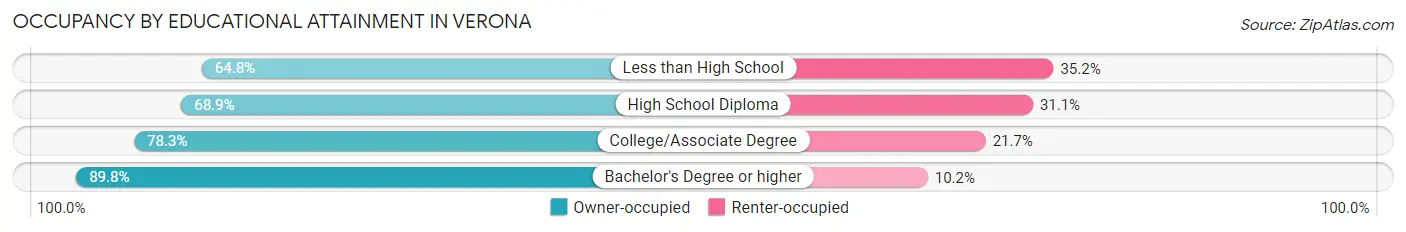
| Household Size | Owner-occupied | Renter-occupied |
| Less than High School | 118 (64.8%) | 64 (35.2%) |
| High School Diploma | 408 (68.9%) | 184 (31.1%) |
| College/Associate Degree | 346 (78.3%) | 96 (21.7%) |
| Bachelor's Degree or higher | 333 (89.8%) | 38 (10.2%) |
Occupancy by Age of Householder in Verona
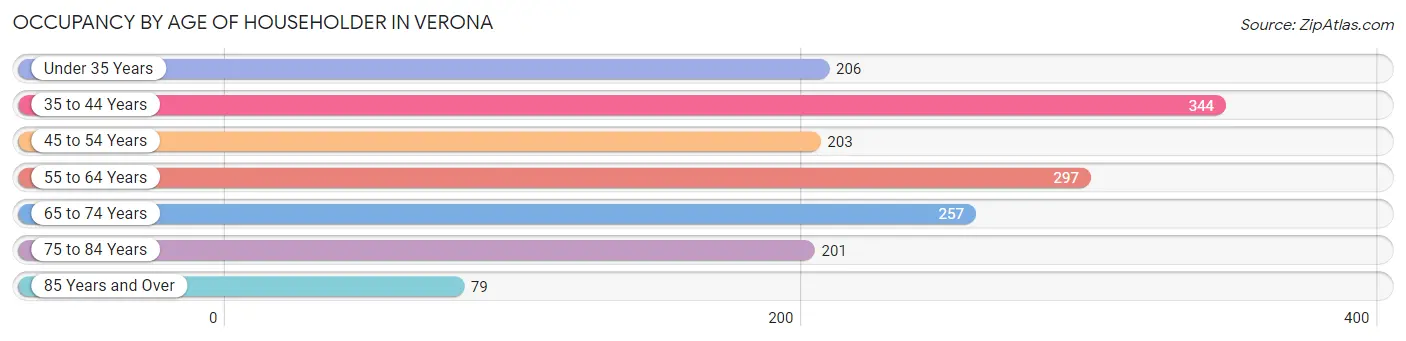
| Age Bracket | # Households | % Households |
| Under 35 Years | 206 | 13.0% |
| 35 to 44 Years | 344 | 21.7% |
| 45 to 54 Years | 203 | 12.8% |
| 55 to 64 Years | 297 | 18.7% |
| 65 to 74 Years | 257 | 16.2% |
| 75 to 84 Years | 201 | 12.7% |
| 85 Years and Over | 79 | 5.0% |
| Total | 1,587 | 100.0% |
Housing Finances in Verona
Median Income by Occupancy in Verona
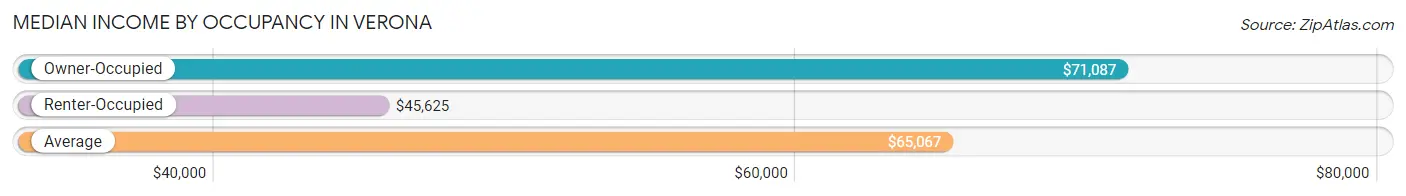
| Occupancy Type | # Households | Median Income |
| Owner-Occupied | 1,205 (75.9%) | $71,087 |
| Renter-Occupied | 382 (24.1%) | $45,625 |
| Average | 1,587 (100.0%) | $65,067 |
Occupancy by Householder Income Bracket in Verona
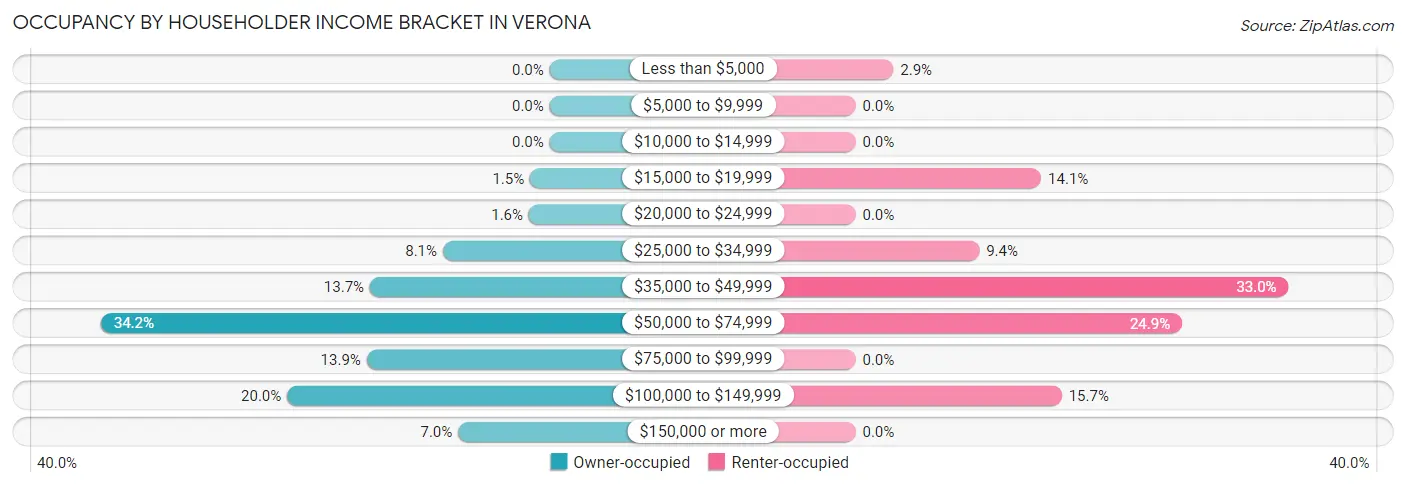
| Income Bracket | Owner-occupied | Renter-occupied |
| Less than $5,000 | 0 (0.0%) | 11 (2.9%) |
| $5,000 to $9,999 | 0 (0.0%) | 0 (0.0%) |
| $10,000 to $14,999 | 0 (0.0%) | 0 (0.0%) |
| $15,000 to $19,999 | 18 (1.5%) | 54 (14.1%) |
| $20,000 to $24,999 | 19 (1.6%) | 0 (0.0%) |
| $25,000 to $34,999 | 98 (8.1%) | 36 (9.4%) |
| $35,000 to $49,999 | 165 (13.7%) | 126 (33.0%) |
| $50,000 to $74,999 | 412 (34.2%) | 95 (24.9%) |
| $75,000 to $99,999 | 168 (13.9%) | 0 (0.0%) |
| $100,000 to $149,999 | 241 (20.0%) | 60 (15.7%) |
| $150,000 or more | 84 (7.0%) | 0 (0.0%) |
| Total | 1,205 (100.0%) | 382 (100.0%) |
Monthly Housing Cost Tiers in Verona
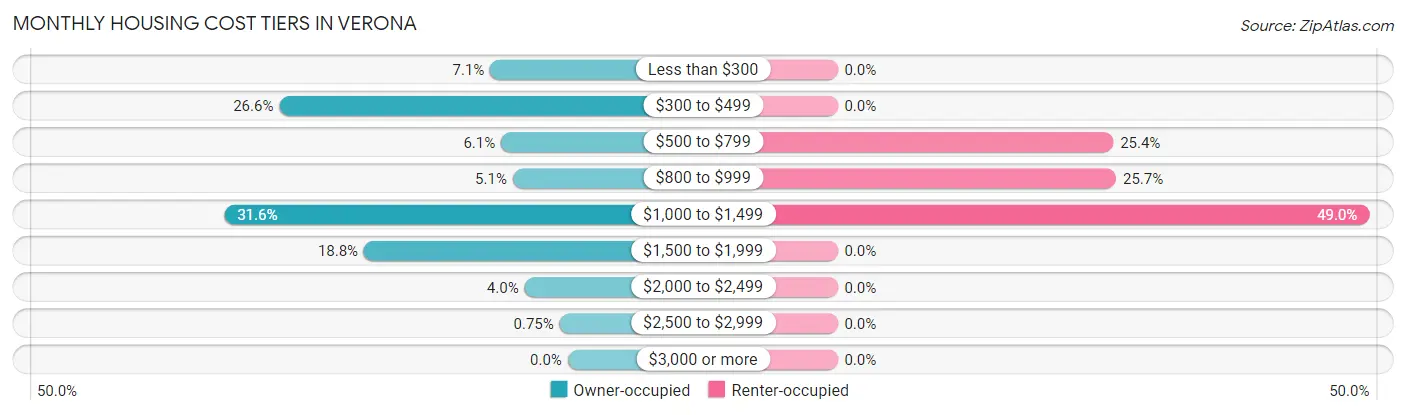
| Monthly Cost | Owner-occupied | Renter-occupied |
| Less than $300 | 86 (7.1%) | 0 (0.0%) |
| $300 to $499 | 320 (26.6%) | 0 (0.0%) |
| $500 to $799 | 74 (6.1%) | 97 (25.4%) |
| $800 to $999 | 61 (5.1%) | 98 (25.7%) |
| $1,000 to $1,499 | 381 (31.6%) | 187 (48.9%) |
| $1,500 to $1,999 | 226 (18.8%) | 0 (0.0%) |
| $2,000 to $2,499 | 48 (4.0%) | 0 (0.0%) |
| $2,500 to $2,999 | 9 (0.7%) | 0 (0.0%) |
| $3,000 or more | 0 (0.0%) | 0 (0.0%) |
| Total | 1,205 (100.0%) | 382 (100.0%) |
Physical Housing Characteristics in Verona
Housing Structures in Verona
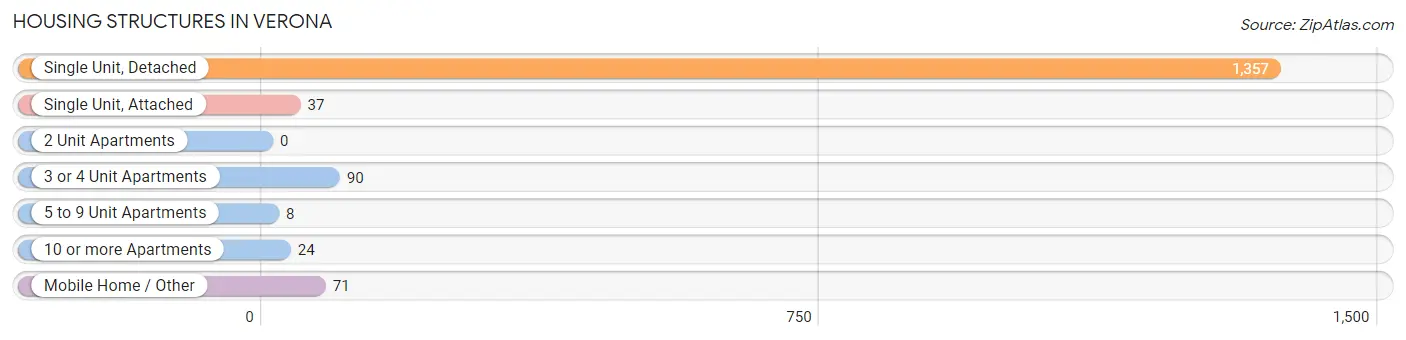
| Structure Type | # Housing Units | % Housing Units |
| Single Unit, Detached | 1,357 | 85.5% |
| Single Unit, Attached | 37 | 2.3% |
| 2 Unit Apartments | 0 | 0.0% |
| 3 or 4 Unit Apartments | 90 | 5.7% |
| 5 to 9 Unit Apartments | 8 | 0.5% |
| 10 or more Apartments | 24 | 1.5% |
| Mobile Home / Other | 71 | 4.5% |
| Total | 1,587 | 100.0% |
Housing Structures by Occupancy in Verona
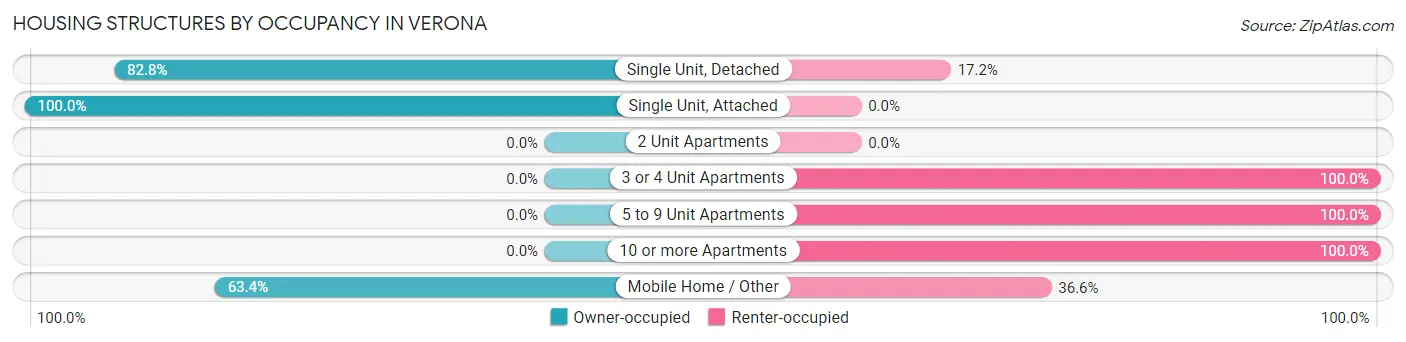
| Structure Type | Owner-occupied | Renter-occupied |
| Single Unit, Detached | 1,123 (82.8%) | 234 (17.2%) |
| Single Unit, Attached | 37 (100.0%) | 0 (0.0%) |
| 2 Unit Apartments | 0 (0.0%) | 0 (0.0%) |
| 3 or 4 Unit Apartments | 0 (0.0%) | 90 (100.0%) |
| 5 to 9 Unit Apartments | 0 (0.0%) | 8 (100.0%) |
| 10 or more Apartments | 0 (0.0%) | 24 (100.0%) |
| Mobile Home / Other | 45 (63.4%) | 26 (36.6%) |
| Total | 1,205 (75.9%) | 382 (24.1%) |
Housing Structures by Number of Rooms in Verona
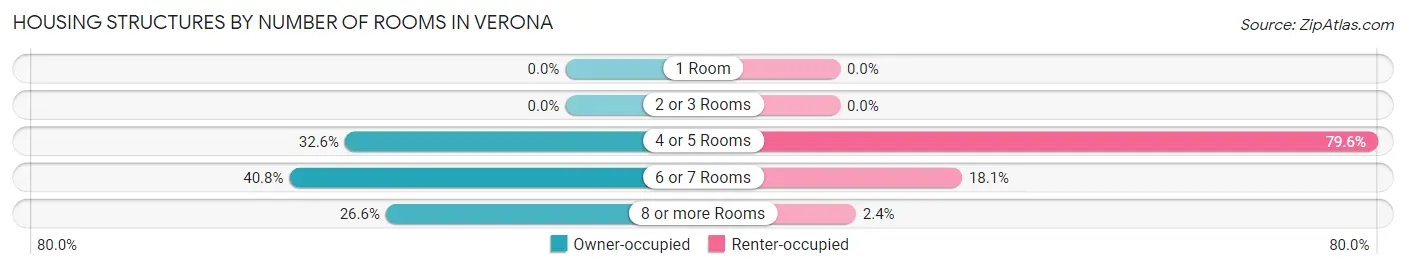
| Number of Rooms | Owner-occupied | Renter-occupied |
| 1 Room | 0 (0.0%) | 0 (0.0%) |
| 2 or 3 Rooms | 0 (0.0%) | 0 (0.0%) |
| 4 or 5 Rooms | 393 (32.6%) | 304 (79.6%) |
| 6 or 7 Rooms | 492 (40.8%) | 69 (18.1%) |
| 8 or more Rooms | 320 (26.6%) | 9 (2.4%) |
| Total | 1,205 (100.0%) | 382 (100.0%) |
Housing Structure by Heating Type in Verona
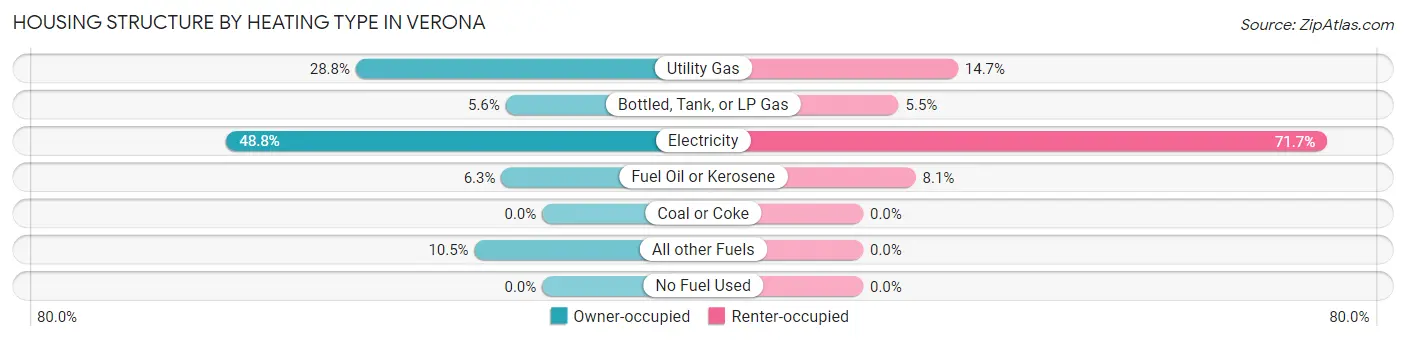
| Heating Type | Owner-occupied | Renter-occupied |
| Utility Gas | 347 (28.8%) | 56 (14.7%) |
| Bottled, Tank, or LP Gas | 68 (5.6%) | 21 (5.5%) |
| Electricity | 588 (48.8%) | 274 (71.7%) |
| Fuel Oil or Kerosene | 76 (6.3%) | 31 (8.1%) |
| Coal or Coke | 0 (0.0%) | 0 (0.0%) |
| All other Fuels | 126 (10.5%) | 0 (0.0%) |
| No Fuel Used | 0 (0.0%) | 0 (0.0%) |
| Total | 1,205 (100.0%) | 382 (100.0%) |
Household Vehicle Usage in Verona
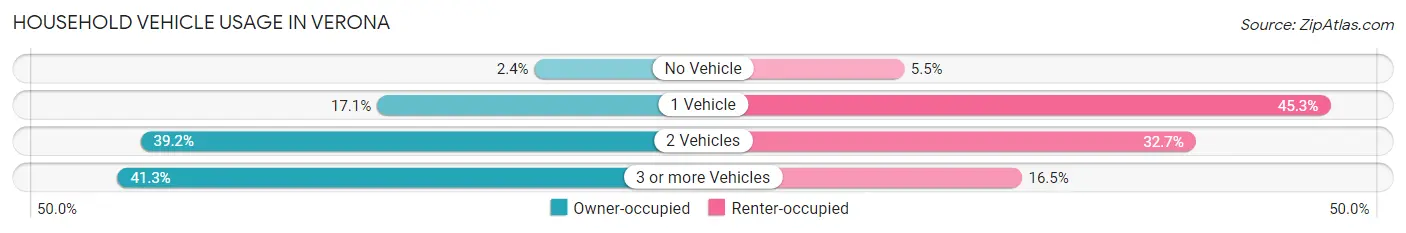
| Vehicles per Household | Owner-occupied | Renter-occupied |
| No Vehicle | 29 (2.4%) | 21 (5.5%) |
| 1 Vehicle | 206 (17.1%) | 173 (45.3%) |
| 2 Vehicles | 472 (39.2%) | 125 (32.7%) |
| 3 or more Vehicles | 498 (41.3%) | 63 (16.5%) |
| Total | 1,205 (100.0%) | 382 (100.0%) |
Real Estate & Mortgages in Verona
Real Estate and Mortgage Overview in Verona
| Characteristic | Without Mortgage | With Mortgage |
| Housing Units | 459 | 746 |
| Median Property Value | $219,200 | $208,000 |
| Median Household Income | $57,589 | $37 |
| Monthly Housing Costs | $351 | $0 |
| Real Estate Taxes | $923 | $18 |
Property Value by Mortgage Status in Verona
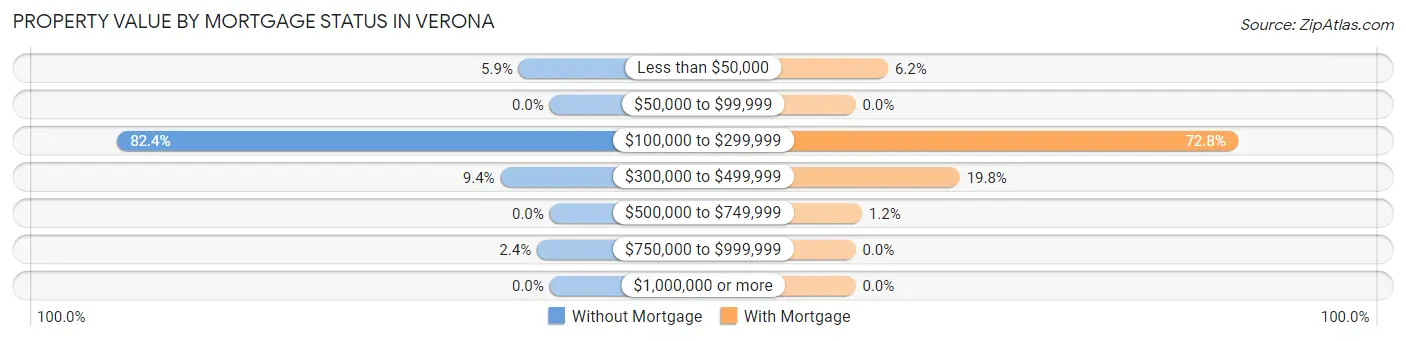
| Property Value | Without Mortgage | With Mortgage |
| Less than $50,000 | 27 (5.9%) | 46 (6.2%) |
| $50,000 to $99,999 | 0 (0.0%) | 0 (0.0%) |
| $100,000 to $299,999 | 378 (82.4%) | 543 (72.8%) |
| $300,000 to $499,999 | 43 (9.4%) | 148 (19.8%) |
| $500,000 to $749,999 | 0 (0.0%) | 9 (1.2%) |
| $750,000 to $999,999 | 11 (2.4%) | 0 (0.0%) |
| $1,000,000 or more | 0 (0.0%) | 0 (0.0%) |
| Total | 459 (100.0%) | 746 (100.0%) |
Household Income by Mortgage Status in Verona
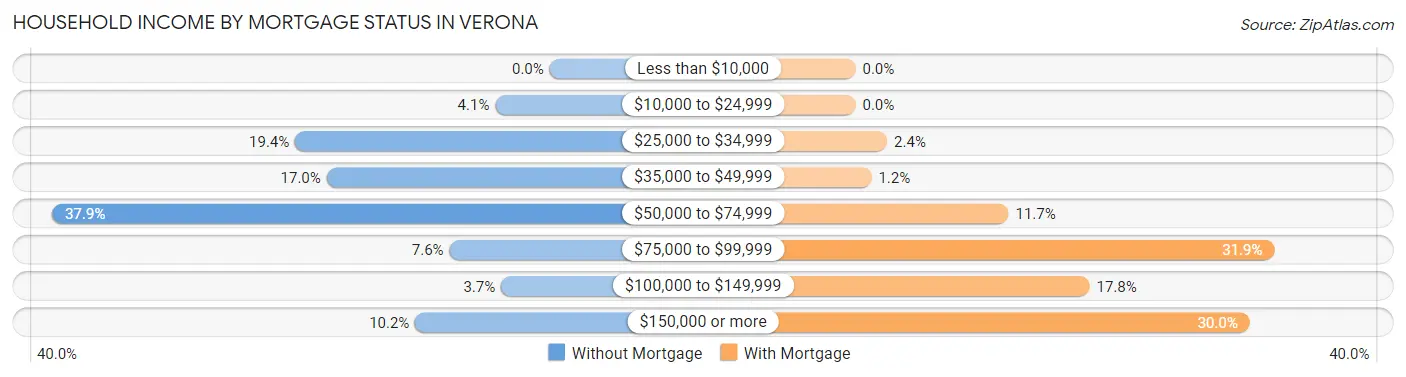
| Household Income | Without Mortgage | With Mortgage |
| Less than $10,000 | 0 (0.0%) | 0 (0.0%) |
| $10,000 to $24,999 | 19 (4.1%) | 0 (0.0%) |
| $25,000 to $34,999 | 89 (19.4%) | 18 (2.4%) |
| $35,000 to $49,999 | 78 (17.0%) | 9 (1.2%) |
| $50,000 to $74,999 | 174 (37.9%) | 87 (11.7%) |
| $75,000 to $99,999 | 35 (7.6%) | 238 (31.9%) |
| $100,000 to $149,999 | 17 (3.7%) | 133 (17.8%) |
| $150,000 or more | 47 (10.2%) | 224 (30.0%) |
| Total | 459 (100.0%) | 746 (100.0%) |
Property Value to Household Income Ratio in Verona
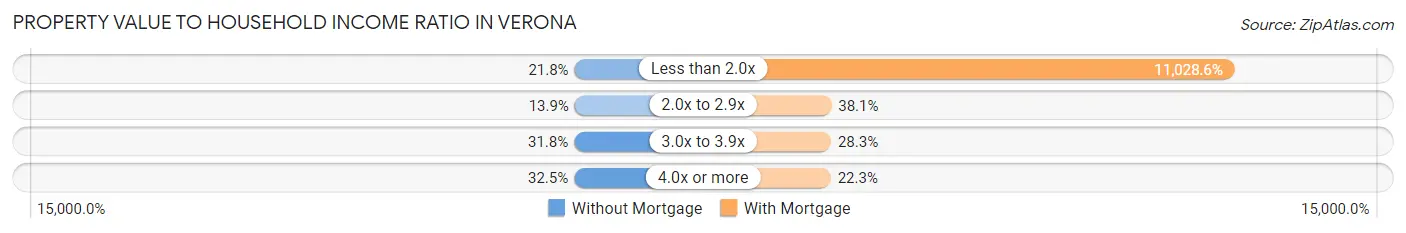
| Value-to-Income Ratio | Without Mortgage | With Mortgage |
| Less than 2.0x | 100 (21.8%) | 82,273 (11,028.5%) |
| 2.0x to 2.9x | 64 (13.9%) | 284 (38.1%) |
| 3.0x to 3.9x | 146 (31.8%) | 211 (28.3%) |
| 4.0x or more | 149 (32.5%) | 166 (22.3%) |
| Total | 459 (100.0%) | 746 (100.0%) |
Real Estate Taxes by Mortgage Status in Verona
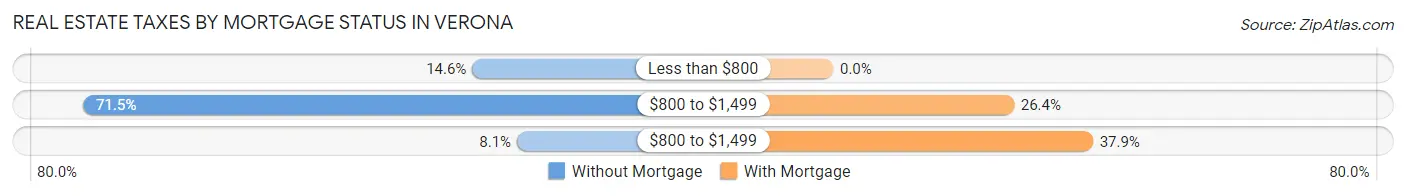
| Property Taxes | Without Mortgage | With Mortgage |
| Less than $800 | 67 (14.6%) | 0 (0.0%) |
| $800 to $1,499 | 328 (71.5%) | 197 (26.4%) |
| $800 to $1,499 | 37 (8.1%) | 283 (37.9%) |
| Total | 459 (100.0%) | 746 (100.0%) |
Health & Disability in Verona
Health Insurance Coverage by Age in Verona
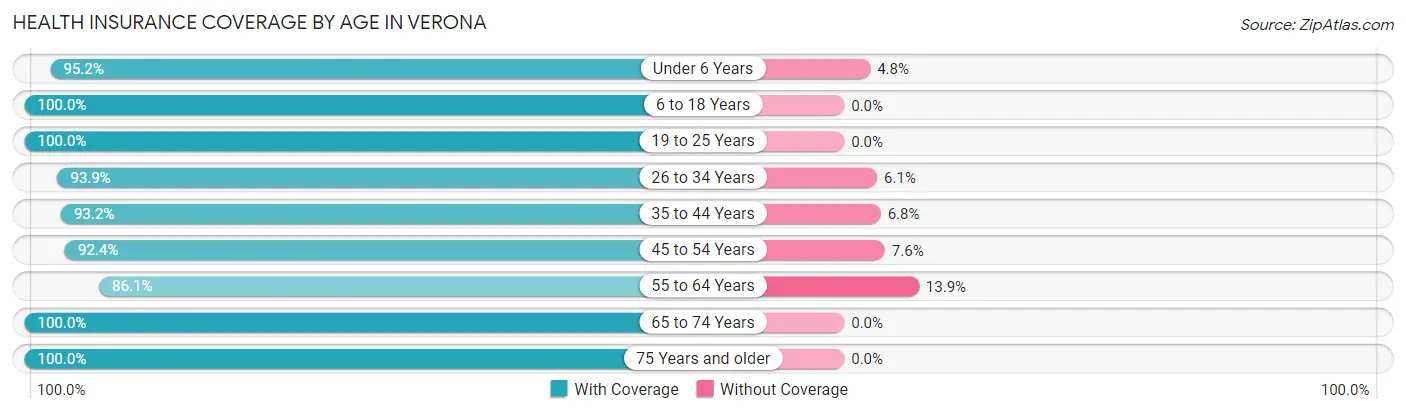
| Age Bracket | With Coverage | Without Coverage |
| Under 6 Years | 355 (95.2%) | 18 (4.8%) |
| 6 to 18 Years | 433 (100.0%) | 0 (0.0%) |
| 19 to 25 Years | 305 (100.0%) | 0 (0.0%) |
| 26 to 34 Years | 245 (93.9%) | 16 (6.1%) |
| 35 to 44 Years | 577 (93.2%) | 42 (6.8%) |
| 45 to 54 Years | 415 (92.4%) | 34 (7.6%) |
| 55 to 64 Years | 458 (86.1%) | 74 (13.9%) |
| 65 to 74 Years | 455 (100.0%) | 0 (0.0%) |
| 75 Years and older | 370 (100.0%) | 0 (0.0%) |
| Total | 3,613 (95.2%) | 184 (4.9%) |
Health Insurance Coverage by Citizenship Status in Verona
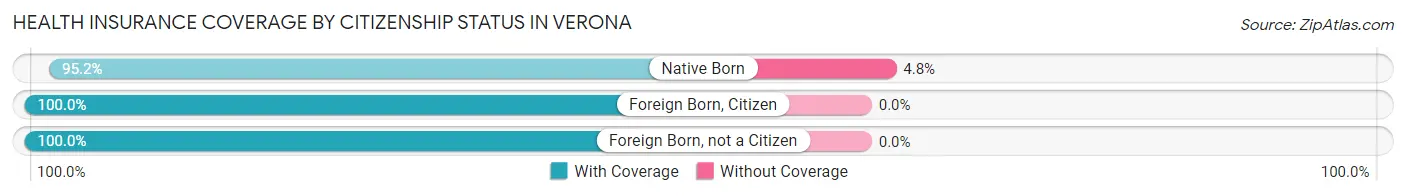
| Citizenship Status | With Coverage | Without Coverage |
| Native Born | 355 (95.2%) | 18 (4.8%) |
| Foreign Born, Citizen | 433 (100.0%) | 0 (0.0%) |
| Foreign Born, not a Citizen | 305 (100.0%) | 0 (0.0%) |
Health Insurance Coverage by Household Income in Verona
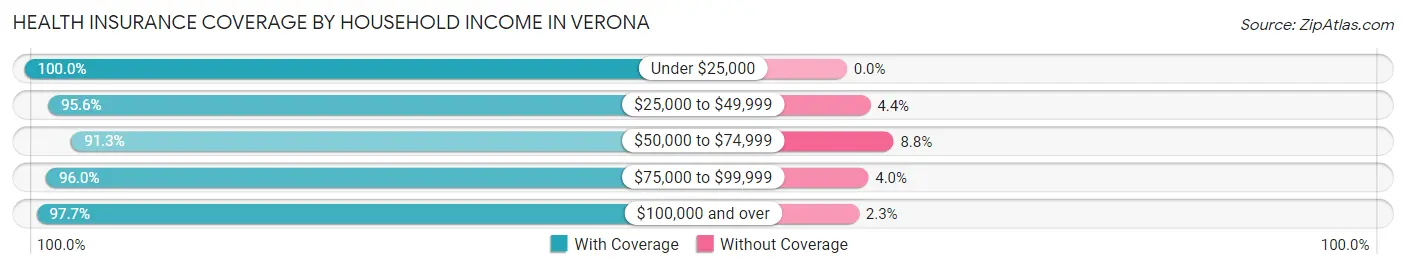
| Household Income | With Coverage | Without Coverage |
| Under $25,000 | 231 (100.0%) | 0 (0.0%) |
| $25,000 to $49,999 | 670 (95.6%) | 31 (4.4%) |
| $50,000 to $74,999 | 1,106 (91.2%) | 106 (8.7%) |
| $75,000 to $99,999 | 524 (96.0%) | 22 (4.0%) |
| $100,000 and over | 1,082 (97.7%) | 25 (2.3%) |
Public vs Private Health Insurance Coverage by Age in Verona
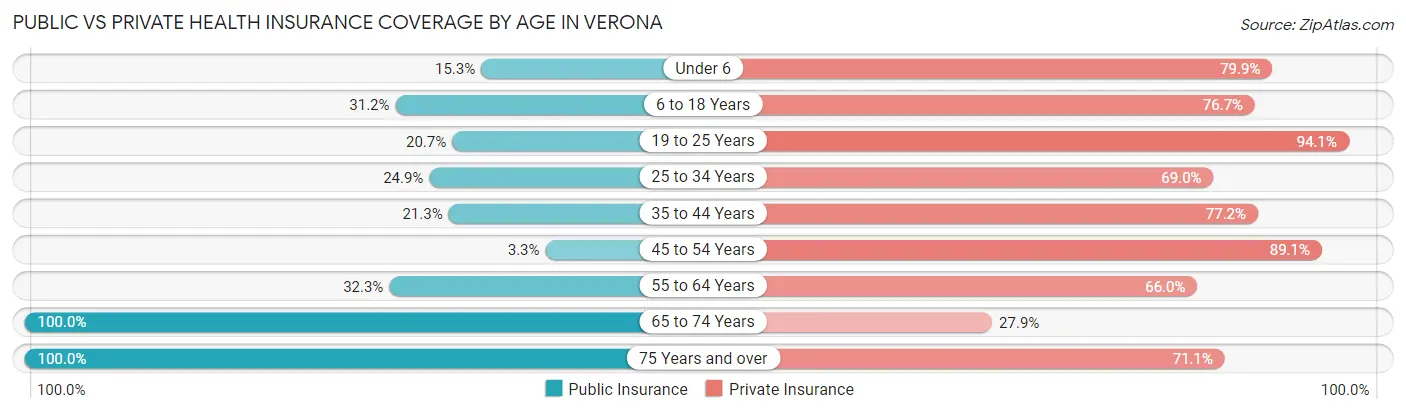
| Age Bracket | Public Insurance | Private Insurance |
| Under 6 | 57 (15.3%) | 298 (79.9%) |
| 6 to 18 Years | 135 (31.2%) | 332 (76.7%) |
| 19 to 25 Years | 63 (20.7%) | 287 (94.1%) |
| 25 to 34 Years | 65 (24.9%) | 180 (69.0%) |
| 35 to 44 Years | 132 (21.3%) | 478 (77.2%) |
| 45 to 54 Years | 15 (3.3%) | 400 (89.1%) |
| 55 to 64 Years | 172 (32.3%) | 351 (66.0%) |
| 65 to 74 Years | 455 (100.0%) | 127 (27.9%) |
| 75 Years and over | 370 (100.0%) | 263 (71.1%) |
| Total | 1,464 (38.6%) | 2,716 (71.5%) |
Disability Status by Sex by Age in Verona
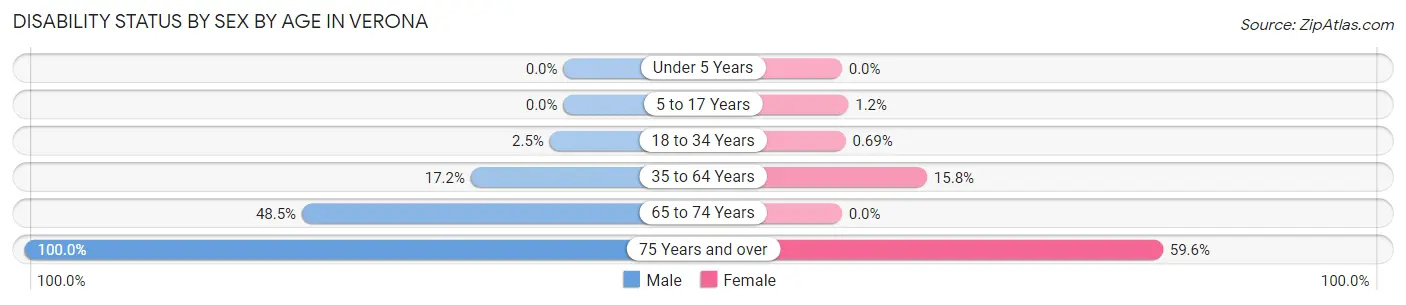
| Age Bracket | Male | Female |
| Under 5 Years | 0 (0.0%) | 0 (0.0%) |
| 5 to 17 Years | 0 (0.0%) | 3 (1.2%) |
| 18 to 34 Years | 8 (2.5%) | 2 (0.7%) |
| 35 to 64 Years | 139 (17.2%) | 125 (15.8%) |
| 65 to 74 Years | 115 (48.5%) | 0 (0.0%) |
| 75 Years and over | 36 (100.0%) | 199 (59.6%) |
Disability Class by Sex by Age in Verona
Disability Class: Hearing Difficulty
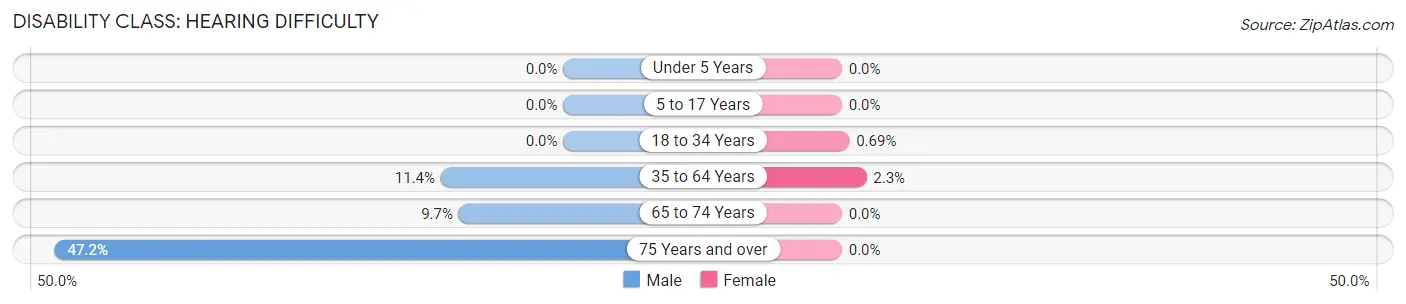
| Age Bracket | Male | Female |
| Under 5 Years | 0 (0.0%) | 0 (0.0%) |
| 5 to 17 Years | 0 (0.0%) | 0 (0.0%) |
| 18 to 34 Years | 0 (0.0%) | 2 (0.7%) |
| 35 to 64 Years | 92 (11.4%) | 18 (2.3%) |
| 65 to 74 Years | 23 (9.7%) | 0 (0.0%) |
| 75 Years and over | 17 (47.2%) | 0 (0.0%) |
Disability Class: Vision Difficulty
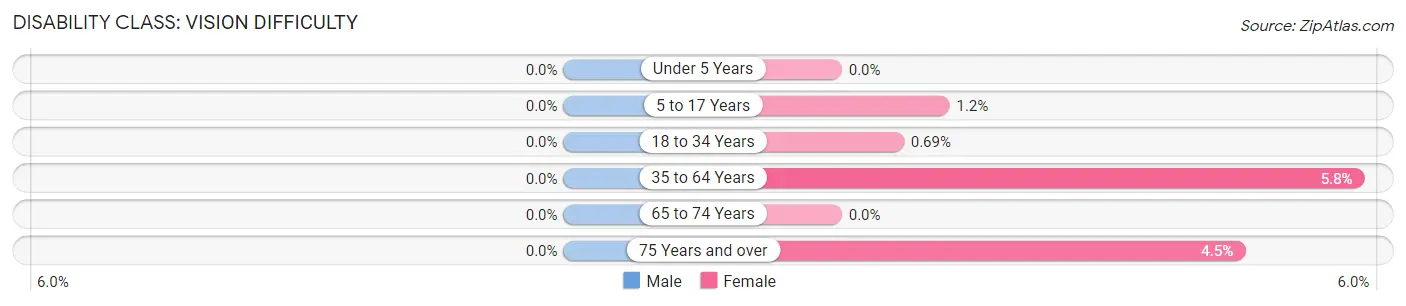
| Age Bracket | Male | Female |
| Under 5 Years | 0 (0.0%) | 0 (0.0%) |
| 5 to 17 Years | 0 (0.0%) | 3 (1.2%) |
| 18 to 34 Years | 0 (0.0%) | 2 (0.7%) |
| 35 to 64 Years | 0 (0.0%) | 46 (5.8%) |
| 65 to 74 Years | 0 (0.0%) | 0 (0.0%) |
| 75 Years and over | 0 (0.0%) | 15 (4.5%) |
Disability Class: Cognitive Difficulty
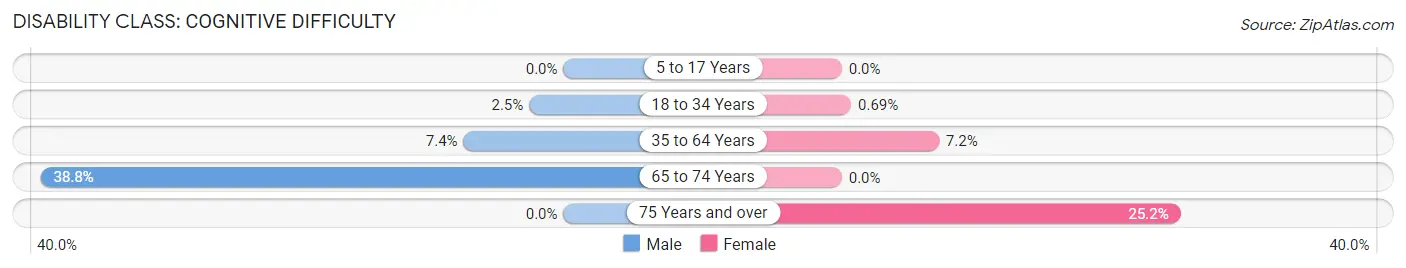
| Age Bracket | Male | Female |
| 5 to 17 Years | 0 (0.0%) | 0 (0.0%) |
| 18 to 34 Years | 8 (2.5%) | 2 (0.7%) |
| 35 to 64 Years | 60 (7.4%) | 57 (7.2%) |
| 65 to 74 Years | 92 (38.8%) | 0 (0.0%) |
| 75 Years and over | 0 (0.0%) | 84 (25.2%) |
Disability Class: Ambulatory Difficulty
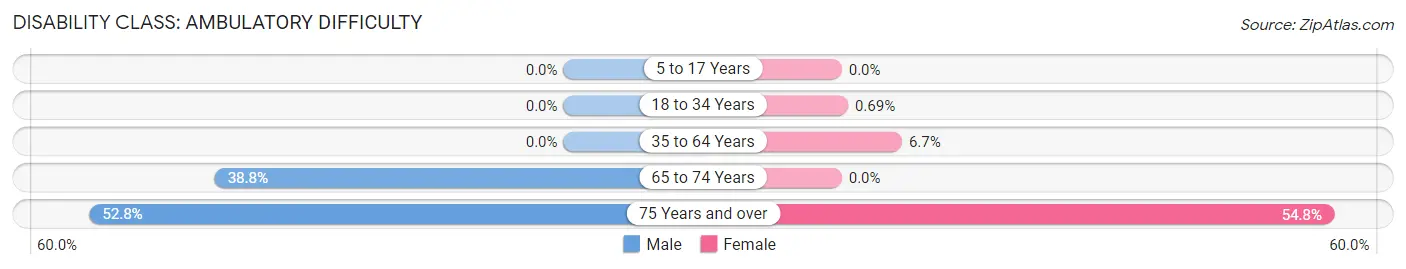
| Age Bracket | Male | Female |
| 5 to 17 Years | 0 (0.0%) | 0 (0.0%) |
| 18 to 34 Years | 0 (0.0%) | 2 (0.7%) |
| 35 to 64 Years | 0 (0.0%) | 53 (6.7%) |
| 65 to 74 Years | 92 (38.8%) | 0 (0.0%) |
| 75 Years and over | 19 (52.8%) | 183 (54.8%) |
Disability Class: Self-Care Difficulty
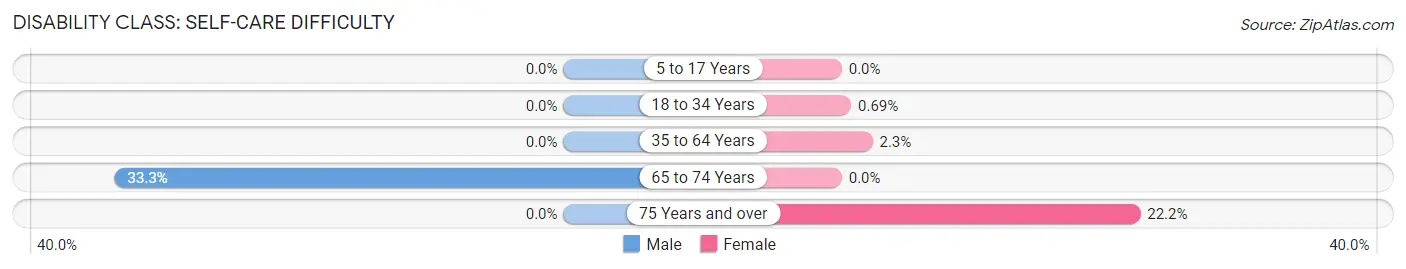
| Age Bracket | Male | Female |
| 5 to 17 Years | 0 (0.0%) | 0 (0.0%) |
| 18 to 34 Years | 0 (0.0%) | 2 (0.7%) |
| 35 to 64 Years | 0 (0.0%) | 18 (2.3%) |
| 65 to 74 Years | 79 (33.3%) | 0 (0.0%) |
| 75 Years and over | 0 (0.0%) | 74 (22.2%) |
Technology Access in Verona
Computing Device Access in Verona
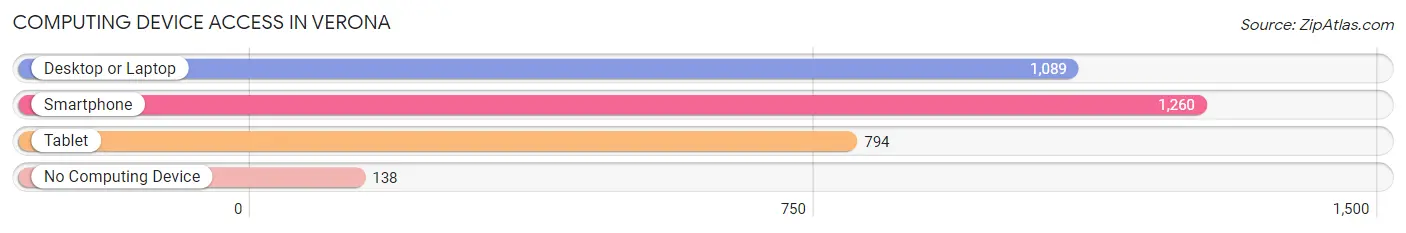
| Device Type | # Households | % Households |
| Desktop or Laptop | 1,089 | 68.6% |
| Smartphone | 1,260 | 79.4% |
| Tablet | 794 | 50.0% |
| No Computing Device | 138 | 8.7% |
| Total | 1,587 | 100.0% |
Internet Access in Verona
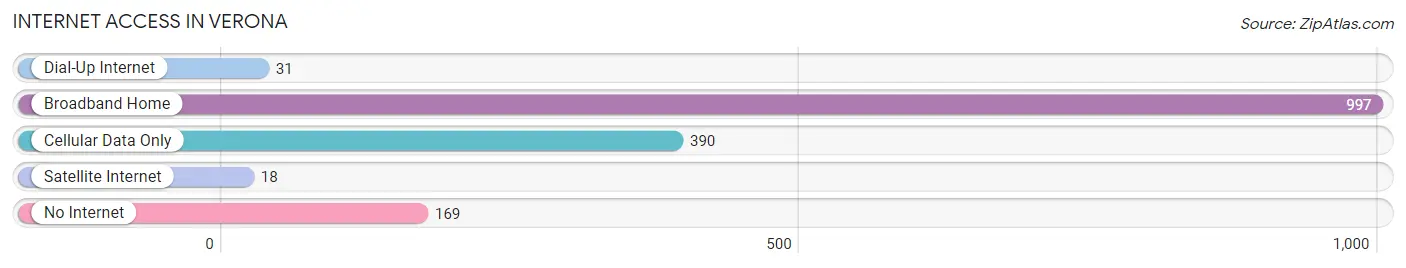
| Internet Type | # Households | % Households |
| Dial-Up Internet | 31 | 1.9% |
| Broadband Home | 997 | 62.8% |
| Cellular Data Only | 390 | 24.6% |
| Satellite Internet | 18 | 1.1% |
| No Internet | 169 | 10.6% |
| Total | 1,587 | 100.0% |
Verona Summary
Verona, Virginia is a small town located in Augusta County, Virginia. It is situated in the Shenandoah Valley, approximately 10 miles north of Staunton and 25 miles south of Harrisonburg. The town is situated along the banks of the North River, a tributary of the South Fork of the Shenandoah River. The population of Verona was 1,845 as of the 2010 census.
History
Verona was first settled in the late 1700s by German immigrants. The town was originally known as “New Market” and was renamed “Verona” in 1812. The name was chosen to honor the Italian city of Verona, which was the birthplace of the town’s first postmaster, John B. Miller.
Verona was an important stop on the Valley Turnpike, which connected Staunton to Harrisonburg. The turnpike was built in the early 1800s and was the main route for travelers and goods between the two cities.
Verona was also an important stop on the Virginia Central Railroad, which connected Richmond to the Shenandoah Valley. The railroad was built in the 1850s and was a major factor in the growth of the town.
Geography
Verona is located in the Shenandoah Valley, approximately 10 miles north of Staunton and 25 miles south of Harrisonburg. The town is situated along the banks of the North River, a tributary of the South Fork of the Shenandoah River.
The town is located in the foothills of the Blue Ridge Mountains and is surrounded by rolling hills and farmland. The climate is temperate, with hot summers and cold winters.
Economy
Verona’s economy is largely based on agriculture and tourism. The town is home to several farms, which produce a variety of crops, including corn, wheat, soybeans, and hay.
The town is also home to several wineries, which produce a variety of wines. The town is also home to several antique shops, which attract tourists from all over the region.
Demographics
As of the 2010 census, the population of Verona was 1,845. The racial makeup of the town was 94.3% White, 2.2% African American, 0.3% Native American, 0.7% Asian, 0.1% Pacific Islander, 0.7% from other races, and 1.7% from two or more races. Hispanic or Latino of any race were 2.2% of the population.
The median income for a household in Verona was $41,250, and the median income for a family was $50,000. The per capita income for the town was $20,845. About 8.3% of families and 10.2% of the population were below the poverty line, including 14.3% of those under age 18 and 8.2% of those age 65 or over.
Common Questions
What is Per Capita Income in Verona?
Per Capita income in Verona is $26,354.
What is the Median Family Income in Verona?
Median Family Income in Verona is $65,729.
What is the Median Household income in Verona?
Median Household Income in Verona is $65,067.
What is Income or Wage Gap in Verona?
Income or Wage Gap in Verona is 34.2%.
Women in Verona earn 65.8 cents for every dollar earned by a man.
What is Inequality or Gini Index in Verona?
Inequality or Gini Index in Verona is 0.30.
What is the Total Population of Verona?
Total Population of Verona is 4,582.
What is the Total Male Population of Verona?
Total Male Population of Verona is 2,456.
What is the Total Female Population of Verona?
Total Female Population of Verona is 2,126.
What is the Ratio of Males per 100 Females in Verona?
There are 115.52 Males per 100 Females in Verona.
What is the Ratio of Females per 100 Males in Verona?
There are 86.56 Females per 100 Males in Verona.
What is the Median Population Age in Verona?
Median Population Age in Verona is 40.3 Years.
What is the Average Family Size in Verona
Average Family Size in Verona is 2.7 People.
What is the Average Household Size in Verona
Average Household Size in Verona is 2.4 People.
How Large is the Labor Force in Verona?
There are 2,011 People in the Labor Forcein in Verona.
What is the Percentage of People in the Labor Force in Verona?
52.2% of People are in the Labor Force in Verona.
What is the Unemployment Rate in Verona?
Unemployment Rate in Verona is 2.6%.