Mountain View, NC Map & Demographics
Mountain View Map
Mountain View Overview
$30,011
PER CAPITA INCOME
$69,507
AVG FAMILY INCOME
$65,369
AVG HOUSEHOLD INCOME
25.1%
WAGE / INCOME GAP [ % ]
74.9¢/ $1
WAGE / INCOME GAP [ $ ]
0.34
INEQUALITY / GINI INDEX
3,323
TOTAL POPULATION
1,494
MALE POPULATION
1,829
FEMALE POPULATION
81.68
MALES / 100 FEMALES
122.42
FEMALES / 100 MALES
47.5
MEDIAN AGE
2.9
AVG FAMILY SIZE
2.5
AVG HOUSEHOLD SIZE
1,745
LABOR FORCE [ PEOPLE ]
62.7%
PERCENT IN LABOR FORCE
4.9%
UNEMPLOYMENT RATE
Income in Mountain View
Income Overview in Mountain View
Per Capita Income in Mountain View is $30,011, while median incomes of families and households are $69,507 and $65,369 respectively.
| Characteristic | Number | Measure |
| Per Capita Income | 3,323 | $30,011 |
| Median Family Income | 968 | $69,507 |
| Mean Family Income | 968 | $76,802 |
| Median Household Income | 1,331 | $65,369 |
| Mean Household Income | 1,331 | $69,940 |
| Income Deficit | 968 | $0 |
| Wage / Income Gap (%) | 3,323 | 25.07% |
| Wage / Income Gap ($) | 3,323 | 74.93¢ per $1 |
| Gini / Inequality Index | 3,323 | 0.34 |
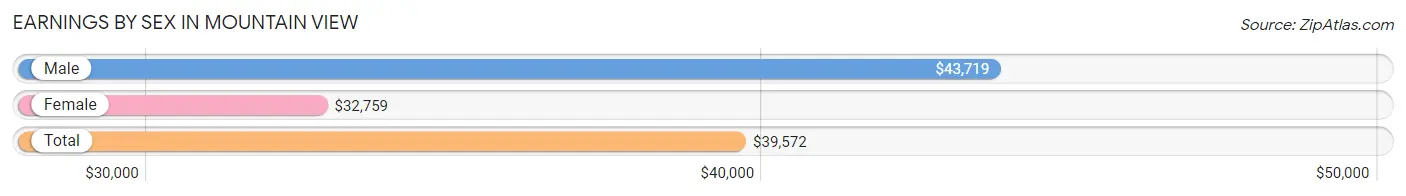
Earnings by Sex in Mountain View
Average Earnings in Mountain View are $39,572, $43,719 for men and $32,759 for women, a difference of 25.1%.
| Sex | Number | Average Earnings |
| Male | 883 (47.6%) | $43,719 |
| Female | 970 (52.3%) | $32,759 |
| Total | 1,853 (100.0%) | $39,572 |
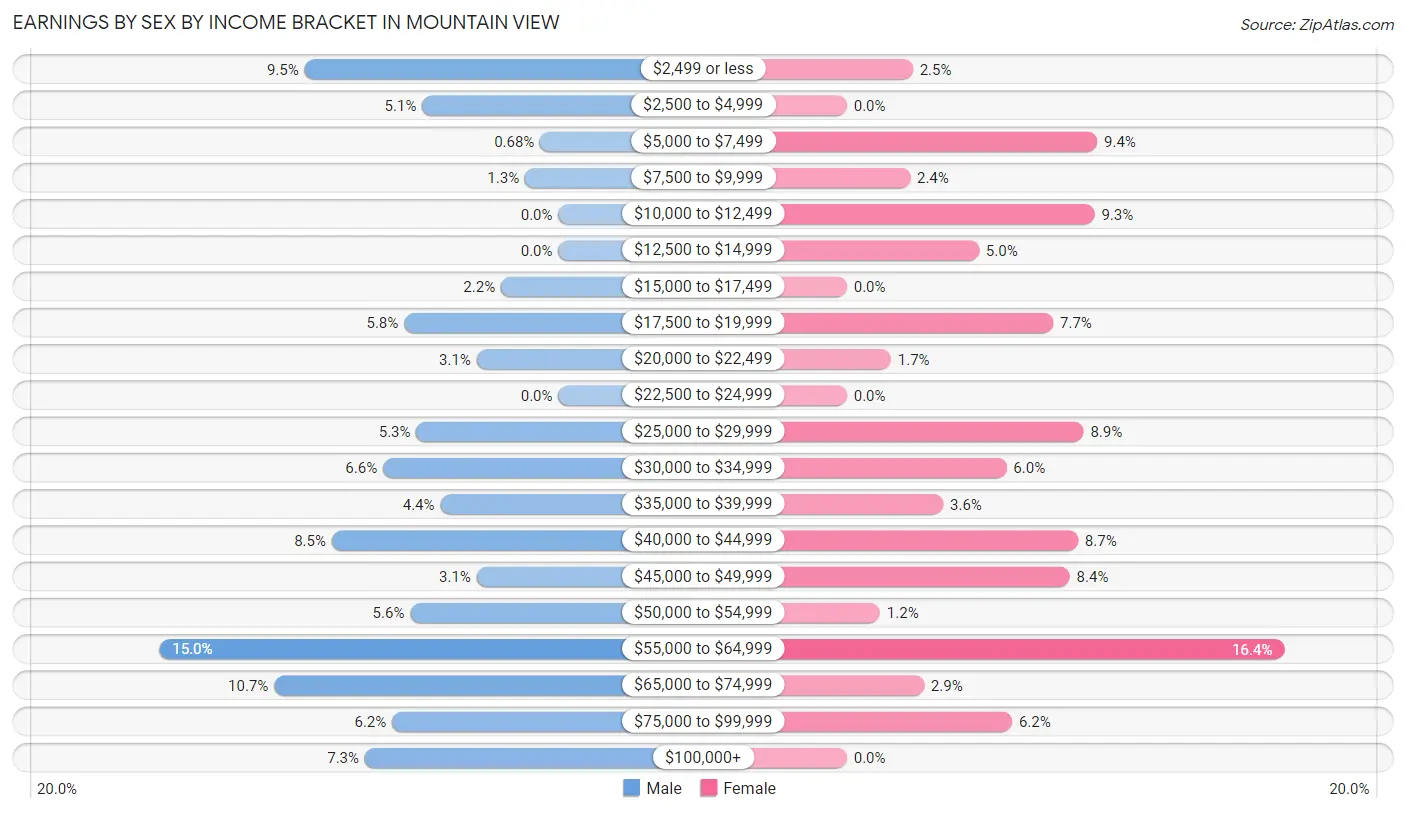
Earnings by Sex by Income Bracket in Mountain View
The most common earnings brackets in Mountain View are $55,000 to $64,999 for men (132 | 14.9%) and $55,000 to $64,999 for women (159 | 16.4%).
| Income | Male | Female |
| $2,499 or less | 84 (9.5%) | 24 (2.5%) |
| $2,500 to $4,999 | 45 (5.1%) | 0 (0.0%) |
| $5,000 to $7,499 | 6 (0.7%) | 91 (9.4%) |
| $7,500 to $9,999 | 11 (1.3%) | 23 (2.4%) |
| $10,000 to $12,499 | 0 (0.0%) | 90 (9.3%) |
| $12,500 to $14,999 | 0 (0.0%) | 48 (5.0%) |
| $15,000 to $17,499 | 19 (2.1%) | 0 (0.0%) |
| $17,500 to $19,999 | 51 (5.8%) | 75 (7.7%) |
| $20,000 to $22,499 | 27 (3.1%) | 16 (1.7%) |
| $22,500 to $24,999 | 0 (0.0%) | 0 (0.0%) |
| $25,000 to $29,999 | 47 (5.3%) | 86 (8.9%) |
| $30,000 to $34,999 | 58 (6.6%) | 58 (6.0%) |
| $35,000 to $39,999 | 39 (4.4%) | 35 (3.6%) |
| $40,000 to $44,999 | 75 (8.5%) | 84 (8.7%) |
| $45,000 to $49,999 | 27 (3.1%) | 81 (8.4%) |
| $50,000 to $54,999 | 49 (5.6%) | 12 (1.2%) |
| $55,000 to $64,999 | 132 (14.9%) | 159 (16.4%) |
| $65,000 to $74,999 | 94 (10.6%) | 28 (2.9%) |
| $75,000 to $99,999 | 55 (6.2%) | 60 (6.2%) |
| $100,000+ | 64 (7.2%) | 0 (0.0%) |
| Total | 883 (100.0%) | 970 (100.0%) |
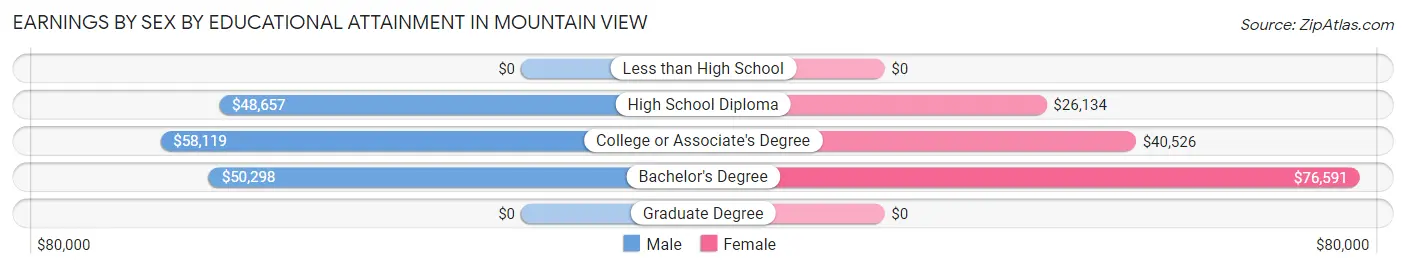
Earnings by Sex by Educational Attainment in Mountain View
Average earnings in Mountain View are $54,152 for men and $32,112 for women, a difference of 40.7%. Men with an educational attainment of college or associate's degree enjoy the highest average annual earnings of $58,119, while those with high school diploma education earn the least with $48,657. Women with an educational attainment of bachelor's degree earn the most with the average annual earnings of $76,591, while those with high school diploma education have the smallest earnings of $26,134.
| Educational Attainment | Male Income | Female Income |
| Less than High School | - | - |
| High School Diploma | $48,657 | $26,134 |
| College or Associate's Degree | $58,119 | $40,526 |
| Bachelor's Degree | $50,298 | $76,591 |
| Graduate Degree | - | - |
| Total | $54,152 | $32,112 |
Family Income in Mountain View
Family Income Brackets in Mountain View
According to the Mountain View family income data, there are 304 families falling into the $50,000 to $74,999 income range, which is the most common income bracket and makes up 31.4% of all families.
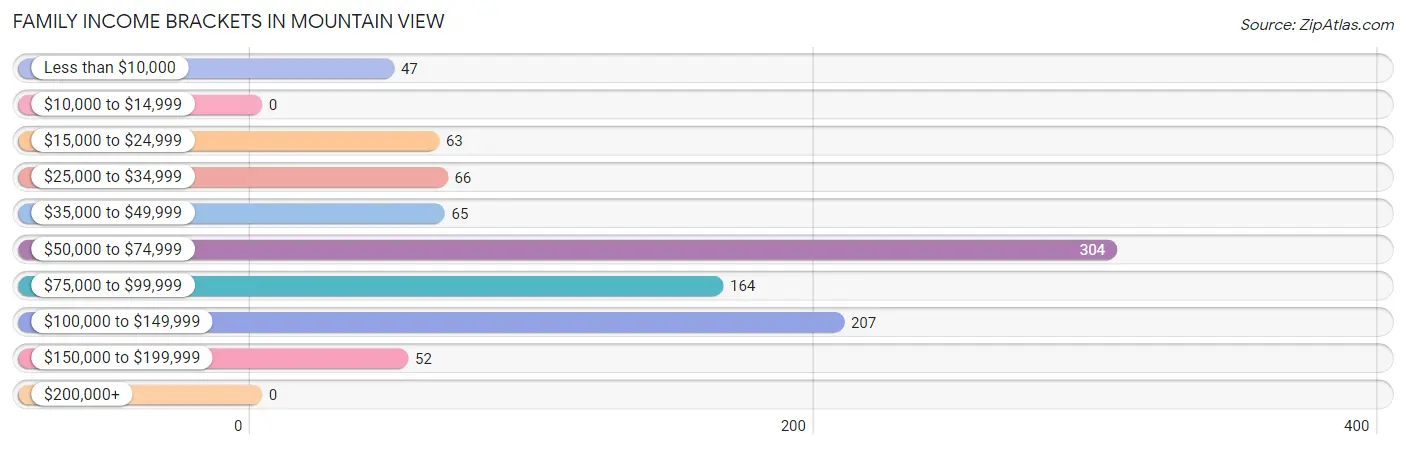
| Income Bracket | # Families | % Families |
| Less than $10,000 | 47 | 4.9% |
| $10,000 to $14,999 | 0 | 0.0% |
| $15,000 to $24,999 | 63 | 6.5% |
| $25,000 to $34,999 | 66 | 6.8% |
| $35,000 to $49,999 | 65 | 6.7% |
| $50,000 to $74,999 | 304 | 31.4% |
| $75,000 to $99,999 | 164 | 16.9% |
| $100,000 to $149,999 | 207 | 21.4% |
| $150,000 to $199,999 | 52 | 5.4% |
| $200,000+ | 0 | 0.0% |
Family Income by Famaliy Size in Mountain View
5-person families (37 | 3.8%) account for the highest median family income in Mountain View with $182,798 per family, while 5-person families (37 | 3.8%) have the highest median income of $36,560 per family member.
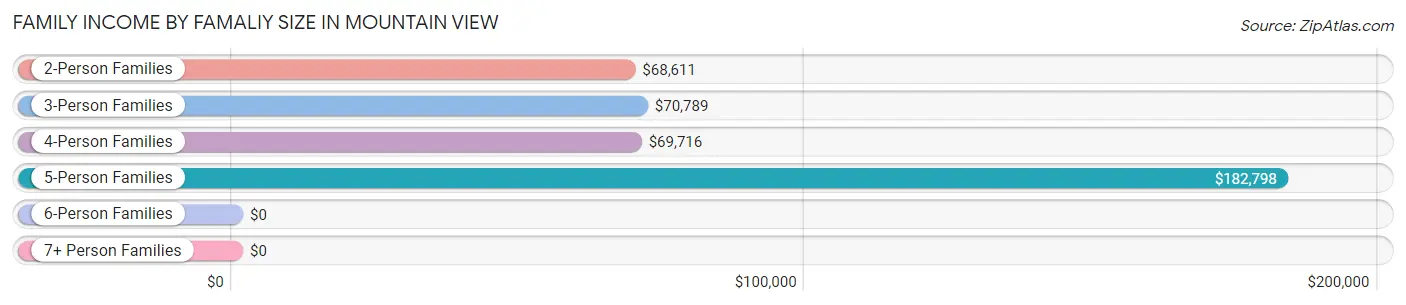
| Income Bracket | # Families | Median Income |
| 2-Person Families | 520 (53.7%) | $68,611 |
| 3-Person Families | 276 (28.5%) | $70,789 |
| 4-Person Families | 78 (8.1%) | $69,716 |
| 5-Person Families | 37 (3.8%) | $182,798 |
| 6-Person Families | 57 (5.9%) | $0 |
| 7+ Person Families | 0 (0.0%) | $0 |
| Total | 968 (100.0%) | $69,507 |
Family Income by Number of Earners in Mountain View
The median family income in Mountain View is $69,507, with families comprising 2 earners (405) having the highest median family income of $110,139, while families with no earners (194) have the lowest median family income of $44,125, accounting for 41.8% and 20.0% of families, respectively.
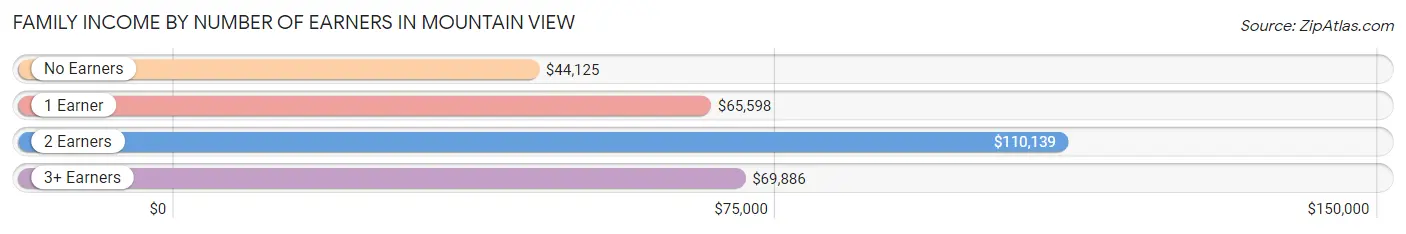
| Number of Earners | # Families | Median Income |
| No Earners | 194 (20.0%) | $44,125 |
| 1 Earner | 231 (23.9%) | $65,598 |
| 2 Earners | 405 (41.8%) | $110,139 |
| 3+ Earners | 138 (14.3%) | $69,886 |
| Total | 968 (100.0%) | $69,507 |
Household Income in Mountain View
Household Income Brackets in Mountain View
With 329 households falling in the category, the $50,000 to $74,999 income range is the most frequent in Mountain View, accounting for 24.7% of all households.
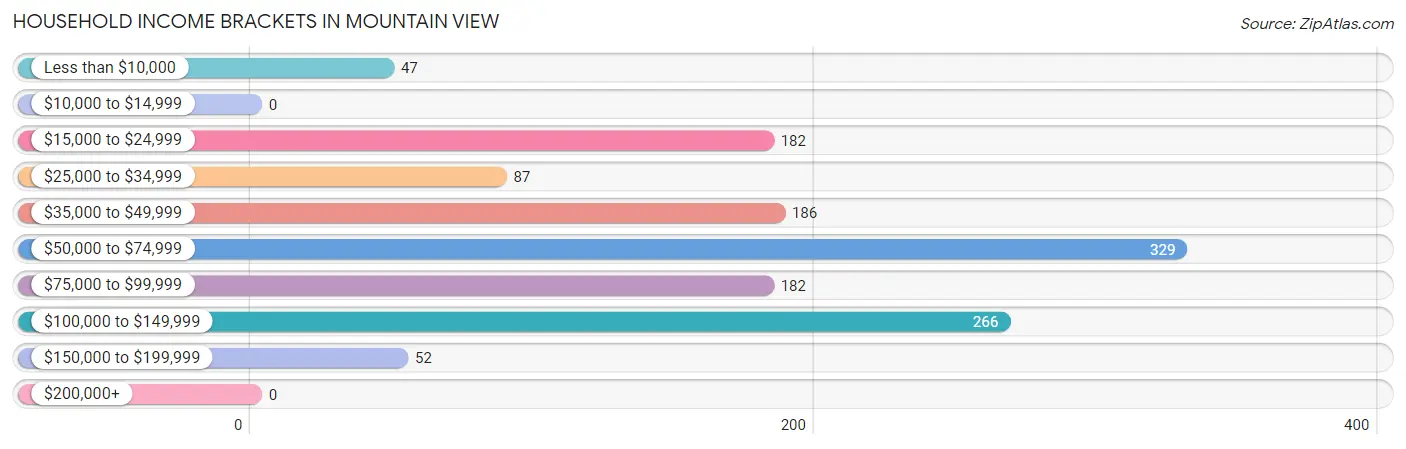
| Income Bracket | # Households | % Households |
| Less than $10,000 | 47 | 3.5% |
| $10,000 to $14,999 | 0 | 0.0% |
| $15,000 to $24,999 | 182 | 13.7% |
| $25,000 to $34,999 | 87 | 6.5% |
| $35,000 to $49,999 | 186 | 14.0% |
| $50,000 to $74,999 | 329 | 24.7% |
| $75,000 to $99,999 | 182 | 13.7% |
| $100,000 to $149,999 | 266 | 20.0% |
| $150,000 to $199,999 | 52 | 3.9% |
| $200,000+ | 0 | 0.0% |
Household Income by Householder Age in Mountain View
The median household income in Mountain View is $65,369, with the highest median household income of $80,846 found in the 45 to 64 years age bracket for the primary householder. A total of 577 households (43.3%) fall into this category. Meanwhile, the 15 to 24 years age bracket for the primary householder has the lowest median household income of $0, with 10 households (0.7%) in this group.
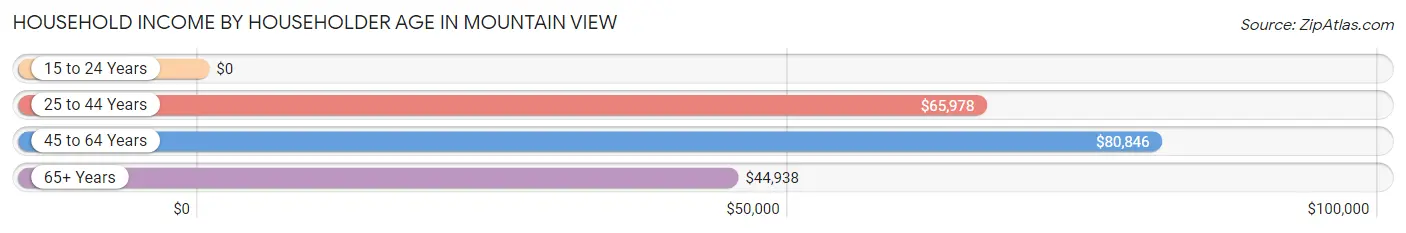
| Income Bracket | # Households | Median Income |
| 15 to 24 Years | 10 (0.7%) | $0 |
| 25 to 44 Years | 276 (20.7%) | $65,978 |
| 45 to 64 Years | 577 (43.3%) | $80,846 |
| 65+ Years | 468 (35.2%) | $44,938 |
| Total | 1,331 (100.0%) | $65,369 |
Poverty in Mountain View
Income Below Poverty by Sex and Age in Mountain View
With 17.8% poverty level for males and 12.9% for females among the residents of Mountain View, under 5 year old males and 12 to 14 year old females are the most vulnerable to poverty, with 64 males (100.0%) and 72 females (74.2%) in their respective age groups living below the poverty level.
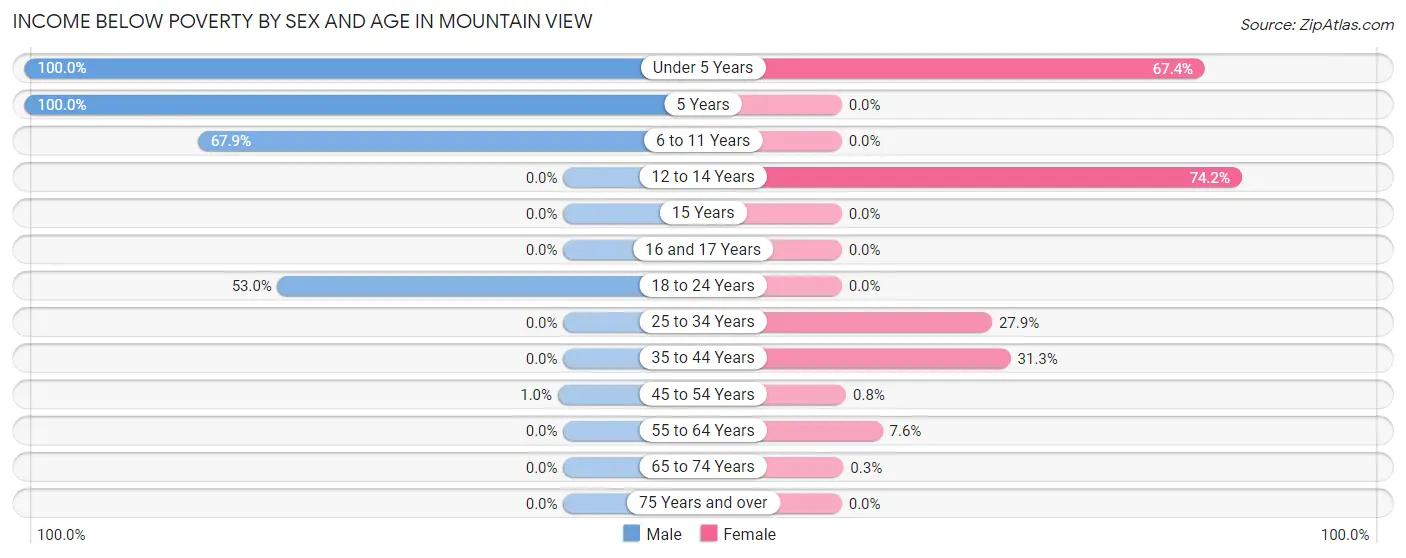
| Age Bracket | Male | Female |
| Under 5 Years | 64 (100.0%) | 31 (67.4%) |
| 5 Years | 44 (100.0%) | 0 (0.0%) |
| 6 to 11 Years | 76 (67.9%) | 0 (0.0%) |
| 12 to 14 Years | 0 (0.0%) | 72 (74.2%) |
| 15 Years | 0 (0.0%) | 0 (0.0%) |
| 16 and 17 Years | 0 (0.0%) | 0 (0.0%) |
| 18 to 24 Years | 79 (53.0%) | 0 (0.0%) |
| 25 to 34 Years | 0 (0.0%) | 58 (27.9%) |
| 35 to 44 Years | 0 (0.0%) | 47 (31.3%) |
| 45 to 54 Years | 2 (1.0%) | 2 (0.8%) |
| 55 to 64 Years | 0 (0.0%) | 24 (7.6%) |
| 65 to 74 Years | 0 (0.0%) | 1 (0.3%) |
| 75 Years and over | 0 (0.0%) | 0 (0.0%) |
| Total | 265 (17.8%) | 235 (12.9%) |
Income Above Poverty by Sex and Age in Mountain View
According to the poverty statistics in Mountain View, males aged 12 to 14 years and females aged 6 to 11 years are the age groups that are most secure financially, with 100.0% of males and 100.0% of females in these age groups living above the poverty line.
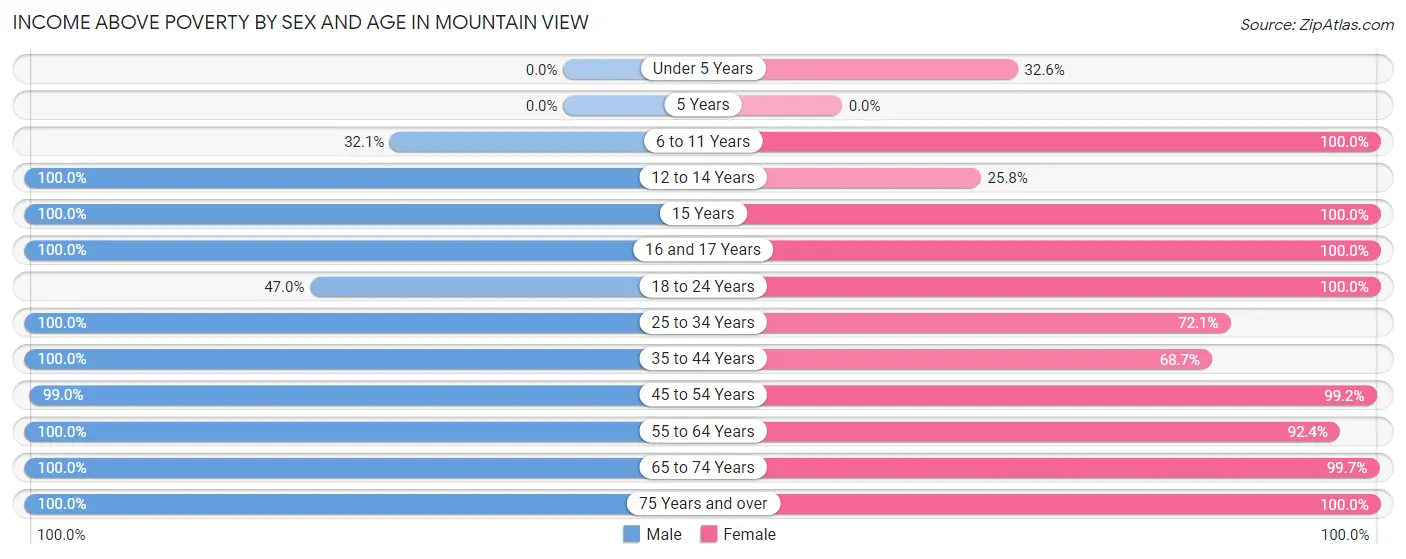
| Age Bracket | Male | Female |
| Under 5 Years | 0 (0.0%) | 15 (32.6%) |
| 5 Years | 0 (0.0%) | 0 (0.0%) |
| 6 to 11 Years | 36 (32.1%) | 85 (100.0%) |
| 12 to 14 Years | 35 (100.0%) | 25 (25.8%) |
| 15 Years | 18 (100.0%) | 37 (100.0%) |
| 16 and 17 Years | 27 (100.0%) | 24 (100.0%) |
| 18 to 24 Years | 70 (47.0%) | 215 (100.0%) |
| 25 to 34 Years | 119 (100.0%) | 150 (72.1%) |
| 35 to 44 Years | 189 (100.0%) | 103 (68.7%) |
| 45 to 54 Years | 195 (99.0%) | 247 (99.2%) |
| 55 to 64 Years | 230 (100.0%) | 293 (92.4%) |
| 65 to 74 Years | 192 (100.0%) | 327 (99.7%) |
| 75 Years and over | 113 (100.0%) | 73 (100.0%) |
| Total | 1,224 (82.2%) | 1,594 (87.2%) |
Income Below Poverty Among Married-Couple Families in Mountain View
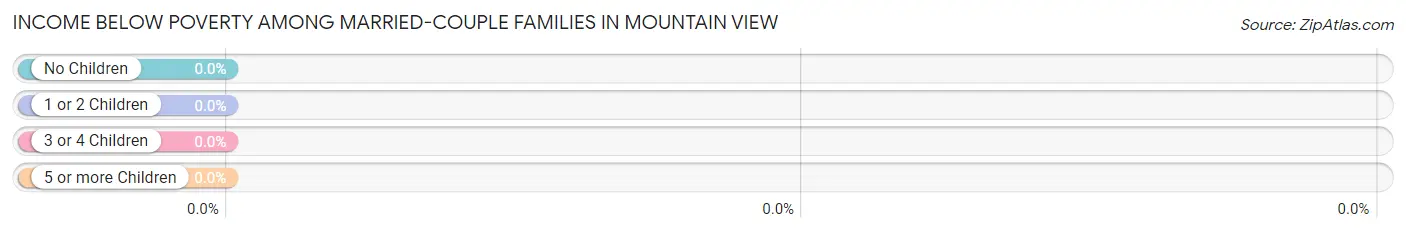
| Children | Above Poverty | Below Poverty |
| No Children | 576 (100.0%) | 0 (0.0%) |
| 1 or 2 Children | 113 (100.0%) | 0 (0.0%) |
| 3 or 4 Children | 30 (100.0%) | 0 (0.0%) |
| 5 or more Children | 0 (0.0%) | 0 (0.0%) |
| Total | 719 (100.0%) | 0 (0.0%) |
Income Below Poverty Among Single-Parent Households in Mountain View
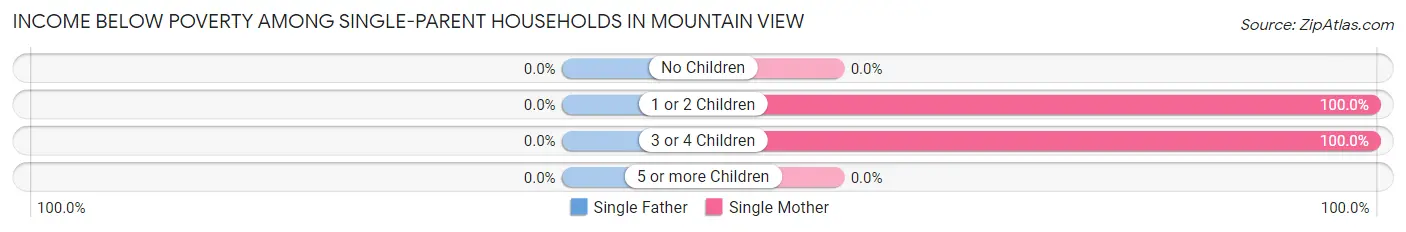
| Children | Single Father | Single Mother |
| No Children | 0 (0.0%) | 0 (0.0%) |
| 1 or 2 Children | 0 (0.0%) | 58 (100.0%) |
| 3 or 4 Children | 0 (0.0%) | 47 (100.0%) |
| 5 or more Children | 0 (0.0%) | 0 (0.0%) |
| Total | 0 (0.0%) | 105 (55.8%) |
Income Below Poverty Among Married-Couple vs Single-Parent Households in Mountain View
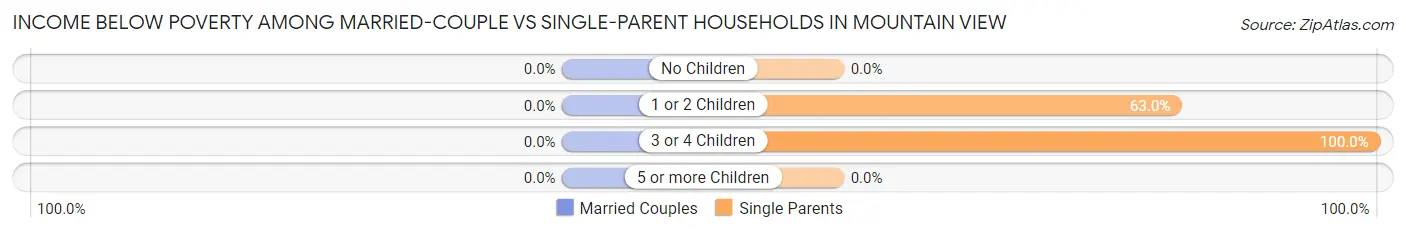
| Children | Married-Couple Families | Single-Parent Households |
| No Children | 0 (0.0%) | 0 (0.0%) |
| 1 or 2 Children | 0 (0.0%) | 58 (63.0%) |
| 3 or 4 Children | 0 (0.0%) | 47 (100.0%) |
| 5 or more Children | 0 (0.0%) | 0 (0.0%) |
| Total | 0 (0.0%) | 105 (42.2%) |
Race in Mountain View
The most populous races in Mountain View are White / Caucasian (2,806 | 84.4%), Black / African American (463 | 13.9%), and Two or more Races (54 | 1.6%).
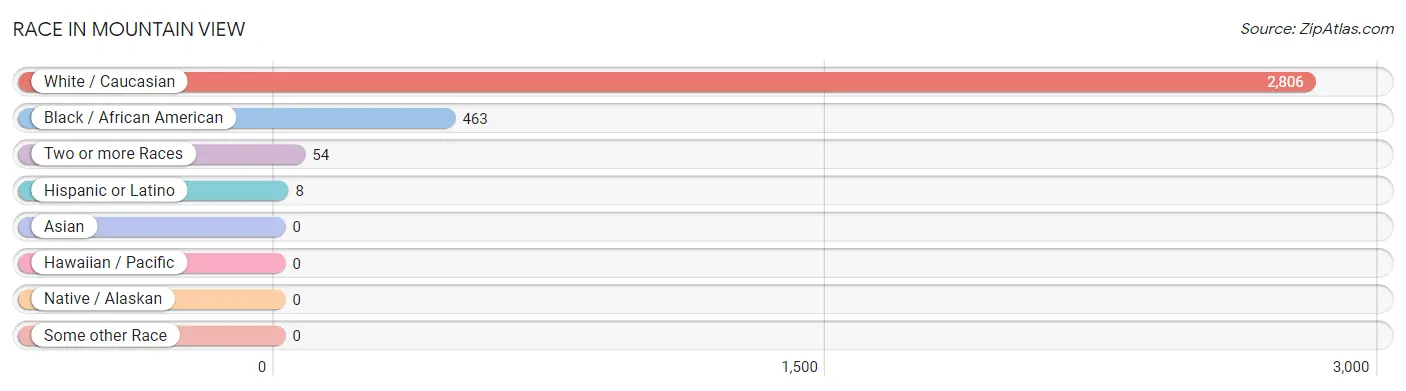
| Race | # Population | % Population |
| Asian | 0 | 0.0% |
| Black / African American | 463 | 13.9% |
| Hawaiian / Pacific | 0 | 0.0% |
| Hispanic or Latino | 8 | 0.2% |
| Native / Alaskan | 0 | 0.0% |
| White / Caucasian | 2,806 | 84.4% |
| Two or more Races | 54 | 1.6% |
| Some other Race | 0 | 0.0% |
| Total | 3,323 | 100.0% |
Ancestry in Mountain View
The most populous ancestries reported in Mountain View are Irish (585 | 17.6%), German (510 | 15.3%), American (461 | 13.9%), English (423 | 12.7%), and Scandinavian (113 | 3.4%), together accounting for 63.0% of all Mountain View residents.
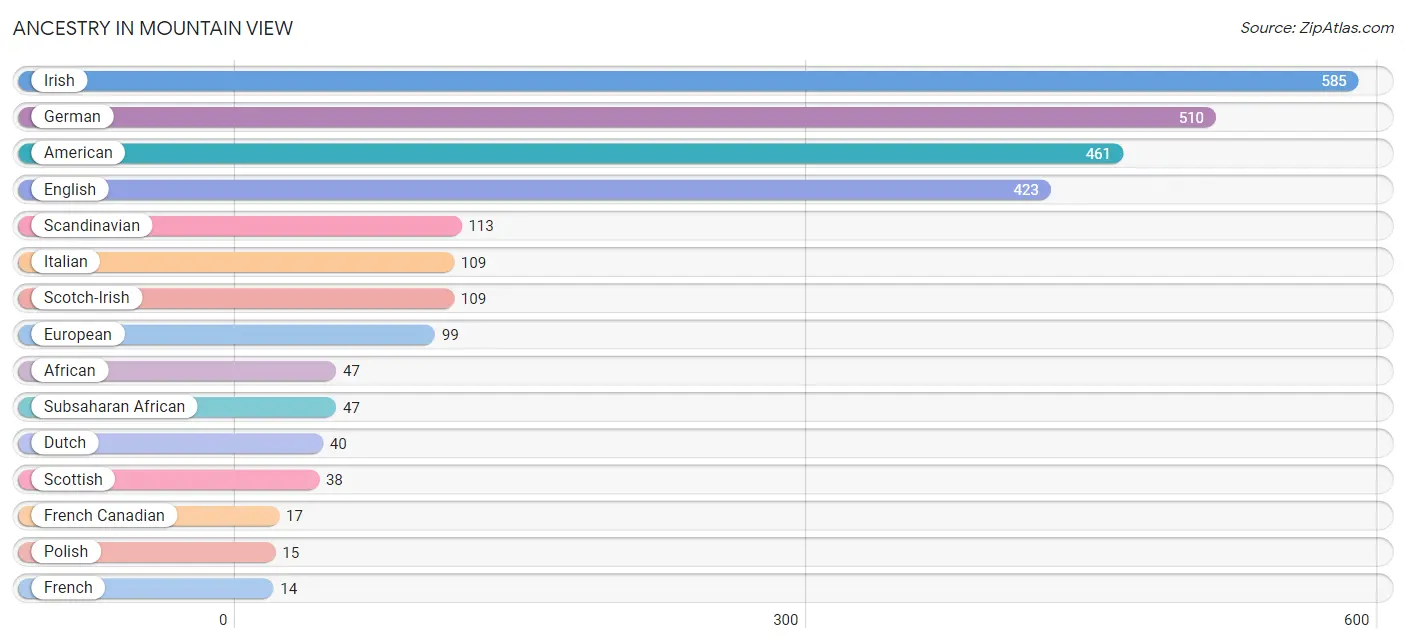
| Ancestry | # Population | % Population |
| African | 47 | 1.4% |
| American | 461 | 13.9% |
| British | 10 | 0.3% |
| Central American | 6 | 0.2% |
| Dutch | 40 | 1.2% |
| English | 423 | 12.7% |
| European | 99 | 3.0% |
| French | 14 | 0.4% |
| French Canadian | 17 | 0.5% |
| German | 510 | 15.3% |
| Irish | 585 | 17.6% |
| Italian | 109 | 3.3% |
| Mexican | 1 | 0.0% |
| Panamanian | 6 | 0.2% |
| Pennsylvania German | 13 | 0.4% |
| Polish | 15 | 0.4% |
| Scandinavian | 113 | 3.4% |
| Scotch-Irish | 109 | 3.3% |
| Scottish | 38 | 1.1% |
| Subsaharan African | 47 | 1.4% |
| Welsh | 7 | 0.2% | View All 21 Rows |
Immigrants in Mountain View
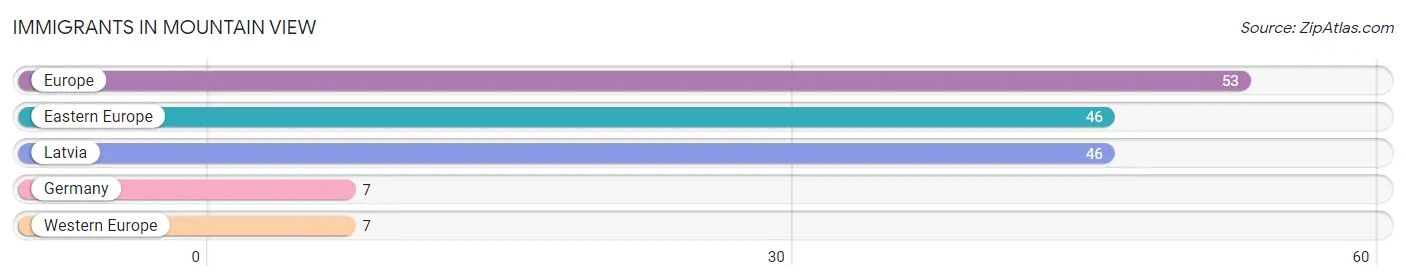
The most numerous immigrant groups reported in Mountain View came from Europe (53 | 1.6%), Eastern Europe (46 | 1.4%), Latvia (46 | 1.4%), Germany (7 | 0.2%), and Western Europe (7 | 0.2%), together accounting for 4.8% of all Mountain View residents.
| Immigration Origin | # Population | % Population |
| Eastern Europe | 46 | 1.4% |
| Europe | 53 | 1.6% |
| Germany | 7 | 0.2% |
| Latvia | 46 | 1.4% |
| Western Europe | 7 | 0.2% | View All 5 Rows |
Sex and Age in Mountain View
Sex and Age in Mountain View
The most populous age groups in Mountain View are 20 to 24 Years (141 | 9.4%) for men and 70 to 74 Years (249 | 13.6%) for women.
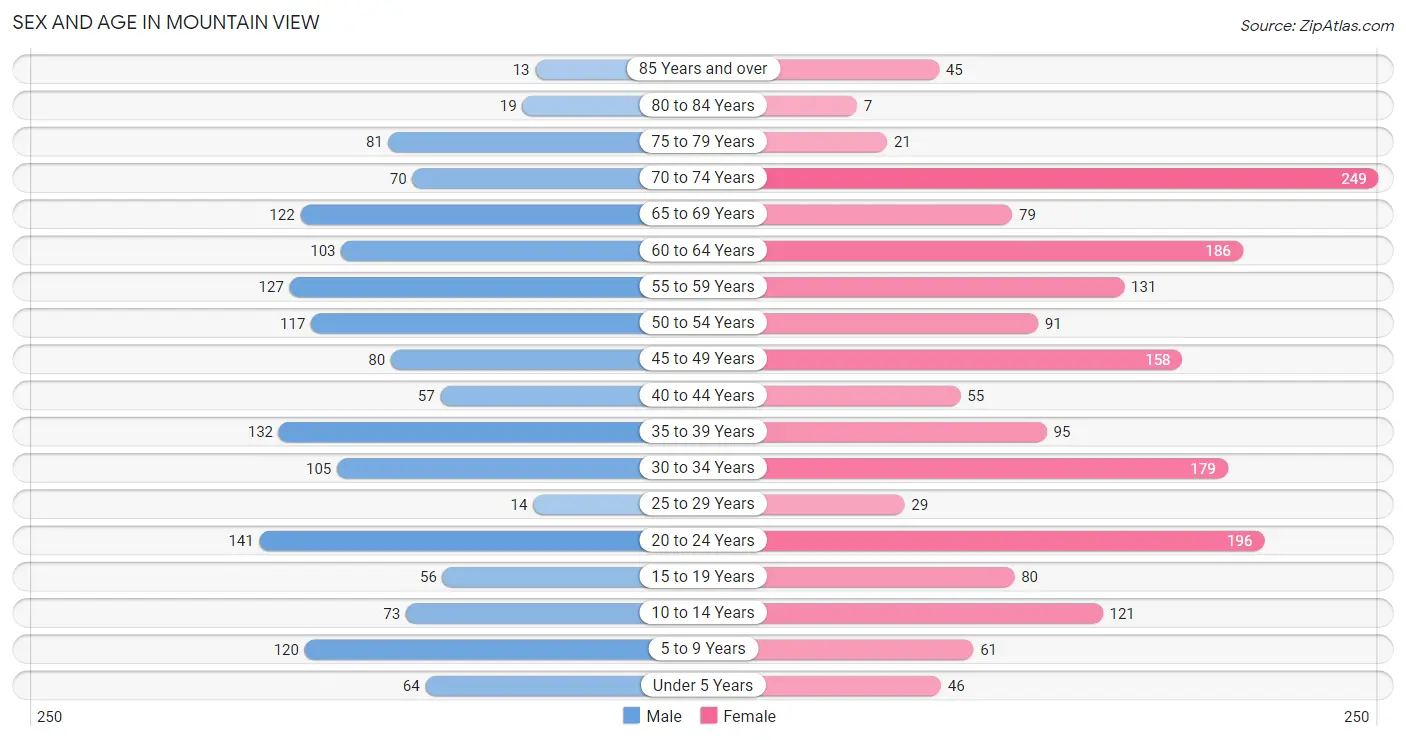
| Age Bracket | Male | Female |
| Under 5 Years | 64 (4.3%) | 46 (2.5%) |
| 5 to 9 Years | 120 (8.0%) | 61 (3.3%) |
| 10 to 14 Years | 73 (4.9%) | 121 (6.6%) |
| 15 to 19 Years | 56 (3.7%) | 80 (4.4%) |
| 20 to 24 Years | 141 (9.4%) | 196 (10.7%) |
| 25 to 29 Years | 14 (0.9%) | 29 (1.6%) |
| 30 to 34 Years | 105 (7.0%) | 179 (9.8%) |
| 35 to 39 Years | 132 (8.8%) | 95 (5.2%) |
| 40 to 44 Years | 57 (3.8%) | 55 (3.0%) |
| 45 to 49 Years | 80 (5.3%) | 158 (8.6%) |
| 50 to 54 Years | 117 (7.8%) | 91 (5.0%) |
| 55 to 59 Years | 127 (8.5%) | 131 (7.2%) |
| 60 to 64 Years | 103 (6.9%) | 186 (10.2%) |
| 65 to 69 Years | 122 (8.2%) | 79 (4.3%) |
| 70 to 74 Years | 70 (4.7%) | 249 (13.6%) |
| 75 to 79 Years | 81 (5.4%) | 21 (1.1%) |
| 80 to 84 Years | 19 (1.3%) | 7 (0.4%) |
| 85 Years and over | 13 (0.9%) | 45 (2.5%) |
| Total | 1,494 (100.0%) | 1,829 (100.0%) |
Families and Households in Mountain View
Median Family Size in Mountain View
The median family size in Mountain View is 2.94 persons per family, with single female/mother families (188 | 19.4%) accounting for the largest median family size of 3.59 persons per family. On the other hand, single male/father families (61 | 6.3%) represent the smallest median family size with 2.64 persons per family.
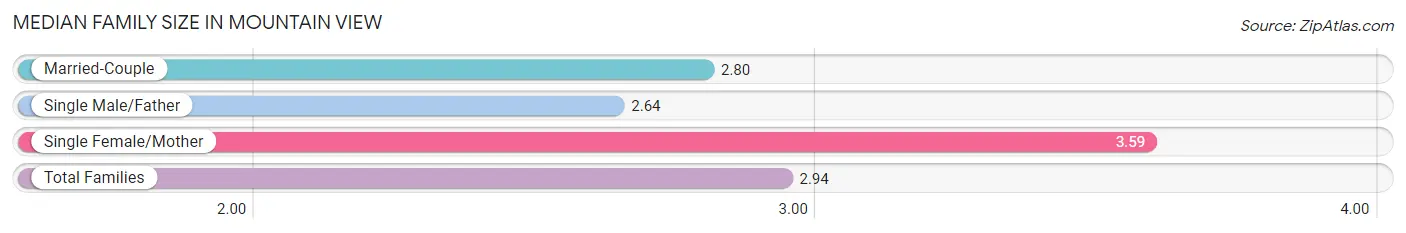
| Family Type | # Families | Family Size |
| Married-Couple | 719 (74.3%) | 2.80 |
| Single Male/Father | 61 (6.3%) | 2.64 |
| Single Female/Mother | 188 (19.4%) | 3.59 |
| Total Families | 968 (100.0%) | 2.94 |
Median Household Size in Mountain View
The median household size in Mountain View is 2.49 persons per household, with single female/mother households (188 | 14.1%) accounting for the largest median household size of 3.68 persons per household. non-family households (363 | 27.3%) represent the smallest median household size with 1.15 persons per household.
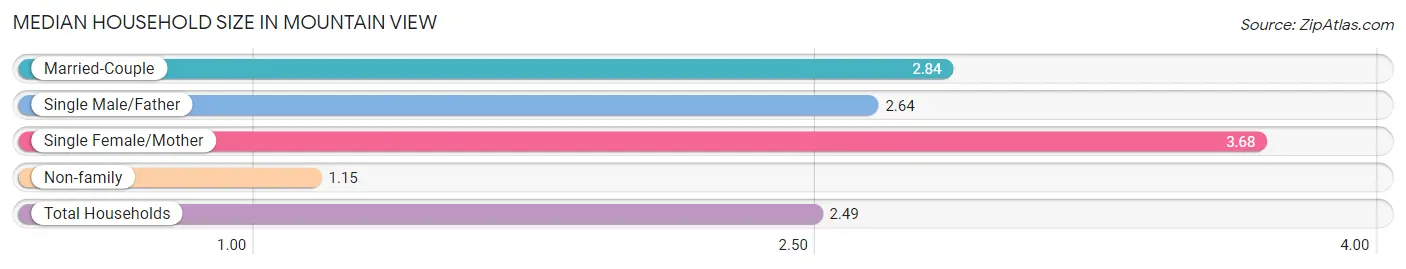
| Household Type | # Households | Household Size |
| Married-Couple | 719 (54.0%) | 2.84 |
| Single Male/Father | 61 (4.6%) | 2.64 |
| Single Female/Mother | 188 (14.1%) | 3.68 |
| Non-family | 363 (27.3%) | 1.15 |
| Total Households | 1,331 (100.0%) | 2.49 |
Household Size by Marriage Status in Mountain View
Out of a total of 1,331 households in Mountain View, 968 (72.7%) are family households, while 363 (27.3%) are nonfamily households. The most numerous type of family households are 2-person households, comprising 520, and the most common type of nonfamily households are 1-person households, comprising 315.
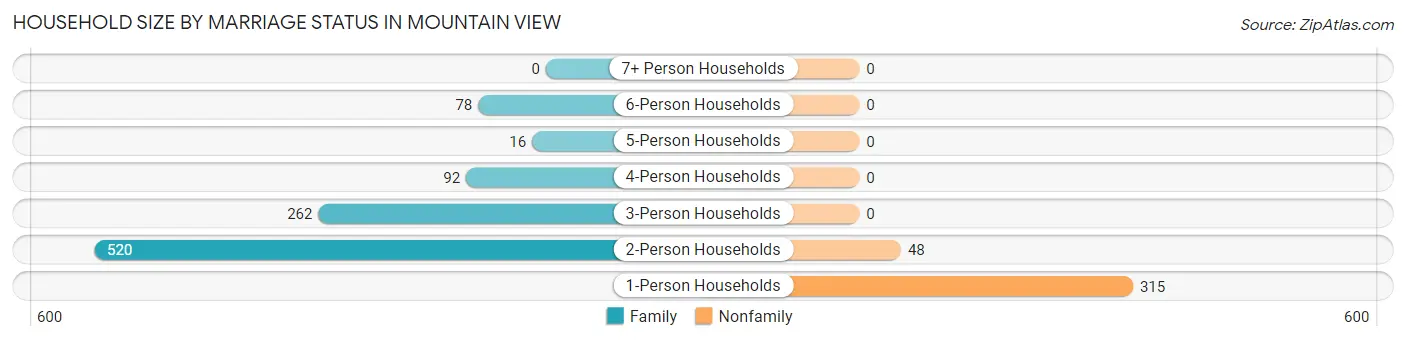
| Household Size | Family Households | Nonfamily Households |
| 1-Person Households | - | 315 (23.7%) |
| 2-Person Households | 520 (39.1%) | 48 (3.6%) |
| 3-Person Households | 262 (19.7%) | 0 (0.0%) |
| 4-Person Households | 92 (6.9%) | 0 (0.0%) |
| 5-Person Households | 16 (1.2%) | 0 (0.0%) |
| 6-Person Households | 78 (5.9%) | 0 (0.0%) |
| 7+ Person Households | 0 (0.0%) | 0 (0.0%) |
| Total | 968 (72.7%) | 363 (27.3%) |
Female Fertility in Mountain View
Fertility by Age in Mountain View
Average fertility rate in Mountain View is 16.0 births per 1,000 women. Women in the age bracket of 35 to 50 years have the highest fertility rate with 38.0 births per 1,000 women. Women in the age bracket of 35 to 50 years acount for 100.0% of all women with births.
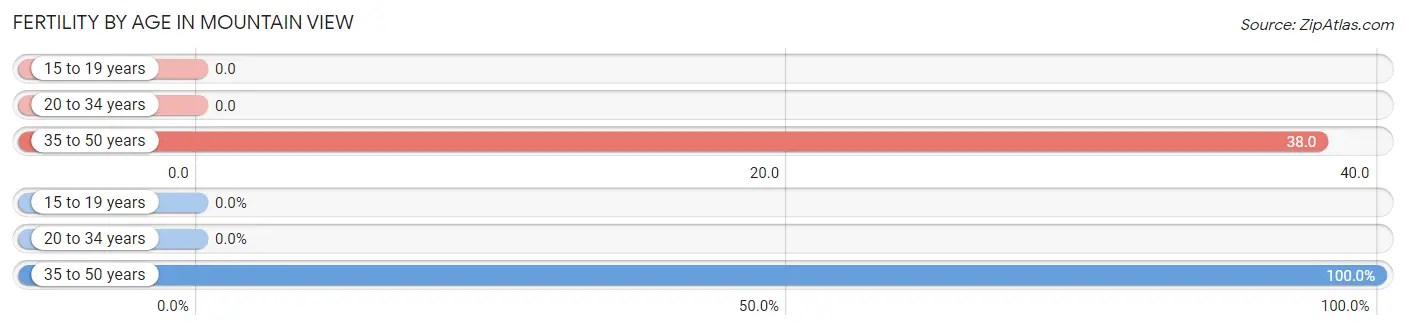
| Age Bracket | Women with Births | Births / 1,000 Women |
| 15 to 19 years | 0 (0.0%) | 0.0 |
| 20 to 34 years | 0 (0.0%) | 0.0 |
| 35 to 50 years | 14 (100.0%) | 38.0 |
| Total | 14 (100.0%) | 16.0 |
Fertility by Age by Marriage Status in Mountain View
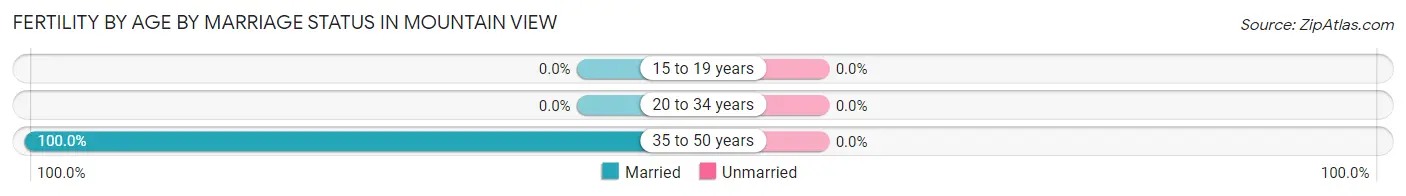
| Age Bracket | Married | Unmarried |
| 15 to 19 years | 0 (0.0%) | 0 (0.0%) |
| 20 to 34 years | 0 (0.0%) | 0 (0.0%) |
| 35 to 50 years | 14 (100.0%) | 0 (0.0%) |
| Total | 14 (100.0%) | 0 (0.0%) |
Fertility by Education in Mountain View
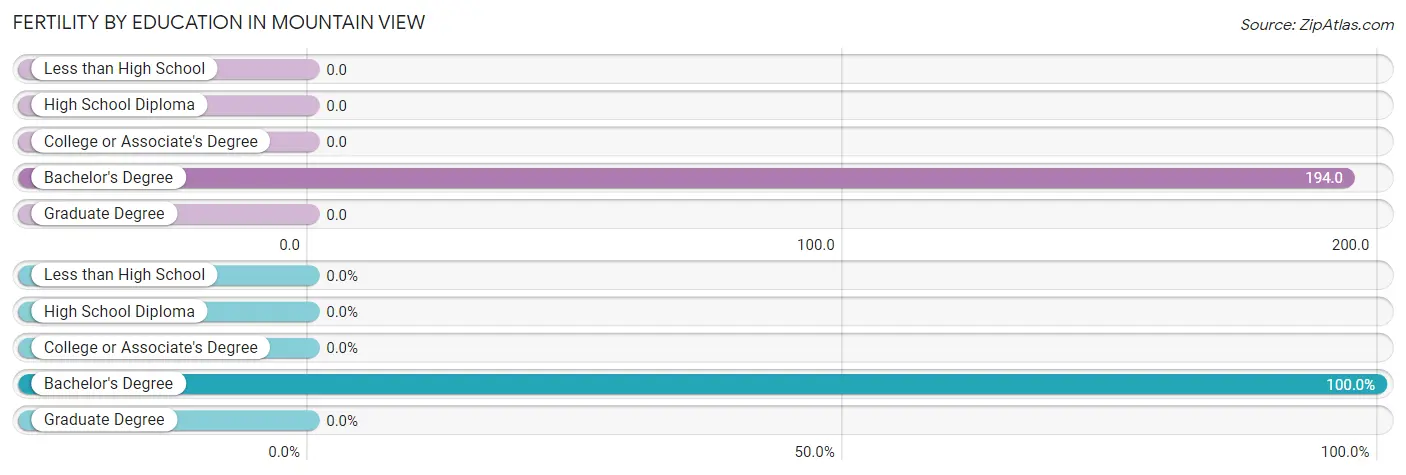
| Educational Attainment | Women with Births | Births / 1,000 Women |
| Less than High School | 0 (0.0%) | 0.0 |
| High School Diploma | 0 (0.0%) | 0.0 |
| College or Associate's Degree | 0 (0.0%) | 0.0 |
| Bachelor's Degree | 14 (100.0%) | 194.0 |
| Graduate Degree | 0 (0.0%) | 0.0 |
| Total | 14 (100.0%) | 16.0 |
Fertility by Education by Marriage Status in Mountain View
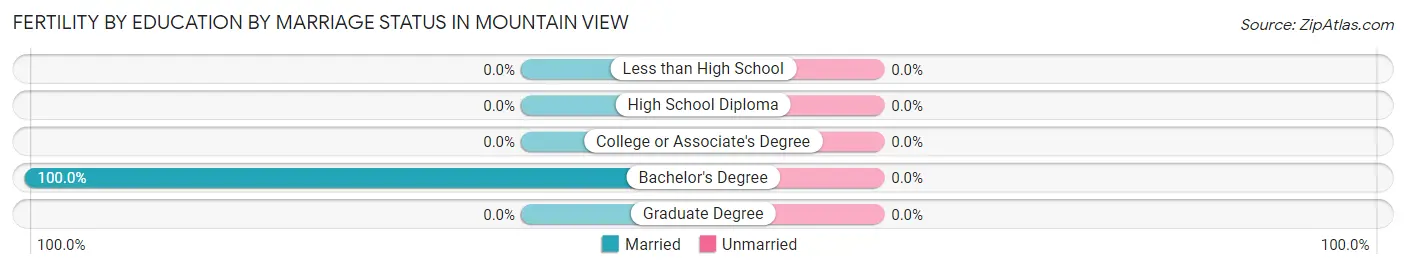
| Educational Attainment | Married | Unmarried |
| Less than High School | 0 (0.0%) | 0 (0.0%) |
| High School Diploma | 0 (0.0%) | 0 (0.0%) |
| College or Associate's Degree | 0 (0.0%) | 0 (0.0%) |
| Bachelor's Degree | 14 (100.0%) | 0 (0.0%) |
| Graduate Degree | 0 (0.0%) | 0 (0.0%) |
| Total | 14 (100.0%) | 0 (0.0%) |
Employment Characteristics in Mountain View
Employment by Class of Employer in Mountain View
Among the 1,629 employed individuals in Mountain View, private company employees (1,209 | 74.2%), state government employees (117 | 7.2%), and not-for-profit organizations (97 | 5.9%) make up the most common classes of employment.
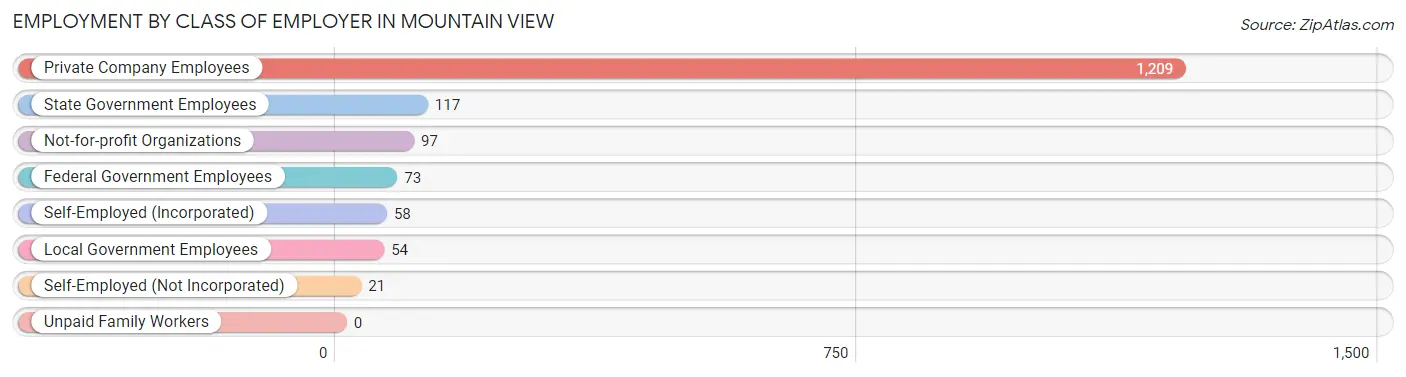
| Employer Class | # Employees | % Employees |
| Private Company Employees | 1,209 | 74.2% |
| Self-Employed (Incorporated) | 58 | 3.6% |
| Self-Employed (Not Incorporated) | 21 | 1.3% |
| Not-for-profit Organizations | 97 | 5.9% |
| Local Government Employees | 54 | 3.3% |
| State Government Employees | 117 | 7.2% |
| Federal Government Employees | 73 | 4.5% |
| Unpaid Family Workers | 0 | 0.0% |
| Total | 1,629 | 100.0% |
Employment Status by Age in Mountain View
According to the labor force statistics for Mountain View, out of the total population over 16 years of age (2,783), 62.7% or 1,745 individuals are in the labor force, with 4.9% or 86 of them unemployed. The age group with the highest labor force participation rate is 25 to 29 years, with 100.0% or 43 individuals in the labor force. Within the labor force, the 75 years and over age range has the highest percentage of unemployed individuals, with 100.0% or 8 of them being unemployed.
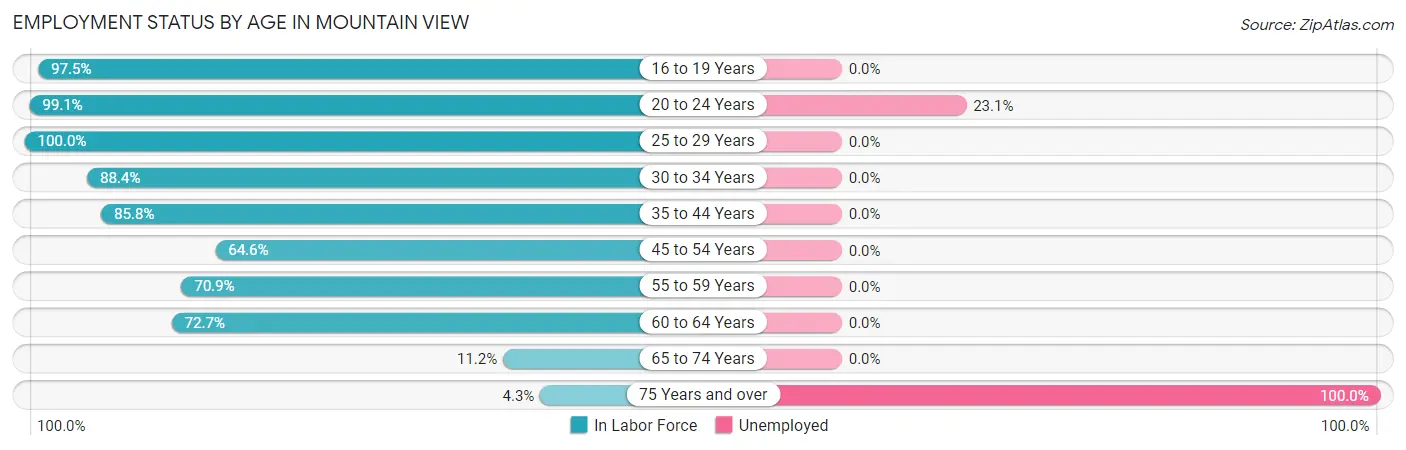
| Age Bracket | In Labor Force | Unemployed |
| 16 to 19 Years | 79 (97.5%) | 0 (0.0%) |
| 20 to 24 Years | 334 (99.1%) | 77 (23.1%) |
| 25 to 29 Years | 43 (100.0%) | 0 (0.0%) |
| 30 to 34 Years | 251 (88.4%) | 0 (0.0%) |
| 35 to 44 Years | 291 (85.8%) | 0 (0.0%) |
| 45 to 54 Years | 288 (64.6%) | 0 (0.0%) |
| 55 to 59 Years | 183 (70.9%) | 0 (0.0%) |
| 60 to 64 Years | 210 (72.7%) | 0 (0.0%) |
| 65 to 74 Years | 58 (11.2%) | 0 (0.0%) |
| 75 Years and over | 8 (4.3%) | 8 (100.0%) |
| Total | 1,745 (62.7%) | 86 (4.9%) |
Employment Status by Educational Attainment in Mountain View
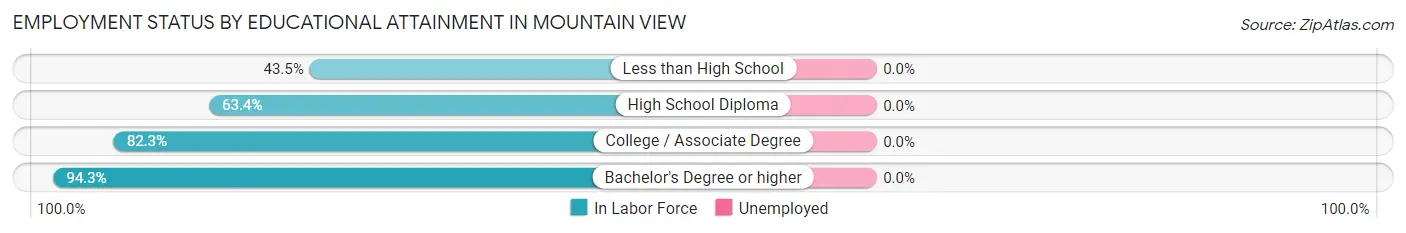
| Educational Attainment | In Labor Force | Unemployed |
| Less than High School | 27 (43.5%) | 0 (0.0%) |
| High School Diploma | 373 (63.4%) | 0 (0.0%) |
| College / Associate Degree | 587 (82.3%) | 0 (0.0%) |
| Bachelor's Degree or higher | 279 (94.3%) | 0 (0.0%) |
| Total | 1,266 (76.3%) | 0 (0.0%) |
Employment Occupations by Sex in Mountain View
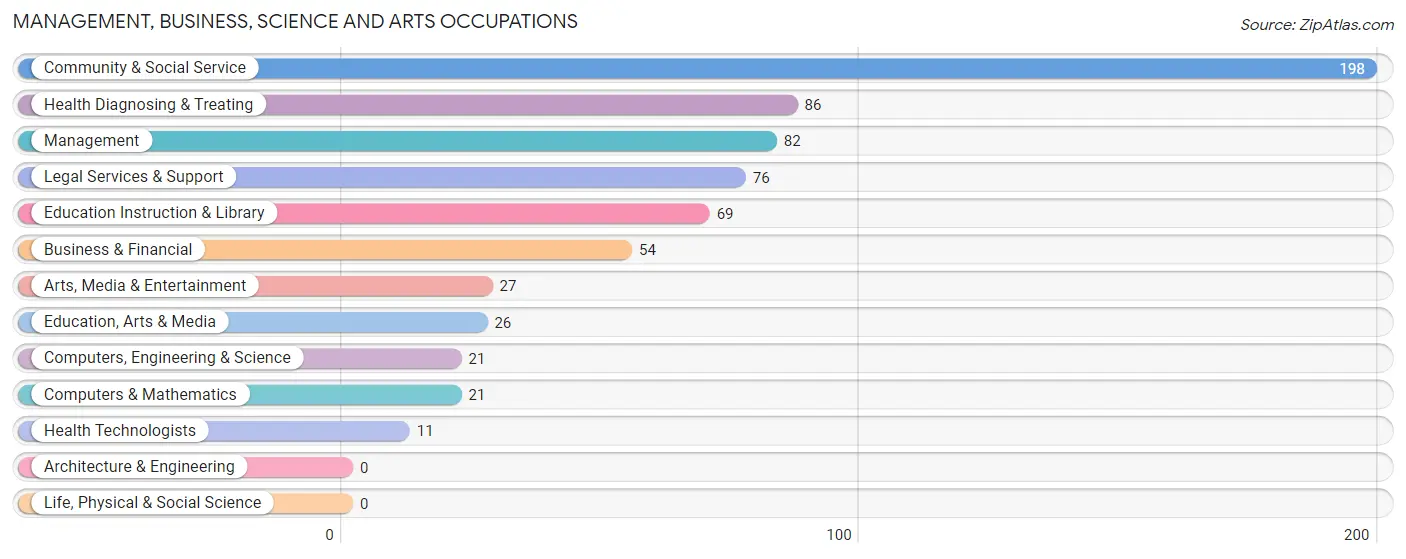
Management, Business, Science and Arts Occupations
The most common Management, Business, Science and Arts occupations in Mountain View are Community & Social Service (198 | 11.9%), Health Diagnosing & Treating (86 | 5.2%), Management (82 | 4.9%), Legal Services & Support (76 | 4.6%), and Education Instruction & Library (69 | 4.2%).
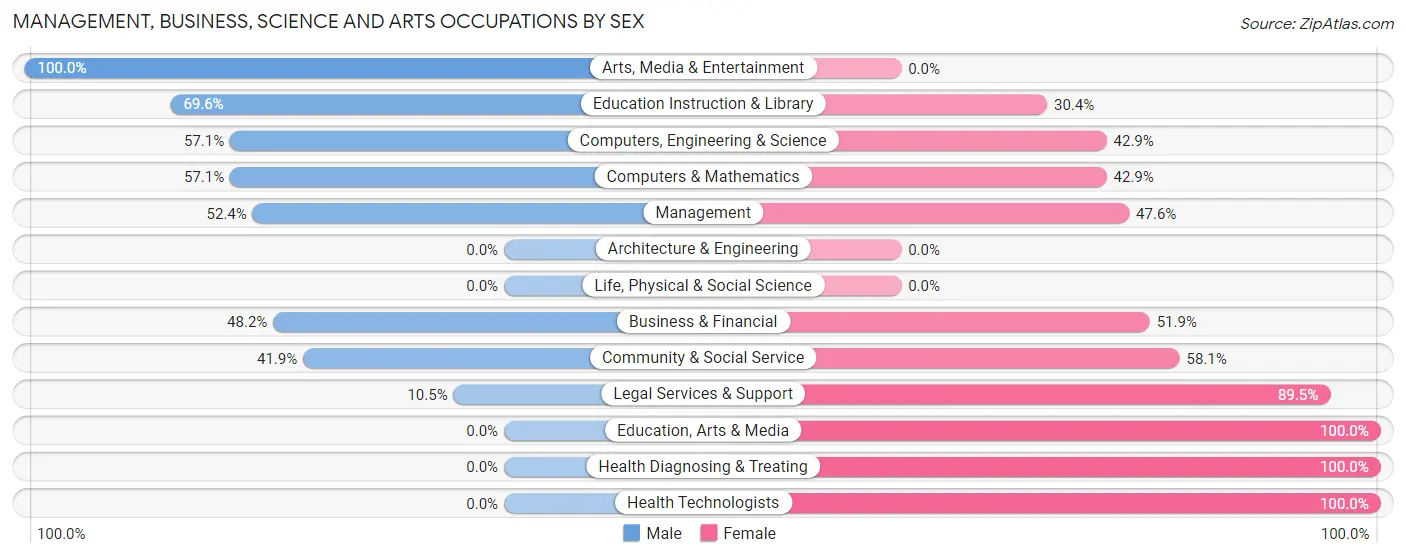
Management, Business, Science and Arts Occupations by Sex
Within the Management, Business, Science and Arts occupations in Mountain View, the most male-oriented occupations are Arts, Media & Entertainment (100.0%), Education Instruction & Library (69.6%), and Computers, Engineering & Science (57.1%), while the most female-oriented occupations are Education, Arts & Media (100.0%), Health Diagnosing & Treating (100.0%), and Health Technologists (100.0%).
| Occupation | Male | Female |
| Management | 43 (52.4%) | 39 (47.6%) |
| Business & Financial | 26 (48.1%) | 28 (51.8%) |
| Computers, Engineering & Science | 12 (57.1%) | 9 (42.9%) |
| Computers & Mathematics | 12 (57.1%) | 9 (42.9%) |
| Architecture & Engineering | 0 (0.0%) | 0 (0.0%) |
| Life, Physical & Social Science | 0 (0.0%) | 0 (0.0%) |
| Community & Social Service | 83 (41.9%) | 115 (58.1%) |
| Education, Arts & Media | 0 (0.0%) | 26 (100.0%) |
| Legal Services & Support | 8 (10.5%) | 68 (89.5%) |
| Education Instruction & Library | 48 (69.6%) | 21 (30.4%) |
| Arts, Media & Entertainment | 27 (100.0%) | 0 (0.0%) |
| Health Diagnosing & Treating | 0 (0.0%) | 86 (100.0%) |
| Health Technologists | 0 (0.0%) | 11 (100.0%) |
| Total (Category) | 164 (37.2%) | 277 (62.8%) |
| Total (Overall) | 763 (46.0%) | 897 (54.0%) |
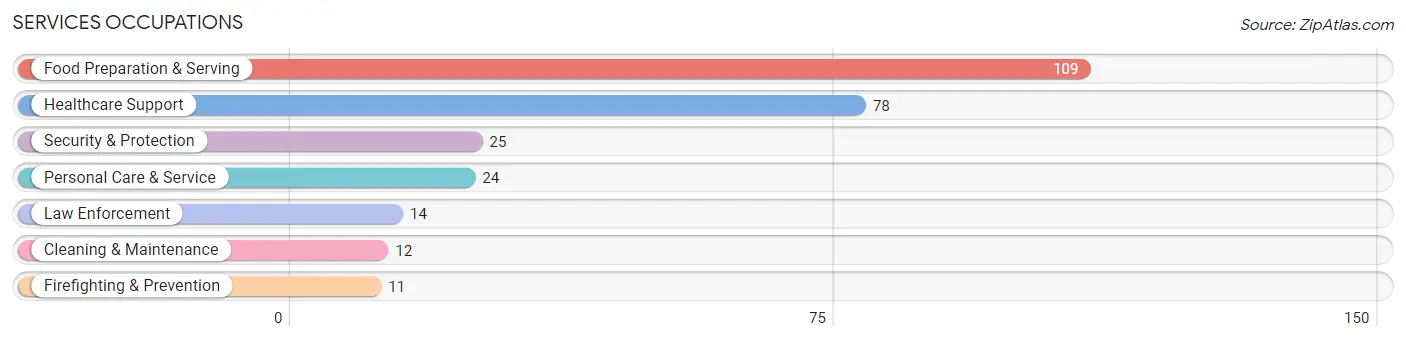
Services Occupations
The most common Services occupations in Mountain View are Food Preparation & Serving (109 | 6.6%), Healthcare Support (78 | 4.7%), Security & Protection (25 | 1.5%), Personal Care & Service (24 | 1.5%), and Law Enforcement (14 | 0.8%).
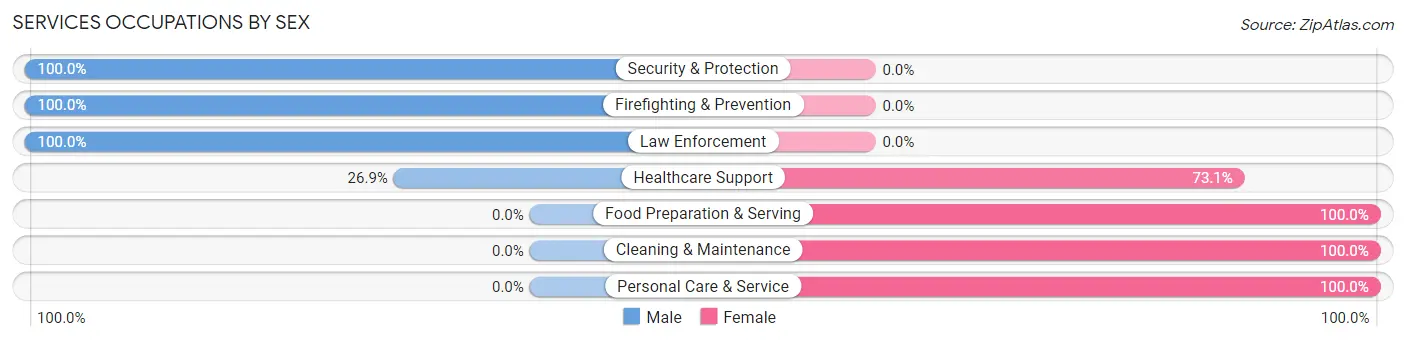
Services Occupations by Sex
Within the Services occupations in Mountain View, the most male-oriented occupations are Security & Protection (100.0%), Firefighting & Prevention (100.0%), and Law Enforcement (100.0%), while the most female-oriented occupations are Food Preparation & Serving (100.0%), Cleaning & Maintenance (100.0%), and Personal Care & Service (100.0%).
| Occupation | Male | Female |
| Healthcare Support | 21 (26.9%) | 57 (73.1%) |
| Security & Protection | 25 (100.0%) | 0 (0.0%) |
| Firefighting & Prevention | 11 (100.0%) | 0 (0.0%) |
| Law Enforcement | 14 (100.0%) | 0 (0.0%) |
| Food Preparation & Serving | 0 (0.0%) | 109 (100.0%) |
| Cleaning & Maintenance | 0 (0.0%) | 12 (100.0%) |
| Personal Care & Service | 0 (0.0%) | 24 (100.0%) |
| Total (Category) | 46 (18.5%) | 202 (81.5%) |
| Total (Overall) | 763 (46.0%) | 897 (54.0%) |
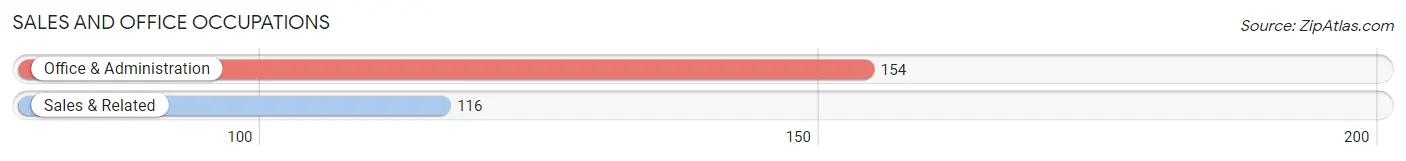
Sales and Office Occupations
The most common Sales and Office occupations in Mountain View are Office & Administration (154 | 9.3%), and Sales & Related (116 | 7.0%).
Sales and Office Occupations by Sex
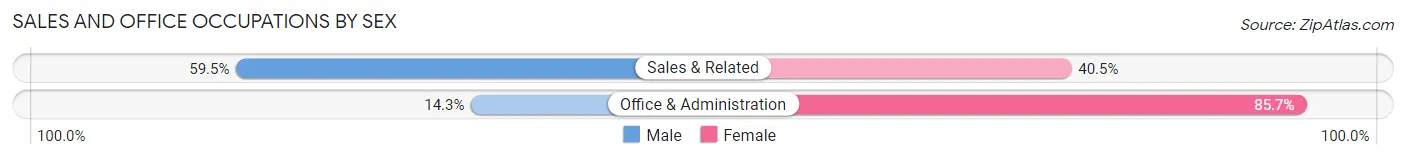
| Occupation | Male | Female |
| Sales & Related | 69 (59.5%) | 47 (40.5%) |
| Office & Administration | 22 (14.3%) | 132 (85.7%) |
| Total (Category) | 91 (33.7%) | 179 (66.3%) |
| Total (Overall) | 763 (46.0%) | 897 (54.0%) |
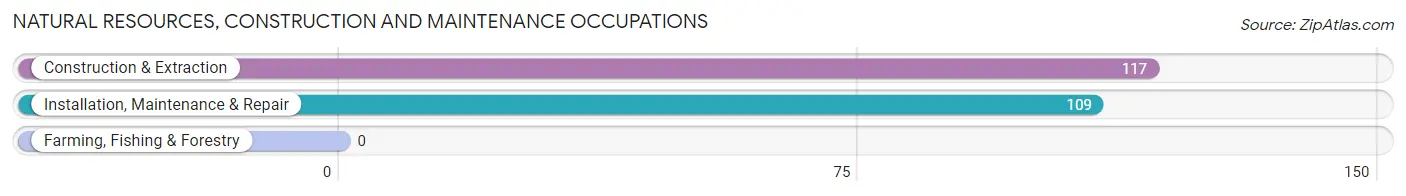
Natural Resources, Construction and Maintenance Occupations
The most common Natural Resources, Construction and Maintenance occupations in Mountain View are Construction & Extraction (117 | 7.0%), and Installation, Maintenance & Repair (109 | 6.6%).
Natural Resources, Construction and Maintenance Occupations by Sex
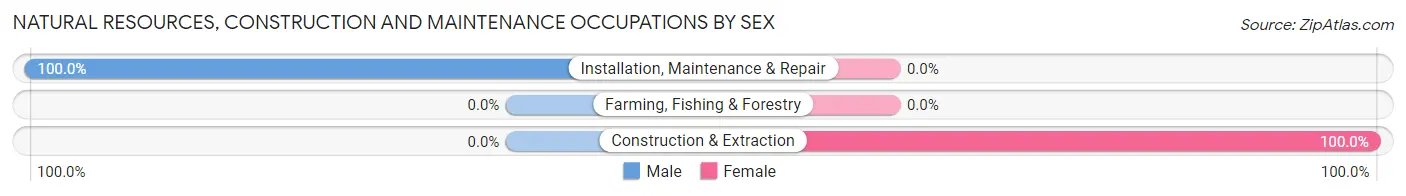
| Occupation | Male | Female |
| Farming, Fishing & Forestry | 0 (0.0%) | 0 (0.0%) |
| Construction & Extraction | 0 (0.0%) | 117 (100.0%) |
| Installation, Maintenance & Repair | 109 (100.0%) | 0 (0.0%) |
| Total (Category) | 109 (48.2%) | 117 (51.8%) |
| Total (Overall) | 763 (46.0%) | 897 (54.0%) |
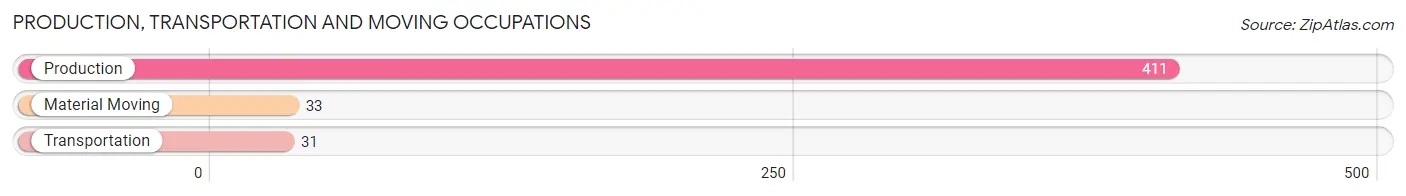
Production, Transportation and Moving Occupations
The most common Production, Transportation and Moving occupations in Mountain View are Production (411 | 24.8%), Material Moving (33 | 2.0%), and Transportation (31 | 1.9%).
Production, Transportation and Moving Occupations by Sex
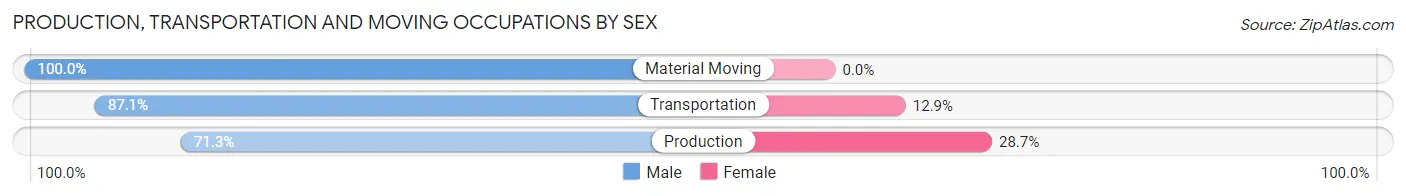
| Occupation | Male | Female |
| Production | 293 (71.3%) | 118 (28.7%) |
| Transportation | 27 (87.1%) | 4 (12.9%) |
| Material Moving | 33 (100.0%) | 0 (0.0%) |
| Total (Category) | 353 (74.3%) | 122 (25.7%) |
| Total (Overall) | 763 (46.0%) | 897 (54.0%) |
Employment Industries by Sex in Mountain View
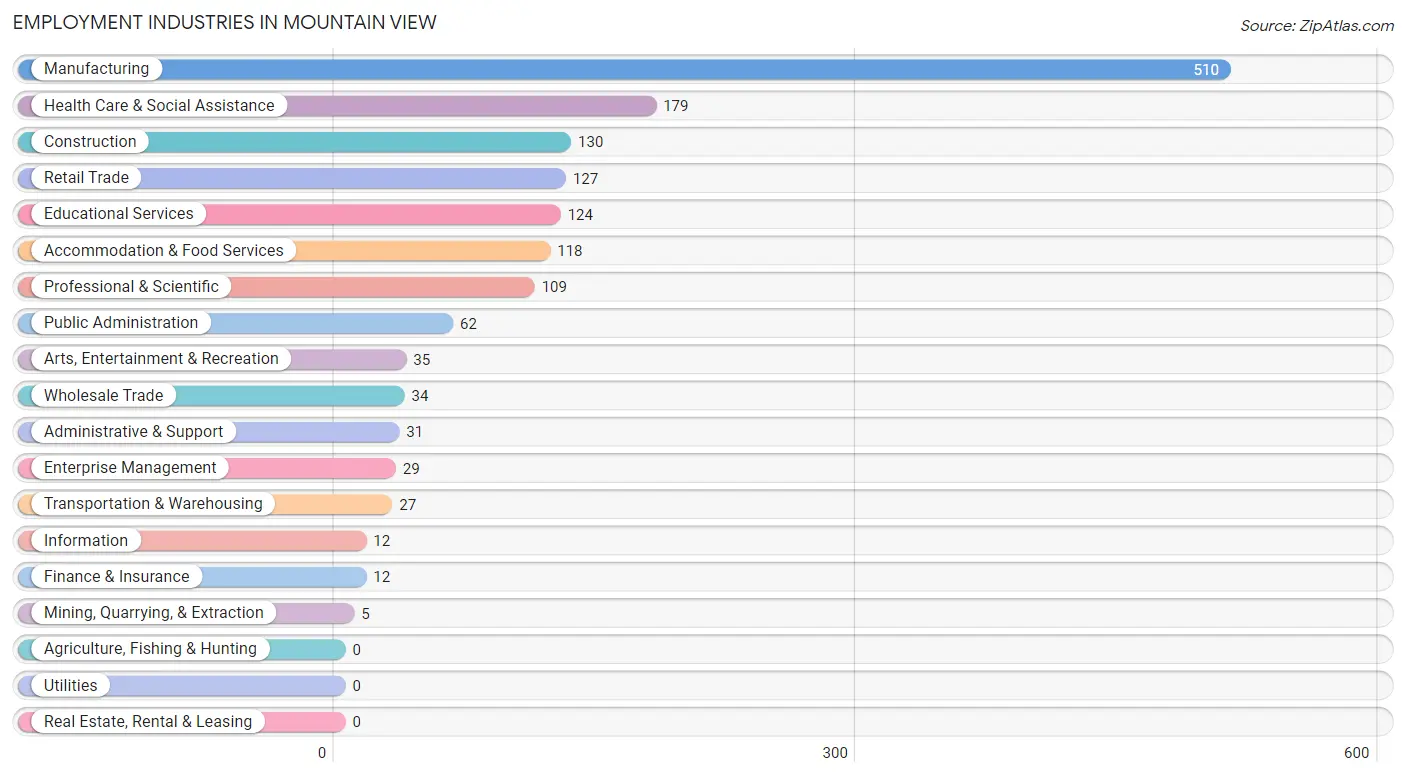
Employment Industries in Mountain View
The major employment industries in Mountain View include Manufacturing (510 | 30.7%), Health Care & Social Assistance (179 | 10.8%), Construction (130 | 7.8%), Retail Trade (127 | 7.6%), and Educational Services (124 | 7.5%).
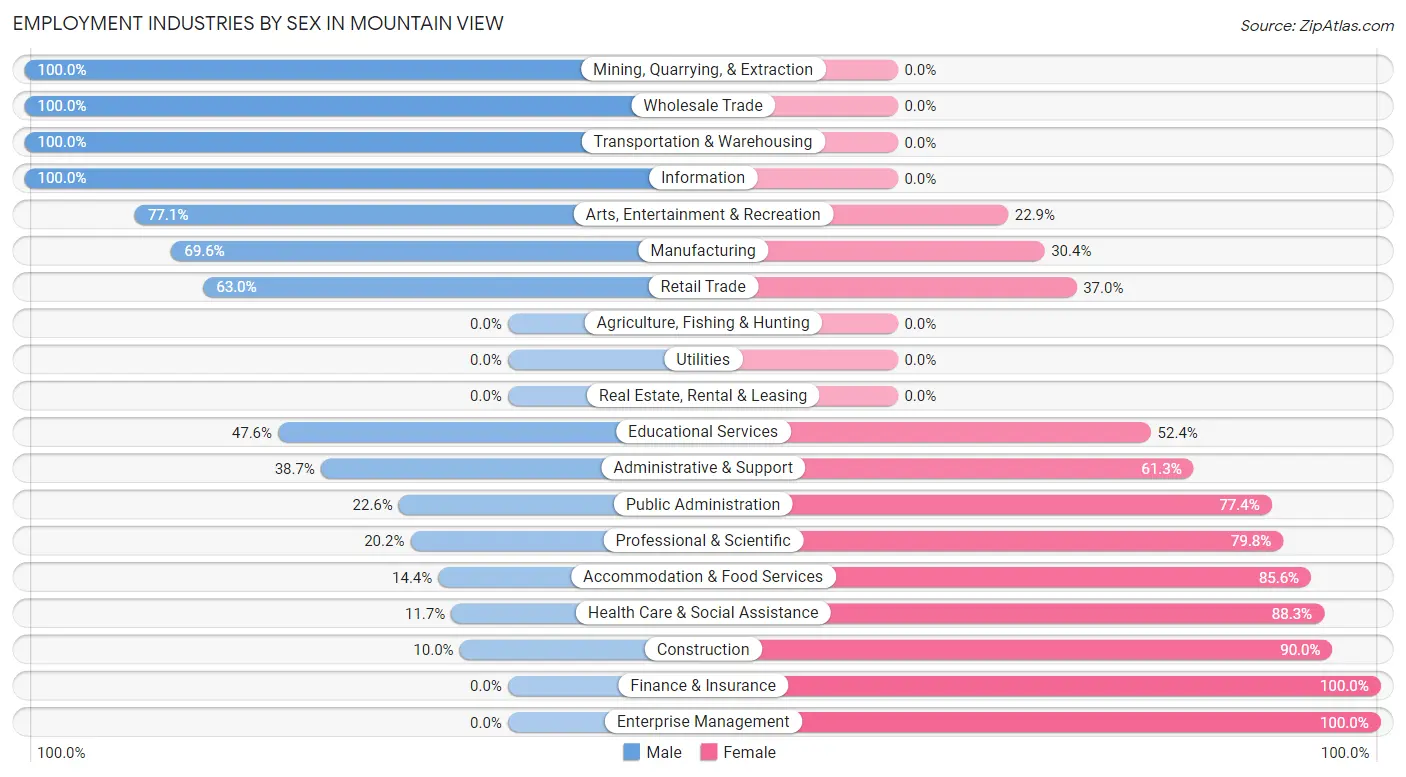
Employment Industries by Sex in Mountain View
The Mountain View industries that see more men than women are Mining, Quarrying, & Extraction (100.0%), Wholesale Trade (100.0%), and Transportation & Warehousing (100.0%), whereas the industries that tend to have a higher number of women are Finance & Insurance (100.0%), Enterprise Management (100.0%), and Construction (90.0%).
| Industry | Male | Female |
| Agriculture, Fishing & Hunting | 0 (0.0%) | 0 (0.0%) |
| Mining, Quarrying, & Extraction | 5 (100.0%) | 0 (0.0%) |
| Construction | 13 (10.0%) | 117 (90.0%) |
| Manufacturing | 355 (69.6%) | 155 (30.4%) |
| Wholesale Trade | 34 (100.0%) | 0 (0.0%) |
| Retail Trade | 80 (63.0%) | 47 (37.0%) |
| Transportation & Warehousing | 27 (100.0%) | 0 (0.0%) |
| Utilities | 0 (0.0%) | 0 (0.0%) |
| Information | 12 (100.0%) | 0 (0.0%) |
| Finance & Insurance | 0 (0.0%) | 12 (100.0%) |
| Real Estate, Rental & Leasing | 0 (0.0%) | 0 (0.0%) |
| Professional & Scientific | 22 (20.2%) | 87 (79.8%) |
| Enterprise Management | 0 (0.0%) | 29 (100.0%) |
| Administrative & Support | 12 (38.7%) | 19 (61.3%) |
| Educational Services | 59 (47.6%) | 65 (52.4%) |
| Health Care & Social Assistance | 21 (11.7%) | 158 (88.3%) |
| Arts, Entertainment & Recreation | 27 (77.1%) | 8 (22.9%) |
| Accommodation & Food Services | 17 (14.4%) | 101 (85.6%) |
| Public Administration | 14 (22.6%) | 48 (77.4%) |
| Total | 763 (46.0%) | 897 (54.0%) |
Education in Mountain View
School Enrollment in Mountain View
The most common levels of schooling among the 529 students in Mountain View are elementary school (162 | 30.6%), middle school (144 | 27.2%), and high school (109 | 20.6%).
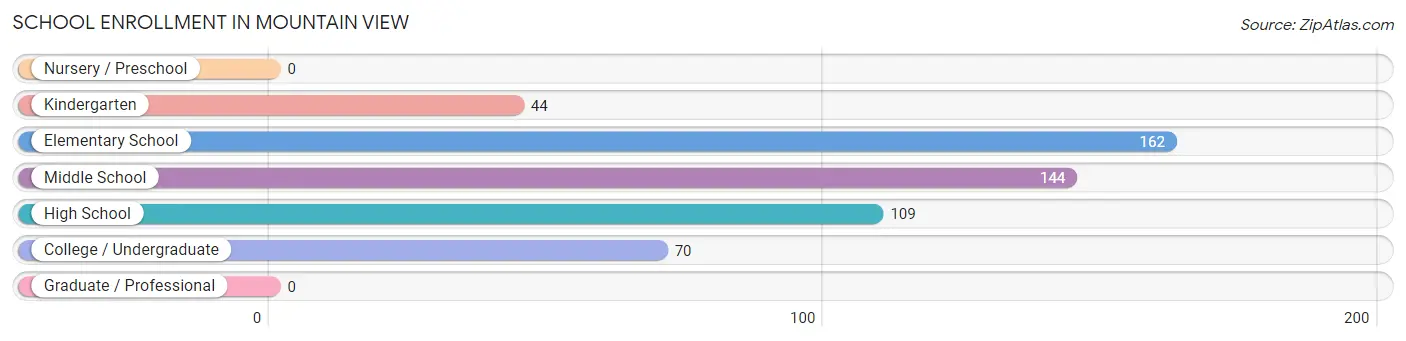
| School Level | # Students | % Students |
| Nursery / Preschool | 0 | 0.0% |
| Kindergarten | 44 | 8.3% |
| Elementary School | 162 | 30.6% |
| Middle School | 144 | 27.2% |
| High School | 109 | 20.6% |
| College / Undergraduate | 70 | 13.2% |
| Graduate / Professional | 0 | 0.0% |
| Total | 529 | 100.0% |
School Enrollment by Age by Funding Source in Mountain View
Out of a total of 529 students who are enrolled in schools in Mountain View, 154 (29.1%) attend a private institution, while the remaining 375 (70.9%) are enrolled in public schools. The age group of 20 to 24 year olds has the highest likelihood of being enrolled in private schools, with 61 (98.4% in the age bracket) enrolled. Conversely, the age group of 5 to 9 year old has the lowest likelihood of being enrolled in a private school, with 181 (100.0% in the age bracket) attending a public institution.
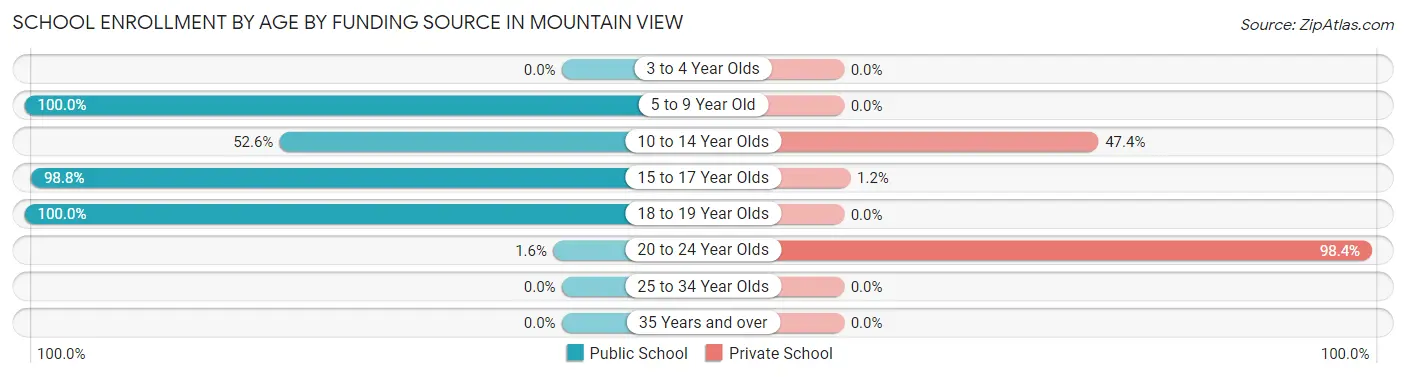
| Age Bracket | Public School | Private School |
| 3 to 4 Year Olds | 0 (0.0%) | 0 (0.0%) |
| 5 to 9 Year Old | 181 (100.0%) | 0 (0.0%) |
| 10 to 14 Year Olds | 102 (52.6%) | 92 (47.4%) |
| 15 to 17 Year Olds | 82 (98.8%) | 1 (1.2%) |
| 18 to 19 Year Olds | 9 (100.0%) | 0 (0.0%) |
| 20 to 24 Year Olds | 1 (1.6%) | 61 (98.4%) |
| 25 to 34 Year Olds | 0 (0.0%) | 0 (0.0%) |
| 35 Years and over | 0 (0.0%) | 0 (0.0%) |
| Total | 375 (70.9%) | 154 (29.1%) |
Educational Attainment by Field of Study in Mountain View
Business (85 | 19.4%), education (79 | 18.0%), arts & humanities (54 | 12.3%), literature & languages (48 | 10.9%), and bio, nature & agricultural (45 | 10.2%) are the most common fields of study among 439 individuals in Mountain View who have obtained a bachelor's degree or higher.
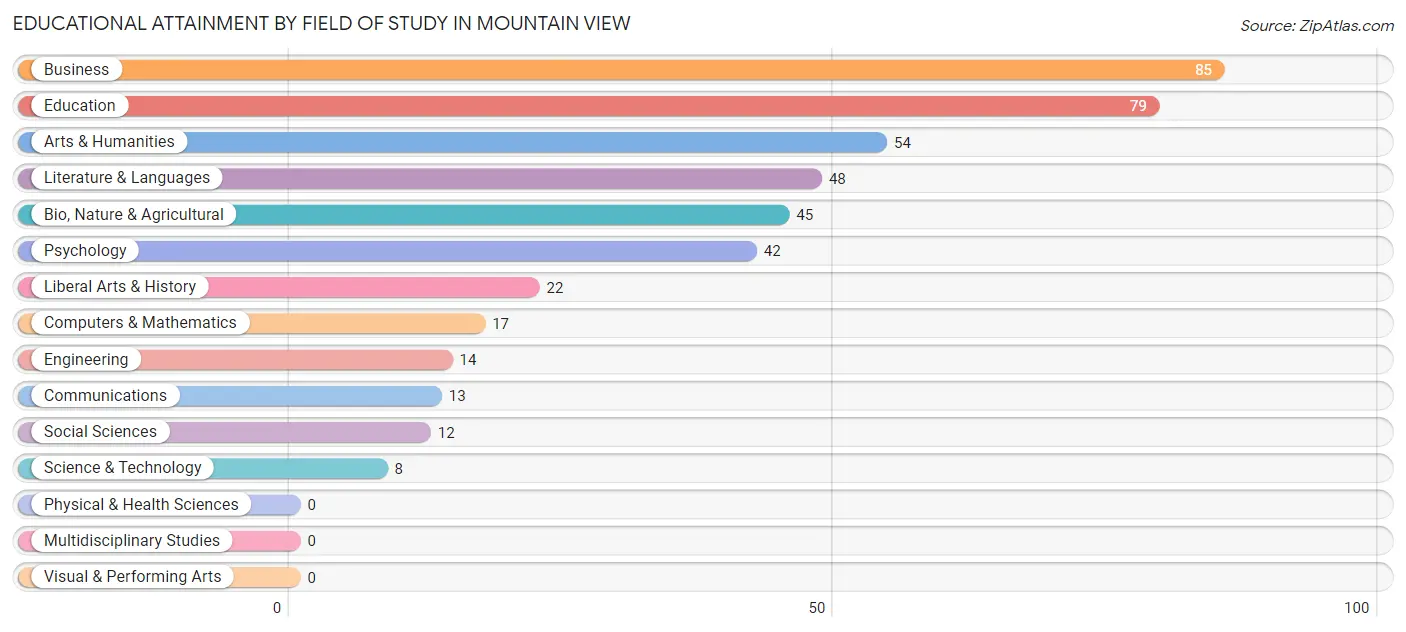
| Field of Study | # Graduates | % Graduates |
| Computers & Mathematics | 17 | 3.9% |
| Bio, Nature & Agricultural | 45 | 10.2% |
| Physical & Health Sciences | 0 | 0.0% |
| Psychology | 42 | 9.6% |
| Social Sciences | 12 | 2.7% |
| Engineering | 14 | 3.2% |
| Multidisciplinary Studies | 0 | 0.0% |
| Science & Technology | 8 | 1.8% |
| Business | 85 | 19.4% |
| Education | 79 | 18.0% |
| Literature & Languages | 48 | 10.9% |
| Liberal Arts & History | 22 | 5.0% |
| Visual & Performing Arts | 0 | 0.0% |
| Communications | 13 | 3.0% |
| Arts & Humanities | 54 | 12.3% |
| Total | 439 | 100.0% |
Transportation & Commute in Mountain View
Vehicle Availability by Sex in Mountain View
The most prevalent vehicle ownership categories in Mountain View are males with 2 vehicles (379, accounting for 49.7%) and females with 2 vehicles (328, making up 43.8%).
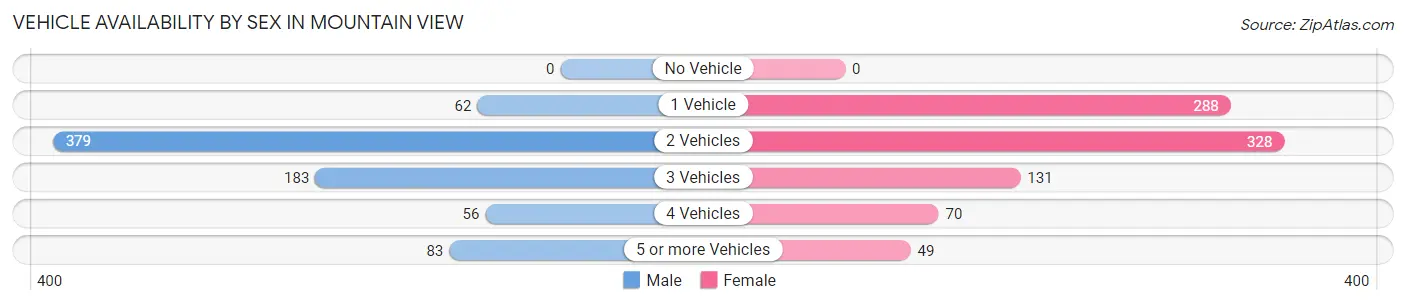
| Vehicles Available | Male | Female |
| No Vehicle | 0 (0.0%) | 0 (0.0%) |
| 1 Vehicle | 62 (8.1%) | 288 (33.3%) |
| 2 Vehicles | 379 (49.7%) | 328 (37.9%) |
| 3 Vehicles | 183 (24.0%) | 131 (15.1%) |
| 4 Vehicles | 56 (7.3%) | 70 (8.1%) |
| 5 or more Vehicles | 83 (10.9%) | 49 (5.7%) |
| Total | 763 (100.0%) | 866 (100.0%) |
Commute Time in Mountain View
The most frequently occuring commute durations in Mountain View are 10 to 14 minutes (410 commuters, 26.4%), 15 to 19 minutes (366 commuters, 23.5%), and 20 to 24 minutes (210 commuters, 13.5%).
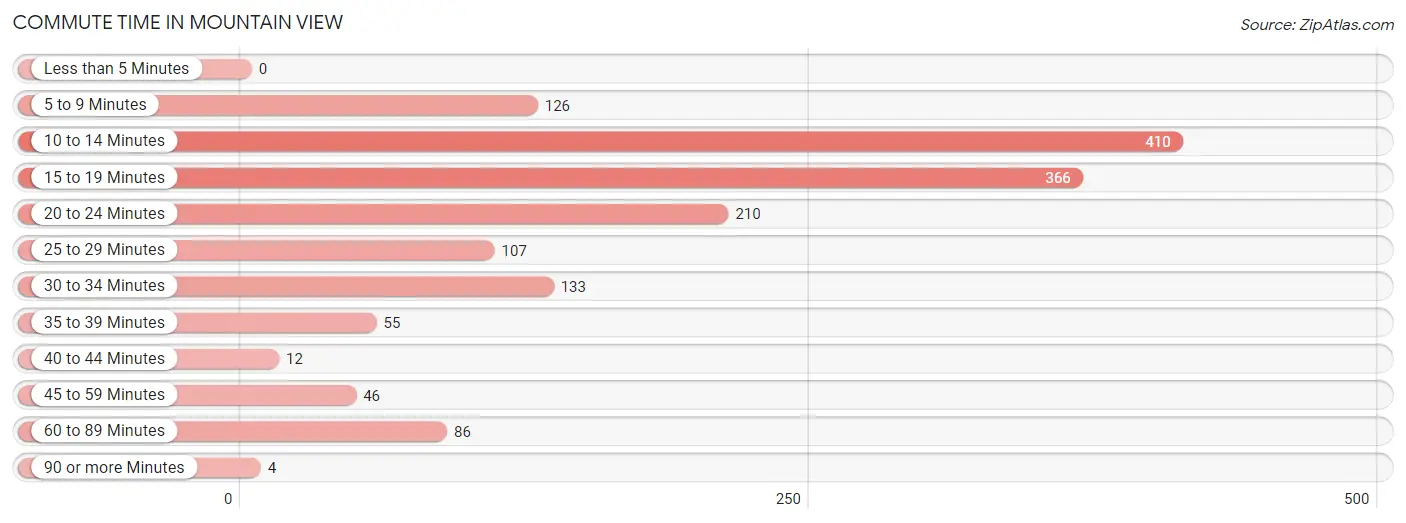
| Commute Time | # Commuters | % Commuters |
| Less than 5 Minutes | 0 | 0.0% |
| 5 to 9 Minutes | 126 | 8.1% |
| 10 to 14 Minutes | 410 | 26.4% |
| 15 to 19 Minutes | 366 | 23.5% |
| 20 to 24 Minutes | 210 | 13.5% |
| 25 to 29 Minutes | 107 | 6.9% |
| 30 to 34 Minutes | 133 | 8.6% |
| 35 to 39 Minutes | 55 | 3.5% |
| 40 to 44 Minutes | 12 | 0.8% |
| 45 to 59 Minutes | 46 | 3.0% |
| 60 to 89 Minutes | 86 | 5.5% |
| 90 or more Minutes | 4 | 0.3% |
Commute Time by Sex in Mountain View
The most common commute times in Mountain View are 10 to 14 minutes (208 commuters, 28.2%) for males and 10 to 14 minutes (202 commuters, 24.7%) for females.
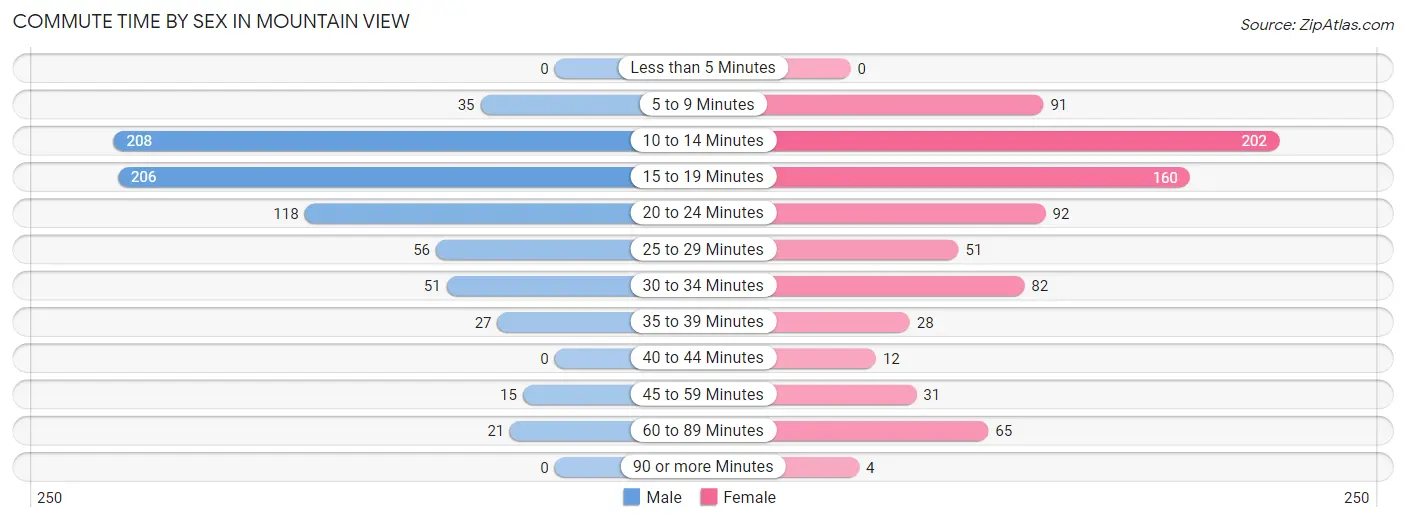
| Commute Time | Male | Female |
| Less than 5 Minutes | 0 (0.0%) | 0 (0.0%) |
| 5 to 9 Minutes | 35 (4.8%) | 91 (11.1%) |
| 10 to 14 Minutes | 208 (28.2%) | 202 (24.7%) |
| 15 to 19 Minutes | 206 (28.0%) | 160 (19.6%) |
| 20 to 24 Minutes | 118 (16.0%) | 92 (11.3%) |
| 25 to 29 Minutes | 56 (7.6%) | 51 (6.2%) |
| 30 to 34 Minutes | 51 (6.9%) | 82 (10.0%) |
| 35 to 39 Minutes | 27 (3.7%) | 28 (3.4%) |
| 40 to 44 Minutes | 0 (0.0%) | 12 (1.5%) |
| 45 to 59 Minutes | 15 (2.0%) | 31 (3.8%) |
| 60 to 89 Minutes | 21 (2.9%) | 65 (8.0%) |
| 90 or more Minutes | 0 (0.0%) | 4 (0.5%) |
Time of Departure to Work by Sex in Mountain View
The most frequent times of departure to work in Mountain View are 6:30 AM to 6:59 AM (138, 18.7%) for males and 7:30 AM to 7:59 AM (177, 21.6%) for females.
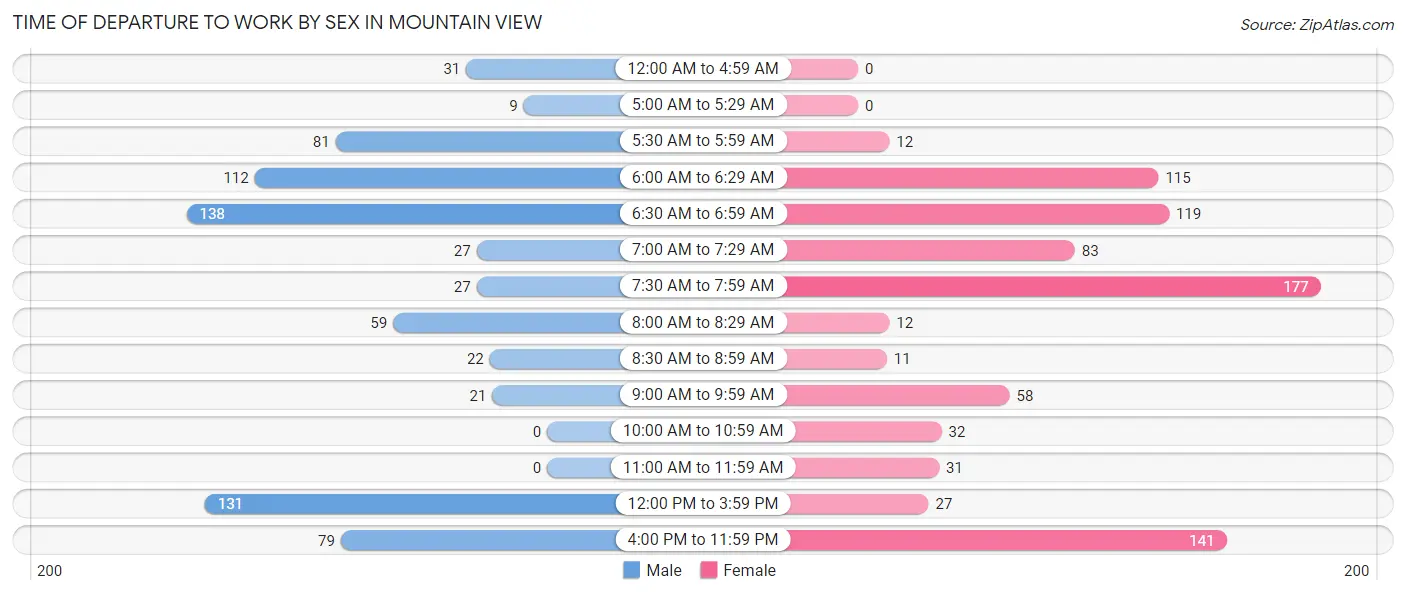
| Time of Departure | Male | Female |
| 12:00 AM to 4:59 AM | 31 (4.2%) | 0 (0.0%) |
| 5:00 AM to 5:29 AM | 9 (1.2%) | 0 (0.0%) |
| 5:30 AM to 5:59 AM | 81 (11.0%) | 12 (1.5%) |
| 6:00 AM to 6:29 AM | 112 (15.2%) | 115 (14.1%) |
| 6:30 AM to 6:59 AM | 138 (18.7%) | 119 (14.5%) |
| 7:00 AM to 7:29 AM | 27 (3.7%) | 83 (10.2%) |
| 7:30 AM to 7:59 AM | 27 (3.7%) | 177 (21.6%) |
| 8:00 AM to 8:29 AM | 59 (8.0%) | 12 (1.5%) |
| 8:30 AM to 8:59 AM | 22 (3.0%) | 11 (1.3%) |
| 9:00 AM to 9:59 AM | 21 (2.9%) | 58 (7.1%) |
| 10:00 AM to 10:59 AM | 0 (0.0%) | 32 (3.9%) |
| 11:00 AM to 11:59 AM | 0 (0.0%) | 31 (3.8%) |
| 12:00 PM to 3:59 PM | 131 (17.8%) | 27 (3.3%) |
| 4:00 PM to 11:59 PM | 79 (10.7%) | 141 (17.2%) |
| Total | 737 (100.0%) | 818 (100.0%) |
Housing Occupancy in Mountain View
Occupancy by Ownership in Mountain View
Of the total 1,331 dwellings in Mountain View, owner-occupied units account for 970 (72.9%), while renter-occupied units make up 361 (27.1%).
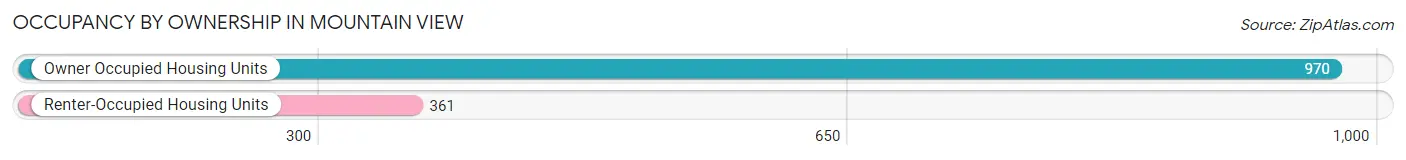
| Occupancy | # Housing Units | % Housing Units |
| Owner Occupied Housing Units | 970 | 72.9% |
| Renter-Occupied Housing Units | 361 | 27.1% |
| Total Occupied Housing Units | 1,331 | 100.0% |
Occupancy by Household Size in Mountain View
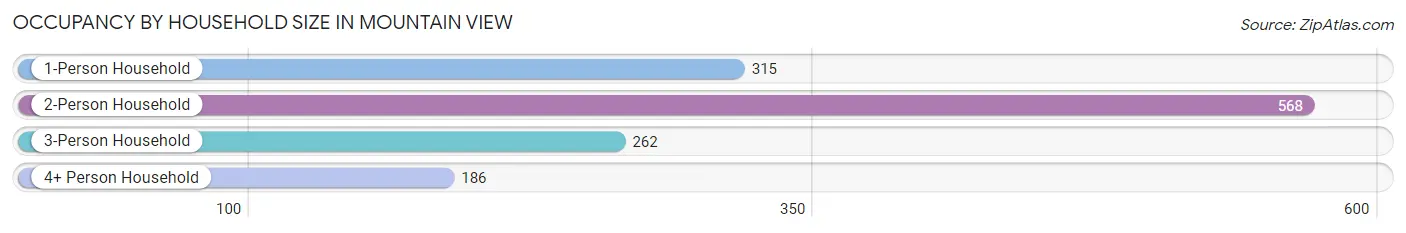
| Household Size | # Housing Units | % Housing Units |
| 1-Person Household | 315 | 23.7% |
| 2-Person Household | 568 | 42.7% |
| 3-Person Household | 262 | 19.7% |
| 4+ Person Household | 186 | 14.0% |
| Total Housing Units | 1,331 | 100.0% |
Occupancy by Ownership by Household Size in Mountain View
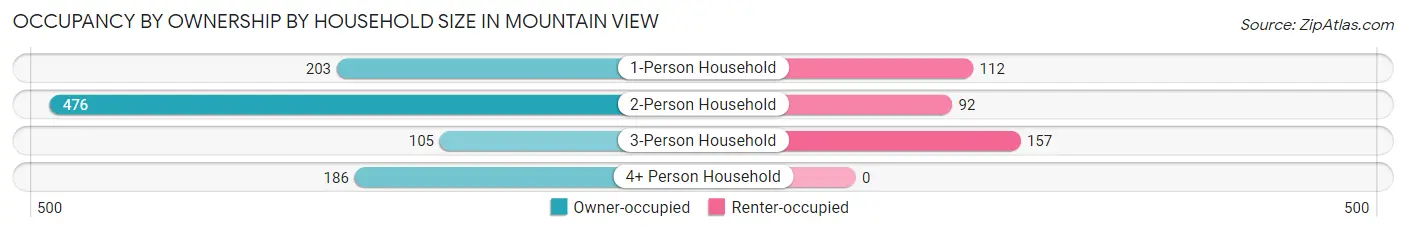
| Household Size | Owner-occupied | Renter-occupied |
| 1-Person Household | 203 (64.4%) | 112 (35.6%) |
| 2-Person Household | 476 (83.8%) | 92 (16.2%) |
| 3-Person Household | 105 (40.1%) | 157 (59.9%) |
| 4+ Person Household | 186 (100.0%) | 0 (0.0%) |
| Total Housing Units | 970 (72.9%) | 361 (27.1%) |
Occupancy by Educational Attainment in Mountain View
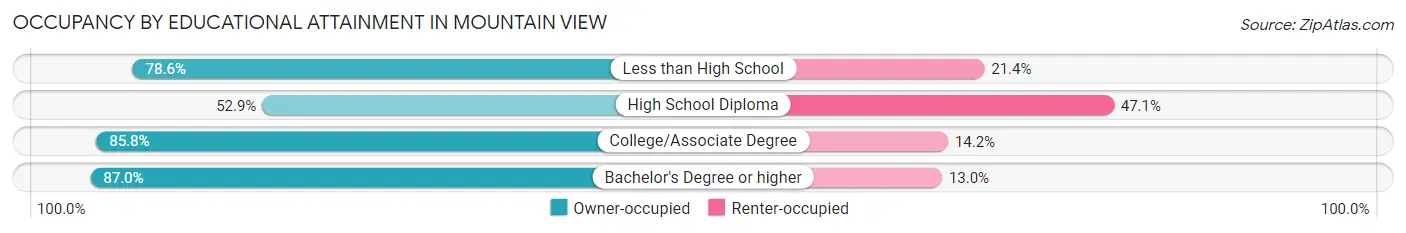
| Household Size | Owner-occupied | Renter-occupied |
| Less than High School | 99 (78.6%) | 27 (21.4%) |
| High School Diploma | 265 (52.9%) | 236 (47.1%) |
| College/Associate Degree | 446 (85.8%) | 74 (14.2%) |
| Bachelor's Degree or higher | 160 (87.0%) | 24 (13.0%) |
Occupancy by Age of Householder in Mountain View
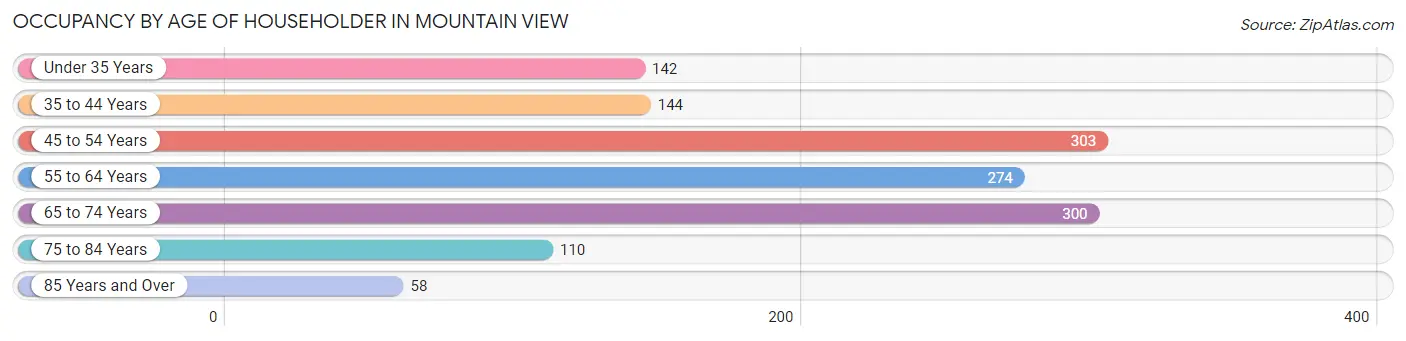
| Age Bracket | # Households | % Households |
| Under 35 Years | 142 | 10.7% |
| 35 to 44 Years | 144 | 10.8% |
| 45 to 54 Years | 303 | 22.8% |
| 55 to 64 Years | 274 | 20.6% |
| 65 to 74 Years | 300 | 22.5% |
| 75 to 84 Years | 110 | 8.3% |
| 85 Years and Over | 58 | 4.4% |
| Total | 1,331 | 100.0% |
Housing Finances in Mountain View
Median Income by Occupancy in Mountain View
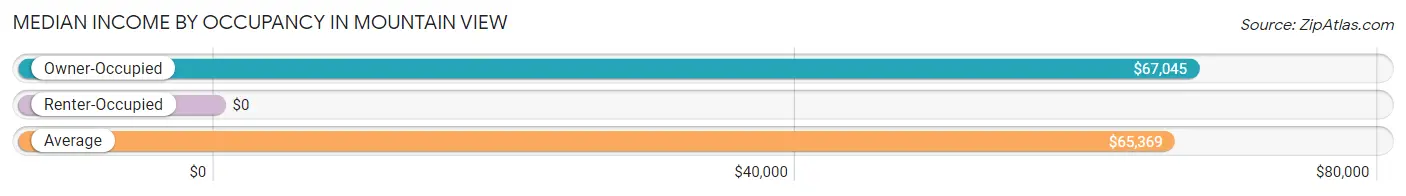
| Occupancy Type | # Households | Median Income |
| Owner-Occupied | 970 (72.9%) | $67,045 |
| Renter-Occupied | 361 (27.1%) | $0 |
| Average | 1,331 (100.0%) | $65,369 |
Occupancy by Householder Income Bracket in Mountain View
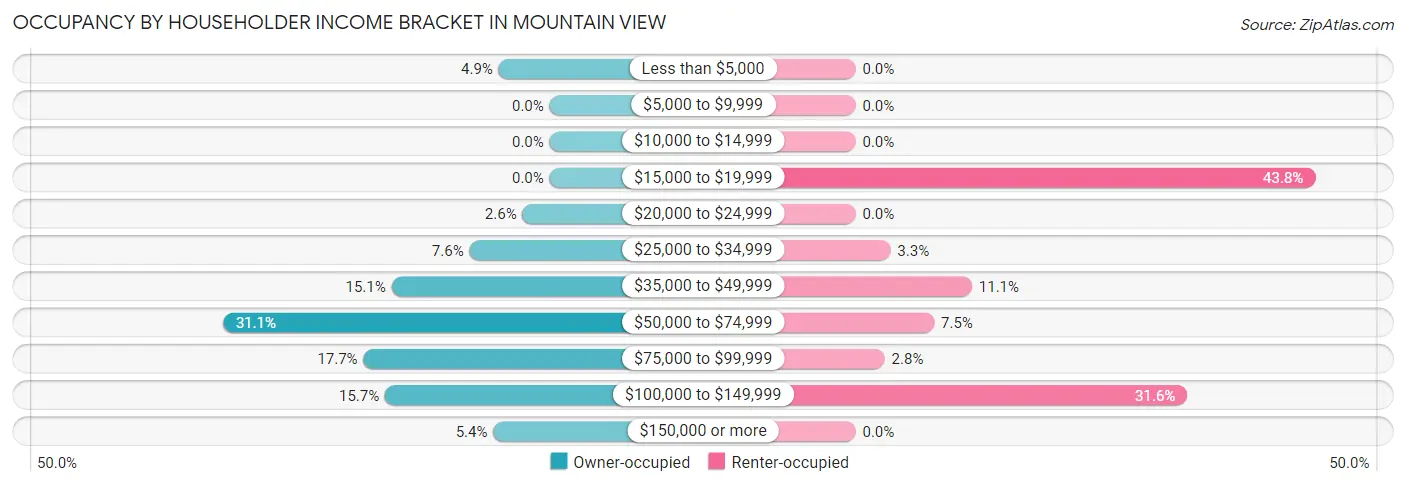
| Income Bracket | Owner-occupied | Renter-occupied |
| Less than $5,000 | 47 (4.9%) | 0 (0.0%) |
| $5,000 to $9,999 | 0 (0.0%) | 0 (0.0%) |
| $10,000 to $14,999 | 0 (0.0%) | 0 (0.0%) |
| $15,000 to $19,999 | 0 (0.0%) | 158 (43.8%) |
| $20,000 to $24,999 | 25 (2.6%) | 0 (0.0%) |
| $25,000 to $34,999 | 74 (7.6%) | 12 (3.3%) |
| $35,000 to $49,999 | 146 (15.0%) | 40 (11.1%) |
| $50,000 to $74,999 | 302 (31.1%) | 27 (7.5%) |
| $75,000 to $99,999 | 172 (17.7%) | 10 (2.8%) |
| $100,000 to $149,999 | 152 (15.7%) | 114 (31.6%) |
| $150,000 or more | 52 (5.4%) | 0 (0.0%) |
| Total | 970 (100.0%) | 361 (100.0%) |
Monthly Housing Cost Tiers in Mountain View
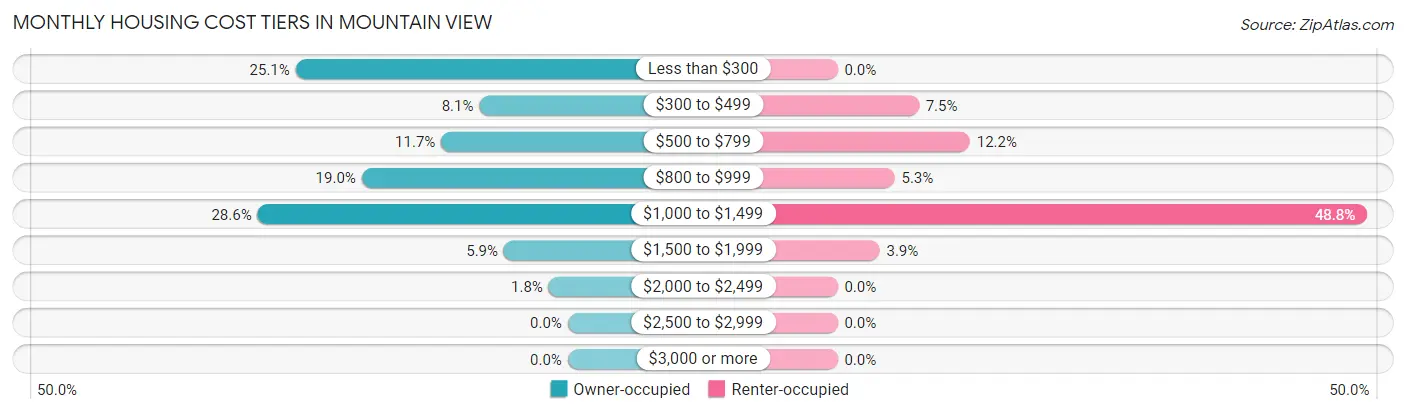
| Monthly Cost | Owner-occupied | Renter-occupied |
| Less than $300 | 243 (25.1%) | 0 (0.0%) |
| $300 to $499 | 79 (8.1%) | 27 (7.5%) |
| $500 to $799 | 113 (11.7%) | 44 (12.2%) |
| $800 to $999 | 184 (19.0%) | 19 (5.3%) |
| $1,000 to $1,499 | 277 (28.6%) | 176 (48.7%) |
| $1,500 to $1,999 | 57 (5.9%) | 14 (3.9%) |
| $2,000 to $2,499 | 17 (1.8%) | 0 (0.0%) |
| $2,500 to $2,999 | 0 (0.0%) | 0 (0.0%) |
| $3,000 or more | 0 (0.0%) | 0 (0.0%) |
| Total | 970 (100.0%) | 361 (100.0%) |
Physical Housing Characteristics in Mountain View
Housing Structures in Mountain View
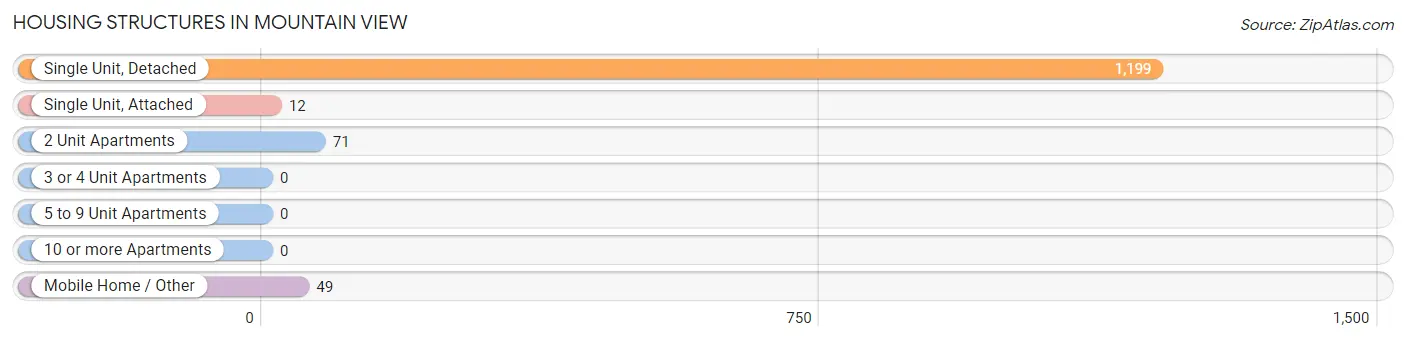
| Structure Type | # Housing Units | % Housing Units |
| Single Unit, Detached | 1,199 | 90.1% |
| Single Unit, Attached | 12 | 0.9% |
| 2 Unit Apartments | 71 | 5.3% |
| 3 or 4 Unit Apartments | 0 | 0.0% |
| 5 to 9 Unit Apartments | 0 | 0.0% |
| 10 or more Apartments | 0 | 0.0% |
| Mobile Home / Other | 49 | 3.7% |
| Total | 1,331 | 100.0% |
Housing Structures by Occupancy in Mountain View
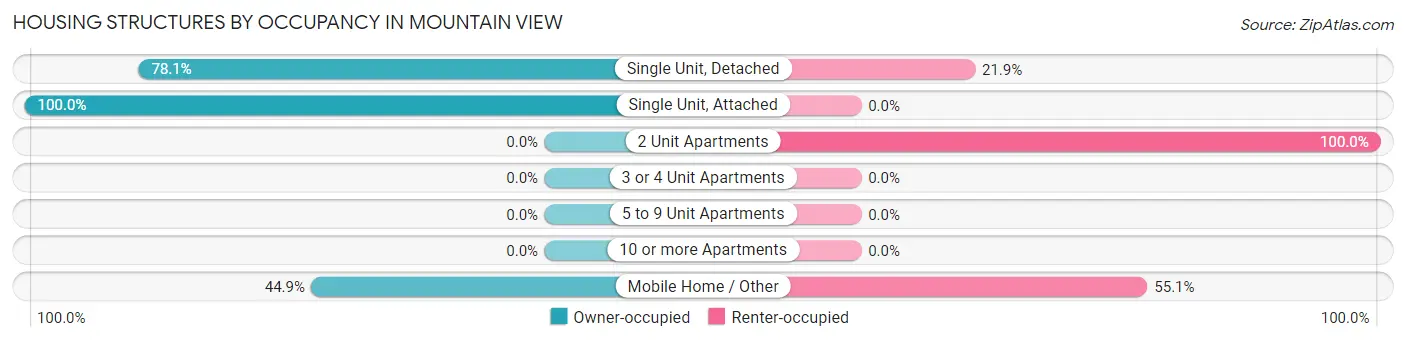
| Structure Type | Owner-occupied | Renter-occupied |
| Single Unit, Detached | 936 (78.1%) | 263 (21.9%) |
| Single Unit, Attached | 12 (100.0%) | 0 (0.0%) |
| 2 Unit Apartments | 0 (0.0%) | 71 (100.0%) |
| 3 or 4 Unit Apartments | 0 (0.0%) | 0 (0.0%) |
| 5 to 9 Unit Apartments | 0 (0.0%) | 0 (0.0%) |
| 10 or more Apartments | 0 (0.0%) | 0 (0.0%) |
| Mobile Home / Other | 22 (44.9%) | 27 (55.1%) |
| Total | 970 (72.9%) | 361 (27.1%) |
Housing Structures by Number of Rooms in Mountain View
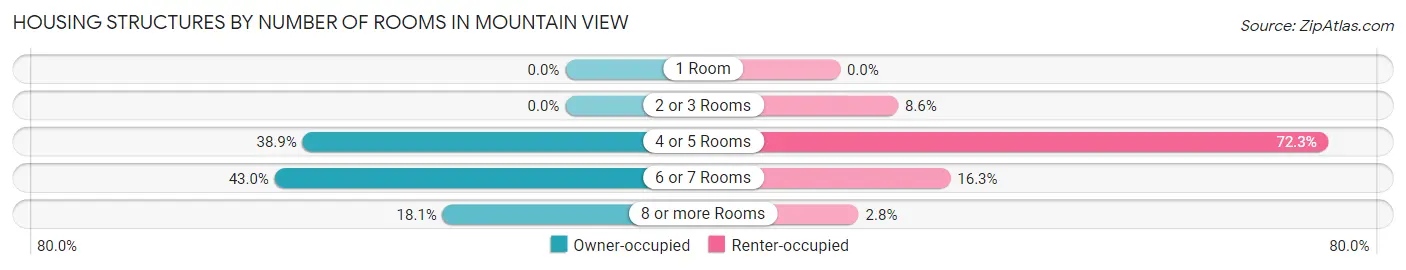
| Number of Rooms | Owner-occupied | Renter-occupied |
| 1 Room | 0 (0.0%) | 0 (0.0%) |
| 2 or 3 Rooms | 0 (0.0%) | 31 (8.6%) |
| 4 or 5 Rooms | 377 (38.9%) | 261 (72.3%) |
| 6 or 7 Rooms | 417 (43.0%) | 59 (16.3%) |
| 8 or more Rooms | 176 (18.1%) | 10 (2.8%) |
| Total | 970 (100.0%) | 361 (100.0%) |
Housing Structure by Heating Type in Mountain View
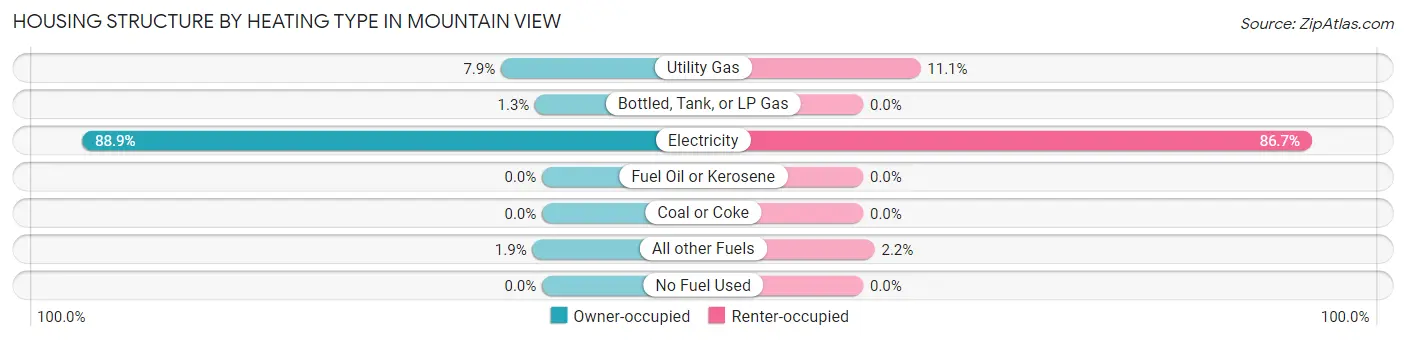
| Heating Type | Owner-occupied | Renter-occupied |
| Utility Gas | 77 (7.9%) | 40 (11.1%) |
| Bottled, Tank, or LP Gas | 13 (1.3%) | 0 (0.0%) |
| Electricity | 862 (88.9%) | 313 (86.7%) |
| Fuel Oil or Kerosene | 0 (0.0%) | 0 (0.0%) |
| Coal or Coke | 0 (0.0%) | 0 (0.0%) |
| All other Fuels | 18 (1.9%) | 8 (2.2%) |
| No Fuel Used | 0 (0.0%) | 0 (0.0%) |
| Total | 970 (100.0%) | 361 (100.0%) |
Household Vehicle Usage in Mountain View
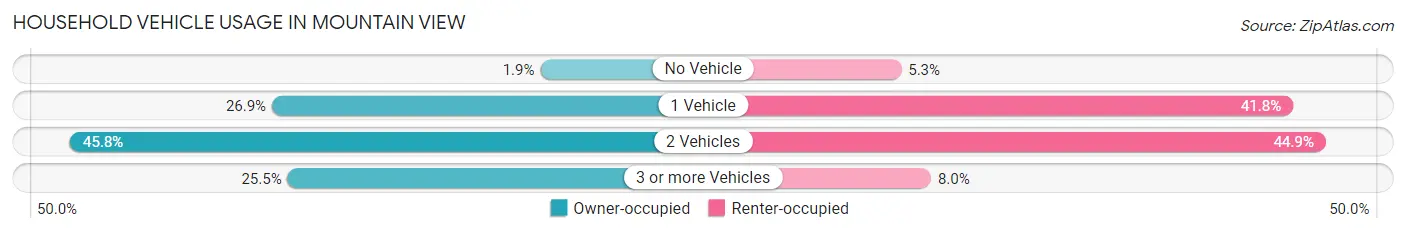
| Vehicles per Household | Owner-occupied | Renter-occupied |
| No Vehicle | 18 (1.9%) | 19 (5.3%) |
| 1 Vehicle | 261 (26.9%) | 151 (41.8%) |
| 2 Vehicles | 444 (45.8%) | 162 (44.9%) |
| 3 or more Vehicles | 247 (25.5%) | 29 (8.0%) |
| Total | 970 (100.0%) | 361 (100.0%) |
Real Estate & Mortgages in Mountain View
Real Estate and Mortgage Overview in Mountain View
| Characteristic | Without Mortgage | With Mortgage |
| Housing Units | 341 | 629 |
| Median Property Value | $140,500 | $172,600 |
| Median Household Income | $56,648 | $28 |
| Monthly Housing Costs | $282 | $0 |
| Real Estate Taxes | $891 | $14 |
Property Value by Mortgage Status in Mountain View
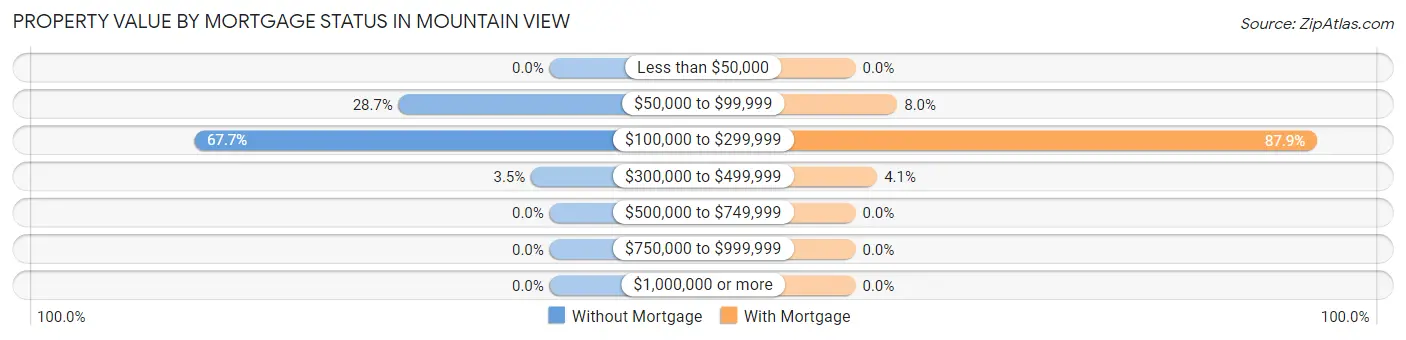
| Property Value | Without Mortgage | With Mortgage |
| Less than $50,000 | 0 (0.0%) | 0 (0.0%) |
| $50,000 to $99,999 | 98 (28.7%) | 50 (8.0%) |
| $100,000 to $299,999 | 231 (67.7%) | 553 (87.9%) |
| $300,000 to $499,999 | 12 (3.5%) | 26 (4.1%) |
| $500,000 to $749,999 | 0 (0.0%) | 0 (0.0%) |
| $750,000 to $999,999 | 0 (0.0%) | 0 (0.0%) |
| $1,000,000 or more | 0 (0.0%) | 0 (0.0%) |
| Total | 341 (100.0%) | 629 (100.0%) |
Household Income by Mortgage Status in Mountain View
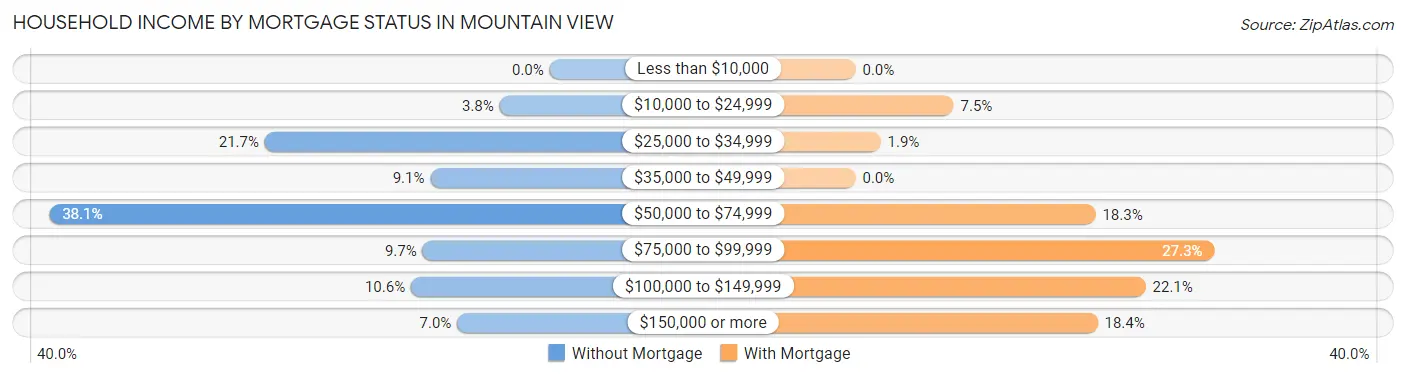
| Household Income | Without Mortgage | With Mortgage |
| Less than $10,000 | 0 (0.0%) | 0 (0.0%) |
| $10,000 to $24,999 | 13 (3.8%) | 47 (7.5%) |
| $25,000 to $34,999 | 74 (21.7%) | 12 (1.9%) |
| $35,000 to $49,999 | 31 (9.1%) | 0 (0.0%) |
| $50,000 to $74,999 | 130 (38.1%) | 115 (18.3%) |
| $75,000 to $99,999 | 33 (9.7%) | 172 (27.3%) |
| $100,000 to $149,999 | 36 (10.6%) | 139 (22.1%) |
| $150,000 or more | 24 (7.0%) | 116 (18.4%) |
| Total | 341 (100.0%) | 629 (100.0%) |
Property Value to Household Income Ratio in Mountain View
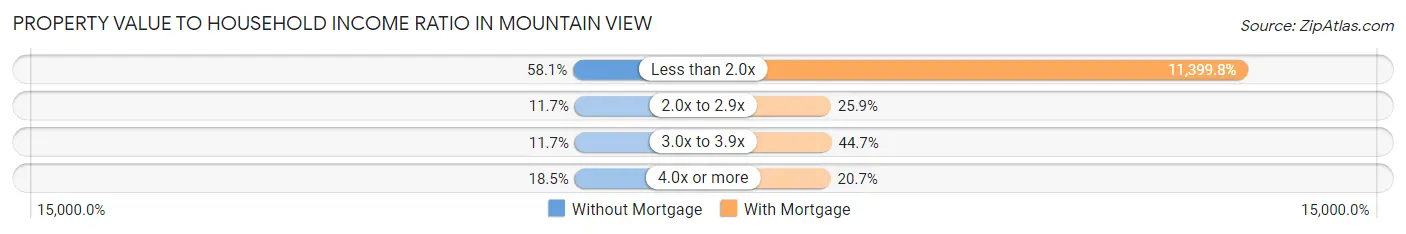
| Value-to-Income Ratio | Without Mortgage | With Mortgage |
| Less than 2.0x | 198 (58.1%) | 71,705 (11,399.8%) |
| 2.0x to 2.9x | 40 (11.7%) | 163 (25.9%) |
| 3.0x to 3.9x | 40 (11.7%) | 281 (44.7%) |
| 4.0x or more | 63 (18.5%) | 130 (20.7%) |
| Total | 341 (100.0%) | 629 (100.0%) |
Real Estate Taxes by Mortgage Status in Mountain View
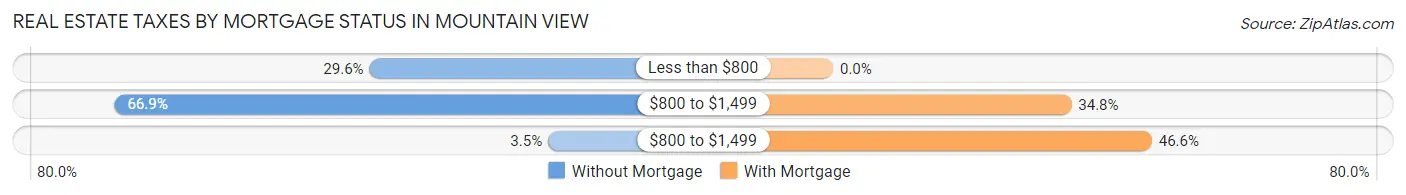
| Property Taxes | Without Mortgage | With Mortgage |
| Less than $800 | 101 (29.6%) | 0 (0.0%) |
| $800 to $1,499 | 228 (66.9%) | 219 (34.8%) |
| $800 to $1,499 | 12 (3.5%) | 293 (46.6%) |
| Total | 341 (100.0%) | 629 (100.0%) |
Health & Disability in Mountain View
Health Insurance Coverage by Age in Mountain View
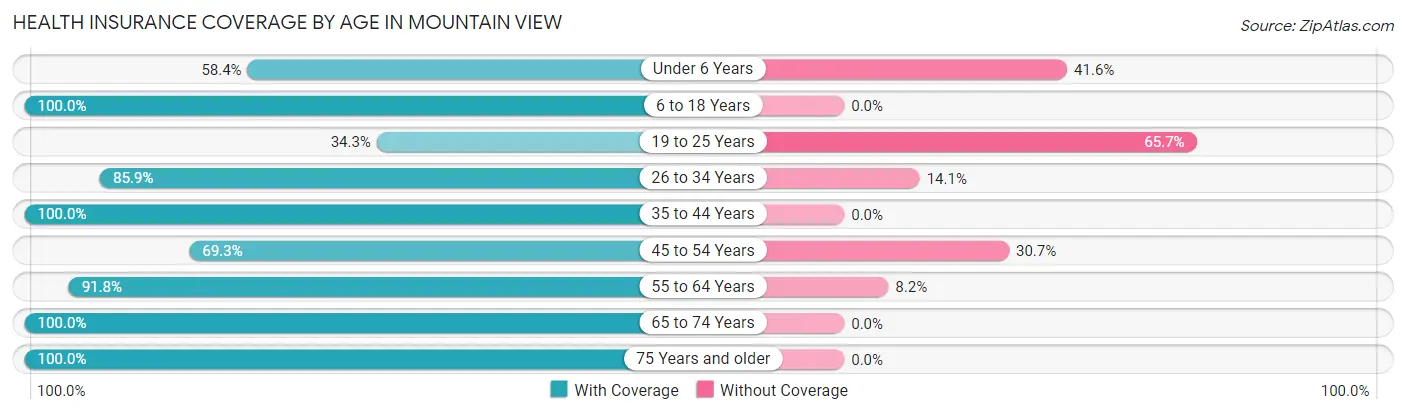
| Age Bracket | With Coverage | Without Coverage |
| Under 6 Years | 90 (58.4%) | 64 (41.6%) |
| 6 to 18 Years | 435 (100.0%) | 0 (0.0%) |
| 19 to 25 Years | 125 (34.3%) | 239 (65.7%) |
| 26 to 34 Years | 281 (85.9%) | 46 (14.1%) |
| 35 to 44 Years | 339 (100.0%) | 0 (0.0%) |
| 45 to 54 Years | 309 (69.3%) | 137 (30.7%) |
| 55 to 64 Years | 502 (91.8%) | 45 (8.2%) |
| 65 to 74 Years | 520 (100.0%) | 0 (0.0%) |
| 75 Years and older | 186 (100.0%) | 0 (0.0%) |
| Total | 2,787 (84.0%) | 531 (16.0%) |
Health Insurance Coverage by Citizenship Status in Mountain View
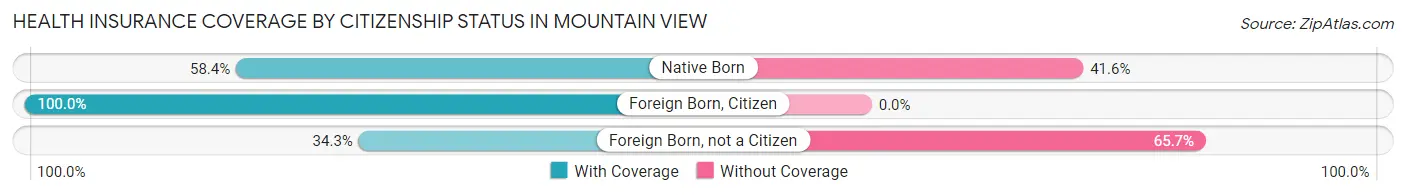
| Citizenship Status | With Coverage | Without Coverage |
| Native Born | 90 (58.4%) | 64 (41.6%) |
| Foreign Born, Citizen | 435 (100.0%) | 0 (0.0%) |
| Foreign Born, not a Citizen | 125 (34.3%) | 239 (65.7%) |
Health Insurance Coverage by Household Income in Mountain View
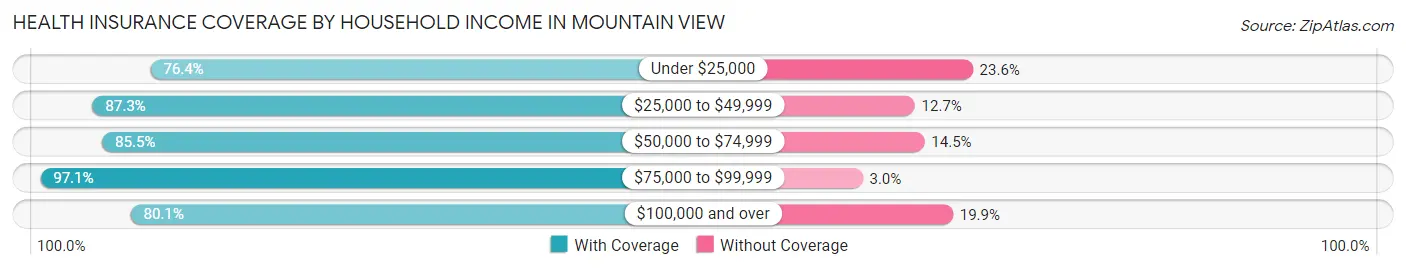
| Household Income | With Coverage | Without Coverage |
| Under $25,000 | 457 (76.4%) | 141 (23.6%) |
| $25,000 to $49,999 | 357 (87.3%) | 52 (12.7%) |
| $50,000 to $74,999 | 723 (85.5%) | 123 (14.5%) |
| $75,000 to $99,999 | 427 (97.1%) | 13 (2.9%) |
| $100,000 and over | 815 (80.1%) | 202 (19.9%) |
Public vs Private Health Insurance Coverage by Age in Mountain View
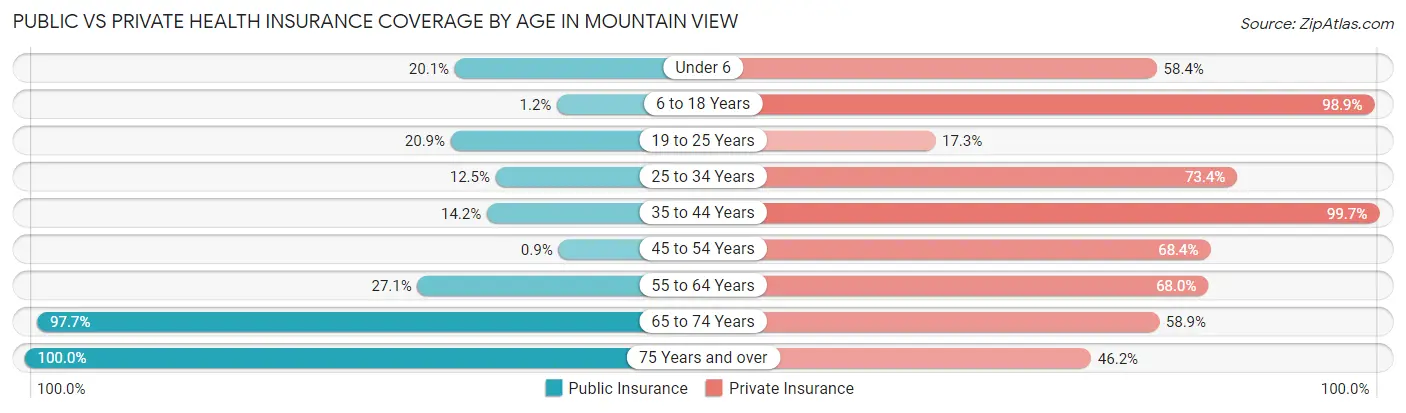
| Age Bracket | Public Insurance | Private Insurance |
| Under 6 | 31 (20.1%) | 90 (58.4%) |
| 6 to 18 Years | 5 (1.1%) | 430 (98.9%) |
| 19 to 25 Years | 76 (20.9%) | 63 (17.3%) |
| 25 to 34 Years | 41 (12.5%) | 240 (73.4%) |
| 35 to 44 Years | 48 (14.2%) | 338 (99.7%) |
| 45 to 54 Years | 4 (0.9%) | 305 (68.4%) |
| 55 to 64 Years | 148 (27.1%) | 372 (68.0%) |
| 65 to 74 Years | 508 (97.7%) | 306 (58.9%) |
| 75 Years and over | 186 (100.0%) | 86 (46.2%) |
| Total | 1,047 (31.6%) | 2,230 (67.2%) |
Disability Status by Sex by Age in Mountain View
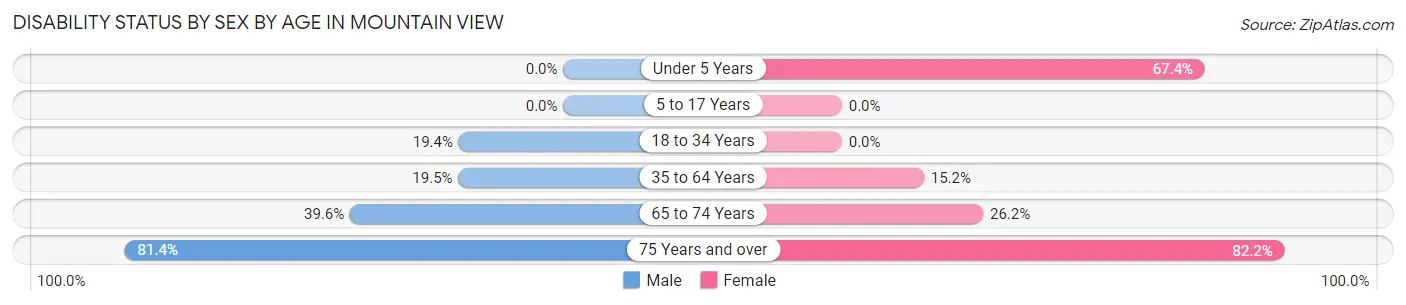
| Age Bracket | Male | Female |
| Under 5 Years | 0 (0.0%) | 31 (67.4%) |
| 5 to 17 Years | 0 (0.0%) | 0 (0.0%) |
| 18 to 34 Years | 52 (19.4%) | 0 (0.0%) |
| 35 to 64 Years | 120 (19.5%) | 109 (15.2%) |
| 65 to 74 Years | 76 (39.6%) | 86 (26.2%) |
| 75 Years and over | 92 (81.4%) | 60 (82.2%) |
Disability Class by Sex by Age in Mountain View
Disability Class: Hearing Difficulty
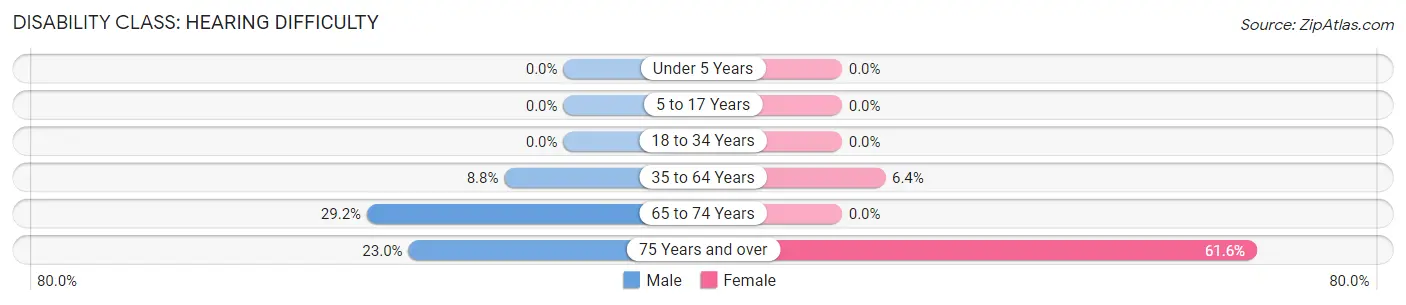
| Age Bracket | Male | Female |
| Under 5 Years | 0 (0.0%) | 0 (0.0%) |
| 5 to 17 Years | 0 (0.0%) | 0 (0.0%) |
| 18 to 34 Years | 0 (0.0%) | 0 (0.0%) |
| 35 to 64 Years | 54 (8.8%) | 46 (6.4%) |
| 65 to 74 Years | 56 (29.2%) | 0 (0.0%) |
| 75 Years and over | 26 (23.0%) | 45 (61.6%) |
Disability Class: Vision Difficulty
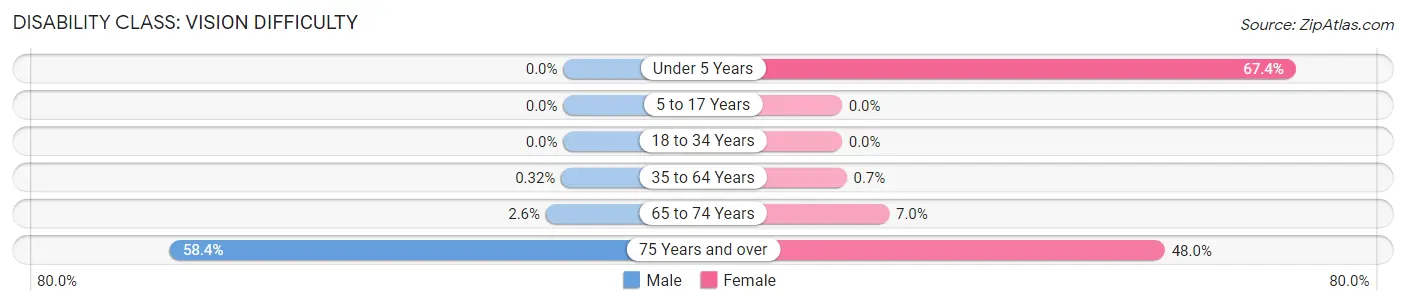
| Age Bracket | Male | Female |
| Under 5 Years | 0 (0.0%) | 31 (67.4%) |
| 5 to 17 Years | 0 (0.0%) | 0 (0.0%) |
| 18 to 34 Years | 0 (0.0%) | 0 (0.0%) |
| 35 to 64 Years | 2 (0.3%) | 5 (0.7%) |
| 65 to 74 Years | 5 (2.6%) | 23 (7.0%) |
| 75 Years and over | 66 (58.4%) | 35 (47.9%) |
Disability Class: Cognitive Difficulty
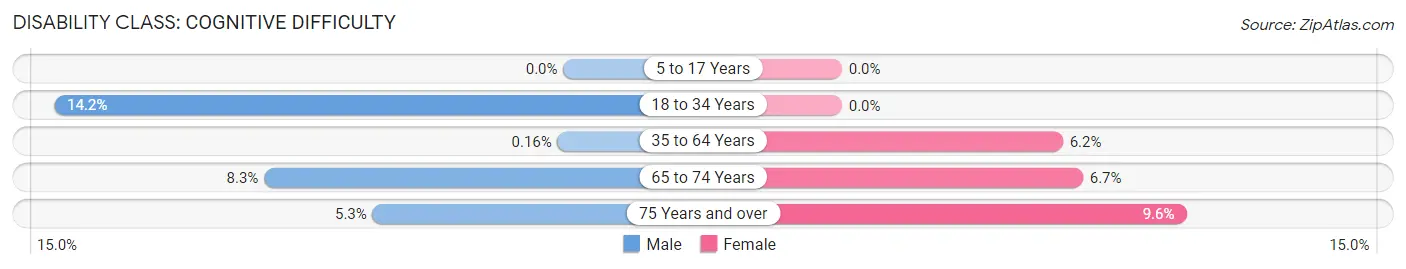
| Age Bracket | Male | Female |
| 5 to 17 Years | 0 (0.0%) | 0 (0.0%) |
| 18 to 34 Years | 38 (14.2%) | 0 (0.0%) |
| 35 to 64 Years | 1 (0.2%) | 44 (6.1%) |
| 65 to 74 Years | 16 (8.3%) | 22 (6.7%) |
| 75 Years and over | 6 (5.3%) | 7 (9.6%) |
Disability Class: Ambulatory Difficulty
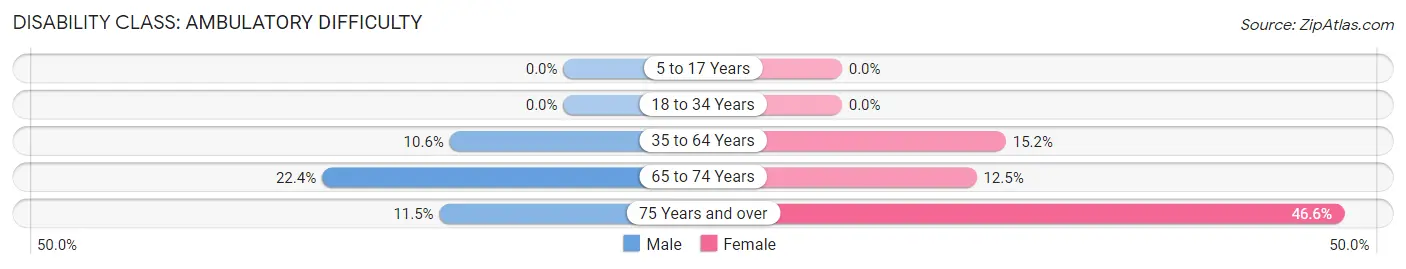
| Age Bracket | Male | Female |
| 5 to 17 Years | 0 (0.0%) | 0 (0.0%) |
| 18 to 34 Years | 0 (0.0%) | 0 (0.0%) |
| 35 to 64 Years | 65 (10.5%) | 109 (15.2%) |
| 65 to 74 Years | 43 (22.4%) | 41 (12.5%) |
| 75 Years and over | 13 (11.5%) | 34 (46.6%) |
Disability Class: Self-Care Difficulty
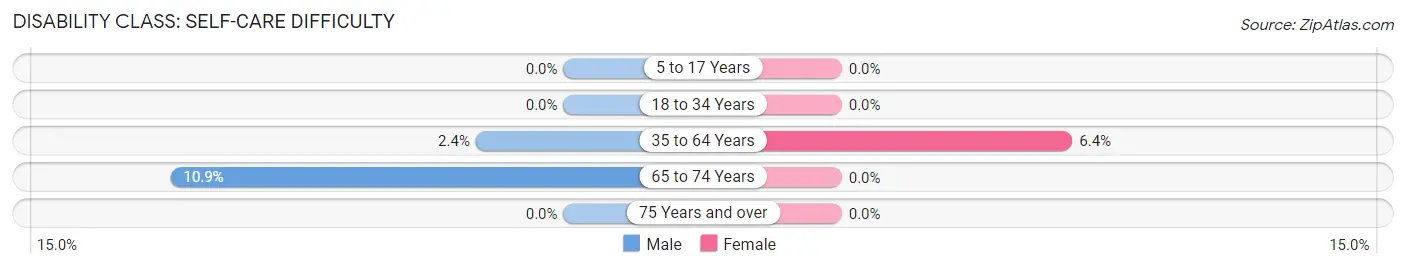
| Age Bracket | Male | Female |
| 5 to 17 Years | 0 (0.0%) | 0 (0.0%) |
| 18 to 34 Years | 0 (0.0%) | 0 (0.0%) |
| 35 to 64 Years | 15 (2.4%) | 46 (6.4%) |
| 65 to 74 Years | 21 (10.9%) | 0 (0.0%) |
| 75 Years and over | 0 (0.0%) | 0 (0.0%) |
Technology Access in Mountain View
Computing Device Access in Mountain View
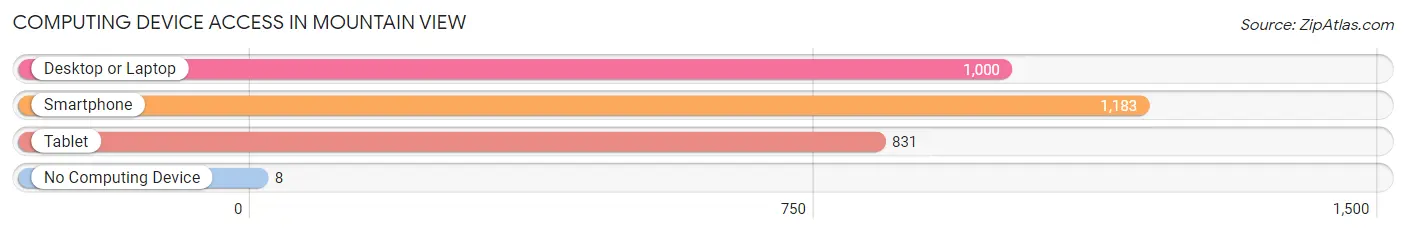
| Device Type | # Households | % Households |
| Desktop or Laptop | 1,000 | 75.1% |
| Smartphone | 1,183 | 88.9% |
| Tablet | 831 | 62.4% |
| No Computing Device | 8 | 0.6% |
| Total | 1,331 | 100.0% |
Internet Access in Mountain View
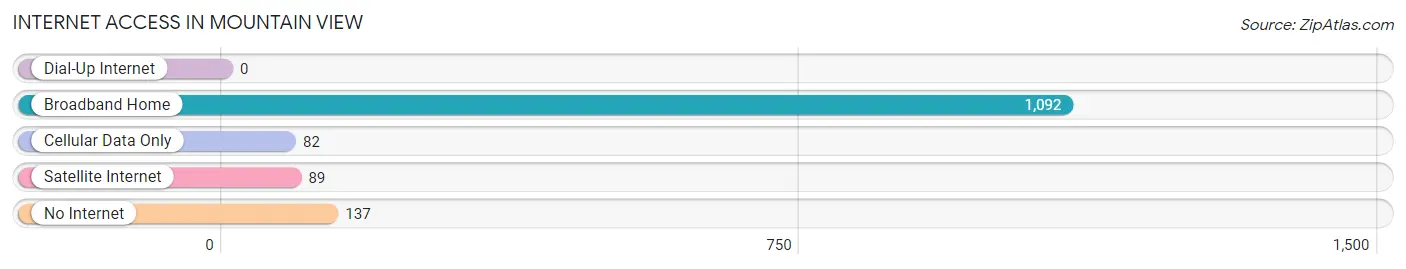
| Internet Type | # Households | % Households |
| Dial-Up Internet | 0 | 0.0% |
| Broadband Home | 1,092 | 82.0% |
| Cellular Data Only | 82 | 6.2% |
| Satellite Internet | 89 | 6.7% |
| No Internet | 137 | 10.3% |
| Total | 1,331 | 100.0% |
Mountain View Summary
Mountain View is a small town located in the foothills of the Blue Ridge Mountains in North Carolina. It is situated in the western part of the state, about 25 miles east of Asheville. The town has a population of just over 1,000 people and is part of the larger Buncombe County.
Geography
Mountain View is located in the Appalachian Mountains of western North Carolina. The town is situated in the foothills of the Blue Ridge Mountains, which form the eastern edge of the Great Smoky Mountains. The town is located at an elevation of 1,400 feet above sea level. The town is surrounded by the Pisgah National Forest, which provides a variety of outdoor activities for residents and visitors. The town is also located near the French Broad River, which is a popular destination for fishing and rafting.
The town is located in a temperate climate, with mild winters and warm summers. The average annual temperature is around 60 degrees Fahrenheit. The town receives an average of 45 inches of precipitation each year, with most of it falling in the form of rain.
Economy
Mountain View is a small town with a limited economy. The town is home to a few small businesses, including a grocery store, a hardware store, and a few restaurants. The town also has a few small manufacturing companies, which produce furniture and other wood products.
The town is also home to a few tourist attractions, including the Pisgah National Forest and the French Broad River. The town is also home to a few wineries, which attract visitors from all over the region.
Demographics
As of the 2010 census, the population of Mountain View was 1,037. The town is predominantly white, with a population that is 97.3% white. The town also has a small Hispanic population, which makes up 1.2% of the population. The median household income in the town is $37,500, which is slightly lower than the national average.
The town has a low unemployment rate, with only 4.2% of the population unemployed. The town also has a low poverty rate, with only 8.3% of the population living below the poverty line.
Conclusion
Mountain View is a small town located in the foothills of the Blue Ridge Mountains in North Carolina. The town has a population of just over 1,000 people and is part of the larger Buncombe County. The town is home to a few small businesses, tourist attractions, and wineries. The town is predominantly white, with a population that is 97.3% white. The town has a low unemployment rate and a low poverty rate. Mountain View is a great place to live and visit, with its beautiful scenery and outdoor activities.
Common Questions
What is Per Capita Income in Mountain View?
Per Capita income in Mountain View is $30,011.
What is the Median Family Income in Mountain View?
Median Family Income in Mountain View is $69,507.
What is the Median Household income in Mountain View?
Median Household Income in Mountain View is $65,369.
What is Income or Wage Gap in Mountain View?
Income or Wage Gap in Mountain View is 25.1%.
Women in Mountain View earn 74.9 cents for every dollar earned by a man.
What is Inequality or Gini Index in Mountain View?
Inequality or Gini Index in Mountain View is 0.34.
What is the Total Population of Mountain View?
Total Population of Mountain View is 3,323.
What is the Total Male Population of Mountain View?
Total Male Population of Mountain View is 1,494.
What is the Total Female Population of Mountain View?
Total Female Population of Mountain View is 1,829.
What is the Ratio of Males per 100 Females in Mountain View?
There are 81.68 Males per 100 Females in Mountain View.
What is the Ratio of Females per 100 Males in Mountain View?
There are 122.42 Females per 100 Males in Mountain View.
What is the Median Population Age in Mountain View?
Median Population Age in Mountain View is 47.5 Years.
What is the Average Family Size in Mountain View
Average Family Size in Mountain View is 2.9 People.
What is the Average Household Size in Mountain View
Average Household Size in Mountain View is 2.5 People.
How Large is the Labor Force in Mountain View?
There are 1,745 People in the Labor Forcein in Mountain View.
What is the Percentage of People in the Labor Force in Mountain View?
62.7% of People are in the Labor Force in Mountain View.
What is the Unemployment Rate in Mountain View?
Unemployment Rate in Mountain View is 4.9%.