Richmond Hill, GA Map & Demographics
Richmond Hill Map
Richmond Hill Overview
$33,241
PER CAPITA INCOME
$90,920
AVG FAMILY INCOME
$83,519
AVG HOUSEHOLD INCOME
40.6%
WAGE / INCOME GAP [ % ]
59.4¢/ $1
WAGE / INCOME GAP [ $ ]
0.36
INEQUALITY / GINI INDEX
16,703
TOTAL POPULATION
8,200
MALE POPULATION
8,503
FEMALE POPULATION
96.44
MALES / 100 FEMALES
103.70
FEMALES / 100 MALES
31.0
MEDIAN AGE
3.3
AVG FAMILY SIZE
2.8
AVG HOUSEHOLD SIZE
8,789
LABOR FORCE [ PEOPLE ]
74.7%
PERCENT IN LABOR FORCE
5.0%
UNEMPLOYMENT RATE
Richmond Hill Zip Codes
Richmond Hill Area Codes
Income in Richmond Hill
Income Overview in Richmond Hill
Per Capita Income in Richmond Hill is $33,241, while median incomes of families and households are $90,920 and $83,519 respectively.
| Characteristic | Number | Measure |
| Per Capita Income | 16,703 | $33,241 |
| Median Family Income | 4,293 | $90,920 |
| Mean Family Income | 4,293 | $100,638 |
| Median Household Income | 5,936 | $83,519 |
| Mean Household Income | 5,936 | $92,912 |
| Income Deficit | 4,293 | $0 |
| Wage / Income Gap (%) | 16,703 | 40.56% |
| Wage / Income Gap ($) | 16,703 | 59.44¢ per $1 |
| Gini / Inequality Index | 16,703 | 0.36 |
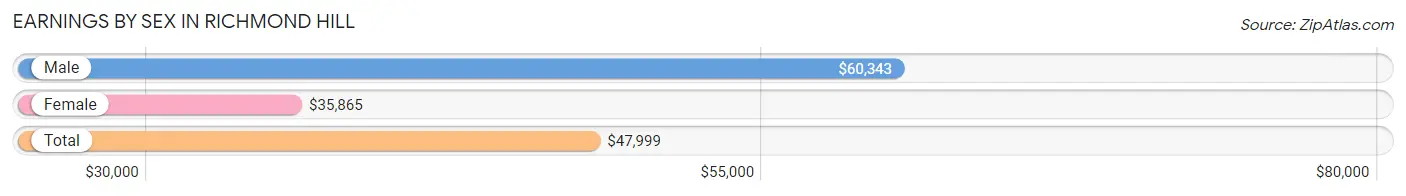
Earnings by Sex in Richmond Hill
Average Earnings in Richmond Hill are $47,999, $60,343 for men and $35,865 for women, a difference of 40.6%.
| Sex | Number | Average Earnings |
| Male | 4,553 (50.0%) | $60,343 |
| Female | 4,558 (50.0%) | $35,865 |
| Total | 9,111 (100.0%) | $47,999 |
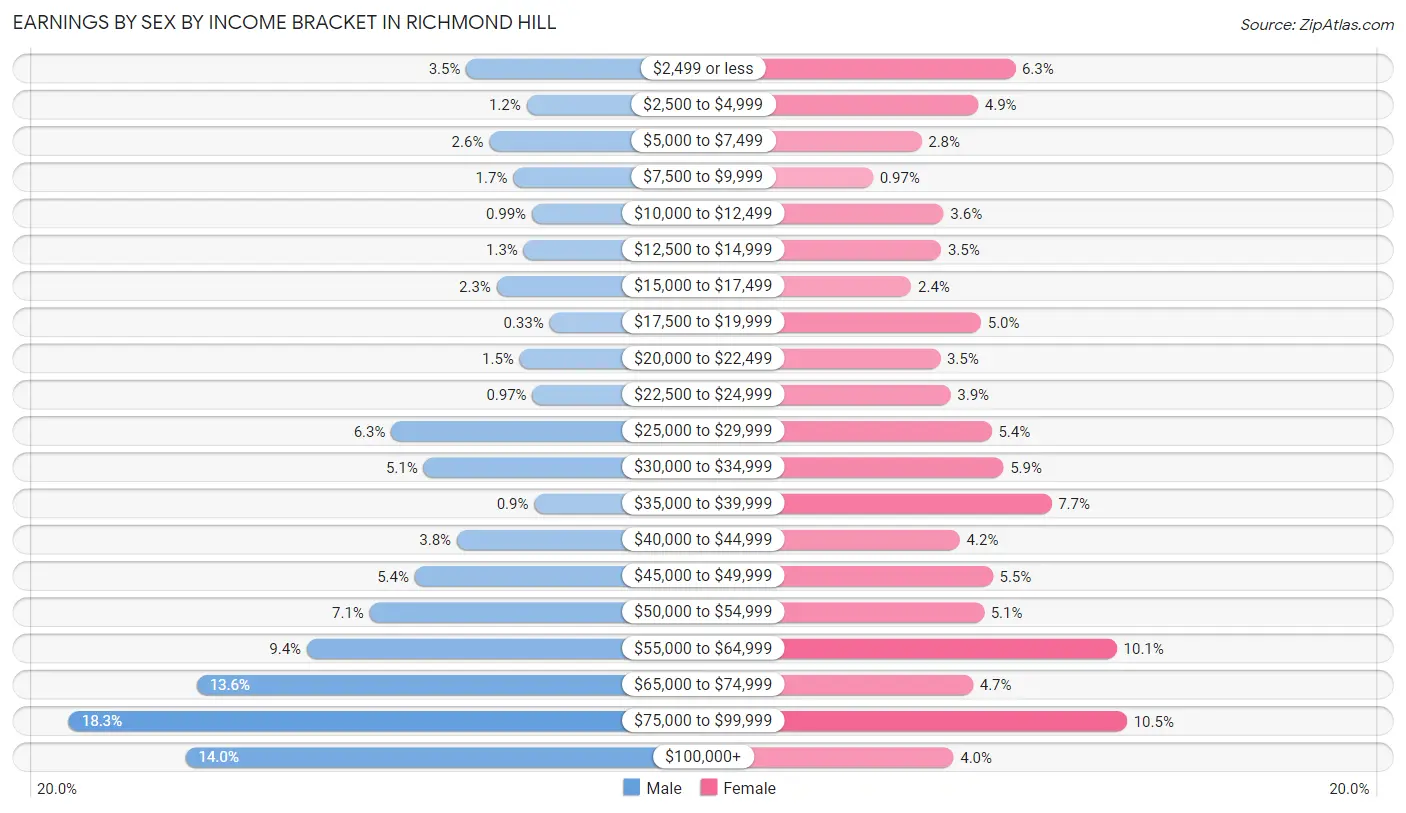
Earnings by Sex by Income Bracket in Richmond Hill
The most common earnings brackets in Richmond Hill are $75,000 to $99,999 for men (835 | 18.3%) and $75,000 to $99,999 for women (478 | 10.5%).
| Income | Male | Female |
| $2,499 or less | 157 (3.5%) | 287 (6.3%) |
| $2,500 to $4,999 | 54 (1.2%) | 224 (4.9%) |
| $5,000 to $7,499 | 118 (2.6%) | 127 (2.8%) |
| $7,500 to $9,999 | 77 (1.7%) | 44 (1.0%) |
| $10,000 to $12,499 | 45 (1.0%) | 165 (3.6%) |
| $12,500 to $14,999 | 59 (1.3%) | 161 (3.5%) |
| $15,000 to $17,499 | 105 (2.3%) | 110 (2.4%) |
| $17,500 to $19,999 | 15 (0.3%) | 229 (5.0%) |
| $20,000 to $22,499 | 66 (1.5%) | 159 (3.5%) |
| $22,500 to $24,999 | 44 (1.0%) | 177 (3.9%) |
| $25,000 to $29,999 | 285 (6.3%) | 247 (5.4%) |
| $30,000 to $34,999 | 230 (5.1%) | 267 (5.9%) |
| $35,000 to $39,999 | 41 (0.9%) | 349 (7.7%) |
| $40,000 to $44,999 | 173 (3.8%) | 193 (4.2%) |
| $45,000 to $49,999 | 245 (5.4%) | 249 (5.5%) |
| $50,000 to $54,999 | 322 (7.1%) | 234 (5.1%) |
| $55,000 to $64,999 | 429 (9.4%) | 461 (10.1%) |
| $65,000 to $74,999 | 617 (13.6%) | 215 (4.7%) |
| $75,000 to $99,999 | 835 (18.3%) | 478 (10.5%) |
| $100,000+ | 636 (14.0%) | 182 (4.0%) |
| Total | 4,553 (100.0%) | 4,558 (100.0%) |
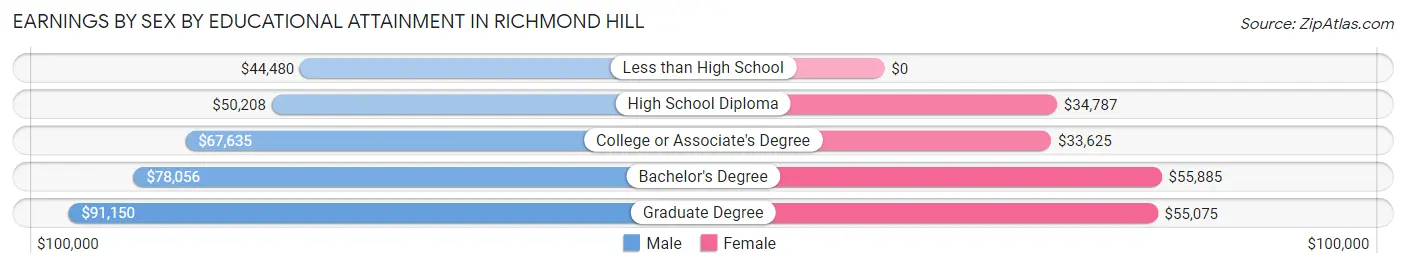
Earnings by Sex by Educational Attainment in Richmond Hill
Average earnings in Richmond Hill are $65,231 for men and $40,308 for women, a difference of 38.2%. Men with an educational attainment of graduate degree enjoy the highest average annual earnings of $91,150, while those with less than high school education earn the least with $44,480. Women with an educational attainment of bachelor's degree earn the most with the average annual earnings of $55,885, while those with college or associate's degree education have the smallest earnings of $33,625.
| Educational Attainment | Male Income | Female Income |
| Less than High School | $44,480 | $0 |
| High School Diploma | $50,208 | $34,787 |
| College or Associate's Degree | $67,635 | $33,625 |
| Bachelor's Degree | $78,056 | $55,885 |
| Graduate Degree | $91,150 | $55,075 |
| Total | $65,231 | $40,308 |
Family Income in Richmond Hill
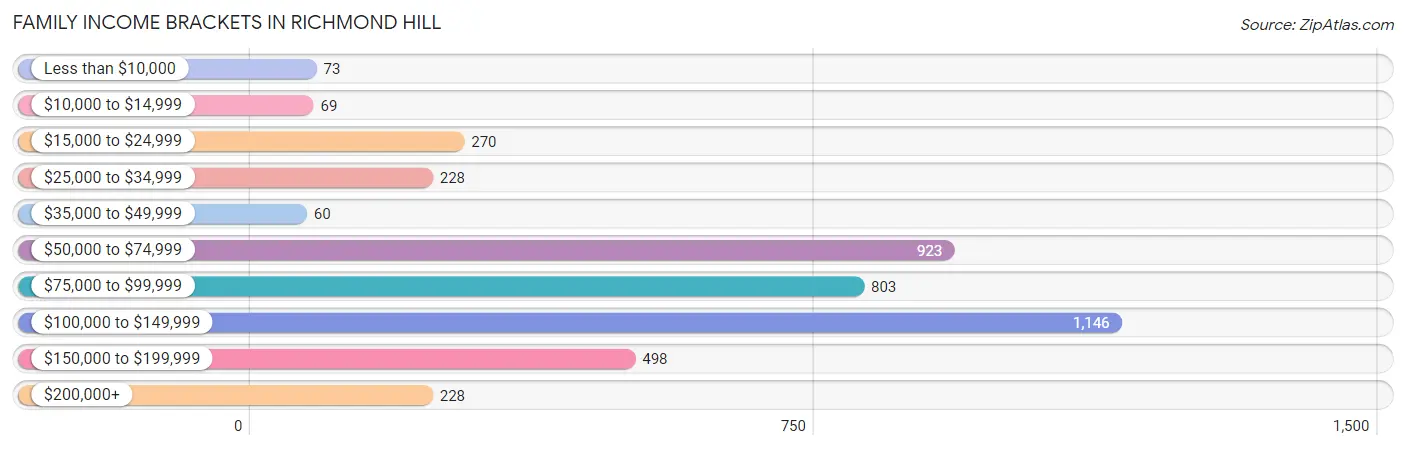
Family Income Brackets in Richmond Hill
According to the Richmond Hill family income data, there are 1,146 families falling into the $100,000 to $149,999 income range, which is the most common income bracket and makes up 26.7% of all families. Conversely, the $35,000 to $49,999 income bracket is the least frequent group with only 60 families (1.4%) belonging to this category.
| Income Bracket | # Families | % Families |
| Less than $10,000 | 73 | 1.7% |
| $10,000 to $14,999 | 69 | 1.6% |
| $15,000 to $24,999 | 270 | 6.3% |
| $25,000 to $34,999 | 228 | 5.3% |
| $35,000 to $49,999 | 60 | 1.4% |
| $50,000 to $74,999 | 923 | 21.5% |
| $75,000 to $99,999 | 803 | 18.7% |
| $100,000 to $149,999 | 1,146 | 26.7% |
| $150,000 to $199,999 | 498 | 11.6% |
| $200,000+ | 228 | 5.3% |
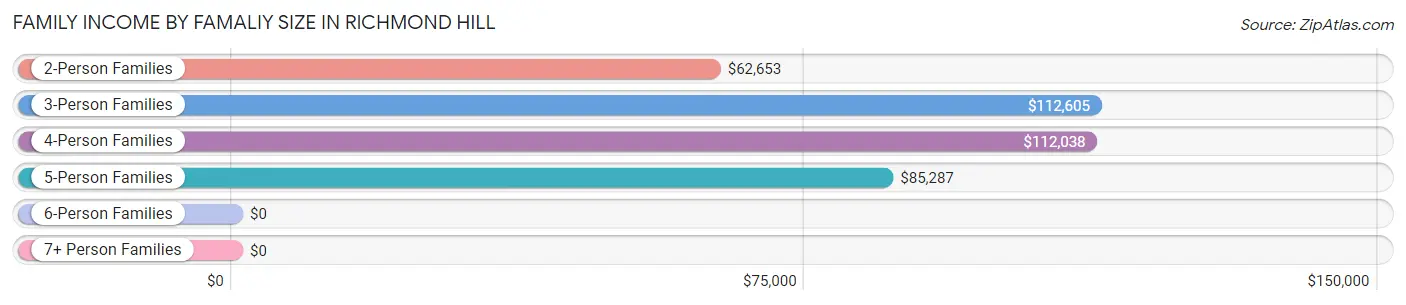
Family Income by Famaliy Size in Richmond Hill
3-person families (1,155 | 26.9%) account for the highest median family income in Richmond Hill with $112,605 per family, while 3-person families (1,155 | 26.9%) have the highest median income of $37,535 per family member.
| Income Bracket | # Families | Median Income |
| 2-Person Families | 1,416 (33.0%) | $62,653 |
| 3-Person Families | 1,155 (26.9%) | $112,605 |
| 4-Person Families | 1,049 (24.4%) | $112,038 |
| 5-Person Families | 558 (13.0%) | $85,287 |
| 6-Person Families | 47 (1.1%) | $0 |
| 7+ Person Families | 68 (1.6%) | $0 |
| Total | 4,293 (100.0%) | $90,920 |
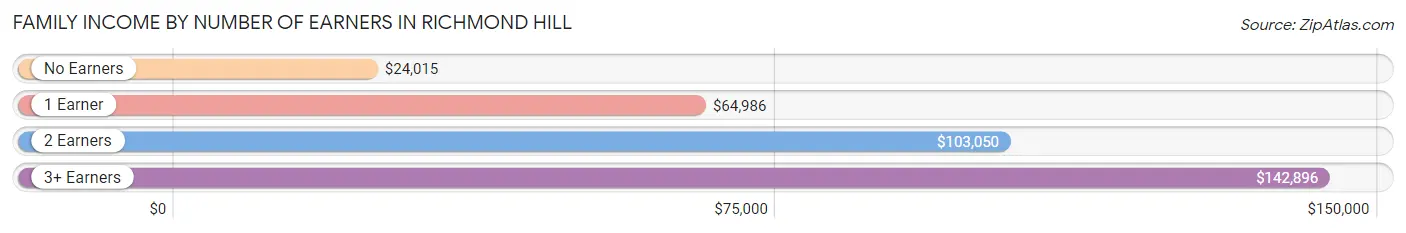
Family Income by Number of Earners in Richmond Hill
The median family income in Richmond Hill is $90,920, with families comprising 3+ earners (329) having the highest median family income of $142,896, while families with no earners (196) have the lowest median family income of $24,015, accounting for 7.7% and 4.6% of families, respectively.
| Number of Earners | # Families | Median Income |
| No Earners | 196 (4.6%) | $24,015 |
| 1 Earner | 1,496 (34.8%) | $64,986 |
| 2 Earners | 2,272 (52.9%) | $103,050 |
| 3+ Earners | 329 (7.7%) | $142,896 |
| Total | 4,293 (100.0%) | $90,920 |
Household Income in Richmond Hill
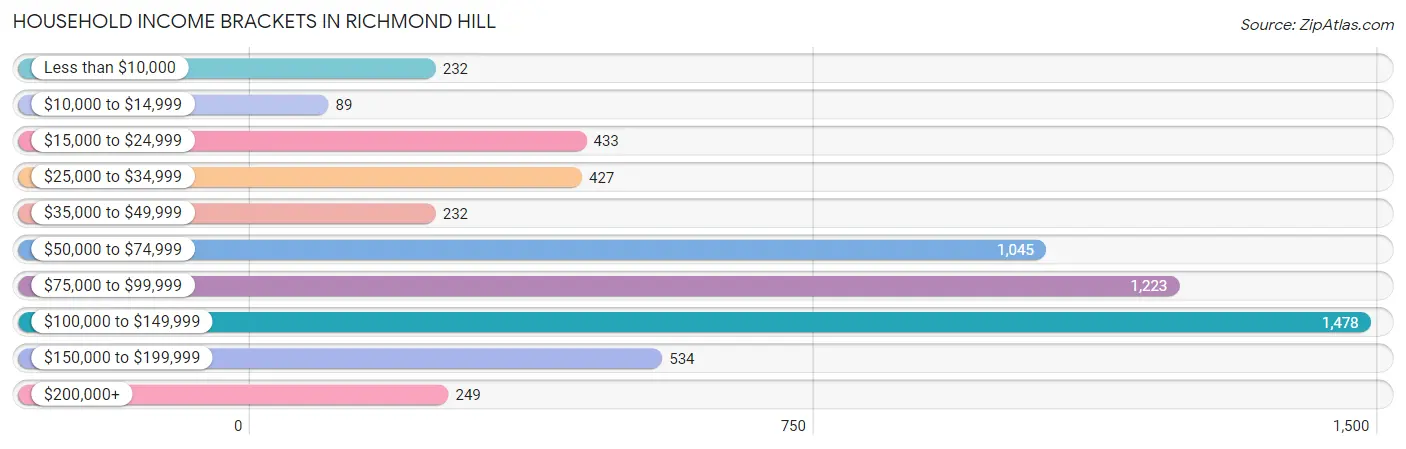
Household Income Brackets in Richmond Hill
With 1,478 households falling in the category, the $100,000 to $149,999 income range is the most frequent in Richmond Hill, accounting for 24.9% of all households. In contrast, only 89 households (1.5%) fall into the $10,000 to $14,999 income bracket, making it the least populous group.
| Income Bracket | # Households | % Households |
| Less than $10,000 | 232 | 3.9% |
| $10,000 to $14,999 | 89 | 1.5% |
| $15,000 to $24,999 | 433 | 7.3% |
| $25,000 to $34,999 | 427 | 7.2% |
| $35,000 to $49,999 | 232 | 3.9% |
| $50,000 to $74,999 | 1,045 | 17.6% |
| $75,000 to $99,999 | 1,223 | 20.6% |
| $100,000 to $149,999 | 1,478 | 24.9% |
| $150,000 to $199,999 | 534 | 9.0% |
| $200,000+ | 249 | 4.2% |
Household Income by Householder Age in Richmond Hill
The median household income in Richmond Hill is $83,519, with the highest median household income of $91,357 found in the 25 to 44 years age bracket for the primary householder. A total of 2,839 households (47.8%) fall into this category. Meanwhile, the 15 to 24 years age bracket for the primary householder has the lowest median household income of $46,563, with 322 households (5.4%) in this group.
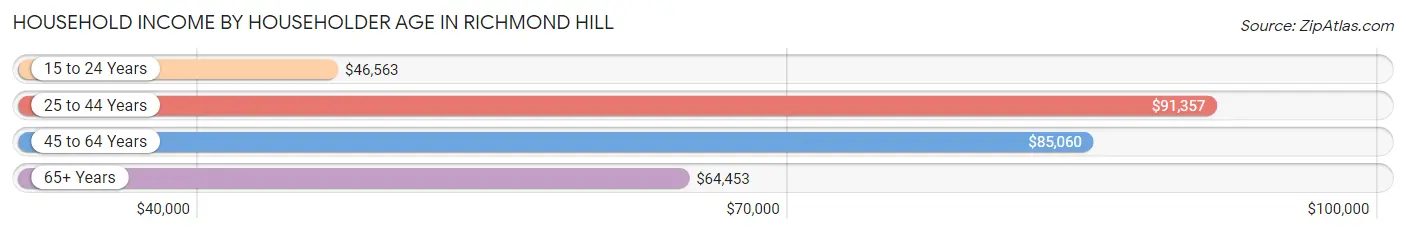
| Income Bracket | # Households | Median Income |
| 15 to 24 Years | 322 (5.4%) | $46,563 |
| 25 to 44 Years | 2,839 (47.8%) | $91,357 |
| 45 to 64 Years | 2,052 (34.6%) | $85,060 |
| 65+ Years | 723 (12.2%) | $64,453 |
| Total | 5,936 (100.0%) | $83,519 |
Poverty in Richmond Hill
Income Below Poverty by Sex and Age in Richmond Hill
With 7.6% poverty level for males and 9.1% for females among the residents of Richmond Hill, 6 to 11 year old males and 45 to 54 year old females are the most vulnerable to poverty, with 375 males (31.0%) and 199 females (21.6%) in their respective age groups living below the poverty level.
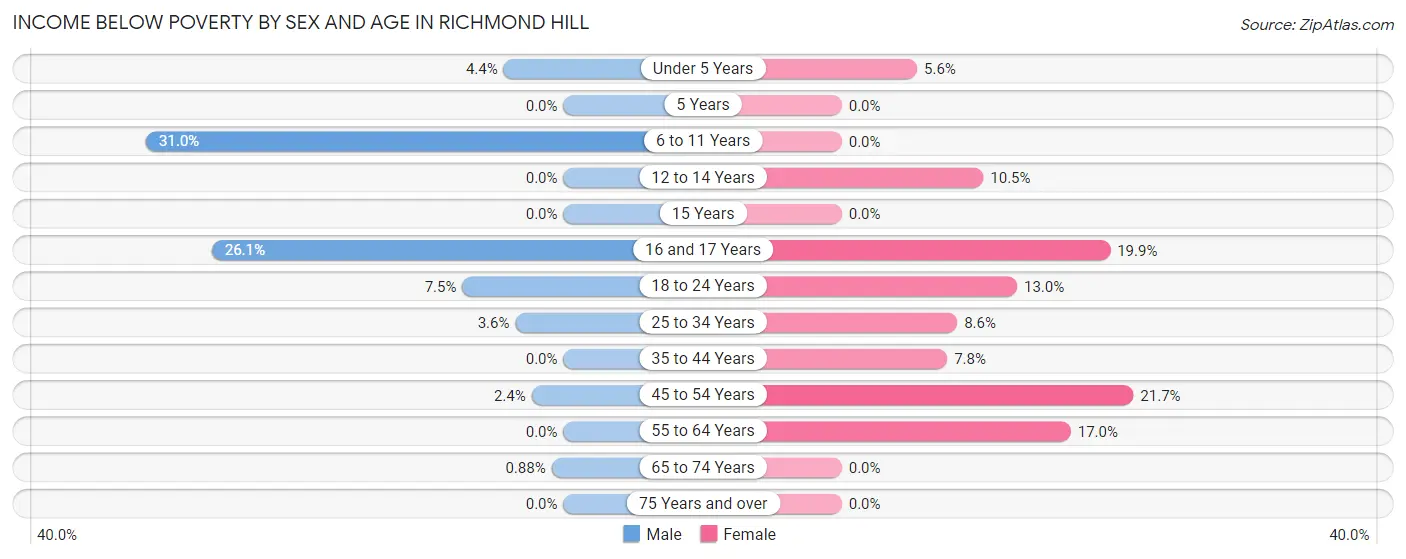
| Age Bracket | Male | Female |
| Under 5 Years | 39 (4.4%) | 37 (5.6%) |
| 5 Years | 0 (0.0%) | 0 (0.0%) |
| 6 to 11 Years | 375 (31.0%) | 0 (0.0%) |
| 12 to 14 Years | 0 (0.0%) | 35 (10.5%) |
| 15 Years | 0 (0.0%) | 0 (0.0%) |
| 16 and 17 Years | 107 (26.1%) | 60 (19.9%) |
| 18 to 24 Years | 38 (7.5%) | 80 (13.0%) |
| 25 to 34 Years | 45 (3.6%) | 110 (8.6%) |
| 35 to 44 Years | 0 (0.0%) | 133 (7.8%) |
| 45 to 54 Years | 19 (2.4%) | 199 (21.6%) |
| 55 to 64 Years | 0 (0.0%) | 111 (17.0%) |
| 65 to 74 Years | 2 (0.9%) | 0 (0.0%) |
| 75 Years and over | 0 (0.0%) | 0 (0.0%) |
| Total | 625 (7.6%) | 765 (9.1%) |
Income Above Poverty by Sex and Age in Richmond Hill
According to the poverty statistics in Richmond Hill, males aged 5 years and females aged 5 years are the age groups that are most secure financially, with 100.0% of males and 100.0% of females in these age groups living above the poverty line.
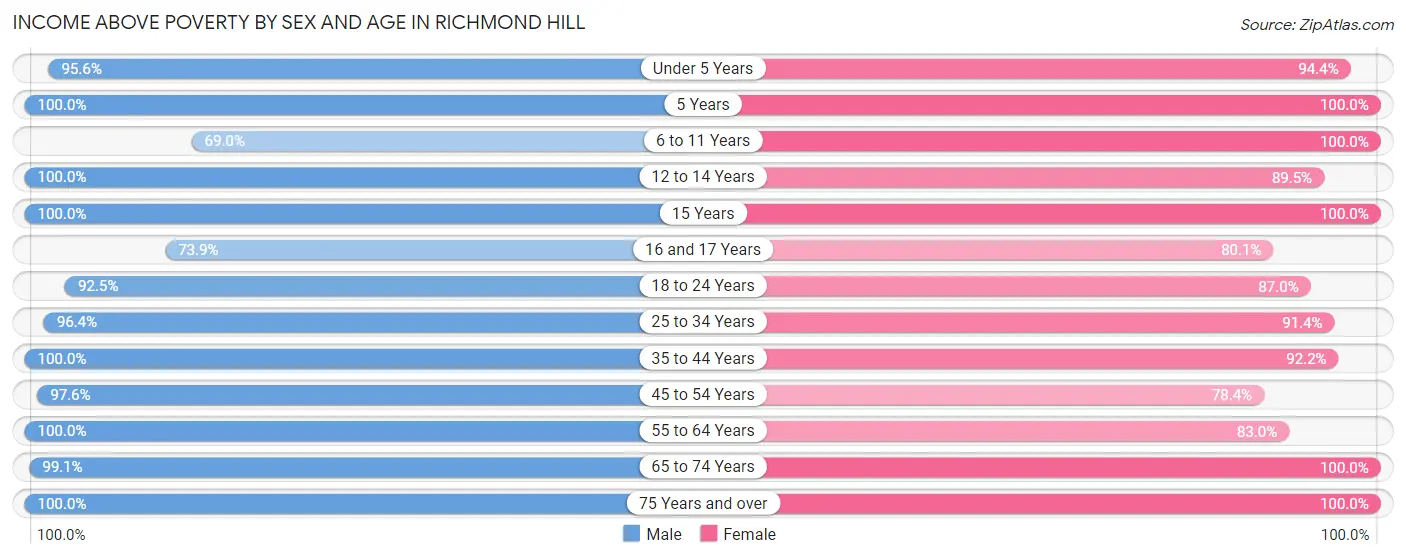
| Age Bracket | Male | Female |
| Under 5 Years | 839 (95.6%) | 625 (94.4%) |
| 5 Years | 46 (100.0%) | 38 (100.0%) |
| 6 to 11 Years | 835 (69.0%) | 1,098 (100.0%) |
| 12 to 14 Years | 282 (100.0%) | 298 (89.5%) |
| 15 Years | 223 (100.0%) | 158 (100.0%) |
| 16 and 17 Years | 303 (73.9%) | 241 (80.1%) |
| 18 to 24 Years | 469 (92.5%) | 535 (87.0%) |
| 25 to 34 Years | 1,217 (96.4%) | 1,173 (91.4%) |
| 35 to 44 Years | 1,476 (100.0%) | 1,565 (92.2%) |
| 45 to 54 Years | 787 (97.6%) | 720 (78.3%) |
| 55 to 64 Years | 714 (100.0%) | 542 (83.0%) |
| 65 to 74 Years | 225 (99.1%) | 277 (100.0%) |
| 75 Years and over | 137 (100.0%) | 368 (100.0%) |
| Total | 7,553 (92.4%) | 7,638 (90.9%) |
Income Below Poverty Among Married-Couple Families in Richmond Hill
The poverty statistics for married-couple families in Richmond Hill show that 1.2% or 35 of the total 3,022 families live below the poverty line. Families with no children have the highest poverty rate of 3.5%, comprising of 35 families. On the other hand, families with 1 or 2 children have the lowest poverty rate of 0.0%, which includes 0 families.
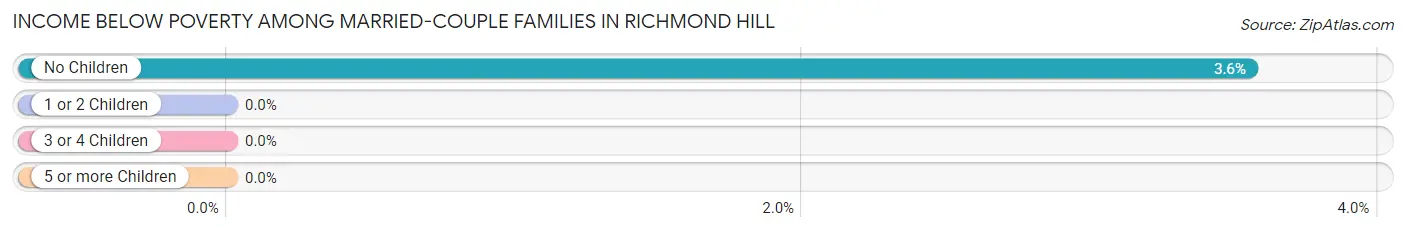
| Children | Above Poverty | Below Poverty |
| No Children | 952 (96.5%) | 35 (3.5%) |
| 1 or 2 Children | 1,424 (100.0%) | 0 (0.0%) |
| 3 or 4 Children | 543 (100.0%) | 0 (0.0%) |
| 5 or more Children | 68 (100.0%) | 0 (0.0%) |
| Total | 2,987 (98.8%) | 35 (1.2%) |
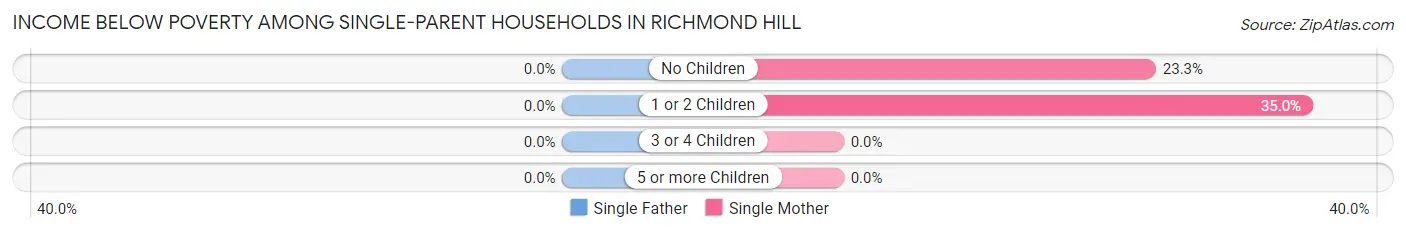
Income Below Poverty Among Single-Parent Households in Richmond Hill
| Children | Single Father | Single Mother |
| No Children | 0 (0.0%) | 40 (23.3%) |
| 1 or 2 Children | 0 (0.0%) | 316 (35.0%) |
| 3 or 4 Children | 0 (0.0%) | 0 (0.0%) |
| 5 or more Children | 0 (0.0%) | 0 (0.0%) |
| Total | 0 (0.0%) | 356 (32.8%) |
Income Below Poverty Among Married-Couple vs Single-Parent Households in Richmond Hill
The poverty data for Richmond Hill shows that 35 of the married-couple family households (1.2%) and 356 of the single-parent households (28.0%) are living below the poverty level. Within the married-couple family households, those with no children have the highest poverty rate, with 35 households (3.5%) falling below the poverty line. Among the single-parent households, those with 1 or 2 children have the highest poverty rate, with 316 household (29.7%) living below poverty.
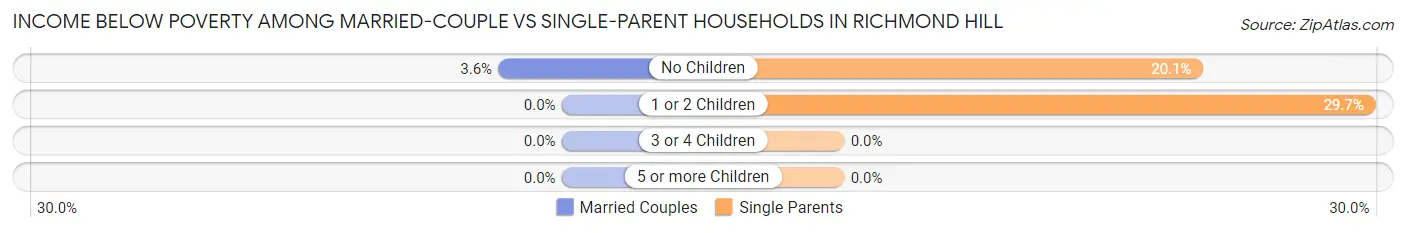
| Children | Married-Couple Families | Single-Parent Households |
| No Children | 35 (3.5%) | 40 (20.1%) |
| 1 or 2 Children | 0 (0.0%) | 316 (29.7%) |
| 3 or 4 Children | 0 (0.0%) | 0 (0.0%) |
| 5 or more Children | 0 (0.0%) | 0 (0.0%) |
| Total | 35 (1.2%) | 356 (28.0%) |
Race in Richmond Hill
The most populous races in Richmond Hill are White / Caucasian (11,331 | 67.8%), Black / African American (2,350 | 14.1%), and Hispanic or Latino (1,954 | 11.7%).
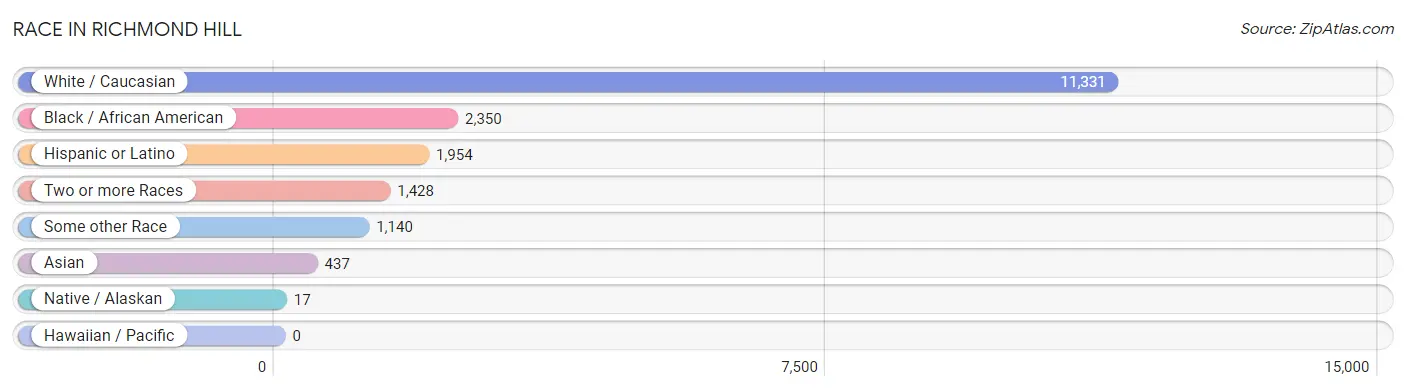
| Race | # Population | % Population |
| Asian | 437 | 2.6% |
| Black / African American | 2,350 | 14.1% |
| Hawaiian / Pacific | 0 | 0.0% |
| Hispanic or Latino | 1,954 | 11.7% |
| Native / Alaskan | 17 | 0.1% |
| White / Caucasian | 11,331 | 67.8% |
| Two or more Races | 1,428 | 8.6% |
| Some other Race | 1,140 | 6.8% |
| Total | 16,703 | 100.0% |
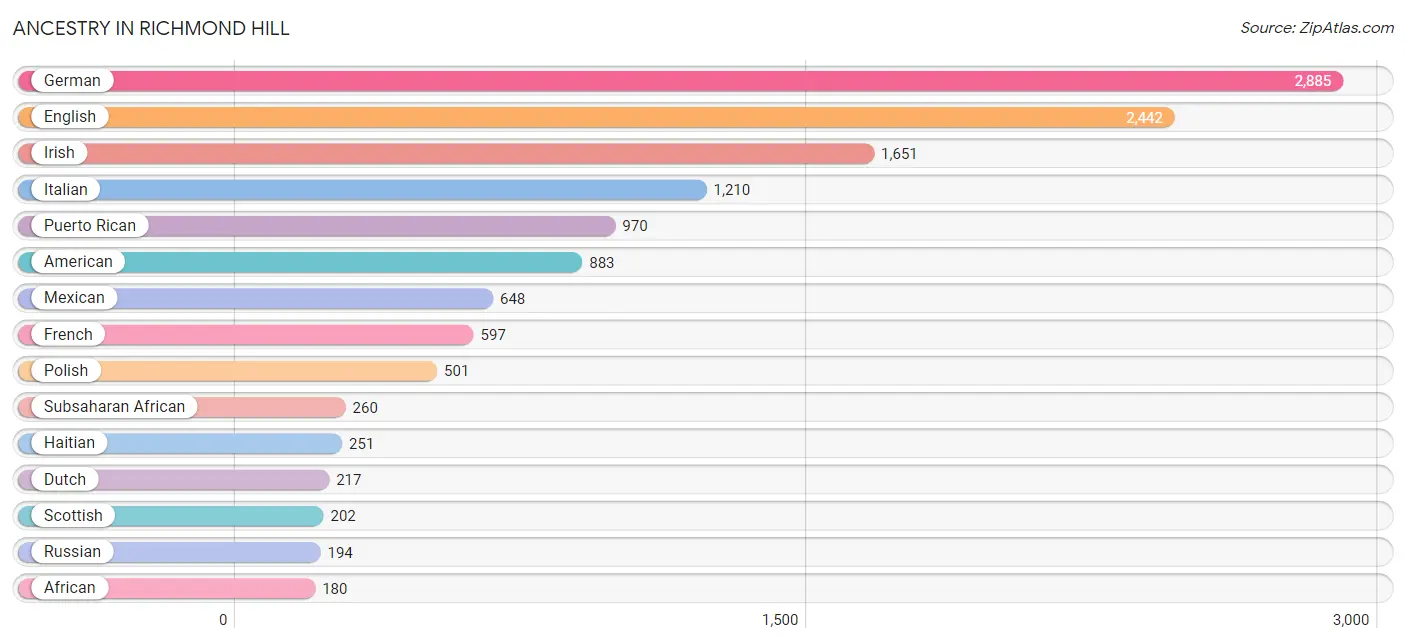
Ancestry in Richmond Hill
The most populous ancestries reported in Richmond Hill are German (2,885 | 17.3%), English (2,442 | 14.6%), Irish (1,651 | 9.9%), Italian (1,210 | 7.2%), and Puerto Rican (970 | 5.8%), together accounting for 54.8% of all Richmond Hill residents.
| Ancestry | # Population | % Population |
| African | 180 | 1.1% |
| American | 883 | 5.3% |
| Bahamian | 33 | 0.2% |
| Bhutanese | 9 | 0.1% |
| Blackfeet | 16 | 0.1% |
| British | 20 | 0.1% |
| Burmese | 160 | 1.0% |
| Cajun | 36 | 0.2% |
| Canadian | 70 | 0.4% |
| Central American | 125 | 0.7% |
| Cherokee | 51 | 0.3% |
| Colombian | 37 | 0.2% |
| Cuban | 63 | 0.4% |
| Czech | 49 | 0.3% |
| Danish | 107 | 0.6% |
| Dominican | 40 | 0.2% |
| Dutch | 217 | 1.3% |
| Ecuadorian | 10 | 0.1% |
| English | 2,442 | 14.6% |
| European | 128 | 0.8% |
| French | 597 | 3.6% |
| French Canadian | 146 | 0.9% |
| German | 2,885 | 17.3% |
| Greek | 81 | 0.5% |
| Guamanian / Chamorro | 35 | 0.2% |
| Guatemalan | 16 | 0.1% |
| Haitian | 251 | 1.5% |
| Honduran | 98 | 0.6% |
| Hungarian | 24 | 0.1% |
| Indian (Asian) | 165 | 1.0% |
| Iranian | 32 | 0.2% |
| Irish | 1,651 | 9.9% |
| Italian | 1,210 | 7.2% |
| Jamaican | 60 | 0.4% |
| Korean | 62 | 0.4% |
| Latvian | 47 | 0.3% |
| Mexican | 648 | 3.9% |
| Mexican American Indian | 40 | 0.2% |
| Native Hawaiian | 80 | 0.5% |
| Nigerian | 80 | 0.5% |
| Norwegian | 70 | 0.4% |
| Pakistani | 71 | 0.4% |
| Polish | 501 | 3.0% |
| Portuguese | 10 | 0.1% |
| Puerto Rican | 970 | 5.8% |
| Russian | 194 | 1.2% |
| Salvadoran | 11 | 0.1% |
| Scandinavian | 60 | 0.4% |
| Scotch-Irish | 156 | 0.9% |
| Scottish | 202 | 1.2% |
| Sioux | 27 | 0.2% |
| Slovak | 11 | 0.1% |
| South American | 47 | 0.3% |
| Spanish | 61 | 0.4% |
| Sri Lankan | 55 | 0.3% |
| Subsaharan African | 260 | 1.6% |
| Swedish | 49 | 0.3% |
| Swiss | 92 | 0.5% |
| Thai | 113 | 0.7% |
| Trinidadian and Tobagonian | 28 | 0.2% |
| Welsh | 123 | 0.7% | View All 61 Rows |
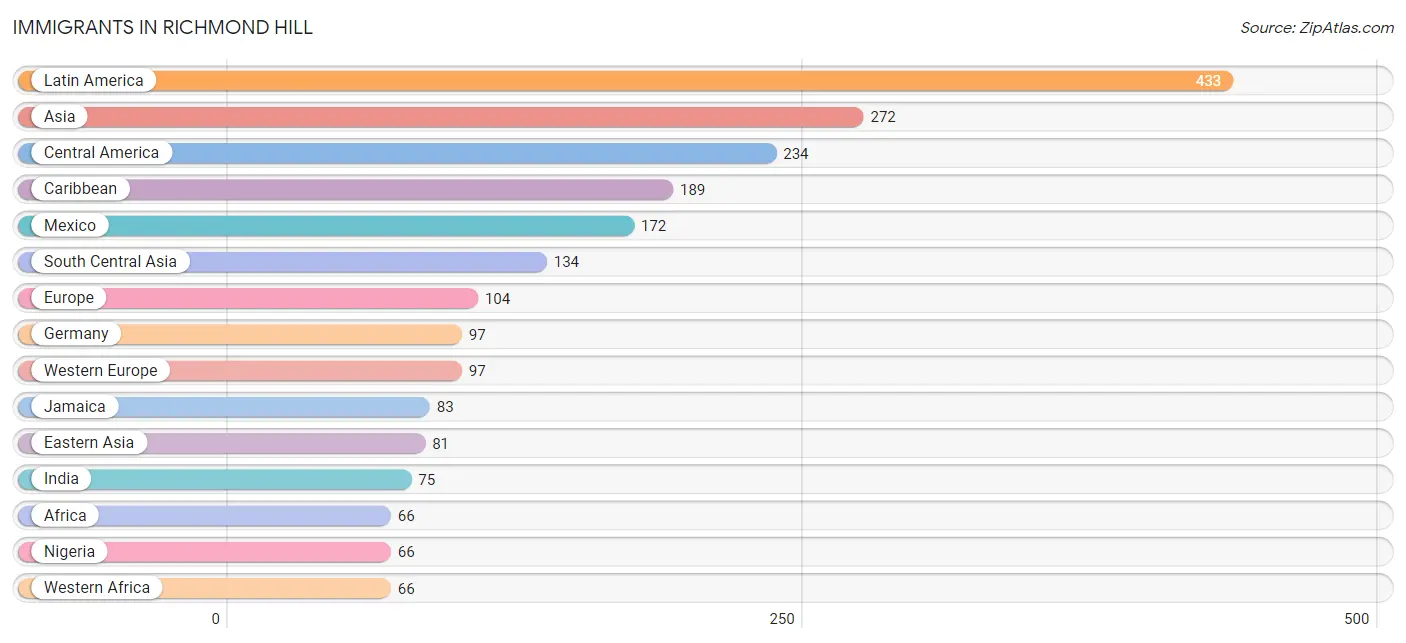
Immigrants in Richmond Hill
The most numerous immigrant groups reported in Richmond Hill came from Latin America (433 | 2.6%), Asia (272 | 1.6%), Central America (234 | 1.4%), Caribbean (189 | 1.1%), and Mexico (172 | 1.0%), together accounting for 7.8% of all Richmond Hill residents.
| Immigration Origin | # Population | % Population |
| Africa | 66 | 0.4% |
| Asia | 272 | 1.6% |
| Bahamas | 33 | 0.2% |
| Belize | 1 | 0.0% |
| Caribbean | 189 | 1.1% |
| Central America | 234 | 1.4% |
| China | 25 | 0.2% |
| Colombia | 10 | 0.1% |
| Czechoslovakia | 7 | 0.0% |
| Dominican Republic | 31 | 0.2% |
| Eastern Asia | 81 | 0.5% |
| Eastern Europe | 7 | 0.0% |
| El Salvador | 5 | 0.0% |
| Europe | 104 | 0.6% |
| Germany | 97 | 0.6% |
| Guatemala | 6 | 0.0% |
| Haiti | 32 | 0.2% |
| Honduras | 50 | 0.3% |
| India | 75 | 0.4% |
| Iran | 32 | 0.2% |
| Jamaica | 83 | 0.5% |
| Japan | 6 | 0.0% |
| Kazakhstan | 16 | 0.1% |
| Korea | 50 | 0.3% |
| Latin America | 433 | 2.6% |
| Mexico | 172 | 1.0% |
| Nepal | 11 | 0.1% |
| Nigeria | 66 | 0.4% |
| Philippines | 12 | 0.1% |
| South America | 10 | 0.1% |
| South Central Asia | 134 | 0.8% |
| South Eastern Asia | 57 | 0.3% |
| Trinidad and Tobago | 10 | 0.1% |
| Vietnam | 45 | 0.3% |
| Western Africa | 66 | 0.4% |
| Western Europe | 97 | 0.6% | View All 36 Rows |
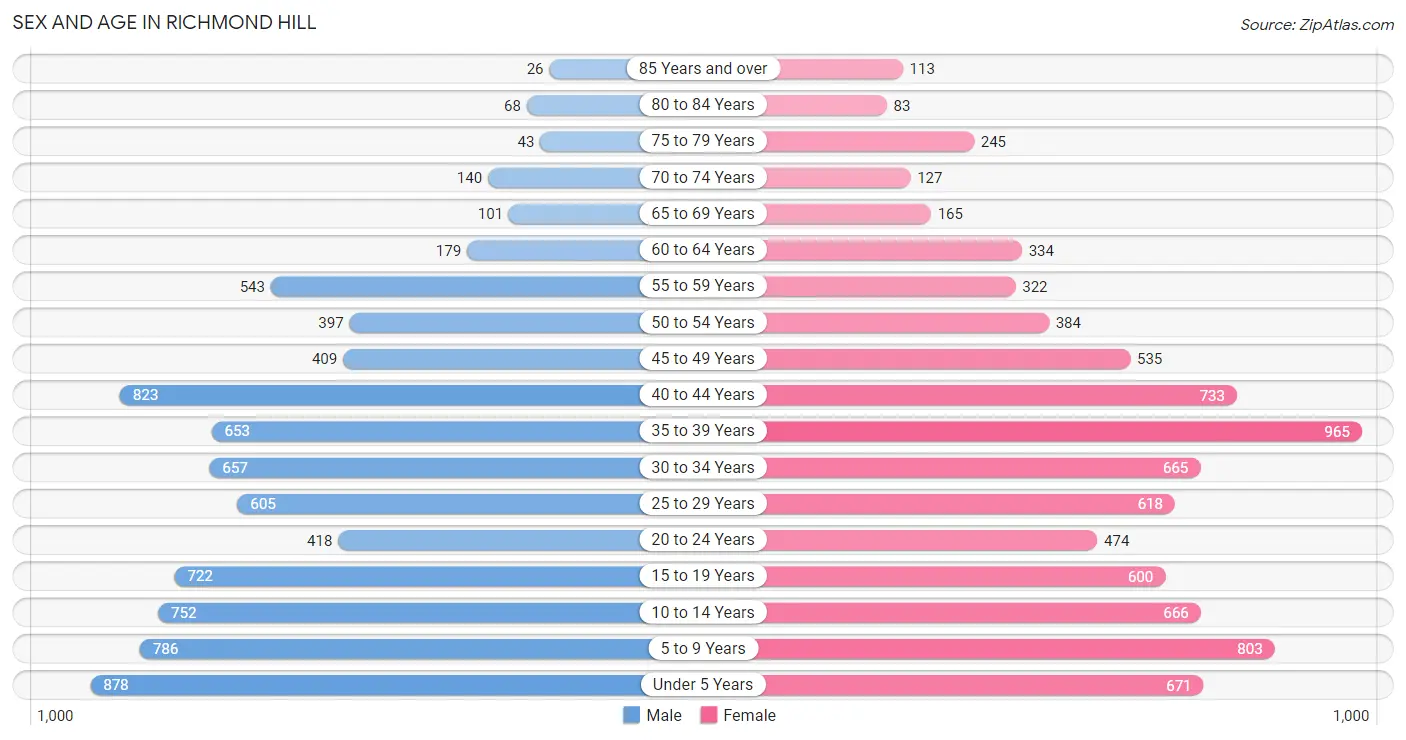
Sex and Age in Richmond Hill
Sex and Age in Richmond Hill
The most populous age groups in Richmond Hill are Under 5 Years (878 | 10.7%) for men and 35 to 39 Years (965 | 11.4%) for women.
| Age Bracket | Male | Female |
| Under 5 Years | 878 (10.7%) | 671 (7.9%) |
| 5 to 9 Years | 786 (9.6%) | 803 (9.4%) |
| 10 to 14 Years | 752 (9.2%) | 666 (7.8%) |
| 15 to 19 Years | 722 (8.8%) | 600 (7.1%) |
| 20 to 24 Years | 418 (5.1%) | 474 (5.6%) |
| 25 to 29 Years | 605 (7.4%) | 618 (7.3%) |
| 30 to 34 Years | 657 (8.0%) | 665 (7.8%) |
| 35 to 39 Years | 653 (8.0%) | 965 (11.4%) |
| 40 to 44 Years | 823 (10.0%) | 733 (8.6%) |
| 45 to 49 Years | 409 (5.0%) | 535 (6.3%) |
| 50 to 54 Years | 397 (4.8%) | 384 (4.5%) |
| 55 to 59 Years | 543 (6.6%) | 322 (3.8%) |
| 60 to 64 Years | 179 (2.2%) | 334 (3.9%) |
| 65 to 69 Years | 101 (1.2%) | 165 (1.9%) |
| 70 to 74 Years | 140 (1.7%) | 127 (1.5%) |
| 75 to 79 Years | 43 (0.5%) | 245 (2.9%) |
| 80 to 84 Years | 68 (0.8%) | 83 (1.0%) |
| 85 Years and over | 26 (0.3%) | 113 (1.3%) |
| Total | 8,200 (100.0%) | 8,503 (100.0%) |
Families and Households in Richmond Hill
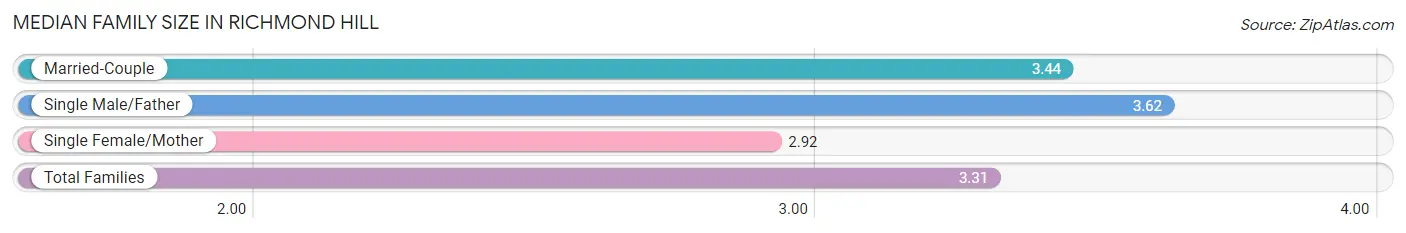
Median Family Size in Richmond Hill
The median family size in Richmond Hill is 3.31 persons per family, with single male/father families (186 | 4.3%) accounting for the largest median family size of 3.62 persons per family. On the other hand, single female/mother families (1,085 | 25.3%) represent the smallest median family size with 2.92 persons per family.
| Family Type | # Families | Family Size |
| Married-Couple | 3,022 (70.4%) | 3.44 |
| Single Male/Father | 186 (4.3%) | 3.62 |
| Single Female/Mother | 1,085 (25.3%) | 2.92 |
| Total Families | 4,293 (100.0%) | 3.31 |
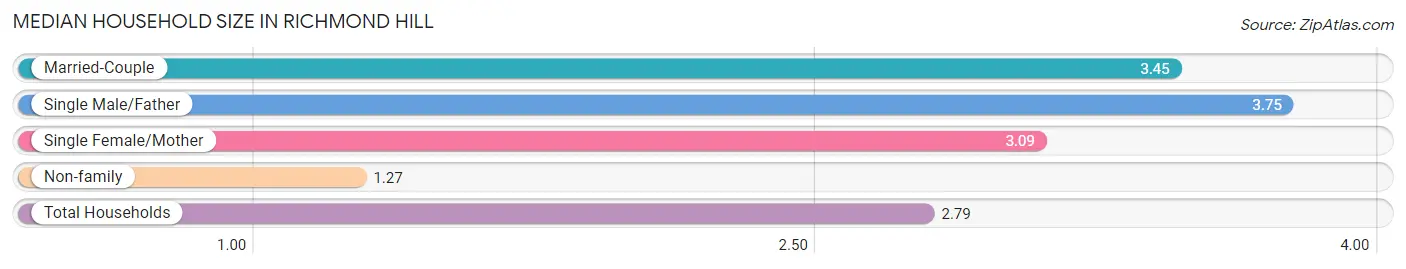
Median Household Size in Richmond Hill
The median household size in Richmond Hill is 2.79 persons per household, with single male/father households (186 | 3.1%) accounting for the largest median household size of 3.75 persons per household. non-family households (1,643 | 27.7%) represent the smallest median household size with 1.27 persons per household.
| Household Type | # Households | Household Size |
| Married-Couple | 3,022 (50.9%) | 3.45 |
| Single Male/Father | 186 (3.1%) | 3.75 |
| Single Female/Mother | 1,085 (18.3%) | 3.09 |
| Non-family | 1,643 (27.7%) | 1.27 |
| Total Households | 5,936 (100.0%) | 2.79 |
Household Size by Marriage Status in Richmond Hill
Out of a total of 5,936 households in Richmond Hill, 4,293 (72.3%) are family households, while 1,643 (27.7%) are nonfamily households. The most numerous type of family households are 2-person households, comprising 1,317, and the most common type of nonfamily households are 1-person households, comprising 1,310.
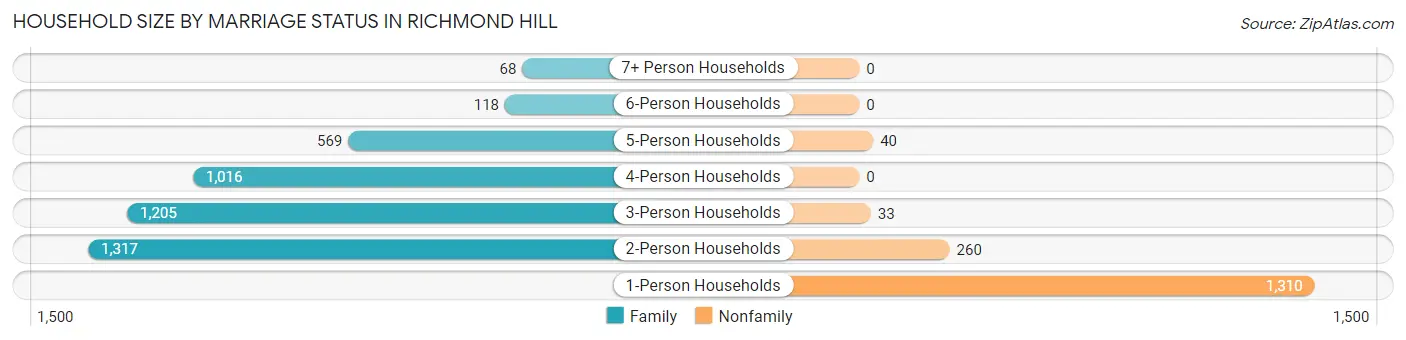
| Household Size | Family Households | Nonfamily Households |
| 1-Person Households | - | 1,310 (22.1%) |
| 2-Person Households | 1,317 (22.2%) | 260 (4.4%) |
| 3-Person Households | 1,205 (20.3%) | 33 (0.6%) |
| 4-Person Households | 1,016 (17.1%) | 0 (0.0%) |
| 5-Person Households | 569 (9.6%) | 40 (0.7%) |
| 6-Person Households | 118 (2.0%) | 0 (0.0%) |
| 7+ Person Households | 68 (1.1%) | 0 (0.0%) |
| Total | 4,293 (72.3%) | 1,643 (27.7%) |
Female Fertility in Richmond Hill
Fertility by Age in Richmond Hill
Average fertility rate in Richmond Hill is 70.0 births per 1,000 women. Women in the age bracket of 20 to 34 years have the highest fertility rate with 142.0 births per 1,000 women. Women in the age bracket of 20 to 34 years acount for 75.1% of all women with births.
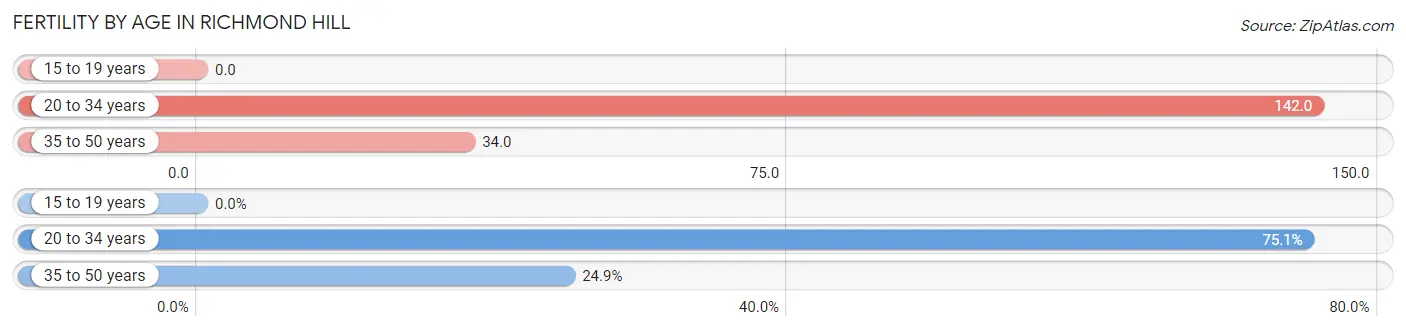
| Age Bracket | Women with Births | Births / 1,000 Women |
| 15 to 19 years | 0 (0.0%) | 0.0 |
| 20 to 34 years | 250 (75.1%) | 142.0 |
| 35 to 50 years | 83 (24.9%) | 34.0 |
| Total | 333 (100.0%) | 70.0 |
Fertility by Age by Marriage Status in Richmond Hill
75.1% of women with births (333) in Richmond Hill are married. The highest percentage of unmarried women with births falls into 35 to 50 years age bracket with 100.0% of them unmarried at the time of birth, while the lowest percentage of unmarried women with births belong to 20 to 34 years age bracket with 0.0% of them unmarried.
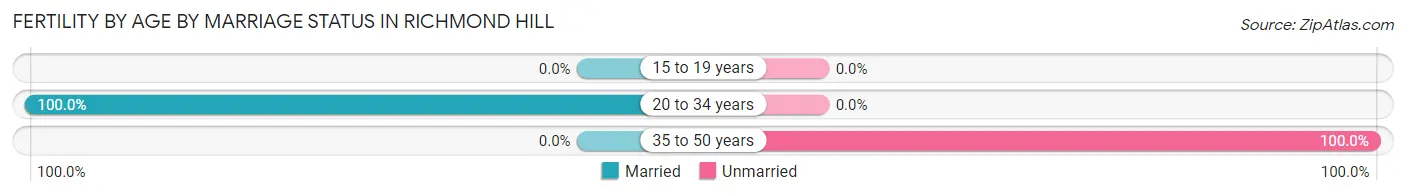
| Age Bracket | Married | Unmarried |
| 15 to 19 years | 0 (0.0%) | 0 (0.0%) |
| 20 to 34 years | 250 (100.0%) | 0 (0.0%) |
| 35 to 50 years | 0 (0.0%) | 83 (100.0%) |
| Total | 250 (75.1%) | 83 (24.9%) |
Fertility by Education in Richmond Hill
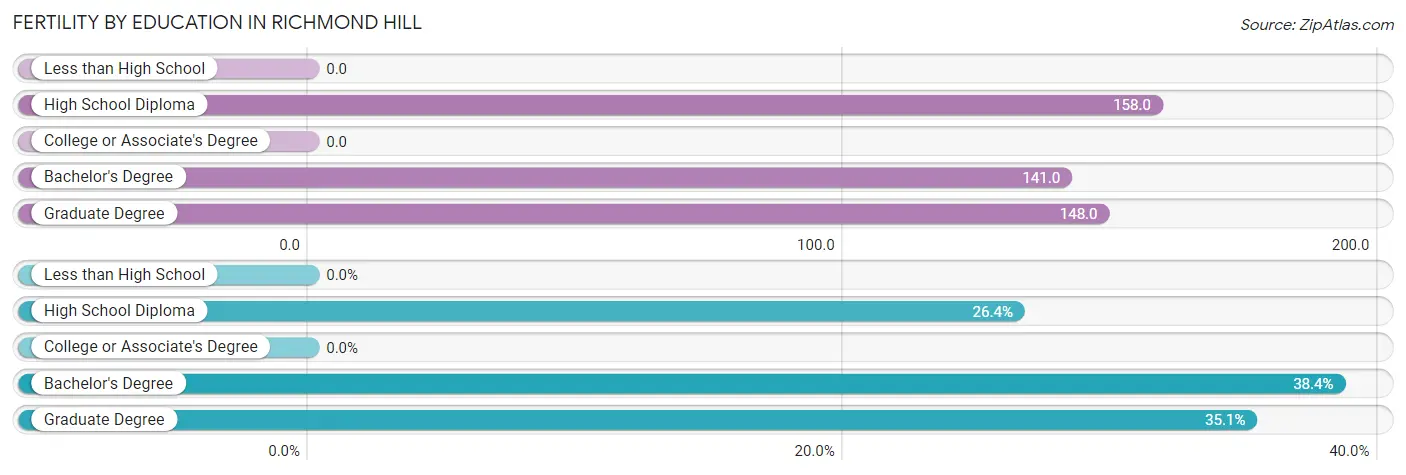
| Educational Attainment | Women with Births | Births / 1,000 Women |
| Less than High School | 0 (0.0%) | 0.0 |
| High School Diploma | 88 (26.4%) | 158.0 |
| College or Associate's Degree | 0 (0.0%) | 0.0 |
| Bachelor's Degree | 128 (38.4%) | 141.0 |
| Graduate Degree | 117 (35.1%) | 148.0 |
| Total | 333 (100.0%) | 70.0 |
Fertility by Education by Marriage Status in Richmond Hill
24.9% of women with births in Richmond Hill are unmarried. Women with the educational attainment of high school diploma are most likely to be married with 100.0% of them married at childbirth, while women with the educational attainment of bachelor's degree are least likely to be married with 64.8% of them unmarried at childbirth.
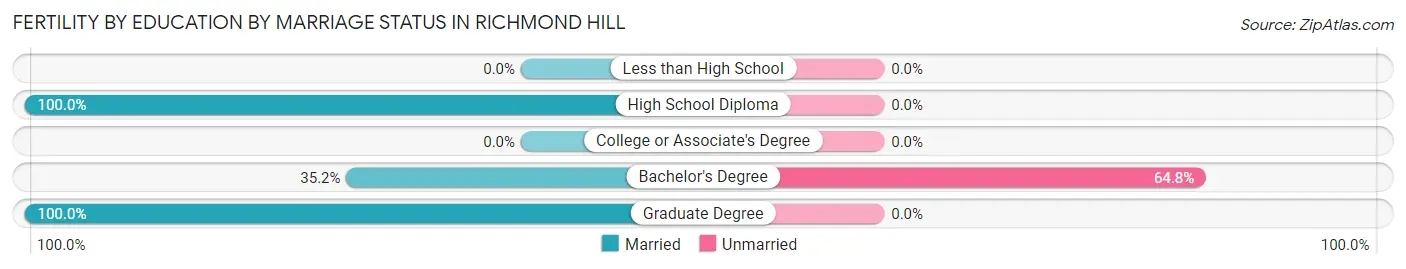
| Educational Attainment | Married | Unmarried |
| Less than High School | 0 (0.0%) | 0 (0.0%) |
| High School Diploma | 88 (100.0%) | 0 (0.0%) |
| College or Associate's Degree | 0 (0.0%) | 0 (0.0%) |
| Bachelor's Degree | 45 (35.2%) | 83 (64.8%) |
| Graduate Degree | 117 (100.0%) | 0 (0.0%) |
| Total | 250 (75.1%) | 83 (24.9%) |
Employment Characteristics in Richmond Hill
Employment by Class of Employer in Richmond Hill
Among the 8,159 employed individuals in Richmond Hill, private company employees (5,081 | 62.3%), federal government employees (1,542 | 18.9%), and local government employees (540 | 6.6%) make up the most common classes of employment.
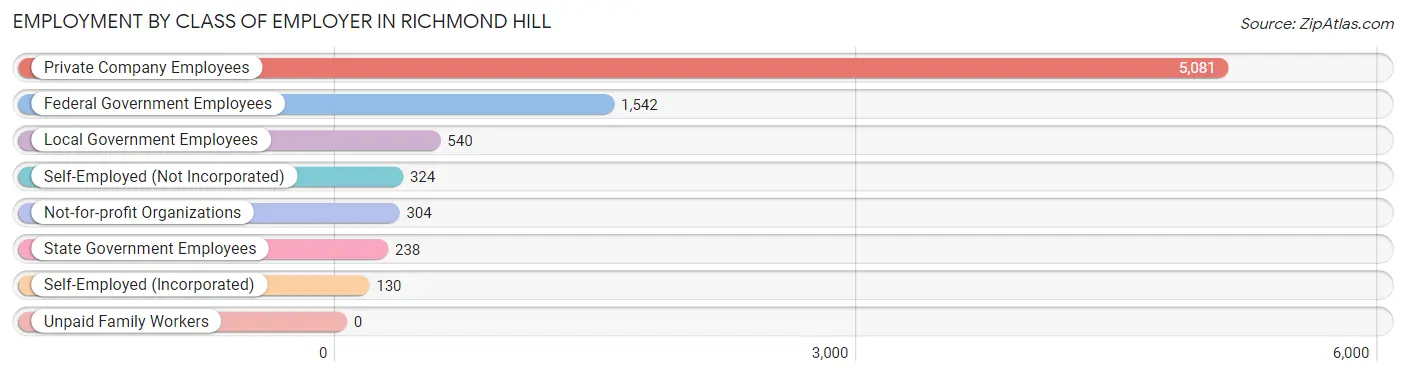
| Employer Class | # Employees | % Employees |
| Private Company Employees | 5,081 | 62.3% |
| Self-Employed (Incorporated) | 130 | 1.6% |
| Self-Employed (Not Incorporated) | 324 | 4.0% |
| Not-for-profit Organizations | 304 | 3.7% |
| Local Government Employees | 540 | 6.6% |
| State Government Employees | 238 | 2.9% |
| Federal Government Employees | 1,542 | 18.9% |
| Unpaid Family Workers | 0 | 0.0% |
| Total | 8,159 | 100.0% |
Employment Status by Age in Richmond Hill
According to the labor force statistics for Richmond Hill, out of the total population over 16 years of age (11,766), 74.7% or 8,789 individuals are in the labor force, with 5.0% or 439 of them unemployed. The age group with the highest labor force participation rate is 20 to 24 years, with 96.4% or 860 individuals in the labor force. Within the labor force, the 65 to 74 years age range has the highest percentage of unemployed individuals, with 21.7% or 47 of them being unemployed.
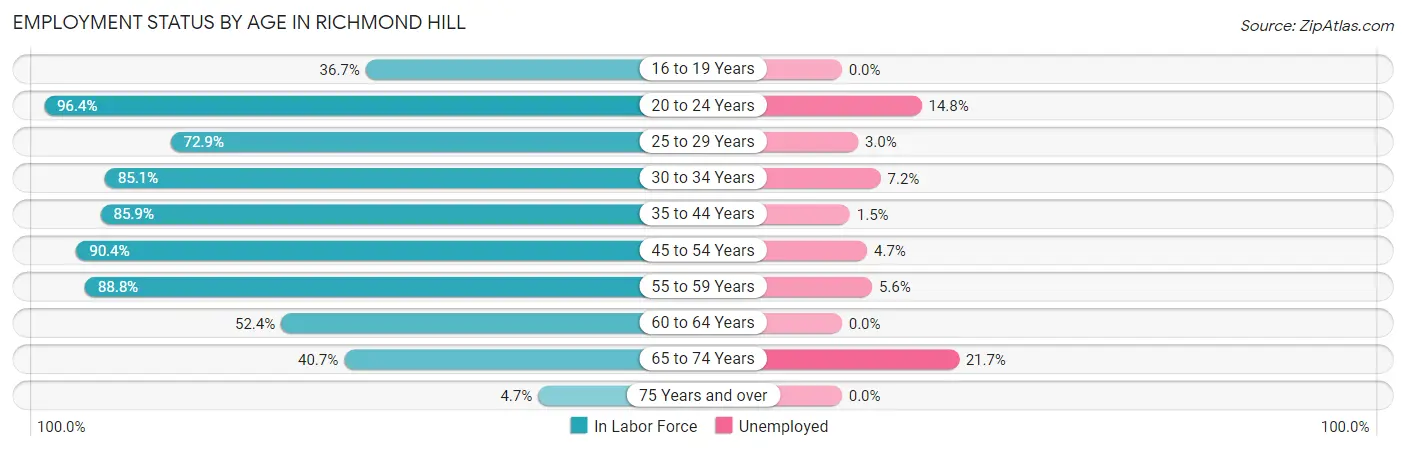
| Age Bracket | In Labor Force | Unemployed |
| 16 to 19 Years | 345 (36.7%) | 0 (0.0%) |
| 20 to 24 Years | 860 (96.4%) | 127 (14.8%) |
| 25 to 29 Years | 892 (72.9%) | 27 (3.0%) |
| 30 to 34 Years | 1,125 (85.1%) | 81 (7.2%) |
| 35 to 44 Years | 2,726 (85.9%) | 41 (1.5%) |
| 45 to 54 Years | 1,559 (90.4%) | 73 (4.7%) |
| 55 to 59 Years | 768 (88.8%) | 43 (5.6%) |
| 60 to 64 Years | 269 (52.4%) | 0 (0.0%) |
| 65 to 74 Years | 217 (40.7%) | 47 (21.7%) |
| 75 Years and over | 27 (4.7%) | 0 (0.0%) |
| Total | 8,789 (74.7%) | 439 (5.0%) |
Employment Status by Educational Attainment in Richmond Hill
According to labor force statistics for Richmond Hill, 83.2% of individuals (7,340) out of the total population between 25 and 64 years of age (8,822) are in the labor force, with 3.5% or 257 of them being unemployed. The group with the highest labor force participation rate are those with the educational attainment of bachelor's degree or higher, with 89.6% or 2,885 individuals in the labor force. Within the labor force, individuals with less than high school education have the highest percentage of unemployment, with 5.5% or 21 of them being unemployed.
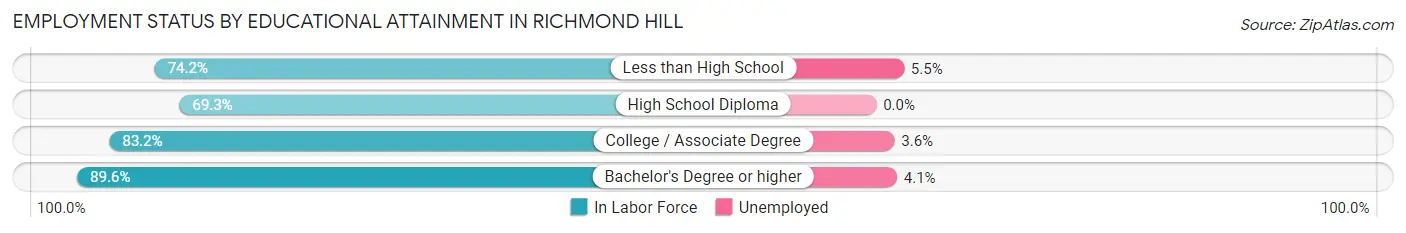
| Educational Attainment | In Labor Force | Unemployed |
| Less than High School | 380 (74.2%) | 28 (5.5%) |
| High School Diploma | 818 (69.3%) | 0 (0.0%) |
| College / Associate Degree | 3,253 (83.2%) | 141 (3.6%) |
| Bachelor's Degree or higher | 2,885 (89.6%) | 132 (4.1%) |
| Total | 7,340 (83.2%) | 309 (3.5%) |
Employment Occupations by Sex in Richmond Hill
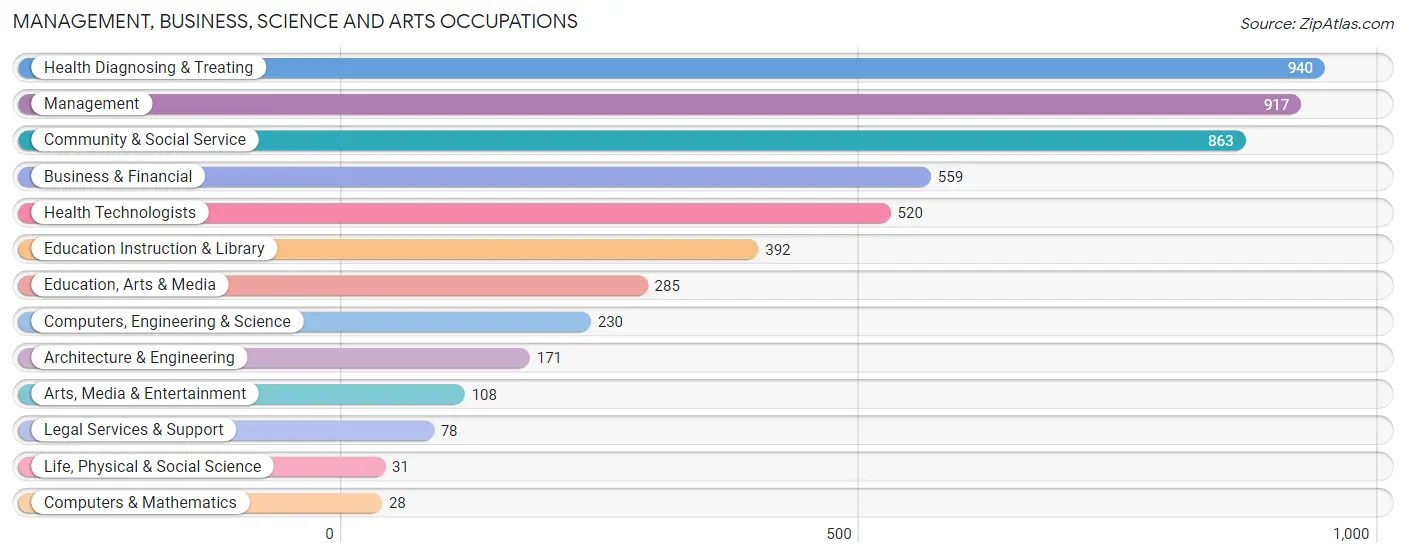
Management, Business, Science and Arts Occupations
The most common Management, Business, Science and Arts occupations in Richmond Hill are Health Diagnosing & Treating (940 | 12.7%), Management (917 | 12.4%), Community & Social Service (863 | 11.7%), Business & Financial (559 | 7.5%), and Health Technologists (520 | 7.0%).
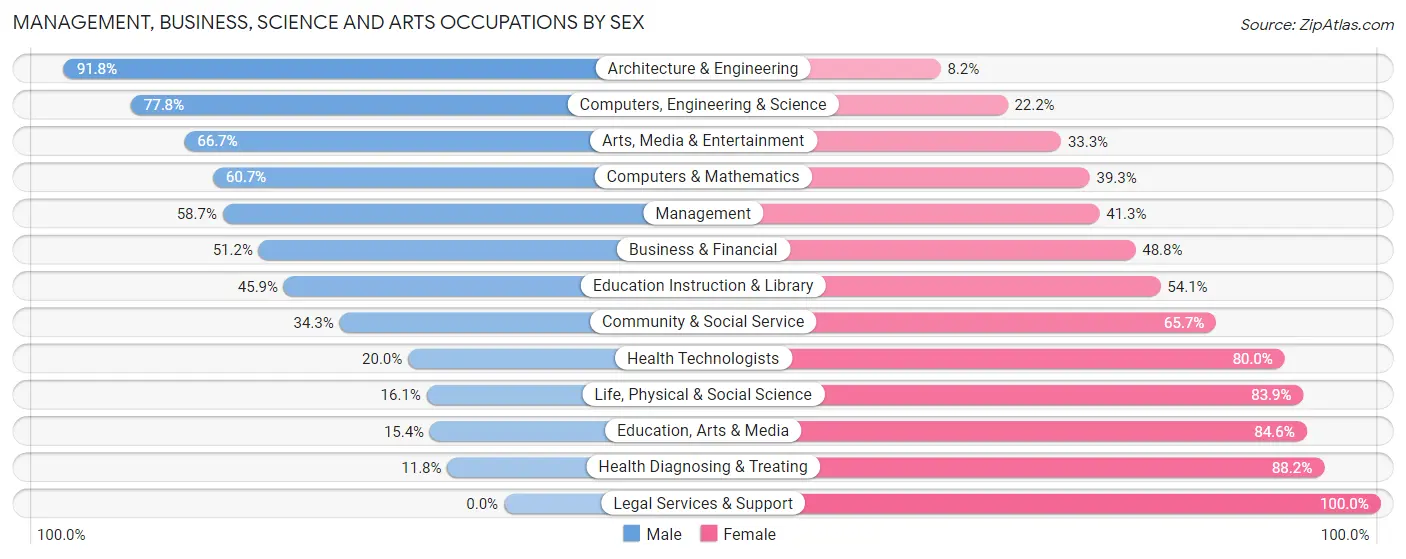
Management, Business, Science and Arts Occupations by Sex
Within the Management, Business, Science and Arts occupations in Richmond Hill, the most male-oriented occupations are Architecture & Engineering (91.8%), Computers, Engineering & Science (77.8%), and Arts, Media & Entertainment (66.7%), while the most female-oriented occupations are Legal Services & Support (100.0%), Health Diagnosing & Treating (88.2%), and Education, Arts & Media (84.6%).
| Occupation | Male | Female |
| Management | 538 (58.7%) | 379 (41.3%) |
| Business & Financial | 286 (51.2%) | 273 (48.8%) |
| Computers, Engineering & Science | 179 (77.8%) | 51 (22.2%) |
| Computers & Mathematics | 17 (60.7%) | 11 (39.3%) |
| Architecture & Engineering | 157 (91.8%) | 14 (8.2%) |
| Life, Physical & Social Science | 5 (16.1%) | 26 (83.9%) |
| Community & Social Service | 296 (34.3%) | 567 (65.7%) |
| Education, Arts & Media | 44 (15.4%) | 241 (84.6%) |
| Legal Services & Support | 0 (0.0%) | 78 (100.0%) |
| Education Instruction & Library | 180 (45.9%) | 212 (54.1%) |
| Arts, Media & Entertainment | 72 (66.7%) | 36 (33.3%) |
| Health Diagnosing & Treating | 111 (11.8%) | 829 (88.2%) |
| Health Technologists | 104 (20.0%) | 416 (80.0%) |
| Total (Category) | 1,410 (40.2%) | 2,099 (59.8%) |
| Total (Overall) | 3,283 (44.3%) | 4,125 (55.7%) |
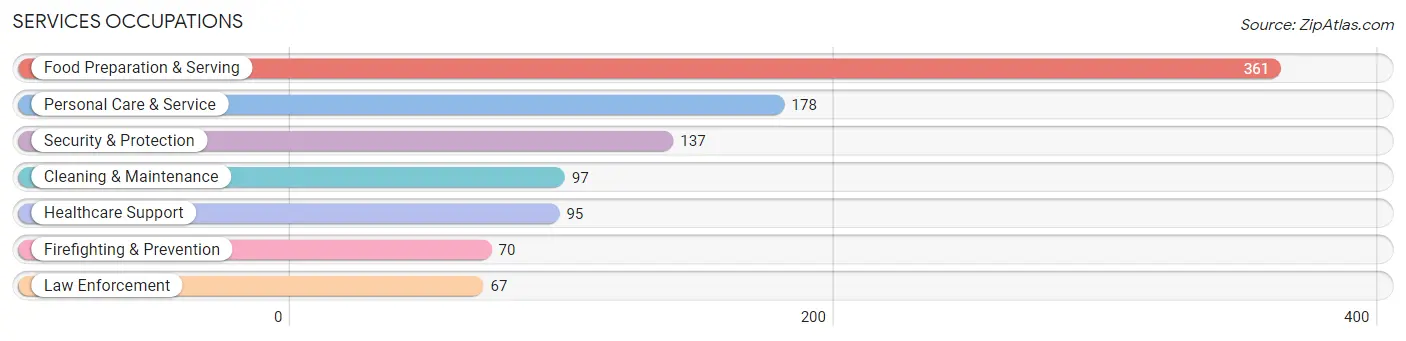
Services Occupations
The most common Services occupations in Richmond Hill are Food Preparation & Serving (361 | 4.9%), Personal Care & Service (178 | 2.4%), Security & Protection (137 | 1.8%), Cleaning & Maintenance (97 | 1.3%), and Healthcare Support (95 | 1.3%).
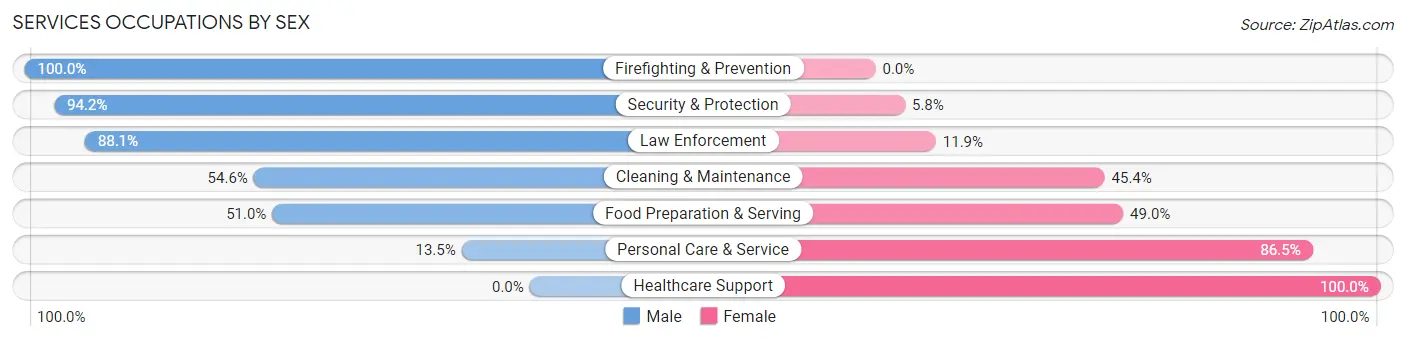
Services Occupations by Sex
Within the Services occupations in Richmond Hill, the most male-oriented occupations are Firefighting & Prevention (100.0%), Security & Protection (94.2%), and Law Enforcement (88.1%), while the most female-oriented occupations are Healthcare Support (100.0%), Personal Care & Service (86.5%), and Food Preparation & Serving (49.0%).
| Occupation | Male | Female |
| Healthcare Support | 0 (0.0%) | 95 (100.0%) |
| Security & Protection | 129 (94.2%) | 8 (5.8%) |
| Firefighting & Prevention | 70 (100.0%) | 0 (0.0%) |
| Law Enforcement | 59 (88.1%) | 8 (11.9%) |
| Food Preparation & Serving | 184 (51.0%) | 177 (49.0%) |
| Cleaning & Maintenance | 53 (54.6%) | 44 (45.4%) |
| Personal Care & Service | 24 (13.5%) | 154 (86.5%) |
| Total (Category) | 390 (44.9%) | 478 (55.1%) |
| Total (Overall) | 3,283 (44.3%) | 4,125 (55.7%) |
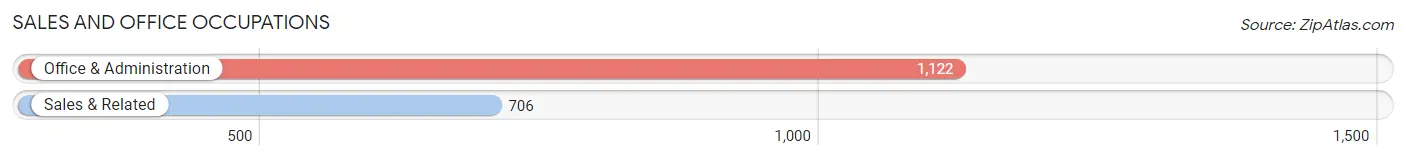
Sales and Office Occupations
The most common Sales and Office occupations in Richmond Hill are Office & Administration (1,122 | 15.1%), and Sales & Related (706 | 9.5%).
Sales and Office Occupations by Sex
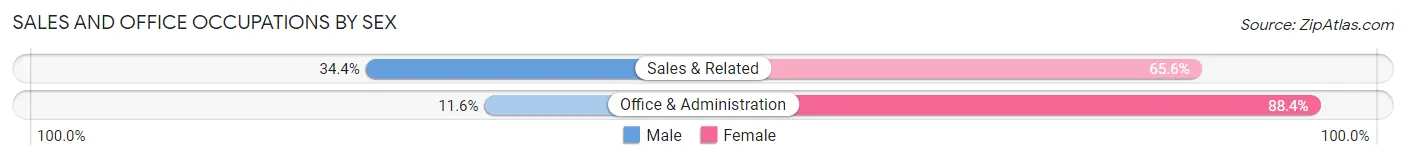
| Occupation | Male | Female |
| Sales & Related | 243 (34.4%) | 463 (65.6%) |
| Office & Administration | 130 (11.6%) | 992 (88.4%) |
| Total (Category) | 373 (20.4%) | 1,455 (79.6%) |
| Total (Overall) | 3,283 (44.3%) | 4,125 (55.7%) |
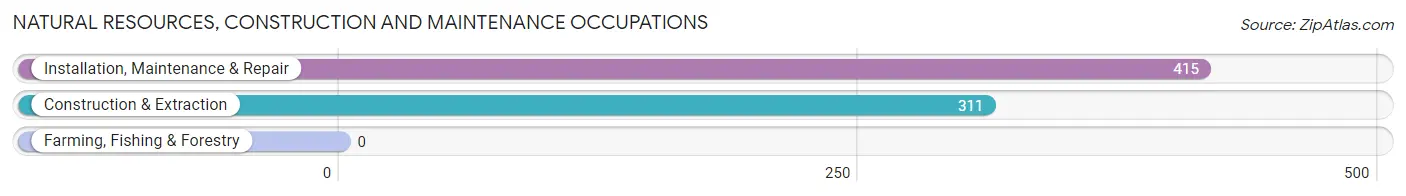
Natural Resources, Construction and Maintenance Occupations
The most common Natural Resources, Construction and Maintenance occupations in Richmond Hill are Installation, Maintenance & Repair (415 | 5.6%), and Construction & Extraction (311 | 4.2%).
Natural Resources, Construction and Maintenance Occupations by Sex
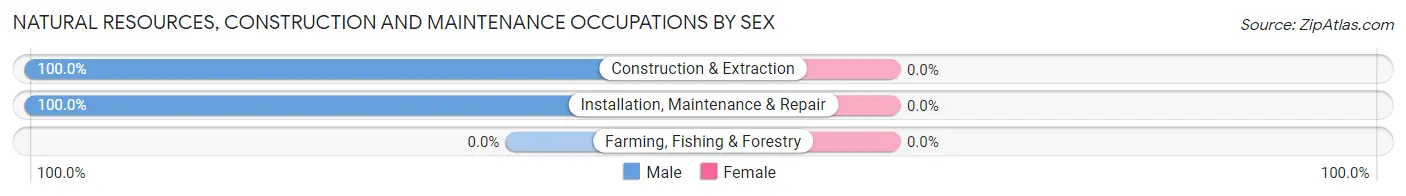
| Occupation | Male | Female |
| Farming, Fishing & Forestry | 0 (0.0%) | 0 (0.0%) |
| Construction & Extraction | 311 (100.0%) | 0 (0.0%) |
| Installation, Maintenance & Repair | 415 (100.0%) | 0 (0.0%) |
| Total (Category) | 726 (100.0%) | 0 (0.0%) |
| Total (Overall) | 3,283 (44.3%) | 4,125 (55.7%) |
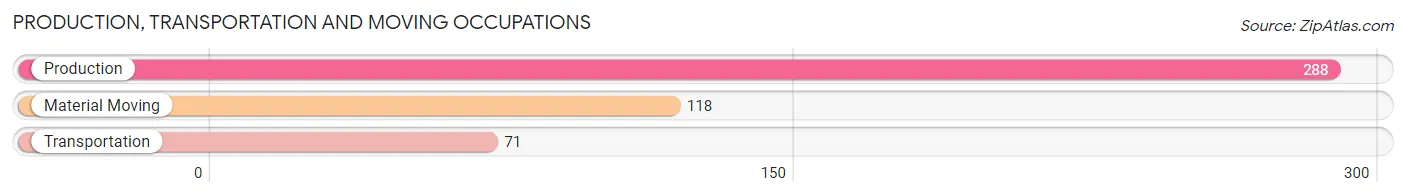
Production, Transportation and Moving Occupations
The most common Production, Transportation and Moving occupations in Richmond Hill are Production (288 | 3.9%), Material Moving (118 | 1.6%), and Transportation (71 | 1.0%).
Production, Transportation and Moving Occupations by Sex
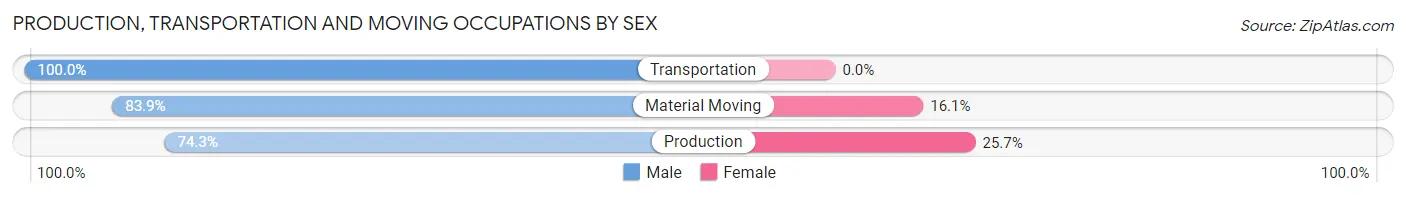
| Occupation | Male | Female |
| Production | 214 (74.3%) | 74 (25.7%) |
| Transportation | 71 (100.0%) | 0 (0.0%) |
| Material Moving | 99 (83.9%) | 19 (16.1%) |
| Total (Category) | 384 (80.5%) | 93 (19.5%) |
| Total (Overall) | 3,283 (44.3%) | 4,125 (55.7%) |
Employment Industries by Sex in Richmond Hill
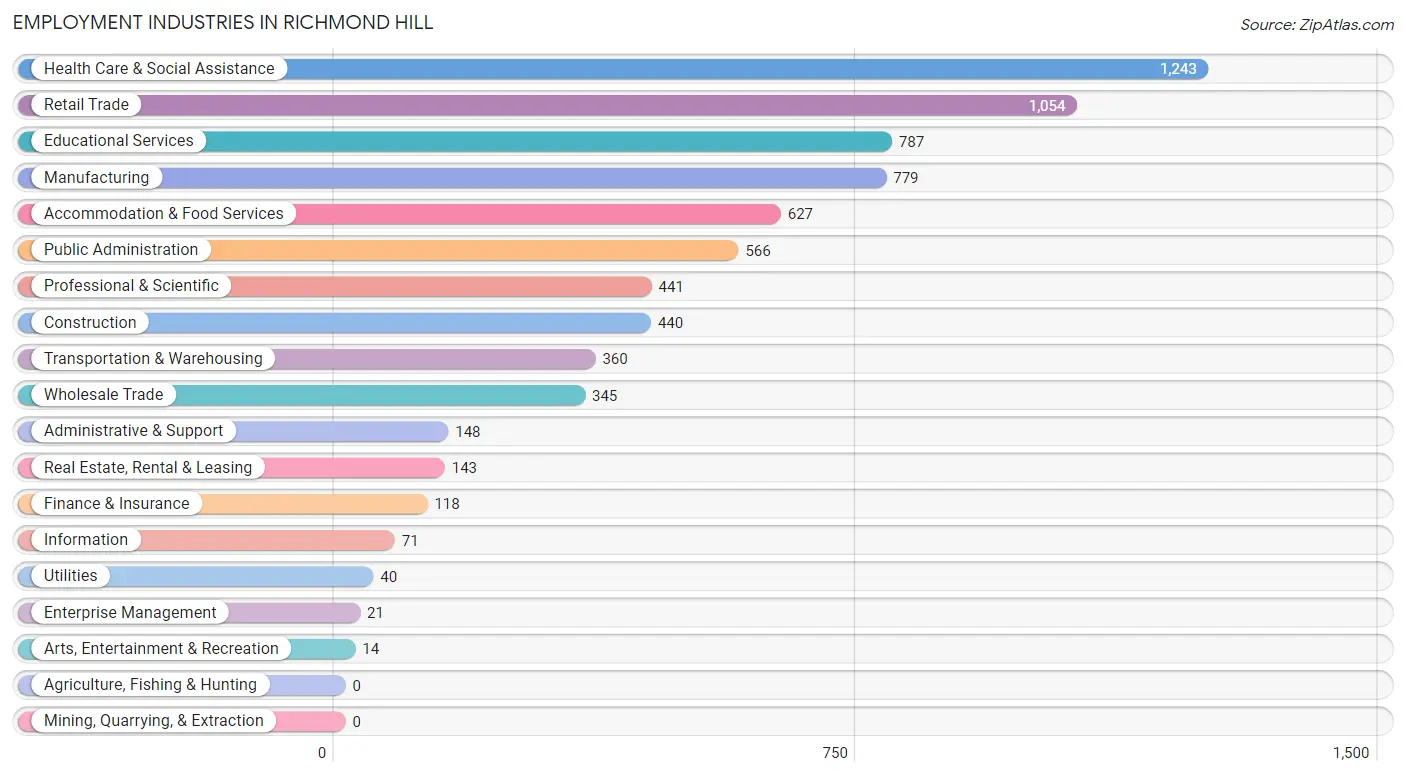
Employment Industries in Richmond Hill
The major employment industries in Richmond Hill include Health Care & Social Assistance (1,243 | 16.8%), Retail Trade (1,054 | 14.2%), Educational Services (787 | 10.6%), Manufacturing (779 | 10.5%), and Accommodation & Food Services (627 | 8.5%).
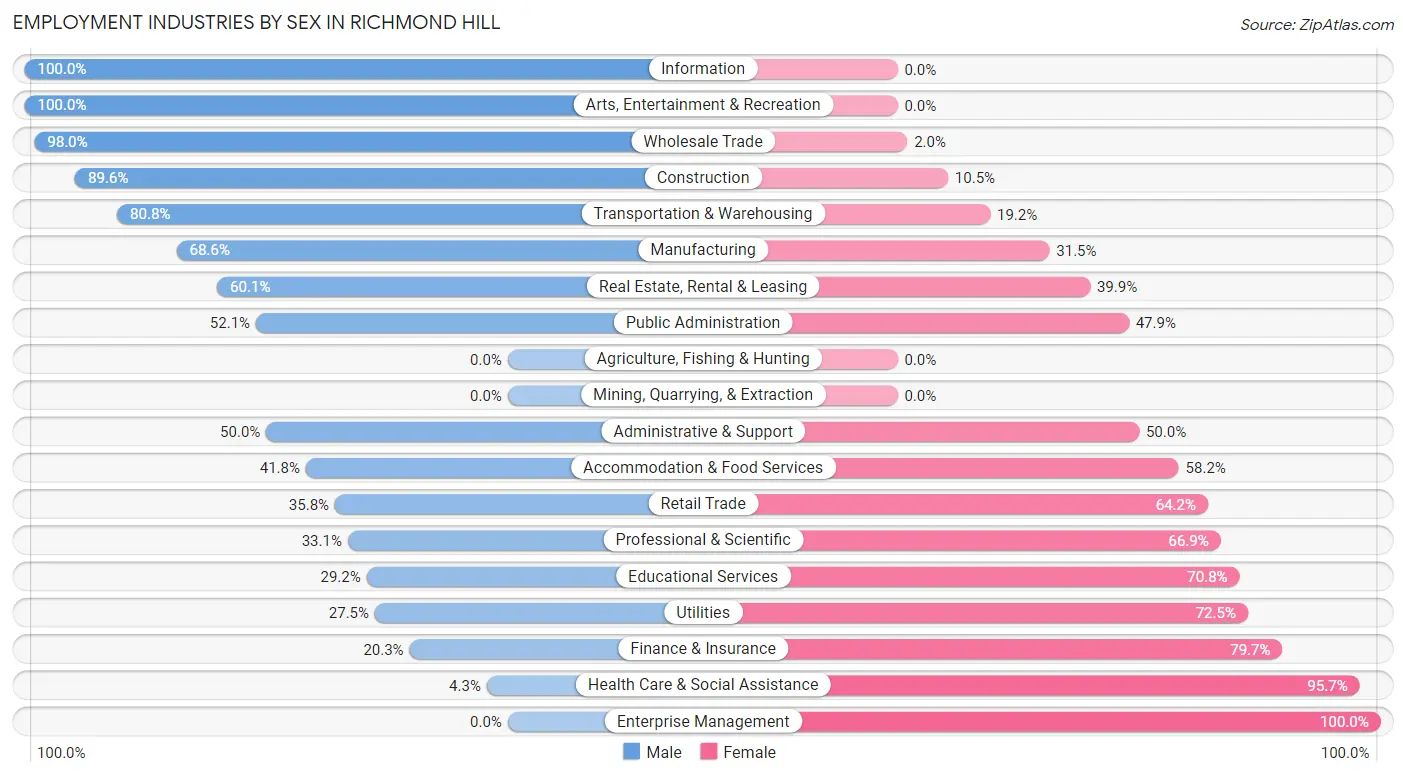
Employment Industries by Sex in Richmond Hill
The Richmond Hill industries that see more men than women are Information (100.0%), Arts, Entertainment & Recreation (100.0%), and Wholesale Trade (98.0%), whereas the industries that tend to have a higher number of women are Enterprise Management (100.0%), Health Care & Social Assistance (95.7%), and Finance & Insurance (79.7%).
| Industry | Male | Female |
| Agriculture, Fishing & Hunting | 0 (0.0%) | 0 (0.0%) |
| Mining, Quarrying, & Extraction | 0 (0.0%) | 0 (0.0%) |
| Construction | 394 (89.5%) | 46 (10.4%) |
| Manufacturing | 534 (68.5%) | 245 (31.5%) |
| Wholesale Trade | 338 (98.0%) | 7 (2.0%) |
| Retail Trade | 377 (35.8%) | 677 (64.2%) |
| Transportation & Warehousing | 291 (80.8%) | 69 (19.2%) |
| Utilities | 11 (27.5%) | 29 (72.5%) |
| Information | 71 (100.0%) | 0 (0.0%) |
| Finance & Insurance | 24 (20.3%) | 94 (79.7%) |
| Real Estate, Rental & Leasing | 86 (60.1%) | 57 (39.9%) |
| Professional & Scientific | 146 (33.1%) | 295 (66.9%) |
| Enterprise Management | 0 (0.0%) | 21 (100.0%) |
| Administrative & Support | 74 (50.0%) | 74 (50.0%) |
| Educational Services | 230 (29.2%) | 557 (70.8%) |
| Health Care & Social Assistance | 54 (4.3%) | 1,189 (95.7%) |
| Arts, Entertainment & Recreation | 14 (100.0%) | 0 (0.0%) |
| Accommodation & Food Services | 262 (41.8%) | 365 (58.2%) |
| Public Administration | 295 (52.1%) | 271 (47.9%) |
| Total | 3,283 (44.3%) | 4,125 (55.7%) |
Education in Richmond Hill
School Enrollment in Richmond Hill
The most common levels of schooling among the 5,585 students in Richmond Hill are elementary school (1,567 | 28.1%), high school (1,385 | 24.8%), and middle school (958 | 17.2%).
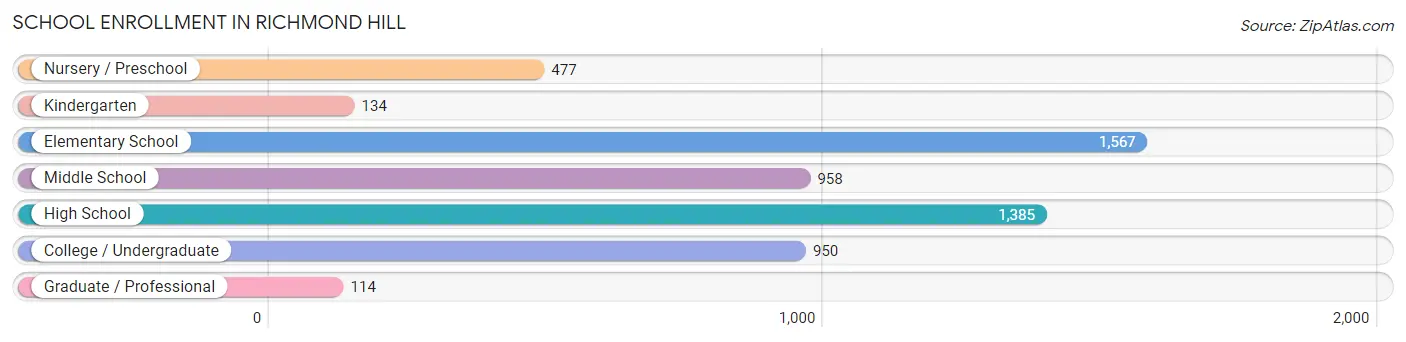
| School Level | # Students | % Students |
| Nursery / Preschool | 477 | 8.5% |
| Kindergarten | 134 | 2.4% |
| Elementary School | 1,567 | 28.1% |
| Middle School | 958 | 17.2% |
| High School | 1,385 | 24.8% |
| College / Undergraduate | 950 | 17.0% |
| Graduate / Professional | 114 | 2.0% |
| Total | 5,585 | 100.0% |
School Enrollment by Age by Funding Source in Richmond Hill
Out of a total of 5,585 students who are enrolled in schools in Richmond Hill, 581 (10.4%) attend a private institution, while the remaining 5,004 (89.6%) are enrolled in public schools. The age group of 35 years and over has the highest likelihood of being enrolled in private schools, with 146 (35.4% in the age bracket) enrolled. Conversely, the age group of 18 to 19 year olds has the lowest likelihood of being enrolled in a private school, with 190 (100.0% in the age bracket) attending a public institution.
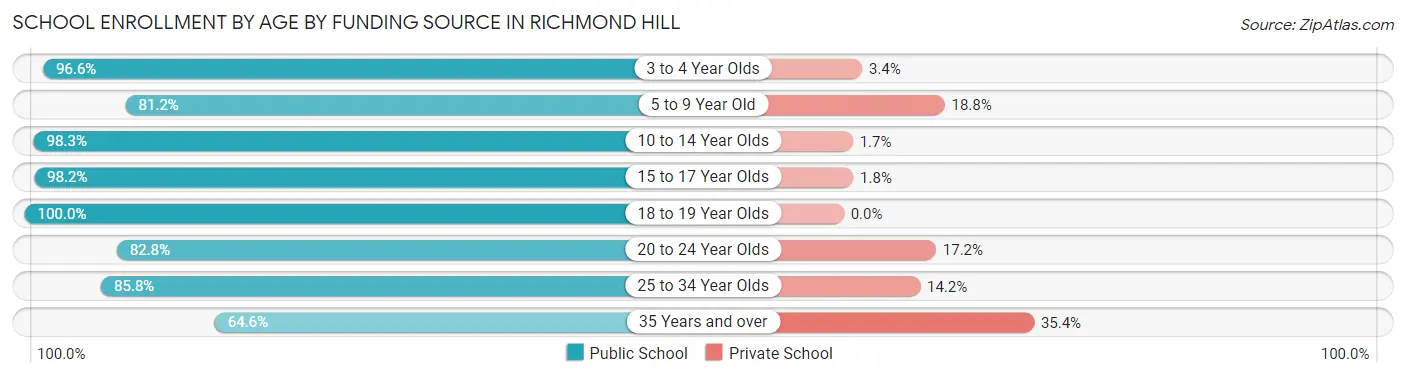
| Age Bracket | Public School | Private School |
| 3 to 4 Year Olds | 424 (96.6%) | 15 (3.4%) |
| 5 to 9 Year Old | 1,253 (81.2%) | 290 (18.8%) |
| 10 to 14 Year Olds | 1,342 (98.3%) | 23 (1.7%) |
| 15 to 17 Year Olds | 1,053 (98.2%) | 19 (1.8%) |
| 18 to 19 Year Olds | 190 (100.0%) | 0 (0.0%) |
| 20 to 24 Year Olds | 246 (82.8%) | 51 (17.2%) |
| 25 to 34 Year Olds | 229 (85.8%) | 38 (14.2%) |
| 35 Years and over | 266 (64.6%) | 146 (35.4%) |
| Total | 5,004 (89.6%) | 581 (10.4%) |
Educational Attainment by Field of Study in Richmond Hill
Science & technology (555 | 14.4%), business (501 | 13.0%), arts & humanities (403 | 10.5%), social sciences (388 | 10.1%), and bio, nature & agricultural (372 | 9.7%) are the most common fields of study among 3,843 individuals in Richmond Hill who have obtained a bachelor's degree or higher.
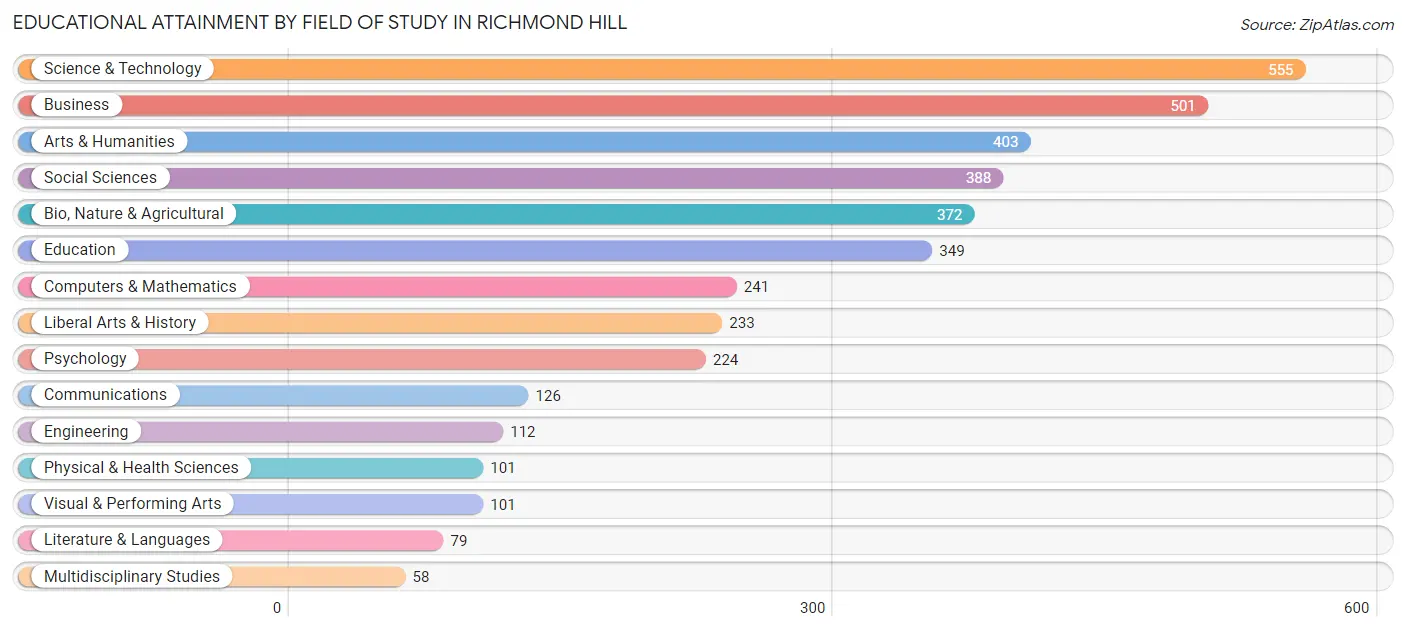
| Field of Study | # Graduates | % Graduates |
| Computers & Mathematics | 241 | 6.3% |
| Bio, Nature & Agricultural | 372 | 9.7% |
| Physical & Health Sciences | 101 | 2.6% |
| Psychology | 224 | 5.8% |
| Social Sciences | 388 | 10.1% |
| Engineering | 112 | 2.9% |
| Multidisciplinary Studies | 58 | 1.5% |
| Science & Technology | 555 | 14.4% |
| Business | 501 | 13.0% |
| Education | 349 | 9.1% |
| Literature & Languages | 79 | 2.1% |
| Liberal Arts & History | 233 | 6.1% |
| Visual & Performing Arts | 101 | 2.6% |
| Communications | 126 | 3.3% |
| Arts & Humanities | 403 | 10.5% |
| Total | 3,843 | 100.0% |
Transportation & Commute in Richmond Hill
Vehicle Availability by Sex in Richmond Hill
The most prevalent vehicle ownership categories in Richmond Hill are males with 2 vehicles (2,012, accounting for 48.3%) and females with 2 vehicles (1,852, making up 50.4%).
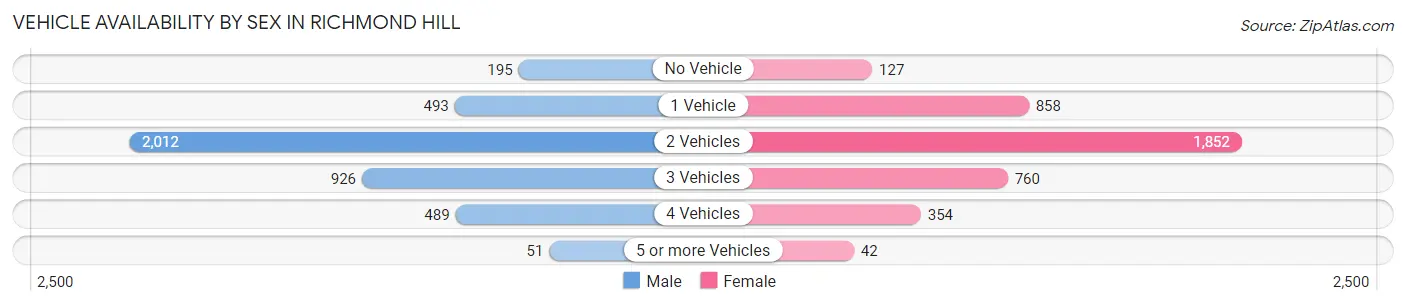
| Vehicles Available | Male | Female |
| No Vehicle | 195 (4.7%) | 127 (3.2%) |
| 1 Vehicle | 493 (11.8%) | 858 (21.5%) |
| 2 Vehicles | 2,012 (48.3%) | 1,852 (46.4%) |
| 3 Vehicles | 926 (22.2%) | 760 (19.0%) |
| 4 Vehicles | 489 (11.7%) | 354 (8.9%) |
| 5 or more Vehicles | 51 (1.2%) | 42 (1.1%) |
| Total | 4,166 (100.0%) | 3,993 (100.0%) |
Commute Time in Richmond Hill
The most frequently occuring commute durations in Richmond Hill are 30 to 34 minutes (1,771 commuters, 22.8%), 45 to 59 minutes (1,076 commuters, 13.8%), and 10 to 14 minutes (885 commuters, 11.4%).
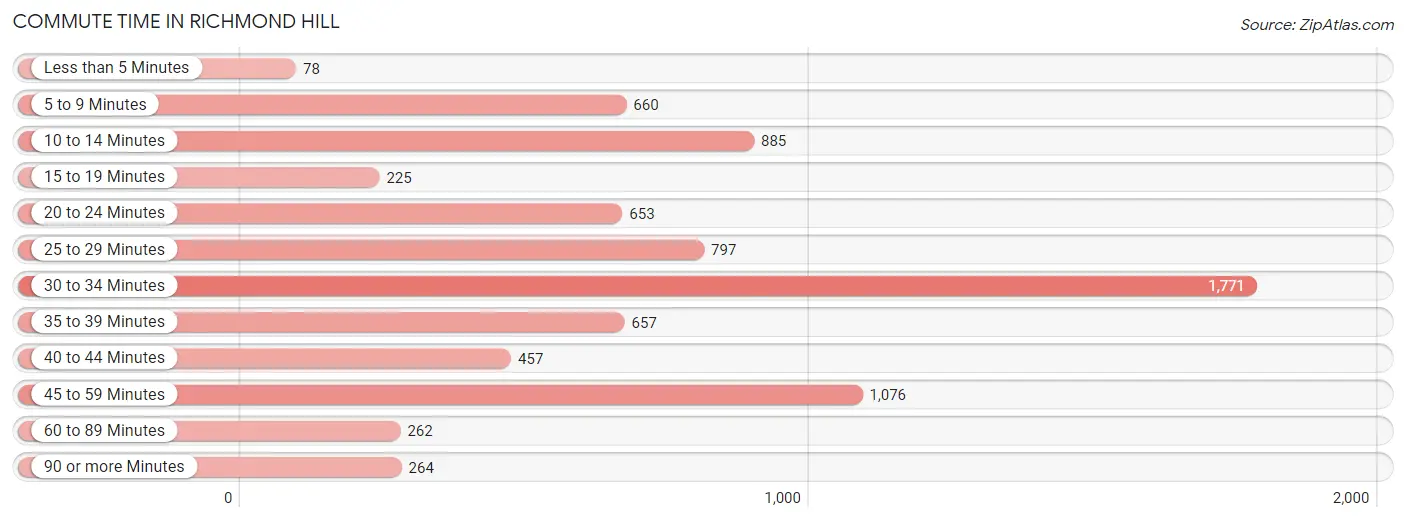
| Commute Time | # Commuters | % Commuters |
| Less than 5 Minutes | 78 | 1.0% |
| 5 to 9 Minutes | 660 | 8.5% |
| 10 to 14 Minutes | 885 | 11.4% |
| 15 to 19 Minutes | 225 | 2.9% |
| 20 to 24 Minutes | 653 | 8.4% |
| 25 to 29 Minutes | 797 | 10.2% |
| 30 to 34 Minutes | 1,771 | 22.8% |
| 35 to 39 Minutes | 657 | 8.4% |
| 40 to 44 Minutes | 457 | 5.9% |
| 45 to 59 Minutes | 1,076 | 13.8% |
| 60 to 89 Minutes | 262 | 3.4% |
| 90 or more Minutes | 264 | 3.4% |
Commute Time by Sex in Richmond Hill
The most common commute times in Richmond Hill are 30 to 34 minutes (1,226 commuters, 30.2%) for males and 5 to 9 minutes (574 commuters, 15.4%) for females.
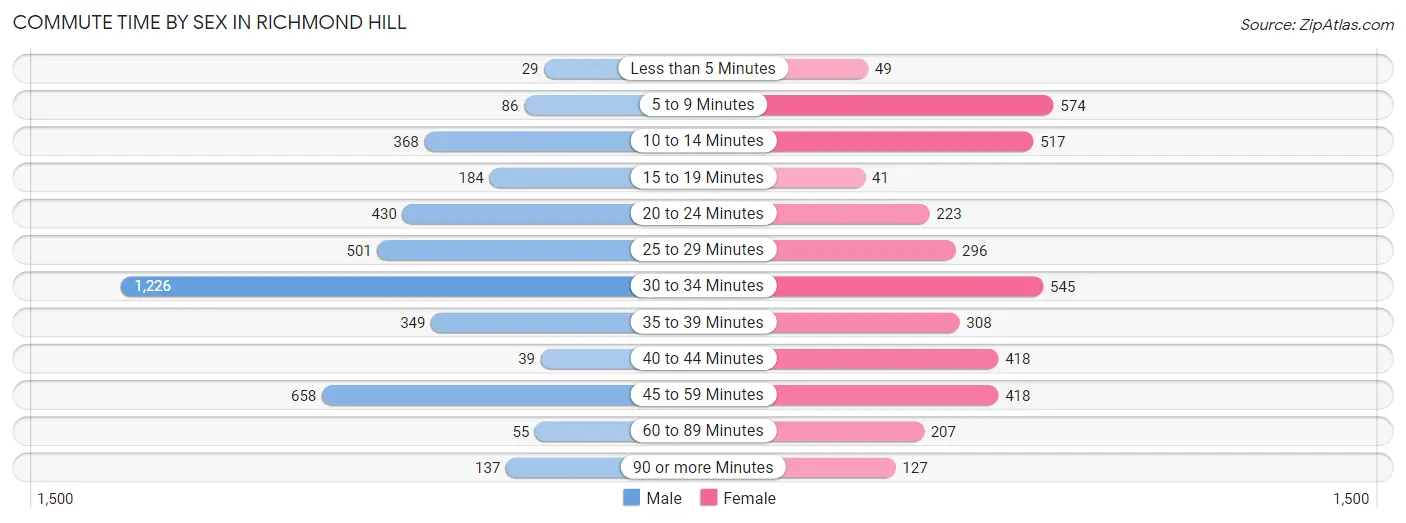
| Commute Time | Male | Female |
| Less than 5 Minutes | 29 (0.7%) | 49 (1.3%) |
| 5 to 9 Minutes | 86 (2.1%) | 574 (15.4%) |
| 10 to 14 Minutes | 368 (9.1%) | 517 (13.9%) |
| 15 to 19 Minutes | 184 (4.5%) | 41 (1.1%) |
| 20 to 24 Minutes | 430 (10.6%) | 223 (6.0%) |
| 25 to 29 Minutes | 501 (12.3%) | 296 (8.0%) |
| 30 to 34 Minutes | 1,226 (30.2%) | 545 (14.6%) |
| 35 to 39 Minutes | 349 (8.6%) | 308 (8.3%) |
| 40 to 44 Minutes | 39 (1.0%) | 418 (11.2%) |
| 45 to 59 Minutes | 658 (16.2%) | 418 (11.2%) |
| 60 to 89 Minutes | 55 (1.3%) | 207 (5.6%) |
| 90 or more Minutes | 137 (3.4%) | 127 (3.4%) |
Time of Departure to Work by Sex in Richmond Hill
The most frequent times of departure to work in Richmond Hill are 7:00 AM to 7:29 AM (738, 18.2%) for males and 7:30 AM to 7:59 AM (663, 17.8%) for females.
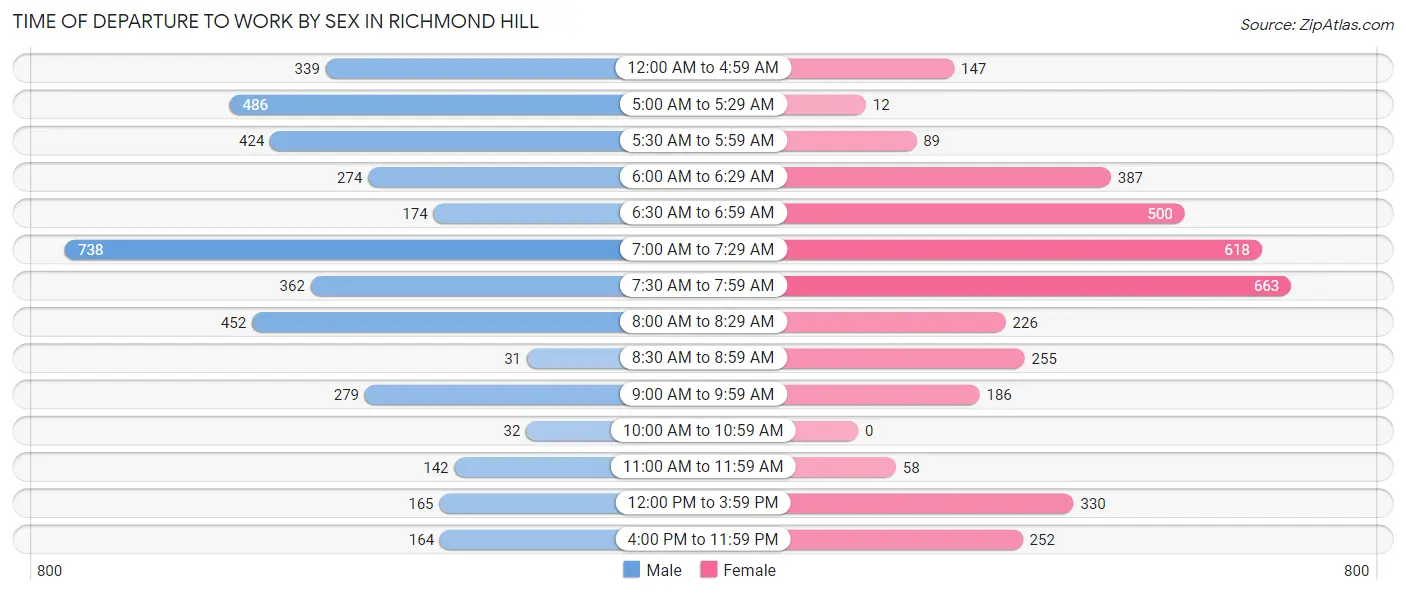
| Time of Departure | Male | Female |
| 12:00 AM to 4:59 AM | 339 (8.4%) | 147 (4.0%) |
| 5:00 AM to 5:29 AM | 486 (12.0%) | 12 (0.3%) |
| 5:30 AM to 5:59 AM | 424 (10.4%) | 89 (2.4%) |
| 6:00 AM to 6:29 AM | 274 (6.8%) | 387 (10.4%) |
| 6:30 AM to 6:59 AM | 174 (4.3%) | 500 (13.4%) |
| 7:00 AM to 7:29 AM | 738 (18.2%) | 618 (16.6%) |
| 7:30 AM to 7:59 AM | 362 (8.9%) | 663 (17.8%) |
| 8:00 AM to 8:29 AM | 452 (11.1%) | 226 (6.1%) |
| 8:30 AM to 8:59 AM | 31 (0.8%) | 255 (6.9%) |
| 9:00 AM to 9:59 AM | 279 (6.9%) | 186 (5.0%) |
| 10:00 AM to 10:59 AM | 32 (0.8%) | 0 (0.0%) |
| 11:00 AM to 11:59 AM | 142 (3.5%) | 58 (1.6%) |
| 12:00 PM to 3:59 PM | 165 (4.1%) | 330 (8.9%) |
| 4:00 PM to 11:59 PM | 164 (4.0%) | 252 (6.8%) |
| Total | 4,062 (100.0%) | 3,723 (100.0%) |
Housing Occupancy in Richmond Hill
Occupancy by Ownership in Richmond Hill
Of the total 5,936 dwellings in Richmond Hill, owner-occupied units account for 3,690 (62.2%), while renter-occupied units make up 2,246 (37.8%).
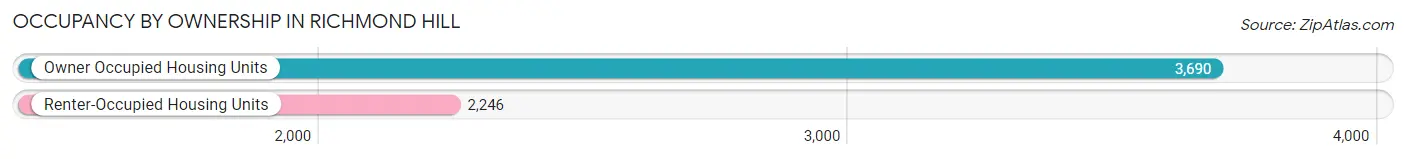
| Occupancy | # Housing Units | % Housing Units |
| Owner Occupied Housing Units | 3,690 | 62.2% |
| Renter-Occupied Housing Units | 2,246 | 37.8% |
| Total Occupied Housing Units | 5,936 | 100.0% |
Occupancy by Household Size in Richmond Hill
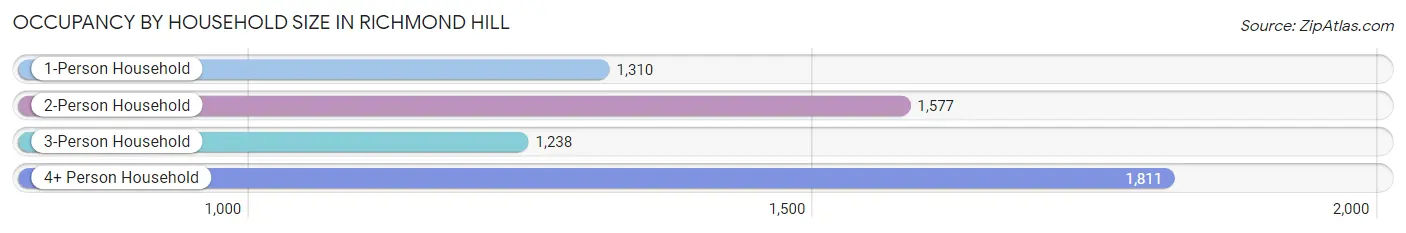
| Household Size | # Housing Units | % Housing Units |
| 1-Person Household | 1,310 | 22.1% |
| 2-Person Household | 1,577 | 26.6% |
| 3-Person Household | 1,238 | 20.9% |
| 4+ Person Household | 1,811 | 30.5% |
| Total Housing Units | 5,936 | 100.0% |
Occupancy by Ownership by Household Size in Richmond Hill
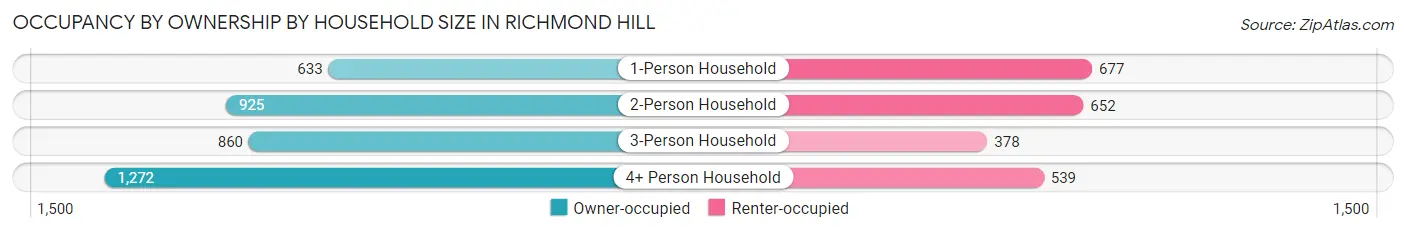
| Household Size | Owner-occupied | Renter-occupied |
| 1-Person Household | 633 (48.3%) | 677 (51.7%) |
| 2-Person Household | 925 (58.7%) | 652 (41.3%) |
| 3-Person Household | 860 (69.5%) | 378 (30.5%) |
| 4+ Person Household | 1,272 (70.2%) | 539 (29.8%) |
| Total Housing Units | 3,690 (62.2%) | 2,246 (37.8%) |
Occupancy by Educational Attainment in Richmond Hill
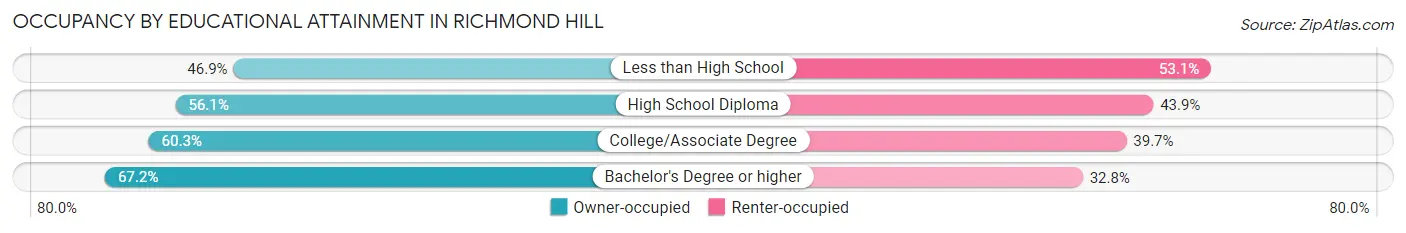
| Household Size | Owner-occupied | Renter-occupied |
| Less than High School | 75 (46.9%) | 85 (53.1%) |
| High School Diploma | 444 (56.1%) | 348 (43.9%) |
| College/Associate Degree | 1,572 (60.3%) | 1,034 (39.7%) |
| Bachelor's Degree or higher | 1,599 (67.2%) | 779 (32.8%) |
Occupancy by Age of Householder in Richmond Hill
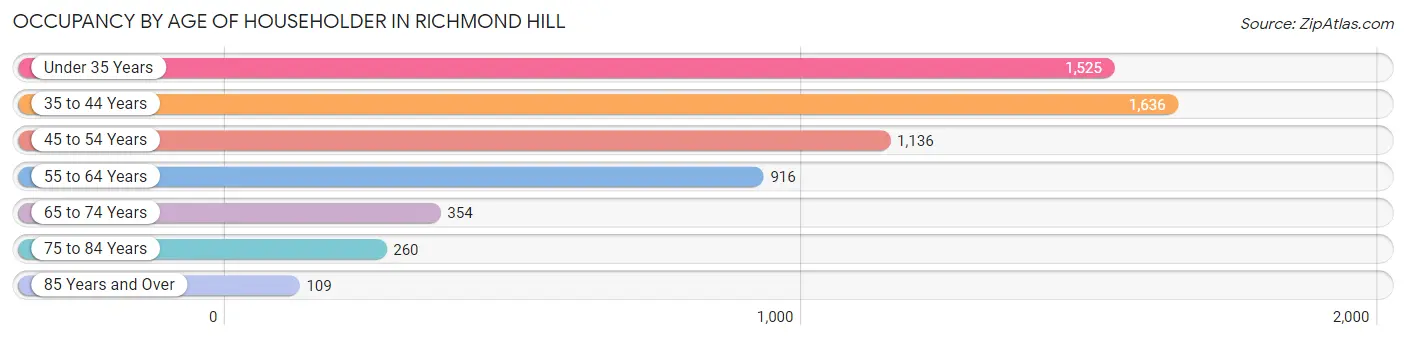
| Age Bracket | # Households | % Households |
| Under 35 Years | 1,525 | 25.7% |
| 35 to 44 Years | 1,636 | 27.6% |
| 45 to 54 Years | 1,136 | 19.1% |
| 55 to 64 Years | 916 | 15.4% |
| 65 to 74 Years | 354 | 6.0% |
| 75 to 84 Years | 260 | 4.4% |
| 85 Years and Over | 109 | 1.8% |
| Total | 5,936 | 100.0% |
Housing Finances in Richmond Hill
Median Income by Occupancy in Richmond Hill
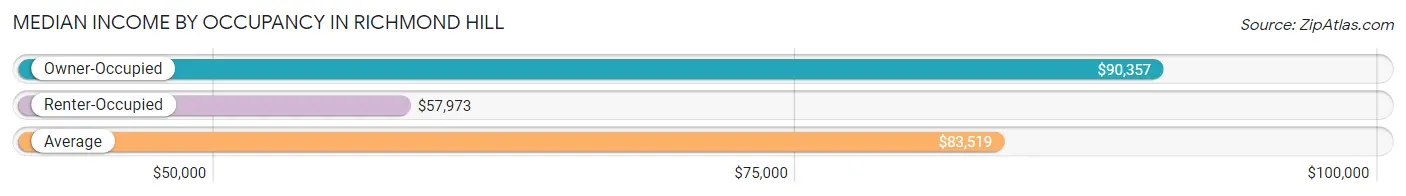
| Occupancy Type | # Households | Median Income |
| Owner-Occupied | 3,690 (62.2%) | $90,357 |
| Renter-Occupied | 2,246 (37.8%) | $57,973 |
| Average | 5,936 (100.0%) | $83,519 |
Occupancy by Householder Income Bracket in Richmond Hill
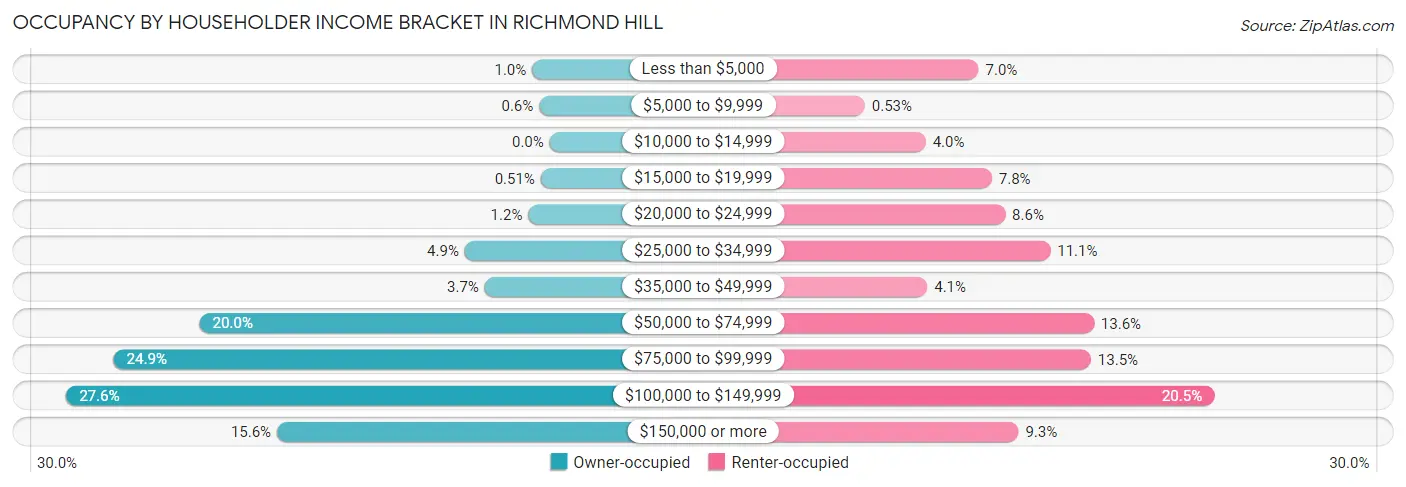
| Income Bracket | Owner-occupied | Renter-occupied |
| Less than $5,000 | 37 (1.0%) | 158 (7.0%) |
| $5,000 to $9,999 | 22 (0.6%) | 12 (0.5%) |
| $10,000 to $14,999 | 0 (0.0%) | 90 (4.0%) |
| $15,000 to $19,999 | 19 (0.5%) | 175 (7.8%) |
| $20,000 to $24,999 | 45 (1.2%) | 192 (8.6%) |
| $25,000 to $34,999 | 179 (4.9%) | 250 (11.1%) |
| $35,000 to $49,999 | 137 (3.7%) | 92 (4.1%) |
| $50,000 to $74,999 | 738 (20.0%) | 306 (13.6%) |
| $75,000 to $99,999 | 919 (24.9%) | 302 (13.5%) |
| $100,000 to $149,999 | 1,019 (27.6%) | 460 (20.5%) |
| $150,000 or more | 575 (15.6%) | 209 (9.3%) |
| Total | 3,690 (100.0%) | 2,246 (100.0%) |
Monthly Housing Cost Tiers in Richmond Hill
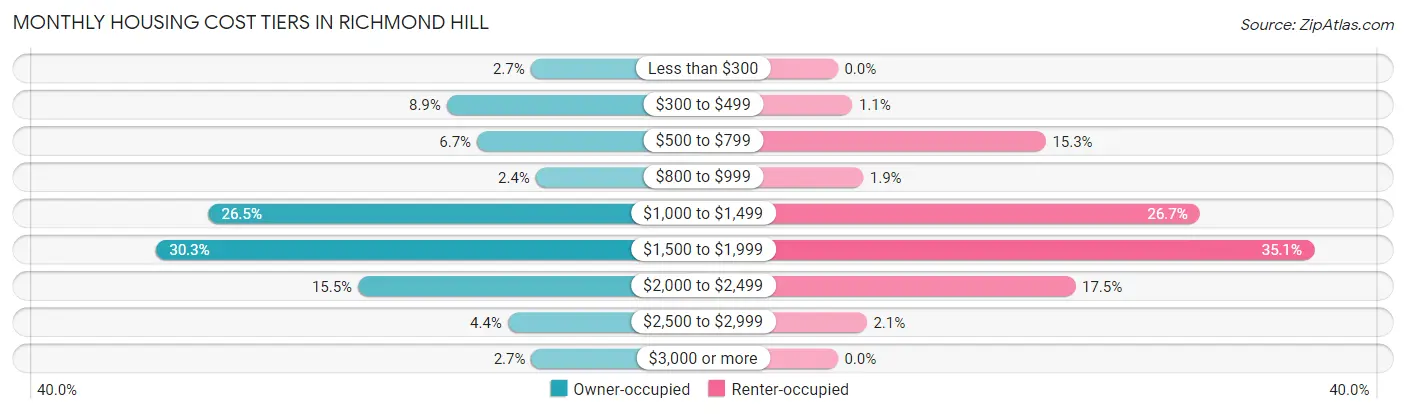
| Monthly Cost | Owner-occupied | Renter-occupied |
| Less than $300 | 101 (2.7%) | 0 (0.0%) |
| $300 to $499 | 329 (8.9%) | 24 (1.1%) |
| $500 to $799 | 247 (6.7%) | 344 (15.3%) |
| $800 to $999 | 87 (2.4%) | 42 (1.9%) |
| $1,000 to $1,499 | 976 (26.5%) | 599 (26.7%) |
| $1,500 to $1,999 | 1,118 (30.3%) | 788 (35.1%) |
| $2,000 to $2,499 | 570 (15.4%) | 393 (17.5%) |
| $2,500 to $2,999 | 163 (4.4%) | 48 (2.1%) |
| $3,000 or more | 99 (2.7%) | 0 (0.0%) |
| Total | 3,690 (100.0%) | 2,246 (100.0%) |
Physical Housing Characteristics in Richmond Hill
Housing Structures in Richmond Hill
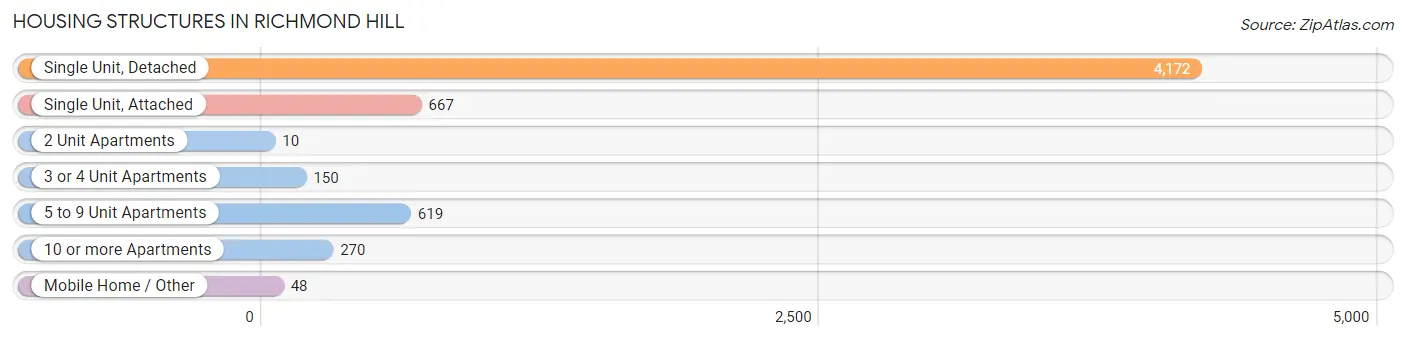
| Structure Type | # Housing Units | % Housing Units |
| Single Unit, Detached | 4,172 | 70.3% |
| Single Unit, Attached | 667 | 11.2% |
| 2 Unit Apartments | 10 | 0.2% |
| 3 or 4 Unit Apartments | 150 | 2.5% |
| 5 to 9 Unit Apartments | 619 | 10.4% |
| 10 or more Apartments | 270 | 4.5% |
| Mobile Home / Other | 48 | 0.8% |
| Total | 5,936 | 100.0% |
Housing Structures by Occupancy in Richmond Hill
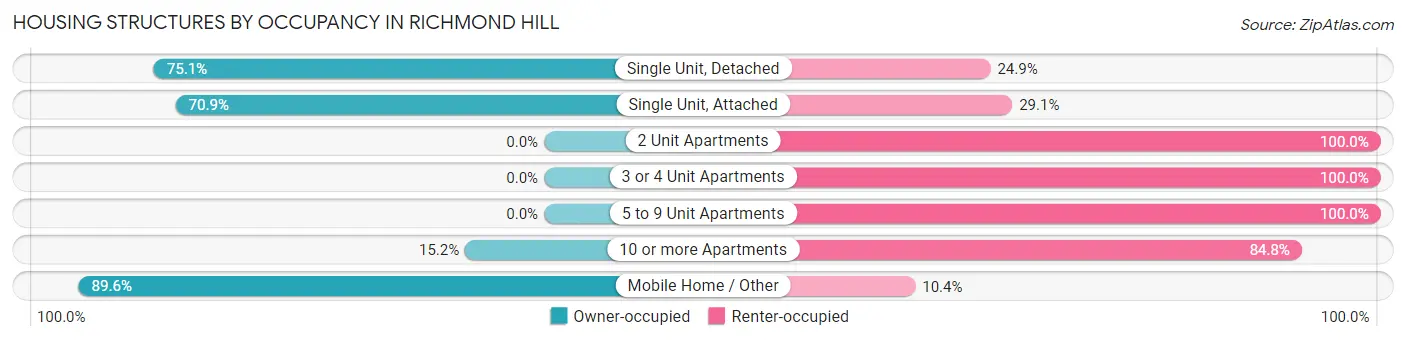
| Structure Type | Owner-occupied | Renter-occupied |
| Single Unit, Detached | 3,133 (75.1%) | 1,039 (24.9%) |
| Single Unit, Attached | 473 (70.9%) | 194 (29.1%) |
| 2 Unit Apartments | 0 (0.0%) | 10 (100.0%) |
| 3 or 4 Unit Apartments | 0 (0.0%) | 150 (100.0%) |
| 5 to 9 Unit Apartments | 0 (0.0%) | 619 (100.0%) |
| 10 or more Apartments | 41 (15.2%) | 229 (84.8%) |
| Mobile Home / Other | 43 (89.6%) | 5 (10.4%) |
| Total | 3,690 (62.2%) | 2,246 (37.8%) |
Housing Structures by Number of Rooms in Richmond Hill
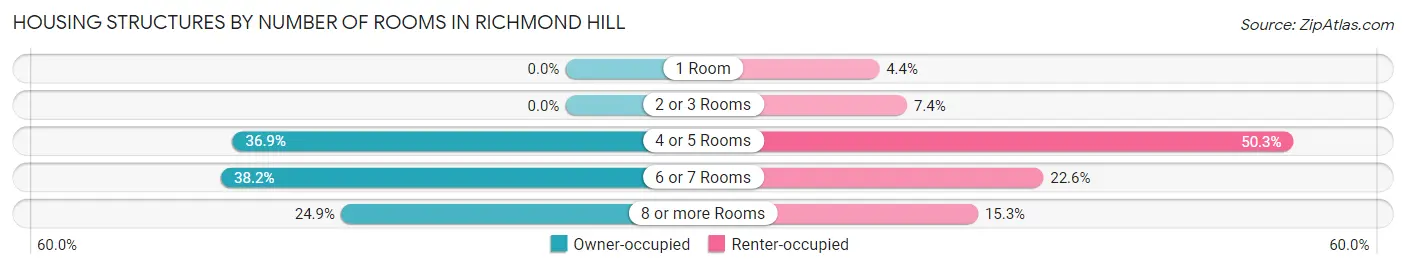
| Number of Rooms | Owner-occupied | Renter-occupied |
| 1 Room | 0 (0.0%) | 98 (4.4%) |
| 2 or 3 Rooms | 0 (0.0%) | 167 (7.4%) |
| 4 or 5 Rooms | 1,362 (36.9%) | 1,130 (50.3%) |
| 6 or 7 Rooms | 1,409 (38.2%) | 507 (22.6%) |
| 8 or more Rooms | 919 (24.9%) | 344 (15.3%) |
| Total | 3,690 (100.0%) | 2,246 (100.0%) |
Housing Structure by Heating Type in Richmond Hill
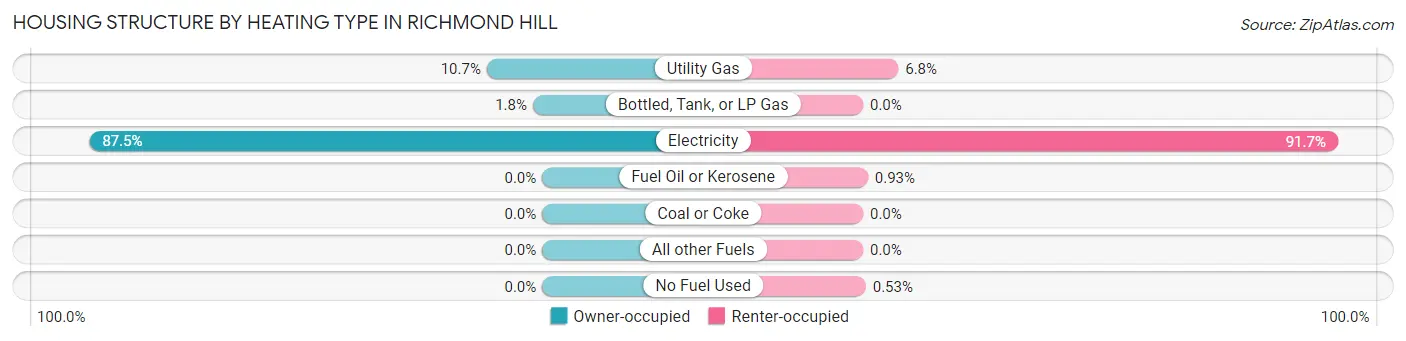
| Heating Type | Owner-occupied | Renter-occupied |
| Utility Gas | 395 (10.7%) | 153 (6.8%) |
| Bottled, Tank, or LP Gas | 66 (1.8%) | 0 (0.0%) |
| Electricity | 3,229 (87.5%) | 2,060 (91.7%) |
| Fuel Oil or Kerosene | 0 (0.0%) | 21 (0.9%) |
| Coal or Coke | 0 (0.0%) | 0 (0.0%) |
| All other Fuels | 0 (0.0%) | 0 (0.0%) |
| No Fuel Used | 0 (0.0%) | 12 (0.5%) |
| Total | 3,690 (100.0%) | 2,246 (100.0%) |
Household Vehicle Usage in Richmond Hill
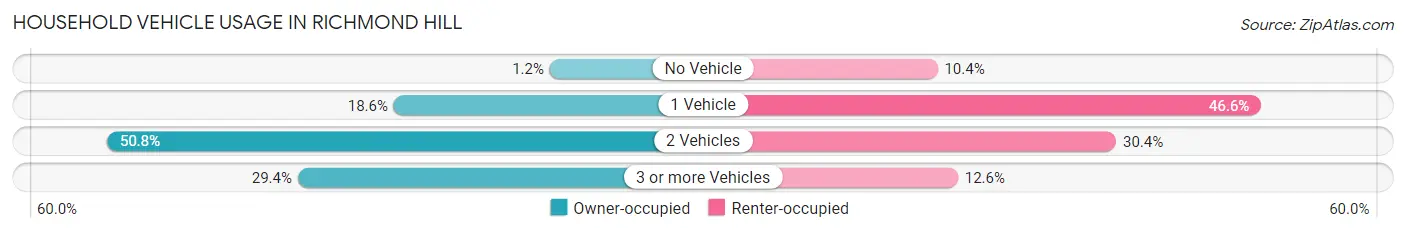
| Vehicles per Household | Owner-occupied | Renter-occupied |
| No Vehicle | 43 (1.2%) | 233 (10.4%) |
| 1 Vehicle | 688 (18.6%) | 1,047 (46.6%) |
| 2 Vehicles | 1,874 (50.8%) | 682 (30.4%) |
| 3 or more Vehicles | 1,085 (29.4%) | 284 (12.6%) |
| Total | 3,690 (100.0%) | 2,246 (100.0%) |
Real Estate & Mortgages in Richmond Hill
Real Estate and Mortgage Overview in Richmond Hill
| Characteristic | Without Mortgage | With Mortgage |
| Housing Units | 781 | 2,909 |
| Median Property Value | $215,500 | $249,600 |
| Median Household Income | $76,664 | $492 |
| Monthly Housing Costs | $491 | $99 |
| Real Estate Taxes | $1,460 | $72 |
Property Value by Mortgage Status in Richmond Hill
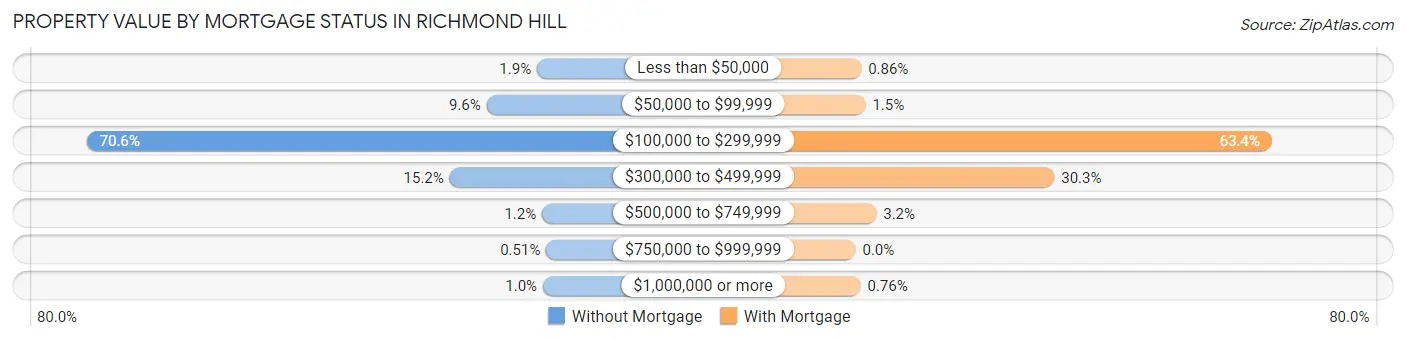
| Property Value | Without Mortgage | With Mortgage |
| Less than $50,000 | 15 (1.9%) | 25 (0.9%) |
| $50,000 to $99,999 | 75 (9.6%) | 44 (1.5%) |
| $100,000 to $299,999 | 551 (70.6%) | 1,845 (63.4%) |
| $300,000 to $499,999 | 119 (15.2%) | 881 (30.3%) |
| $500,000 to $749,999 | 9 (1.1%) | 92 (3.2%) |
| $750,000 to $999,999 | 4 (0.5%) | 0 (0.0%) |
| $1,000,000 or more | 8 (1.0%) | 22 (0.8%) |
| Total | 781 (100.0%) | 2,909 (100.0%) |
Household Income by Mortgage Status in Richmond Hill
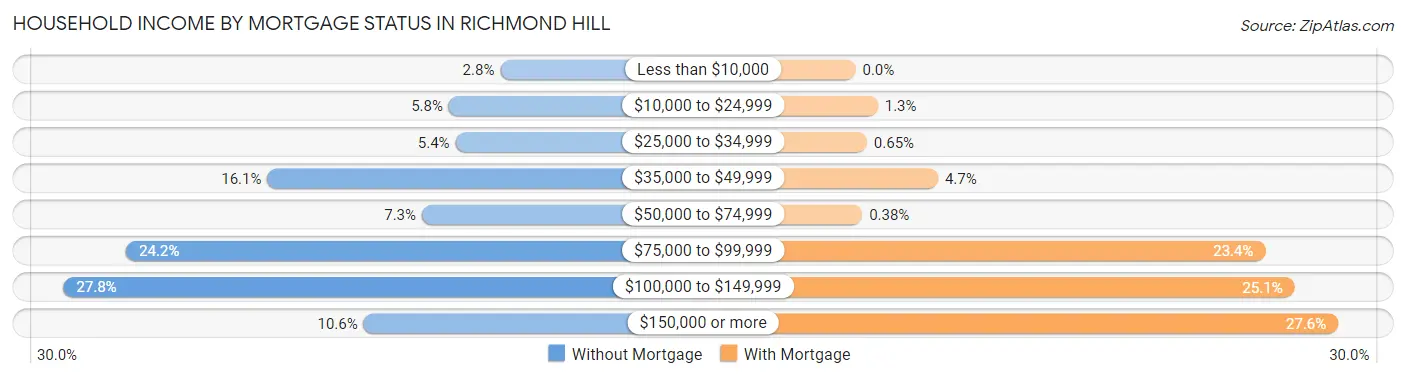
| Household Income | Without Mortgage | With Mortgage |
| Less than $10,000 | 22 (2.8%) | 0 (0.0%) |
| $10,000 to $24,999 | 45 (5.8%) | 37 (1.3%) |
| $25,000 to $34,999 | 42 (5.4%) | 19 (0.6%) |
| $35,000 to $49,999 | 126 (16.1%) | 137 (4.7%) |
| $50,000 to $74,999 | 57 (7.3%) | 11 (0.4%) |
| $75,000 to $99,999 | 189 (24.2%) | 681 (23.4%) |
| $100,000 to $149,999 | 217 (27.8%) | 730 (25.1%) |
| $150,000 or more | 83 (10.6%) | 802 (27.6%) |
| Total | 781 (100.0%) | 2,909 (100.0%) |
Property Value to Household Income Ratio in Richmond Hill
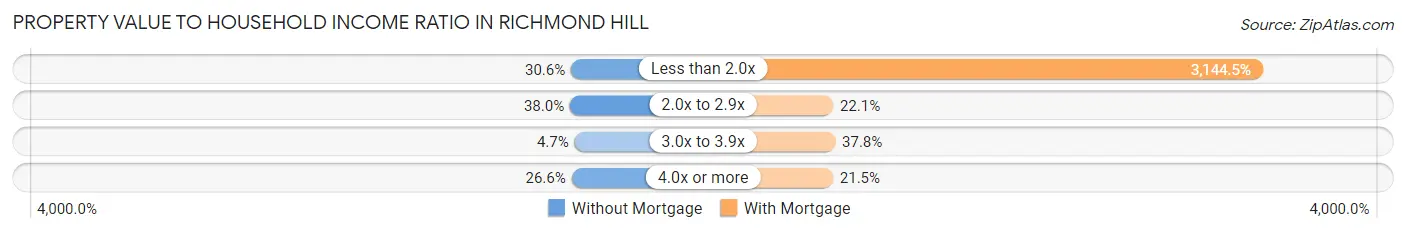
| Value-to-Income Ratio | Without Mortgage | With Mortgage |
| Less than 2.0x | 239 (30.6%) | 91,473 (3,144.5%) |
| 2.0x to 2.9x | 297 (38.0%) | 644 (22.1%) |
| 3.0x to 3.9x | 37 (4.7%) | 1,099 (37.8%) |
| 4.0x or more | 208 (26.6%) | 625 (21.5%) |
| Total | 781 (100.0%) | 2,909 (100.0%) |
Real Estate Taxes by Mortgage Status in Richmond Hill
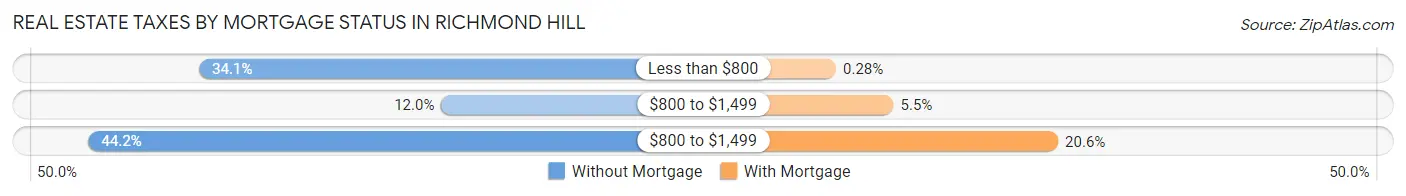
| Property Taxes | Without Mortgage | With Mortgage |
| Less than $800 | 266 (34.1%) | 8 (0.3%) |
| $800 to $1,499 | 94 (12.0%) | 161 (5.5%) |
| $800 to $1,499 | 345 (44.2%) | 598 (20.6%) |
| Total | 781 (100.0%) | 2,909 (100.0%) |
Health & Disability in Richmond Hill
Health Insurance Coverage by Age in Richmond Hill
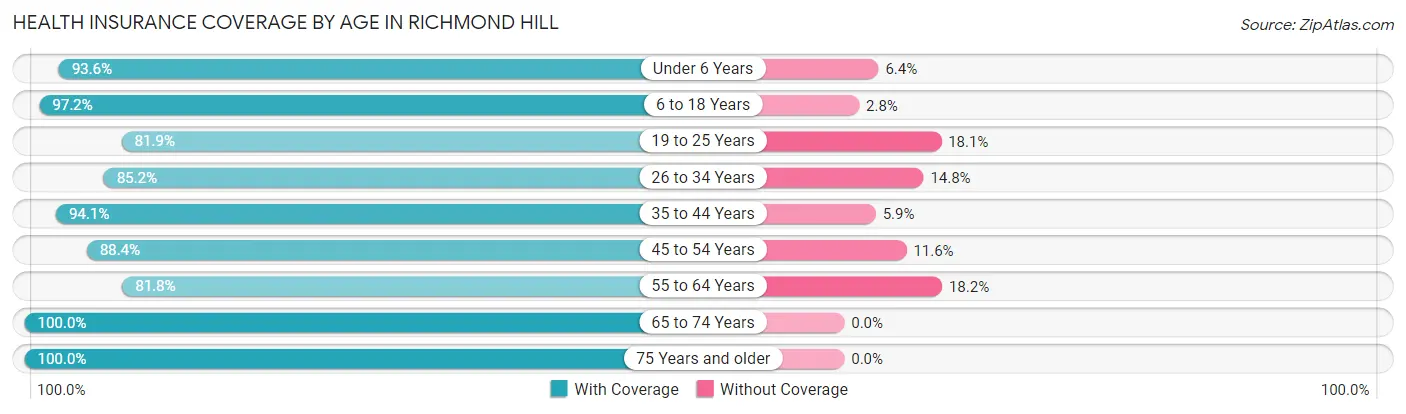
| Age Bracket | With Coverage | Without Coverage |
| Under 6 Years | 1,529 (93.6%) | 104 (6.4%) |
| 6 to 18 Years | 3,977 (97.2%) | 113 (2.8%) |
| 19 to 25 Years | 1,052 (81.9%) | 232 (18.1%) |
| 26 to 34 Years | 1,421 (85.2%) | 246 (14.8%) |
| 35 to 44 Years | 2,681 (94.1%) | 167 (5.9%) |
| 45 to 54 Years | 1,503 (88.4%) | 197 (11.6%) |
| 55 to 64 Years | 1,118 (81.8%) | 249 (18.2%) |
| 65 to 74 Years | 504 (100.0%) | 0 (0.0%) |
| 75 Years and older | 505 (100.0%) | 0 (0.0%) |
| Total | 14,290 (91.6%) | 1,308 (8.4%) |
Health Insurance Coverage by Citizenship Status in Richmond Hill
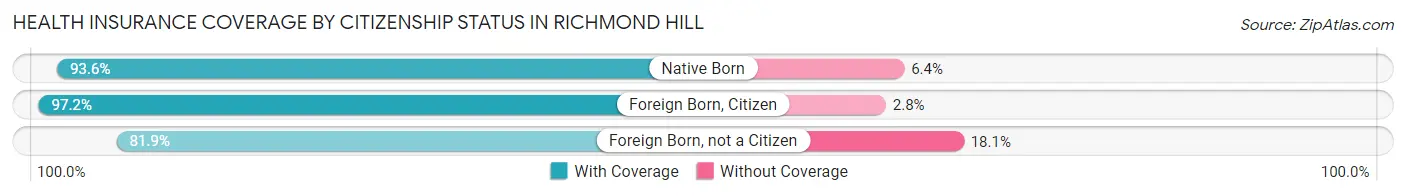
| Citizenship Status | With Coverage | Without Coverage |
| Native Born | 1,529 (93.6%) | 104 (6.4%) |
| Foreign Born, Citizen | 3,977 (97.2%) | 113 (2.8%) |
| Foreign Born, not a Citizen | 1,052 (81.9%) | 232 (18.1%) |
Health Insurance Coverage by Household Income in Richmond Hill
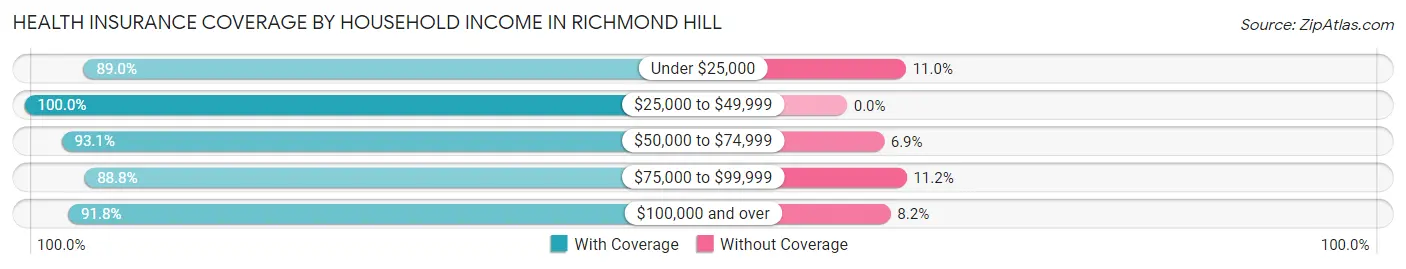
| Household Income | With Coverage | Without Coverage |
| Under $25,000 | 1,201 (89.0%) | 149 (11.0%) |
| $25,000 to $49,999 | 976 (100.0%) | 0 (0.0%) |
| $50,000 to $74,999 | 2,617 (93.1%) | 195 (6.9%) |
| $75,000 to $99,999 | 3,018 (88.8%) | 380 (11.2%) |
| $100,000 and over | 6,478 (91.8%) | 576 (8.2%) |
Public vs Private Health Insurance Coverage by Age in Richmond Hill
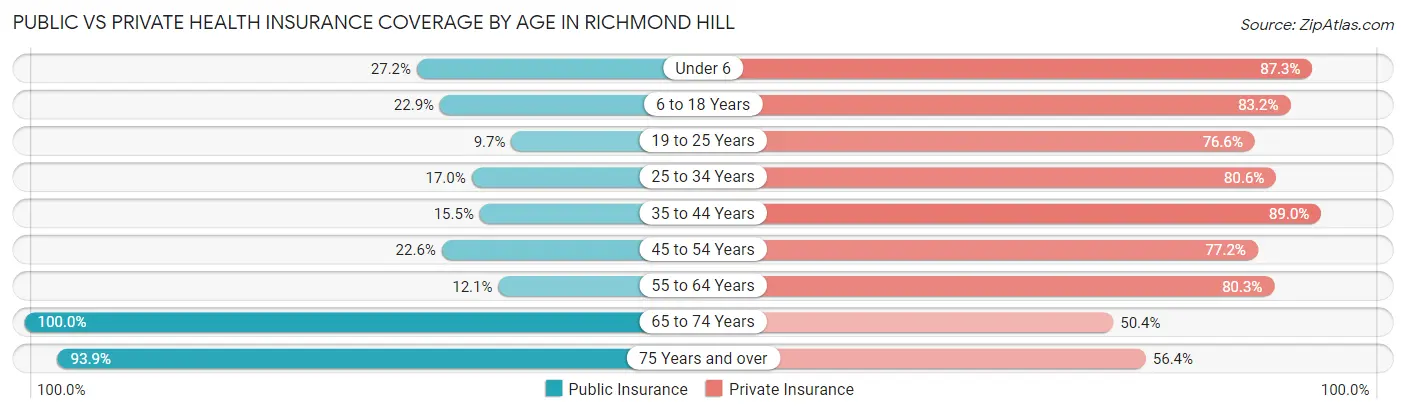
| Age Bracket | Public Insurance | Private Insurance |
| Under 6 | 444 (27.2%) | 1,426 (87.3%) |
| 6 to 18 Years | 937 (22.9%) | 3,404 (83.2%) |
| 19 to 25 Years | 124 (9.7%) | 984 (76.6%) |
| 25 to 34 Years | 284 (17.0%) | 1,344 (80.6%) |
| 35 to 44 Years | 442 (15.5%) | 2,534 (89.0%) |
| 45 to 54 Years | 384 (22.6%) | 1,312 (77.2%) |
| 55 to 64 Years | 165 (12.1%) | 1,097 (80.2%) |
| 65 to 74 Years | 504 (100.0%) | 254 (50.4%) |
| 75 Years and over | 474 (93.9%) | 285 (56.4%) |
| Total | 3,758 (24.1%) | 12,640 (81.0%) |
Disability Status by Sex by Age in Richmond Hill
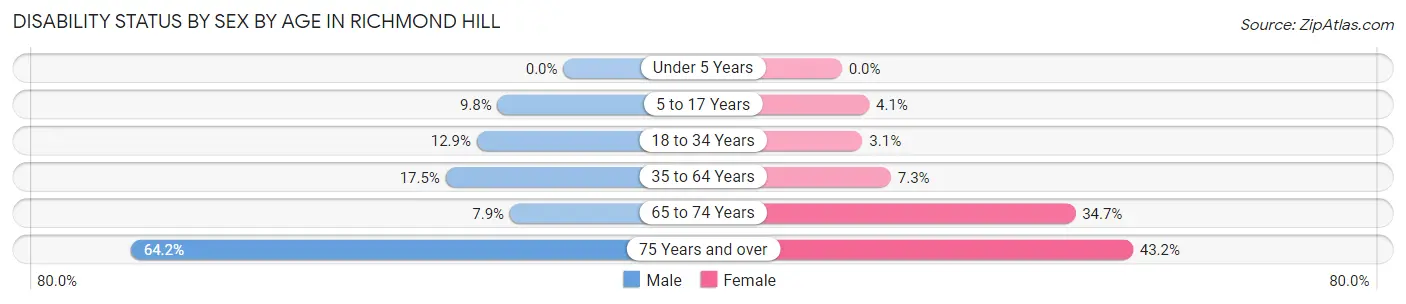
| Age Bracket | Male | Female |
| Under 5 Years | 0 (0.0%) | 0 (0.0%) |
| 5 to 17 Years | 212 (9.8%) | 78 (4.1%) |
| 18 to 34 Years | 145 (12.9%) | 58 (3.1%) |
| 35 to 64 Years | 462 (17.5%) | 238 (7.3%) |
| 65 to 74 Years | 18 (7.9%) | 96 (34.7%) |
| 75 Years and over | 88 (64.2%) | 159 (43.2%) |
Disability Class by Sex by Age in Richmond Hill
Disability Class: Hearing Difficulty
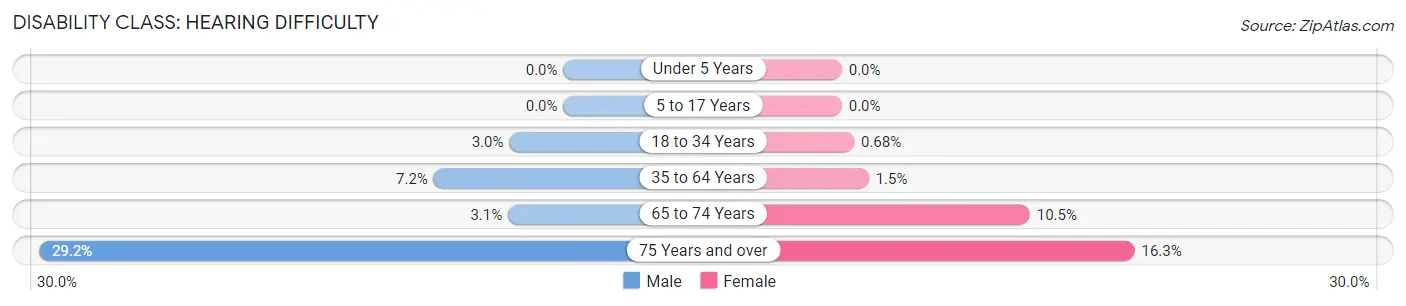
| Age Bracket | Male | Female |
| Under 5 Years | 0 (0.0%) | 0 (0.0%) |
| 5 to 17 Years | 0 (0.0%) | 0 (0.0%) |
| 18 to 34 Years | 34 (3.0%) | 13 (0.7%) |
| 35 to 64 Years | 191 (7.2%) | 49 (1.5%) |
| 65 to 74 Years | 7 (3.1%) | 29 (10.5%) |
| 75 Years and over | 40 (29.2%) | 60 (16.3%) |
Disability Class: Vision Difficulty
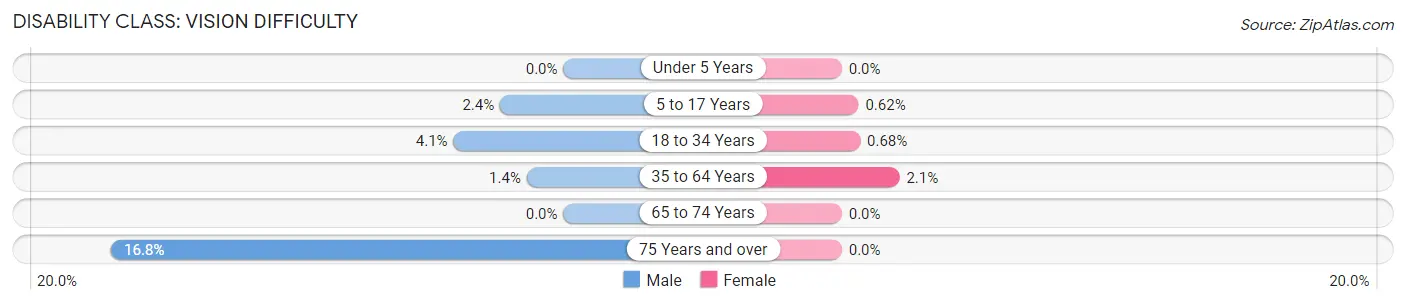
| Age Bracket | Male | Female |
| Under 5 Years | 0 (0.0%) | 0 (0.0%) |
| 5 to 17 Years | 51 (2.4%) | 12 (0.6%) |
| 18 to 34 Years | 46 (4.1%) | 13 (0.7%) |
| 35 to 64 Years | 36 (1.4%) | 70 (2.1%) |
| 65 to 74 Years | 0 (0.0%) | 0 (0.0%) |
| 75 Years and over | 23 (16.8%) | 0 (0.0%) |
Disability Class: Cognitive Difficulty
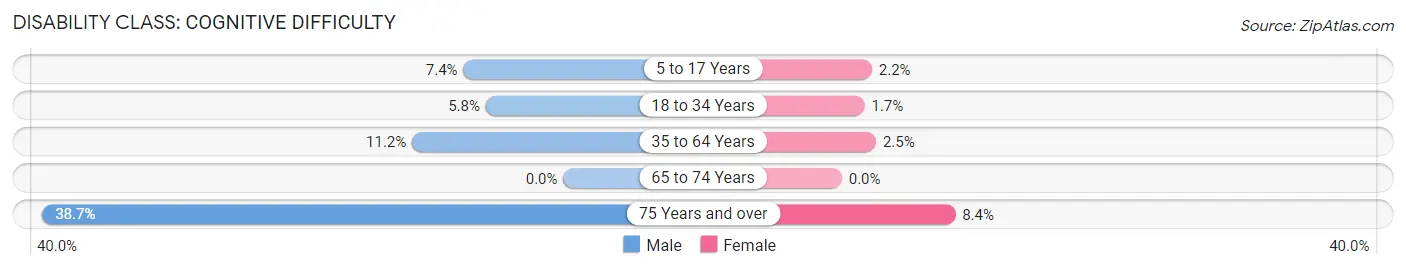
| Age Bracket | Male | Female |
| 5 to 17 Years | 161 (7.4%) | 43 (2.2%) |
| 18 to 34 Years | 65 (5.8%) | 32 (1.7%) |
| 35 to 64 Years | 297 (11.2%) | 83 (2.5%) |
| 65 to 74 Years | 0 (0.0%) | 0 (0.0%) |
| 75 Years and over | 53 (38.7%) | 31 (8.4%) |
Disability Class: Ambulatory Difficulty
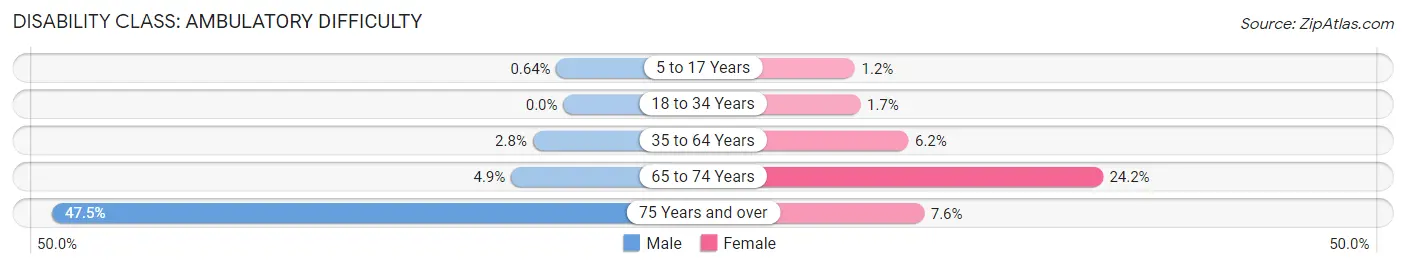
| Age Bracket | Male | Female |
| 5 to 17 Years | 14 (0.6%) | 23 (1.2%) |
| 18 to 34 Years | 0 (0.0%) | 32 (1.7%) |
| 35 to 64 Years | 75 (2.8%) | 201 (6.1%) |
| 65 to 74 Years | 11 (4.9%) | 67 (24.2%) |
| 75 Years and over | 65 (47.4%) | 28 (7.6%) |
Disability Class: Self-Care Difficulty
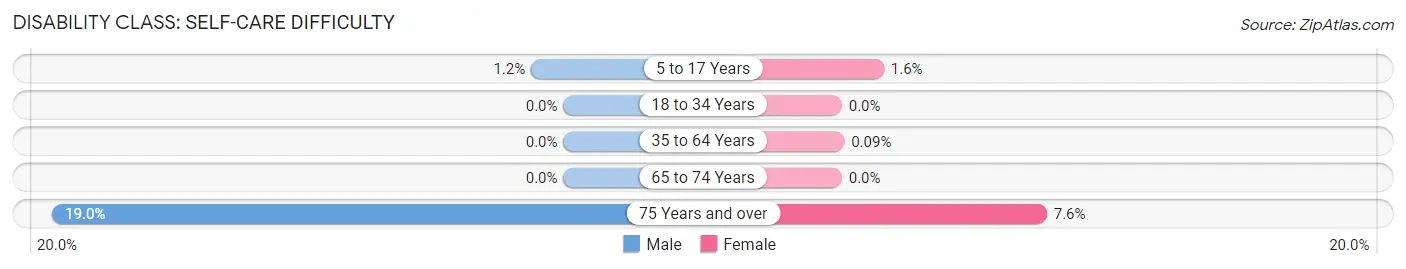
| Age Bracket | Male | Female |
| 5 to 17 Years | 26 (1.2%) | 30 (1.6%) |
| 18 to 34 Years | 0 (0.0%) | 0 (0.0%) |
| 35 to 64 Years | 0 (0.0%) | 3 (0.1%) |
| 65 to 74 Years | 0 (0.0%) | 0 (0.0%) |
| 75 Years and over | 26 (19.0%) | 28 (7.6%) |
Technology Access in Richmond Hill
Computing Device Access in Richmond Hill
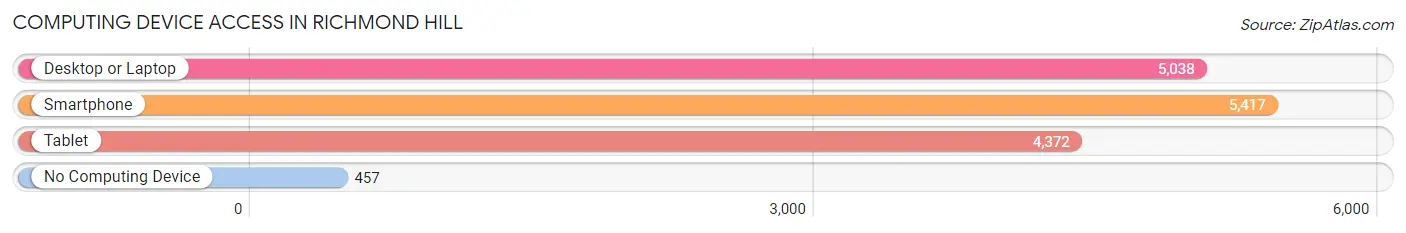
| Device Type | # Households | % Households |
| Desktop or Laptop | 5,038 | 84.9% |
| Smartphone | 5,417 | 91.3% |
| Tablet | 4,372 | 73.7% |
| No Computing Device | 457 | 7.7% |
| Total | 5,936 | 100.0% |
Internet Access in Richmond Hill
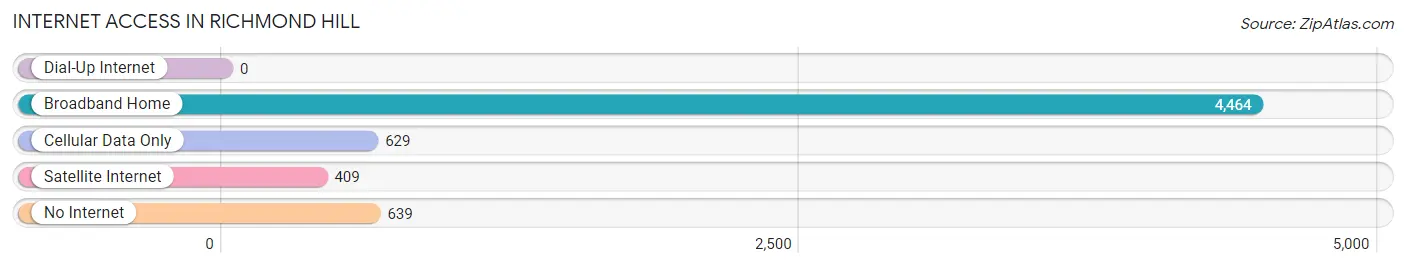
| Internet Type | # Households | % Households |
| Dial-Up Internet | 0 | 0.0% |
| Broadband Home | 4,464 | 75.2% |
| Cellular Data Only | 629 | 10.6% |
| Satellite Internet | 409 | 6.9% |
| No Internet | 639 | 10.8% |
| Total | 5,936 | 100.0% |
Richmond Hill Summary
Richmond Hill is a city located in Bryan County, Georgia, United States. It is part of the Savannah Metropolitan Statistical Area. The population was estimated to be 11,096 in 2019. Richmond Hill is located on the Ogeechee River, approximately 20 miles (32 km) southwest of Savannah.
History
Richmond Hill was founded in 1734 by Henry Ellis, the Royal Governor of Georgia. The city was named after Richmond Hill, London, England. The city was originally part of St. Andrew's Parish, which was established in 1758. In 1808, the city was incorporated as a town.
In the early 19th century, Richmond Hill was a popular summer resort for wealthy Savannah residents. The city was also home to a number of plantations, including the Richmond Hill Plantation, which was owned by the prominent Jones family.
During the Civil War, Richmond Hill was the site of a major battle between Union and Confederate forces. The Battle of Richmond Hill was fought on December 13, 1864, and resulted in a Confederate victory.
Geography
Richmond Hill is located in southeastern Georgia, approximately 20 miles (32 km) southwest of Savannah. The city is situated on the Ogeechee River, which forms the city's western boundary. The city is bordered to the north by the city of Pembroke, to the east by the city of Ellabell, and to the south by the city of Midway.
The city has a total area of 16.2 square miles (41.8 km2), of which 16.1 square miles (41.6 km2) is land and 0.1 square miles (0.2 km2) is water.
Economy
Richmond Hill is home to a number of businesses and industries. The city is home to a number of manufacturing companies, including a paper mill, a plastics plant, and a furniture factory. The city is also home to a number of retail stores, restaurants, and other businesses.
The city is home to the Richmond Hill Industrial Park, which is home to a number of businesses, including a distribution center for Home Depot. The city is also home to a number of medical facilities, including a hospital and a number of medical offices.
Demographics
As of the 2010 census, there were 9,281 people, 3,541 households, and 2,541 families residing in the city. The population density was 576.3 people per square mile (222.7/km2). There were 3,945 housing units at an average density of 244.3 per square mile (94.2/km2). The racial makeup of the city was 79.2% White, 14.3% African American, 0.4% Native American, 1.7% Asian, 0.1% Pacific Islander, 2.2% from other races, and 2.2% from two or more races. Hispanic or Latino of any race were 5.2% of the population.
There were 3,541 households, out of which 37.2% had children under the age of 18 living with them, 54.2% were married couples living together, 12.7% had a female householder with no husband present, and 28.2% were non-families. 22.7% of all households were made up of individuals, and 6.3% had someone living alone who was 65 years of age or older. The average household size was 2.62 and the average family size was 3.08.
In the city, the population was spread out, with 27.2% under the age of 18, 8.2% from 18 to 24, 32.2% from 25 to 44, 22.7% from 45 to 64, and 9.7% who were 65 years of age or older. The median age was 34 years. For every 100 females, there were 95.2 males. For every 100 females age 18 and over, there were 92.2 males.
The median income for a household in the city was $50,945, and the median income for a family was $58,958. Males had a median income of $41,945 versus $30,958 for females. The per capita income for the city was $23,945. About 6.2% of families and 8.2% of the population were below the poverty line, including 10.2% of those under age 18 and 8.2% of those age 65 or over.
Common Questions
What is Per Capita Income in Richmond Hill?
Per Capita income in Richmond Hill is $33,241.
What is the Median Family Income in Richmond Hill?
Median Family Income in Richmond Hill is $90,920.
What is the Median Household income in Richmond Hill?
Median Household Income in Richmond Hill is $83,519.
What is Income or Wage Gap in Richmond Hill?
Income or Wage Gap in Richmond Hill is 40.6%.
Women in Richmond Hill earn 59.4 cents for every dollar earned by a man.
What is Inequality or Gini Index in Richmond Hill?
Inequality or Gini Index in Richmond Hill is 0.36.
What is the Total Population of Richmond Hill?
Total Population of Richmond Hill is 16,703.
What is the Total Male Population of Richmond Hill?
Total Male Population of Richmond Hill is 8,200.
What is the Total Female Population of Richmond Hill?
Total Female Population of Richmond Hill is 8,503.
What is the Ratio of Males per 100 Females in Richmond Hill?
There are 96.44 Males per 100 Females in Richmond Hill.
What is the Ratio of Females per 100 Males in Richmond Hill?
There are 103.70 Females per 100 Males in Richmond Hill.
What is the Median Population Age in Richmond Hill?
Median Population Age in Richmond Hill is 31.0 Years.
What is the Average Family Size in Richmond Hill
Average Family Size in Richmond Hill is 3.3 People.
What is the Average Household Size in Richmond Hill
Average Household Size in Richmond Hill is 2.8 People.
How Large is the Labor Force in Richmond Hill?
There are 8,789 People in the Labor Forcein in Richmond Hill.
What is the Percentage of People in the Labor Force in Richmond Hill?
74.7% of People are in the Labor Force in Richmond Hill.
What is the Unemployment Rate in Richmond Hill?
Unemployment Rate in Richmond Hill is 5.0%.