Little Falls, ME Map & Demographics
Little Falls Map
Little Falls Overview
$68,523
PER CAPITA INCOME
$179,531
AVG FAMILY INCOME
$123,611
AVG HOUSEHOLD INCOME
12.6%
WAGE / INCOME GAP [ % ]
87.4¢/ $1
WAGE / INCOME GAP [ $ ]
0.56
INEQUALITY / GINI INDEX
891
TOTAL POPULATION
346
MALE POPULATION
545
FEMALE POPULATION
63.49
MALES / 100 FEMALES
157.51
FEMALES / 100 MALES
35.3
MEDIAN AGE
3.8
AVG FAMILY SIZE
3.1
AVG HOUSEHOLD SIZE
557
LABOR FORCE [ PEOPLE ]
77.4%
PERCENT IN LABOR FORCE
Income in Little Falls
Income Overview in Little Falls
Per Capita Income in Little Falls is $68,523, while median incomes of families and households are $179,531 and $123,611 respectively.
| Characteristic | Number | Measure |
| Per Capita Income | 891 | $68,523 |
| Median Family Income | 176 | $179,531 |
| Mean Family Income | 176 | $293,472 |
| Median Household Income | 290 | $123,611 |
| Mean Household Income | 290 | $205,312 |
| Income Deficit | 176 | $0 |
| Wage / Income Gap (%) | 891 | 12.58% |
| Wage / Income Gap ($) | 891 | 87.42¢ per $1 |
| Gini / Inequality Index | 891 | 0.56 |
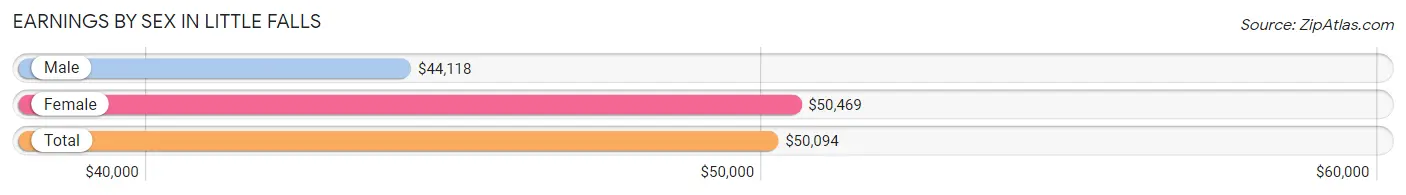
Earnings by Sex in Little Falls
Average Earnings in Little Falls are $50,094, $44,118 for men and $50,469 for women, a difference of 12.6%.
| Sex | Number | Average Earnings |
| Male | 214 (38.4%) | $44,118 |
| Female | 343 (61.6%) | $50,469 |
| Total | 557 (100.0%) | $50,094 |
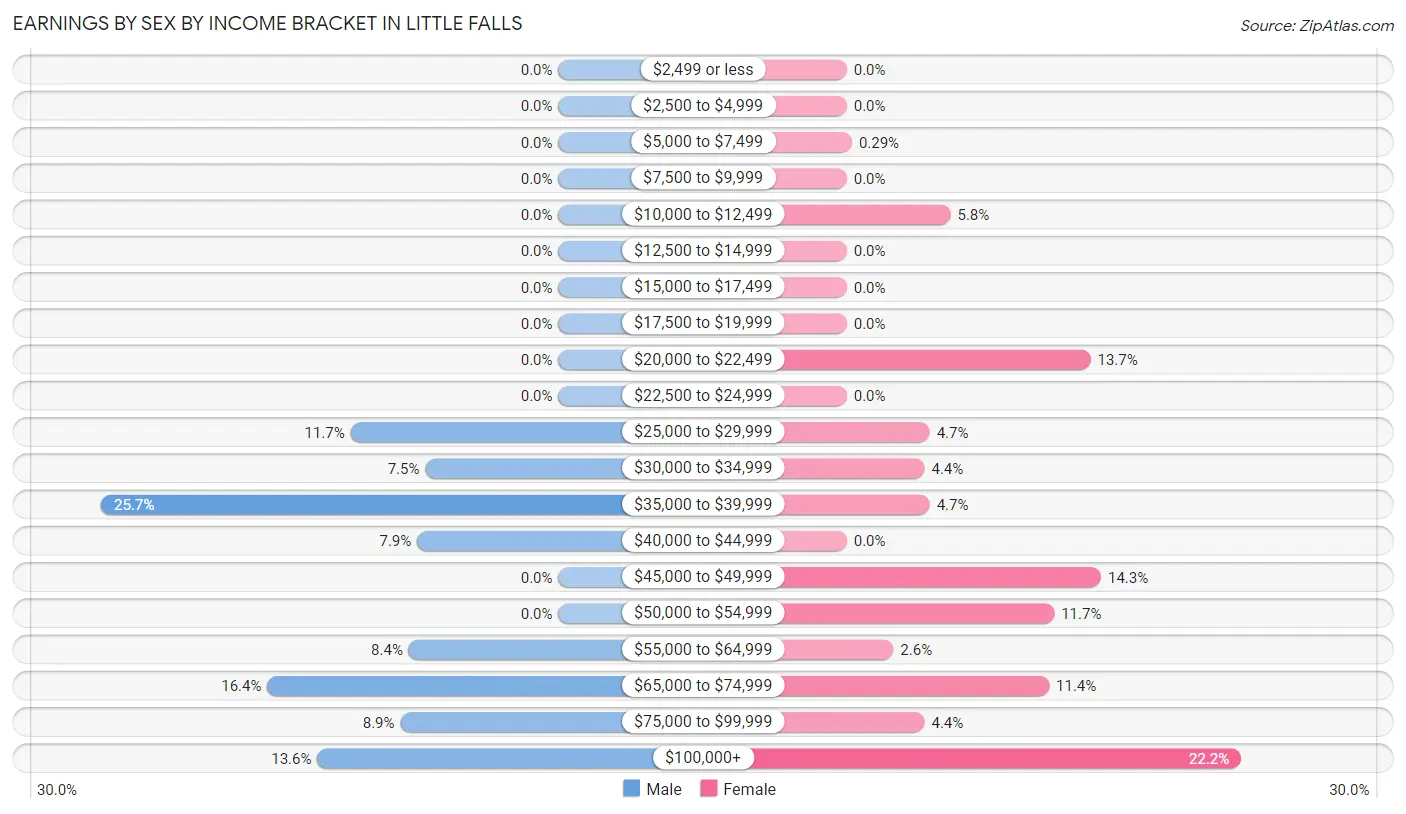
Earnings by Sex by Income Bracket in Little Falls
The most common earnings brackets in Little Falls are $35,000 to $39,999 for men (55 | 25.7%) and $100,000+ for women (76 | 22.2%).
| Income | Male | Female |
| $2,499 or less | 0 (0.0%) | 0 (0.0%) |
| $2,500 to $4,999 | 0 (0.0%) | 0 (0.0%) |
| $5,000 to $7,499 | 0 (0.0%) | 1 (0.3%) |
| $7,500 to $9,999 | 0 (0.0%) | 0 (0.0%) |
| $10,000 to $12,499 | 0 (0.0%) | 20 (5.8%) |
| $12,500 to $14,999 | 0 (0.0%) | 0 (0.0%) |
| $15,000 to $17,499 | 0 (0.0%) | 0 (0.0%) |
| $17,500 to $19,999 | 0 (0.0%) | 0 (0.0%) |
| $20,000 to $22,499 | 0 (0.0%) | 47 (13.7%) |
| $22,500 to $24,999 | 0 (0.0%) | 0 (0.0%) |
| $25,000 to $29,999 | 25 (11.7%) | 16 (4.7%) |
| $30,000 to $34,999 | 16 (7.5%) | 15 (4.4%) |
| $35,000 to $39,999 | 55 (25.7%) | 16 (4.7%) |
| $40,000 to $44,999 | 17 (7.9%) | 0 (0.0%) |
| $45,000 to $49,999 | 0 (0.0%) | 49 (14.3%) |
| $50,000 to $54,999 | 0 (0.0%) | 40 (11.7%) |
| $55,000 to $64,999 | 18 (8.4%) | 9 (2.6%) |
| $65,000 to $74,999 | 35 (16.4%) | 39 (11.4%) |
| $75,000 to $99,999 | 19 (8.9%) | 15 (4.4%) |
| $100,000+ | 29 (13.6%) | 76 (22.2%) |
| Total | 214 (100.0%) | 343 (100.0%) |
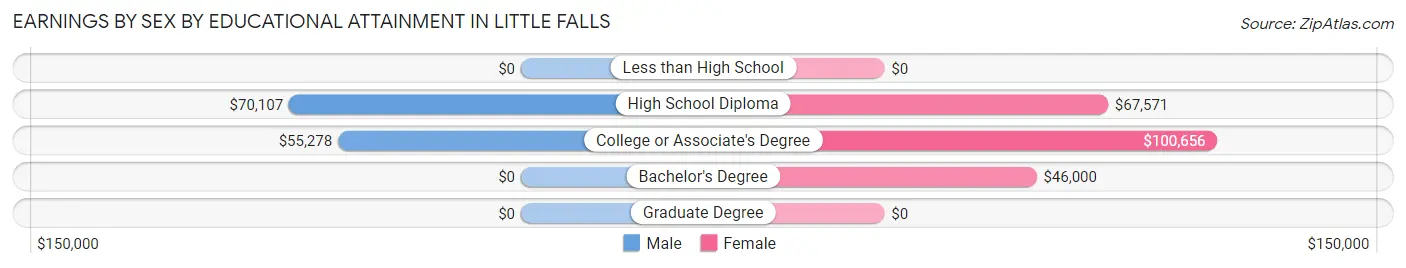
Earnings by Sex by Educational Attainment in Little Falls
Average earnings in Little Falls are $56,736 for men and $67,571 for women, a difference of 16.0%. Men with an educational attainment of high school diploma enjoy the highest average annual earnings of $70,107, while those with college or associate's degree education earn the least with $55,278. Women with an educational attainment of college or associate's degree earn the most with the average annual earnings of $100,656, while those with bachelor's degree education have the smallest earnings of $46,000.
| Educational Attainment | Male Income | Female Income |
| Less than High School | - | - |
| High School Diploma | $70,107 | $67,571 |
| College or Associate's Degree | $55,278 | $100,656 |
| Bachelor's Degree | - | - |
| Graduate Degree | - | - |
| Total | $56,736 | $67,571 |
Family Income in Little Falls
Family Income Brackets in Little Falls
According to the Little Falls family income data, there are 71 families falling into the $150,000 to $199,999 income range, which is the most common income bracket and makes up 40.3% of all families.
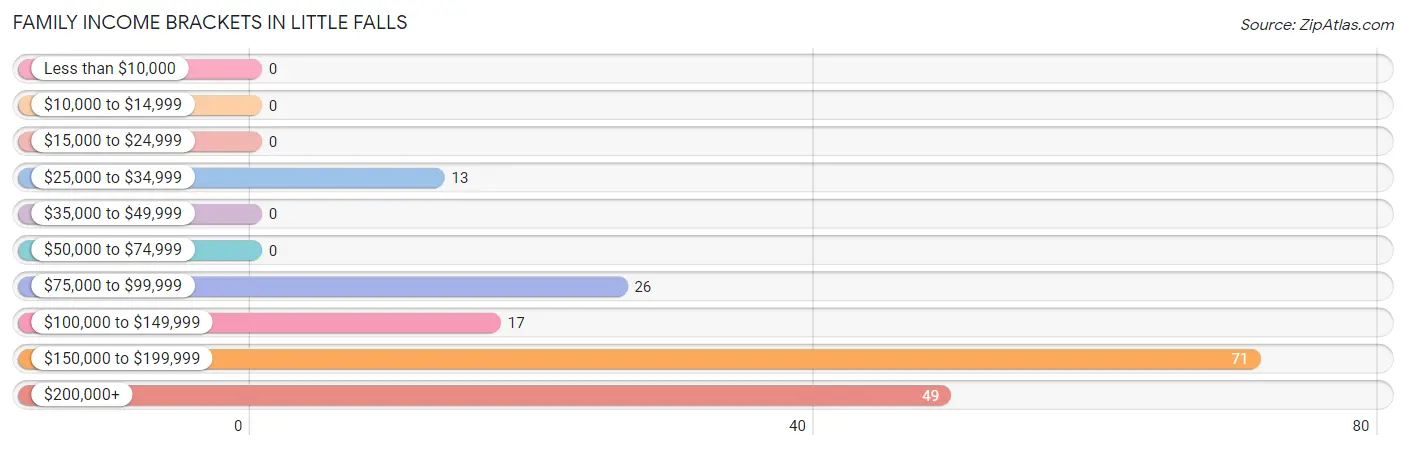
| Income Bracket | # Families | % Families |
| Less than $10,000 | 0 | 0.0% |
| $10,000 to $14,999 | 0 | 0.0% |
| $15,000 to $24,999 | 0 | 0.0% |
| $25,000 to $34,999 | 13 | 7.4% |
| $35,000 to $49,999 | 0 | 0.0% |
| $50,000 to $74,999 | 0 | 0.0% |
| $75,000 to $99,999 | 26 | 14.8% |
| $100,000 to $149,999 | 17 | 9.7% |
| $150,000 to $199,999 | 71 | 40.3% |
| $200,000+ | 49 | 27.8% |
Family Income by Famaliy Size in Little Falls
2-person families (94 | 53.4%) account for the highest median family income in Little Falls with $182,708 per family, while 2-person families (94 | 53.4%) have the highest median income of $91,354 per family member.
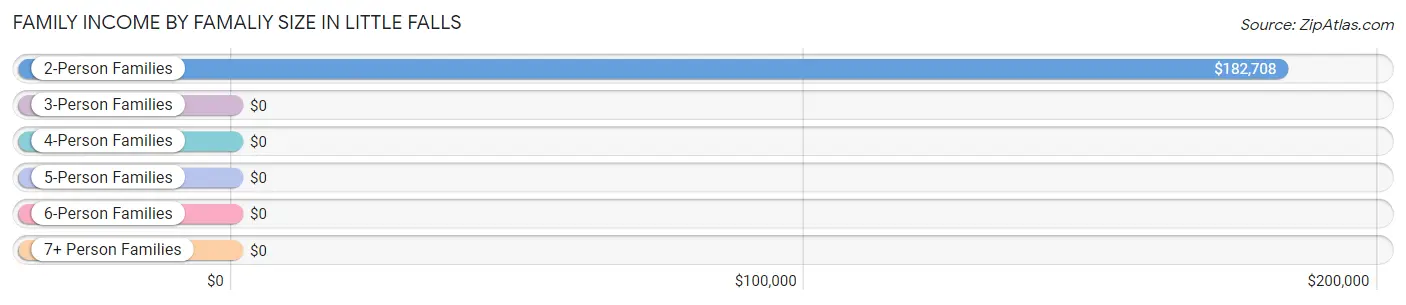
| Income Bracket | # Families | Median Income |
| 2-Person Families | 94 (53.4%) | $182,708 |
| 3-Person Families | 31 (17.6%) | $0 |
| 4-Person Families | 0 (0.0%) | $0 |
| 5-Person Families | 0 (0.0%) | $0 |
| 6-Person Families | 0 (0.0%) | $0 |
| 7+ Person Families | 51 (29.0%) | $0 |
| Total | 176 (100.0%) | $179,531 |
Family Income by Number of Earners in Little Falls
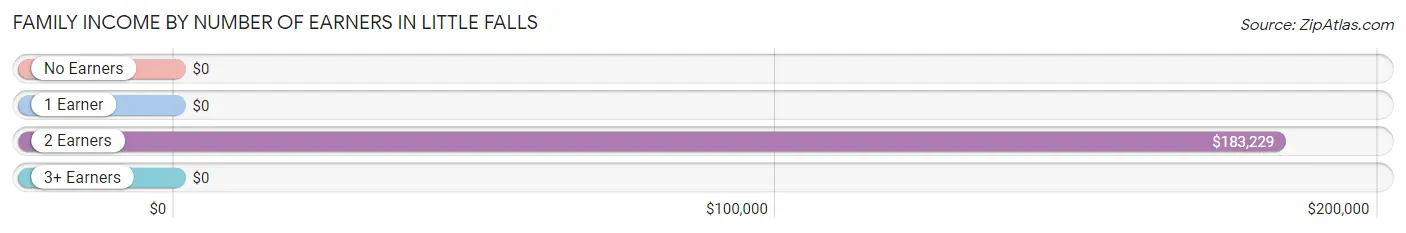
| Number of Earners | # Families | Median Income |
| No Earners | 29 (16.5%) | $0 |
| 1 Earner | 17 (9.7%) | $0 |
| 2 Earners | 79 (44.9%) | $183,229 |
| 3+ Earners | 51 (29.0%) | $0 |
| Total | 176 (100.0%) | $179,531 |
Household Income in Little Falls
Household Income Brackets in Little Falls
With 71 households falling in the category, the $150,000 to $199,999 income range is the most frequent in Little Falls, accounting for 24.5% of all households.
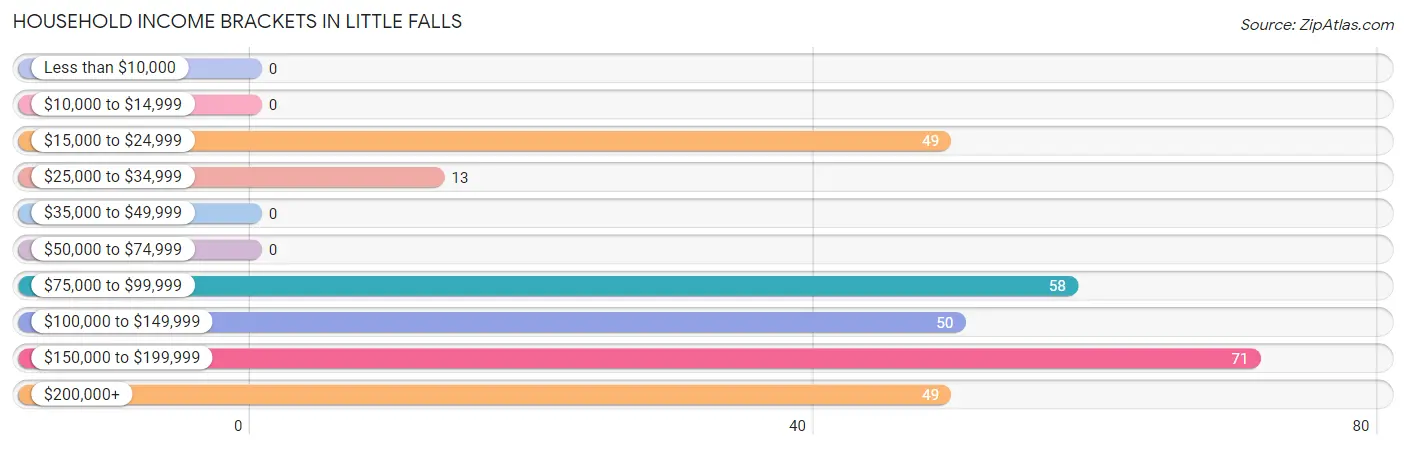
| Income Bracket | # Households | % Households |
| Less than $10,000 | 0 | 0.0% |
| $10,000 to $14,999 | 0 | 0.0% |
| $15,000 to $24,999 | 49 | 16.9% |
| $25,000 to $34,999 | 13 | 4.5% |
| $35,000 to $49,999 | 0 | 0.0% |
| $50,000 to $74,999 | 0 | 0.0% |
| $75,000 to $99,999 | 58 | 20.0% |
| $100,000 to $149,999 | 50 | 17.2% |
| $150,000 to $199,999 | 71 | 24.5% |
| $200,000+ | 49 | 16.9% |
Household Income by Householder Age in Little Falls
The median household income in Little Falls is $123,611, with the highest median household income of $184,236 found in the 45 to 64 years age bracket for the primary householder. A total of 120 households (41.4%) fall into this category. Meanwhile, the 15 to 24 years age bracket for the primary householder has the lowest median household income of $0, with 18 households (6.2%) in this group.
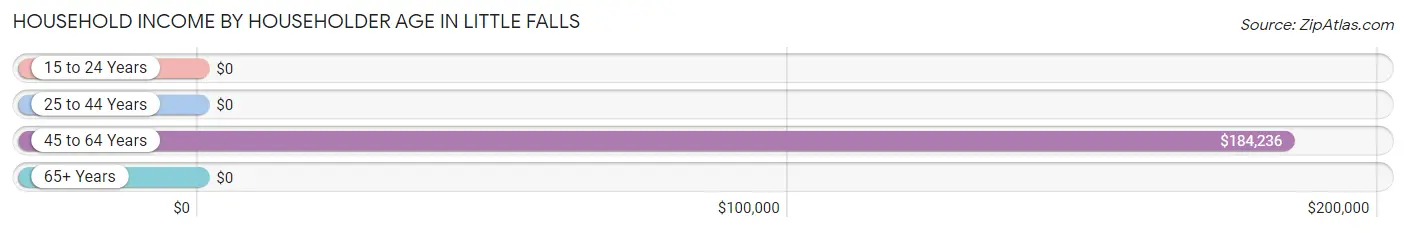
| Income Bracket | # Households | Median Income |
| 15 to 24 Years | 18 (6.2%) | $0 |
| 25 to 44 Years | 40 (13.8%) | $0 |
| 45 to 64 Years | 120 (41.4%) | $184,236 |
| 65+ Years | 112 (38.6%) | $0 |
| Total | 290 (100.0%) | $123,611 |
Poverty in Little Falls
Income Below Poverty by Sex and Age in Little Falls
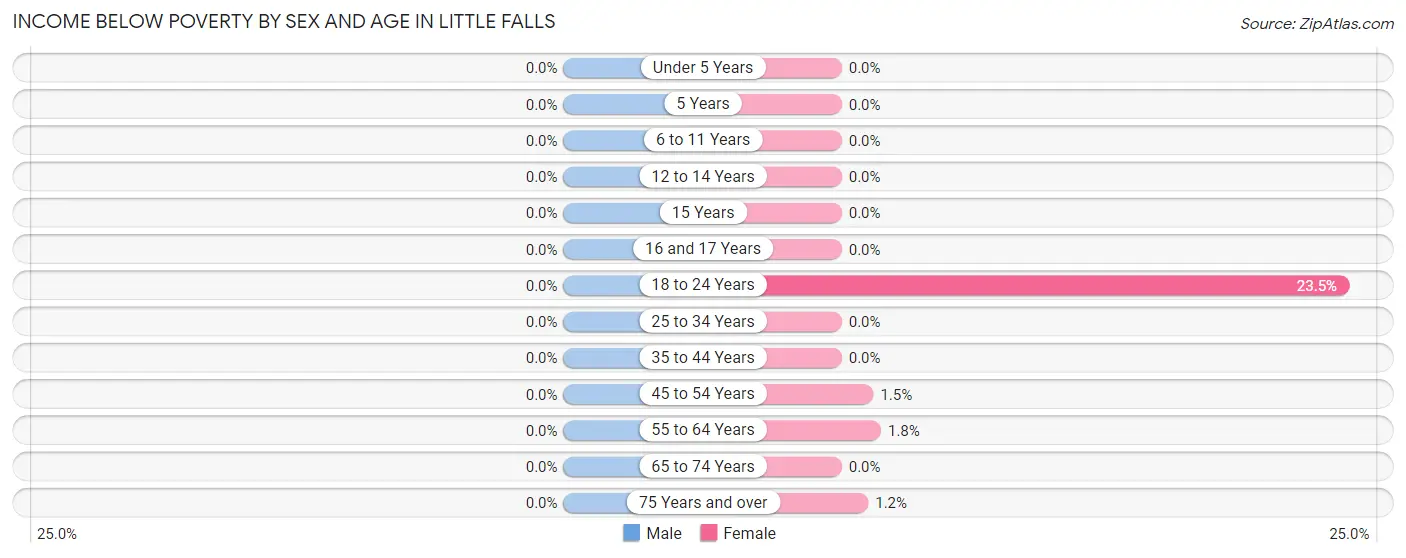
| Age Bracket | Male | Female |
| Under 5 Years | 0 (0.0%) | 0 (0.0%) |
| 5 Years | 0 (0.0%) | 0 (0.0%) |
| 6 to 11 Years | 0 (0.0%) | 0 (0.0%) |
| 12 to 14 Years | 0 (0.0%) | 0 (0.0%) |
| 15 Years | 0 (0.0%) | 0 (0.0%) |
| 16 and 17 Years | 0 (0.0%) | 0 (0.0%) |
| 18 to 24 Years | 0 (0.0%) | 20 (23.5%) |
| 25 to 34 Years | 0 (0.0%) | 0 (0.0%) |
| 35 to 44 Years | 0 (0.0%) | 0 (0.0%) |
| 45 to 54 Years | 0 (0.0%) | 1 (1.5%) |
| 55 to 64 Years | 0 (0.0%) | 1 (1.8%) |
| 65 to 74 Years | 0 (0.0%) | 0 (0.0%) |
| 75 Years and over | 0 (0.0%) | 1 (1.2%) |
| Total | 0 (0.0%) | 23 (4.2%) |
Income Above Poverty by Sex and Age in Little Falls
According to the poverty statistics in Little Falls, males aged under 5 years and females aged 6 to 11 years are the age groups that are most secure financially, with 100.0% of males and 100.0% of females in these age groups living above the poverty line.
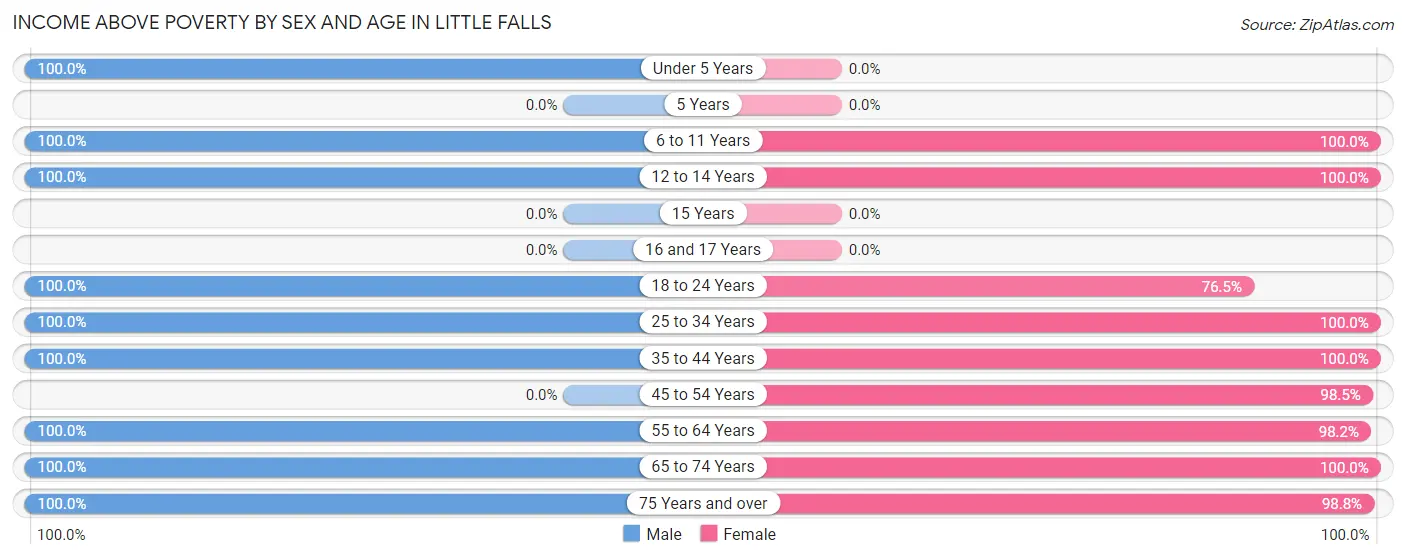
| Age Bracket | Male | Female |
| Under 5 Years | 31 (100.0%) | 0 (0.0%) |
| 5 Years | 0 (0.0%) | 0 (0.0%) |
| 6 to 11 Years | 15 (100.0%) | 72 (100.0%) |
| 12 to 14 Years | 38 (100.0%) | 15 (100.0%) |
| 15 Years | 0 (0.0%) | 0 (0.0%) |
| 16 and 17 Years | 0 (0.0%) | 0 (0.0%) |
| 18 to 24 Years | 37 (100.0%) | 65 (76.5%) |
| 25 to 34 Years | 35 (100.0%) | 95 (100.0%) |
| 35 to 44 Years | 25 (100.0%) | 41 (100.0%) |
| 45 to 54 Years | 0 (0.0%) | 67 (98.5%) |
| 55 to 64 Years | 99 (100.0%) | 54 (98.2%) |
| 65 to 74 Years | 53 (100.0%) | 33 (100.0%) |
| 75 Years and over | 13 (100.0%) | 80 (98.8%) |
| Total | 346 (100.0%) | 522 (95.8%) |
Income Below Poverty Among Married-Couple Families in Little Falls
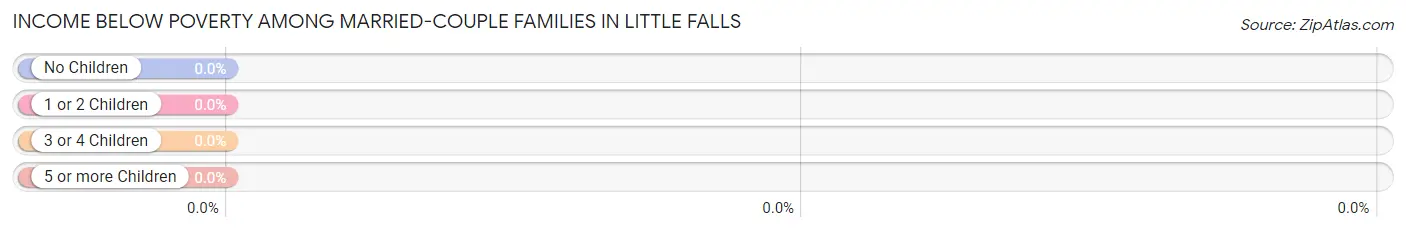
| Children | Above Poverty | Below Poverty |
| No Children | 58 (100.0%) | 0 (0.0%) |
| 1 or 2 Children | 15 (100.0%) | 0 (0.0%) |
| 3 or 4 Children | 51 (100.0%) | 0 (0.0%) |
| 5 or more Children | 0 (0.0%) | 0 (0.0%) |
| Total | 124 (100.0%) | 0 (0.0%) |
Income Below Poverty Among Single-Parent Households in Little Falls
| Children | Single Father | Single Mother |
| No Children | 0 (0.0%) | 0 (0.0%) |
| 1 or 2 Children | 0 (0.0%) | 0 (0.0%) |
| 3 or 4 Children | 0 (0.0%) | 0 (0.0%) |
| 5 or more Children | 0 (0.0%) | 0 (0.0%) |
| Total | 0 (0.0%) | 0 (0.0%) |
Income Below Poverty Among Married-Couple vs Single-Parent Households in Little Falls
| Children | Married-Couple Families | Single-Parent Households |
| No Children | 0 (0.0%) | 0 (0.0%) |
| 1 or 2 Children | 0 (0.0%) | 0 (0.0%) |
| 3 or 4 Children | 0 (0.0%) | 0 (0.0%) |
| 5 or more Children | 0 (0.0%) | 0 (0.0%) |
| Total | 0 (0.0%) | 0 (0.0%) |
Race in Little Falls
The most populous races in Little Falls are White / Caucasian (875 | 98.2%), Two or more Races (16 | 1.8%), and Hispanic or Latino (1 | 0.1%).
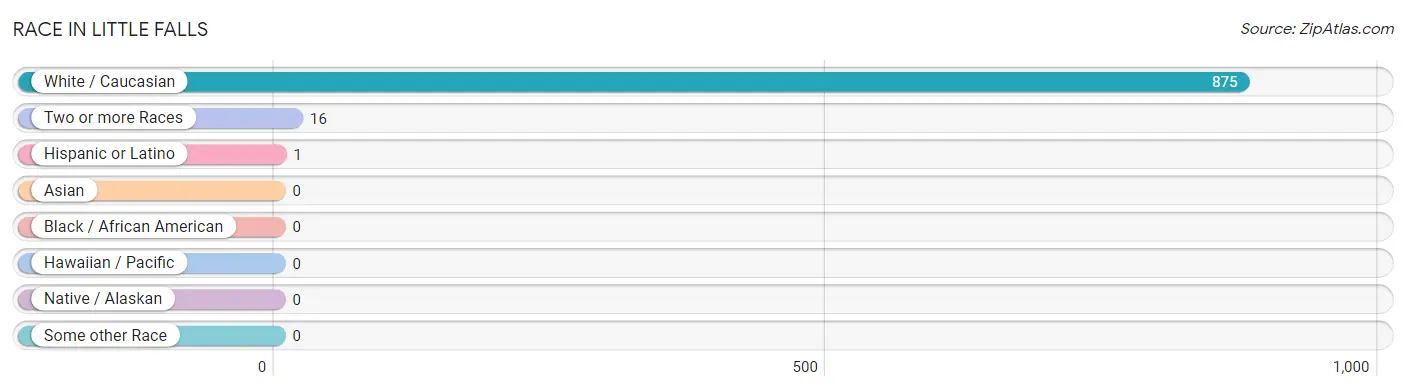
| Race | # Population | % Population |
| Asian | 0 | 0.0% |
| Black / African American | 0 | 0.0% |
| Hawaiian / Pacific | 0 | 0.0% |
| Hispanic or Latino | 1 | 0.1% |
| Native / Alaskan | 0 | 0.0% |
| White / Caucasian | 875 | 98.2% |
| Two or more Races | 16 | 1.8% |
| Some other Race | 0 | 0.0% |
| Total | 891 | 100.0% |
Ancestry in Little Falls
The most populous ancestries reported in Little Falls are Russian (260 | 29.2%), English (133 | 14.9%), Irish (78 | 8.7%), German (76 | 8.5%), and French Canadian (67 | 7.5%), together accounting for 68.9% of all Little Falls residents.
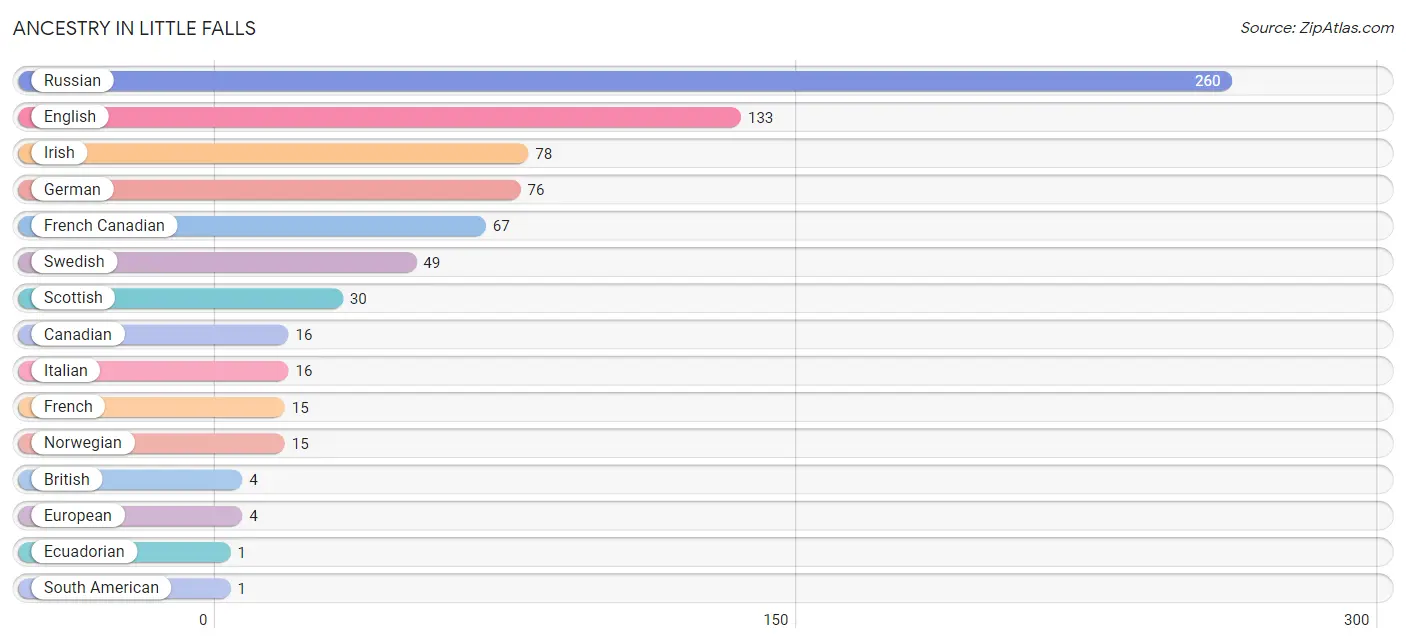
| Ancestry | # Population | % Population |
| British | 4 | 0.4% |
| Canadian | 16 | 1.8% |
| Ecuadorian | 1 | 0.1% |
| English | 133 | 14.9% |
| European | 4 | 0.4% |
| French | 15 | 1.7% |
| French Canadian | 67 | 7.5% |
| German | 76 | 8.5% |
| Irish | 78 | 8.7% |
| Italian | 16 | 1.8% |
| Norwegian | 15 | 1.7% |
| Russian | 260 | 29.2% |
| Scottish | 30 | 3.4% |
| South American | 1 | 0.1% |
| Swedish | 49 | 5.5% | View All 15 Rows |
Immigrants in Little Falls
The most numerous immigrant groups reported in Little Falls came from Eastern Europe (188 | 21.1%), Europe (188 | 21.1%), and Russia (188 | 21.1%), together accounting for 63.3% of all Little Falls residents.
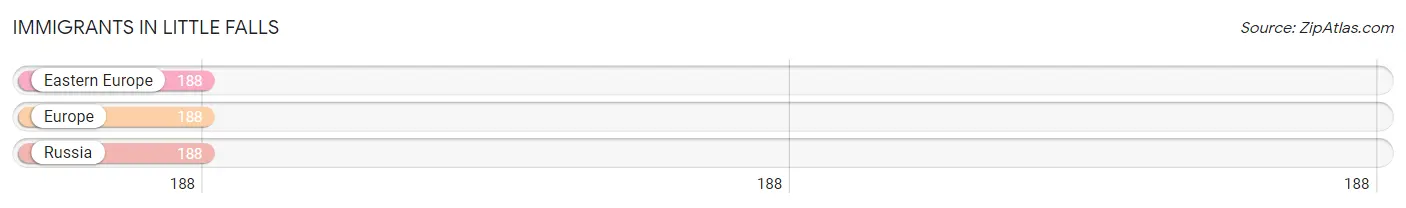
| Immigration Origin | # Population | % Population |
| Eastern Europe | 188 | 21.1% |
| Europe | 188 | 21.1% |
| Russia | 188 | 21.1% | View All 3 Rows |
Sex and Age in Little Falls
Sex and Age in Little Falls
The most populous age groups in Little Falls are 60 to 64 Years (85 | 24.6%) for men and 20 to 24 Years (85 | 15.6%) for women.
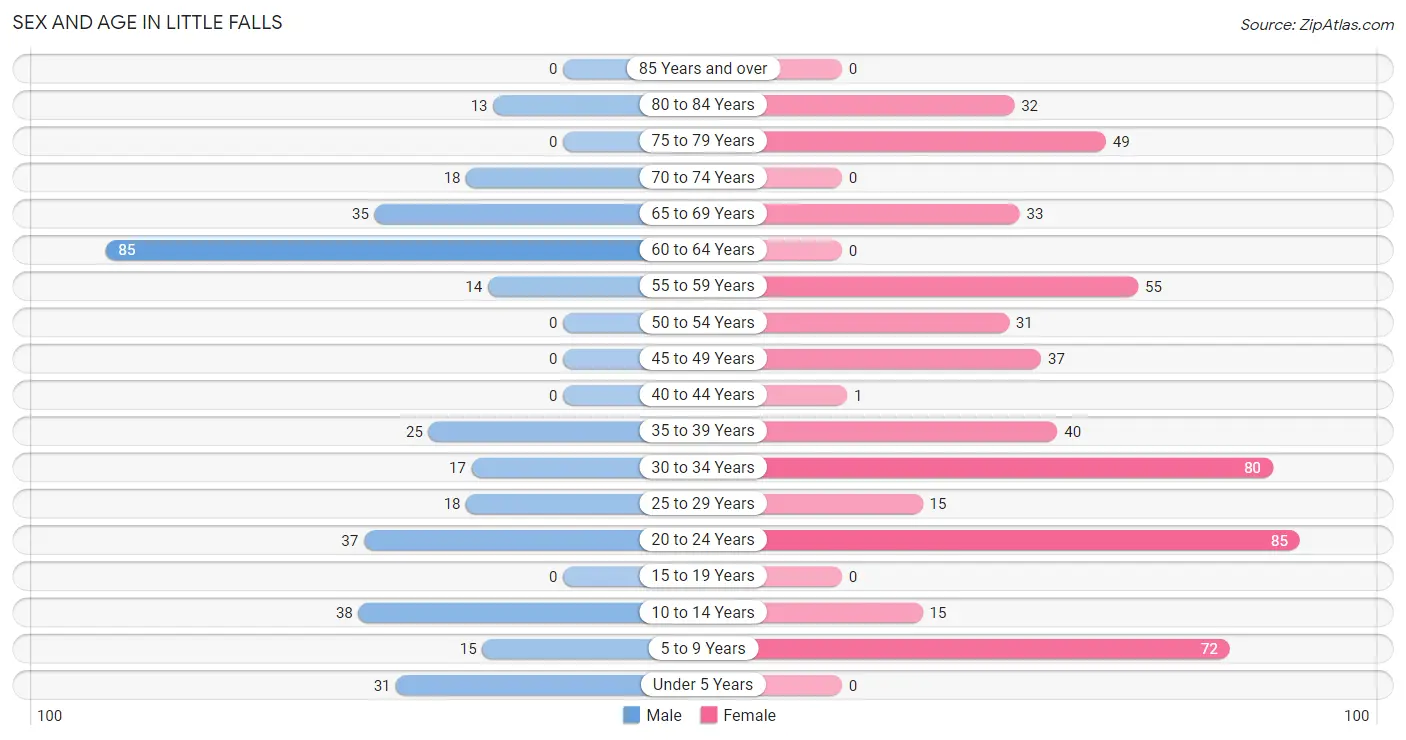
| Age Bracket | Male | Female |
| Under 5 Years | 31 (9.0%) | 0 (0.0%) |
| 5 to 9 Years | 15 (4.3%) | 72 (13.2%) |
| 10 to 14 Years | 38 (11.0%) | 15 (2.8%) |
| 15 to 19 Years | 0 (0.0%) | 0 (0.0%) |
| 20 to 24 Years | 37 (10.7%) | 85 (15.6%) |
| 25 to 29 Years | 18 (5.2%) | 15 (2.8%) |
| 30 to 34 Years | 17 (4.9%) | 80 (14.7%) |
| 35 to 39 Years | 25 (7.2%) | 40 (7.3%) |
| 40 to 44 Years | 0 (0.0%) | 1 (0.2%) |
| 45 to 49 Years | 0 (0.0%) | 37 (6.8%) |
| 50 to 54 Years | 0 (0.0%) | 31 (5.7%) |
| 55 to 59 Years | 14 (4.1%) | 55 (10.1%) |
| 60 to 64 Years | 85 (24.6%) | 0 (0.0%) |
| 65 to 69 Years | 35 (10.1%) | 33 (6.1%) |
| 70 to 74 Years | 18 (5.2%) | 0 (0.0%) |
| 75 to 79 Years | 0 (0.0%) | 49 (9.0%) |
| 80 to 84 Years | 13 (3.8%) | 32 (5.9%) |
| 85 Years and over | 0 (0.0%) | 0 (0.0%) |
| Total | 346 (100.0%) | 545 (100.0%) |
Families and Households in Little Falls
Median Family Size in Little Falls
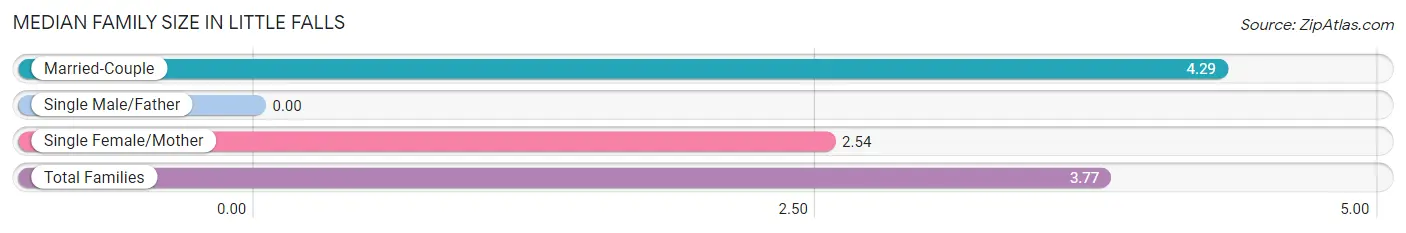
| Family Type | # Families | Family Size |
| Married-Couple | 124 (70.5%) | 4.29 |
| Single Male/Father | 0 (0.0%) | - |
| Single Female/Mother | 52 (29.5%) | 2.54 |
| Total Families | 176 (100.0%) | 3.77 |
Median Household Size in Little Falls
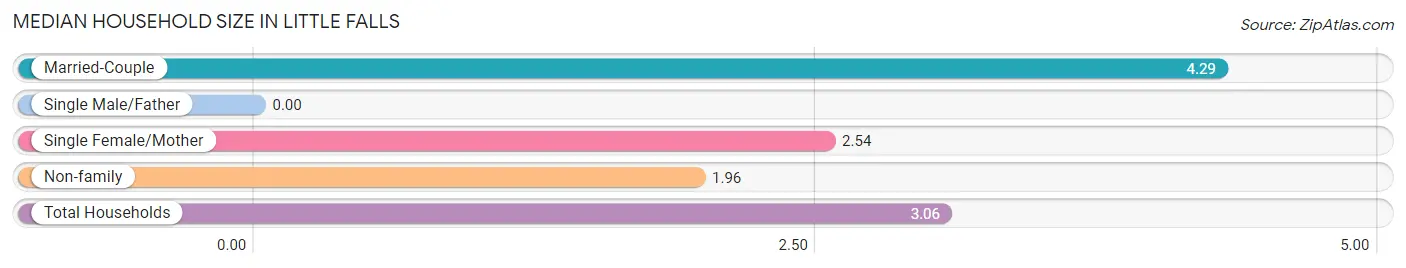
| Household Type | # Households | Household Size |
| Married-Couple | 124 (42.8%) | 4.29 |
| Single Male/Father | 0 (0.0%) | - |
| Single Female/Mother | 52 (17.9%) | 2.54 |
| Non-family | 114 (39.3%) | 1.96 |
| Total Households | 290 (100.0%) | 3.06 |
Household Size by Marriage Status in Little Falls
Out of a total of 290 households in Little Falls, 176 (60.7%) are family households, while 114 (39.3%) are nonfamily households. The most numerous type of family households are 2-person households, comprising 94, and the most common type of nonfamily households are 1-person households, comprising 49.
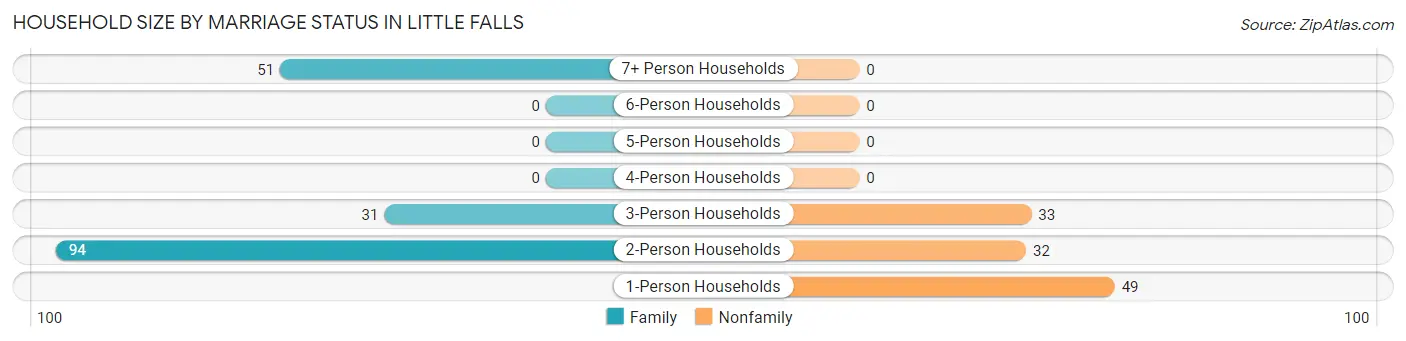
| Household Size | Family Households | Nonfamily Households |
| 1-Person Households | - | 49 (16.9%) |
| 2-Person Households | 94 (32.4%) | 32 (11.0%) |
| 3-Person Households | 31 (10.7%) | 33 (11.4%) |
| 4-Person Households | 0 (0.0%) | 0 (0.0%) |
| 5-Person Households | 0 (0.0%) | 0 (0.0%) |
| 6-Person Households | 0 (0.0%) | 0 (0.0%) |
| 7+ Person Households | 51 (17.6%) | 0 (0.0%) |
| Total | 176 (60.7%) | 114 (39.3%) |
Female Fertility in Little Falls
Fertility by Age in Little Falls
| Age Bracket | Women with Births | Births / 1,000 Women |
| 15 to 19 years | 0 (0.0%) | 0.0 |
| 20 to 34 years | 0 (0.0%) | 0.0 |
| 35 to 50 years | 0 (0.0%) | 0.0 |
| Total | 0 (0.0%) | 0.0 |
Fertility by Age by Marriage Status in Little Falls
| Age Bracket | Married | Unmarried |
| 15 to 19 years | 0 (0.0%) | 0 (0.0%) |
| 20 to 34 years | 0 (0.0%) | 0 (0.0%) |
| 35 to 50 years | 0 (0.0%) | 0 (0.0%) |
| Total | 0 (0.0%) | 0 (0.0%) |
Fertility by Education in Little Falls
| Educational Attainment | Women with Births | Births / 1,000 Women |
| Less than High School | 0 (0.0%) | 0.0 |
| High School Diploma | 0 (0.0%) | 0.0 |
| College or Associate's Degree | 0 (0.0%) | 0.0 |
| Bachelor's Degree | 0 (0.0%) | 0.0 |
| Graduate Degree | 0 (0.0%) | 0.0 |
| Total | 0 (0.0%) | 0.0 |
Fertility by Education by Marriage Status in Little Falls
| Educational Attainment | Married | Unmarried |
| Less than High School | 0 (0.0%) | 0 (0.0%) |
| High School Diploma | 0 (0.0%) | 0 (0.0%) |
| College or Associate's Degree | 0 (0.0%) | 0 (0.0%) |
| Bachelor's Degree | 0 (0.0%) | 0 (0.0%) |
| Graduate Degree | 0 (0.0%) | 0 (0.0%) |
| Total | 0 (0.0%) | 0 (0.0%) |
Employment Characteristics in Little Falls
Employment by Class of Employer in Little Falls
Among the 542 employed individuals in Little Falls, private company employees (401 | 74.0%), self-employed (incorporated) (36 | 6.6%), and unpaid family workers (35 | 6.5%) make up the most common classes of employment.
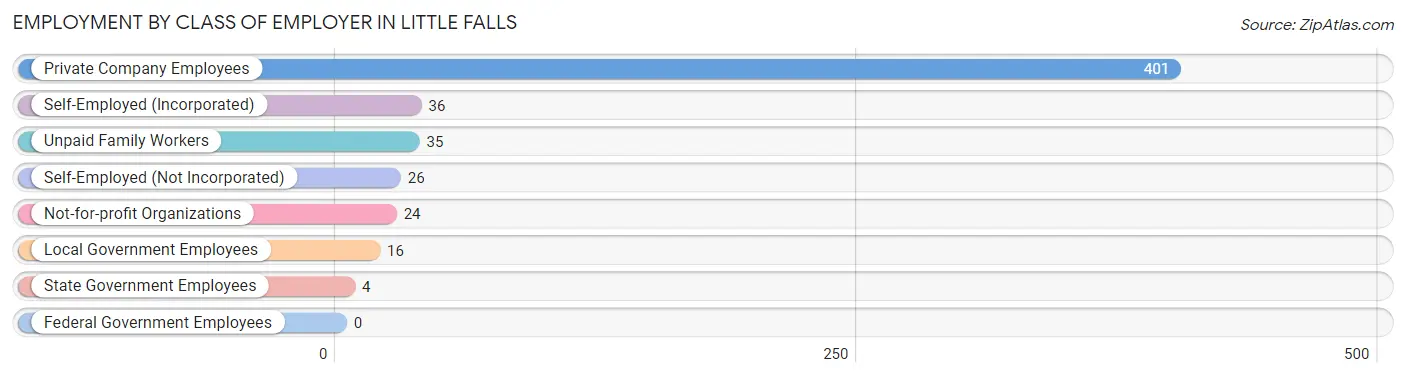
| Employer Class | # Employees | % Employees |
| Private Company Employees | 401 | 74.0% |
| Self-Employed (Incorporated) | 36 | 6.6% |
| Self-Employed (Not Incorporated) | 26 | 4.8% |
| Not-for-profit Organizations | 24 | 4.4% |
| Local Government Employees | 16 | 2.9% |
| State Government Employees | 4 | 0.7% |
| Federal Government Employees | 0 | 0.0% |
| Unpaid Family Workers | 35 | 6.5% |
| Total | 542 | 100.0% |
Employment Status by Age in Little Falls
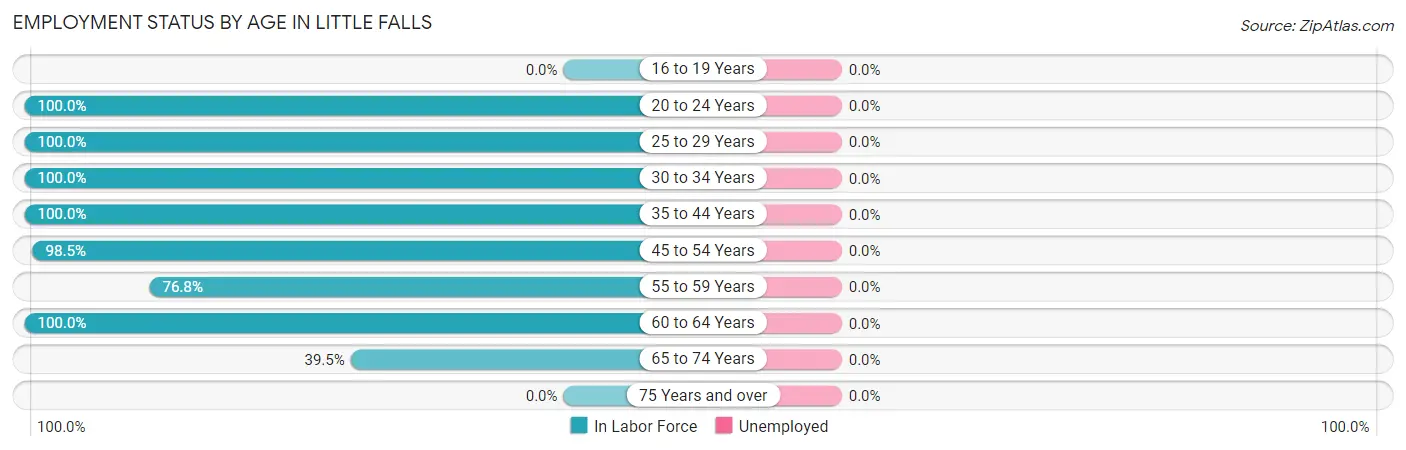
| Age Bracket | In Labor Force | Unemployed |
| 16 to 19 Years | 0 (0.0%) | 0 (0.0%) |
| 20 to 24 Years | 122 (100.0%) | 0 (0.0%) |
| 25 to 29 Years | 33 (100.0%) | 0 (0.0%) |
| 30 to 34 Years | 97 (100.0%) | 0 (0.0%) |
| 35 to 44 Years | 66 (100.0%) | 0 (0.0%) |
| 45 to 54 Years | 67 (98.5%) | 0 (0.0%) |
| 55 to 59 Years | 53 (76.8%) | 0 (0.0%) |
| 60 to 64 Years | 85 (100.0%) | 0 (0.0%) |
| 65 to 74 Years | 34 (39.5%) | 0 (0.0%) |
| 75 Years and over | 0 (0.0%) | 0 (0.0%) |
| Total | 557 (77.4%) | 0 (0.0%) |
Employment Status by Educational Attainment in Little Falls
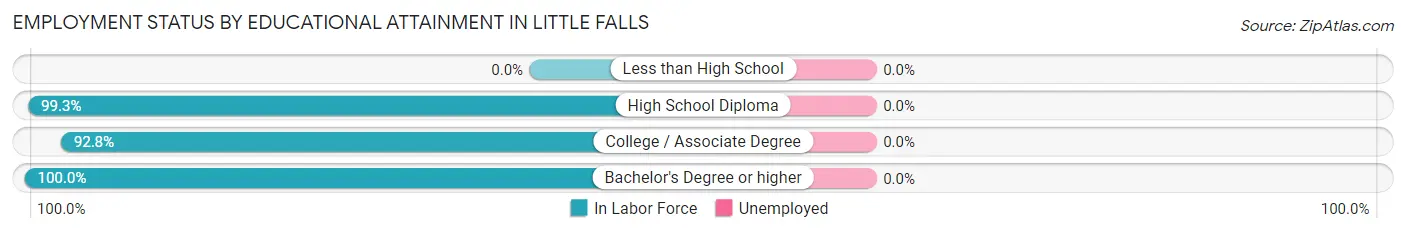
| Educational Attainment | In Labor Force | Unemployed |
| Less than High School | 0 (0.0%) | 0 (0.0%) |
| High School Diploma | 135 (99.3%) | 0 (0.0%) |
| College / Associate Degree | 205 (92.8%) | 0 (0.0%) |
| Bachelor's Degree or higher | 61 (100.0%) | 0 (0.0%) |
| Total | 401 (95.9%) | 0 (0.0%) |
Employment Occupations by Sex in Little Falls
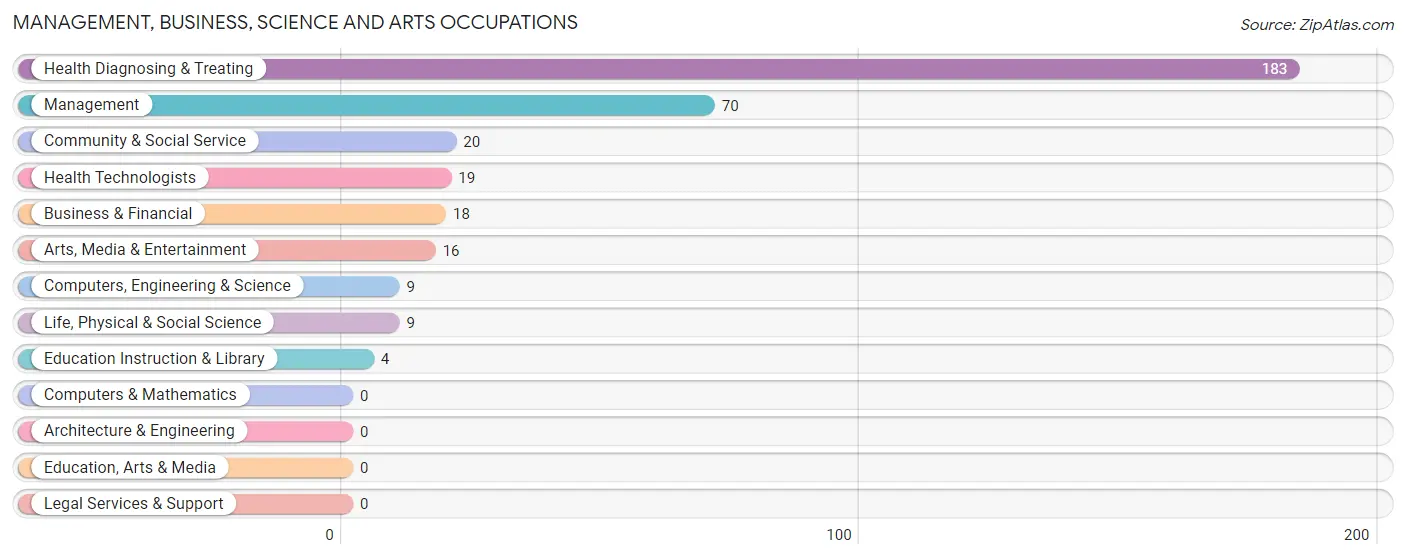
Management, Business, Science and Arts Occupations
The most common Management, Business, Science and Arts occupations in Little Falls are Health Diagnosing & Treating (183 | 32.9%), Management (70 | 12.6%), Community & Social Service (20 | 3.6%), Health Technologists (19 | 3.4%), and Business & Financial (18 | 3.2%).
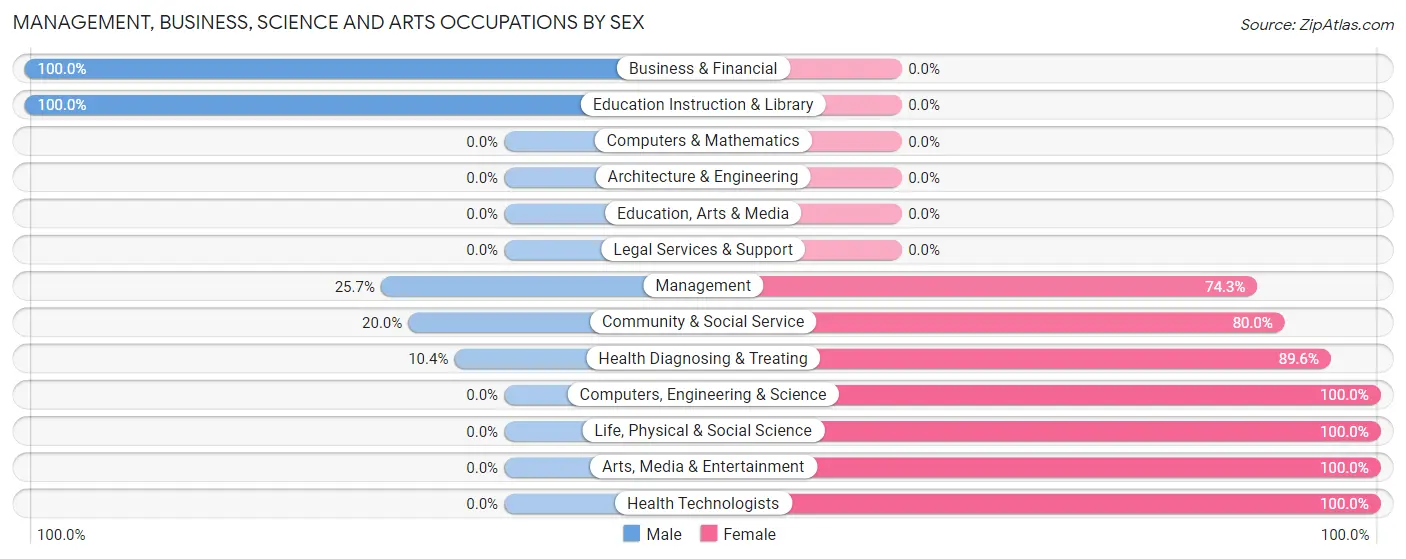
Management, Business, Science and Arts Occupations by Sex
Within the Management, Business, Science and Arts occupations in Little Falls, the most male-oriented occupations are Business & Financial (100.0%), Education Instruction & Library (100.0%), and Management (25.7%), while the most female-oriented occupations are Computers, Engineering & Science (100.0%), Life, Physical & Social Science (100.0%), and Arts, Media & Entertainment (100.0%).
| Occupation | Male | Female |
| Management | 18 (25.7%) | 52 (74.3%) |
| Business & Financial | 18 (100.0%) | 0 (0.0%) |
| Computers, Engineering & Science | 0 (0.0%) | 9 (100.0%) |
| Computers & Mathematics | 0 (0.0%) | 0 (0.0%) |
| Architecture & Engineering | 0 (0.0%) | 0 (0.0%) |
| Life, Physical & Social Science | 0 (0.0%) | 9 (100.0%) |
| Community & Social Service | 4 (20.0%) | 16 (80.0%) |
| Education, Arts & Media | 0 (0.0%) | 0 (0.0%) |
| Legal Services & Support | 0 (0.0%) | 0 (0.0%) |
| Education Instruction & Library | 4 (100.0%) | 0 (0.0%) |
| Arts, Media & Entertainment | 0 (0.0%) | 16 (100.0%) |
| Health Diagnosing & Treating | 19 (10.4%) | 164 (89.6%) |
| Health Technologists | 0 (0.0%) | 19 (100.0%) |
| Total (Category) | 59 (19.7%) | 241 (80.3%) |
| Total (Overall) | 214 (38.4%) | 343 (61.6%) |
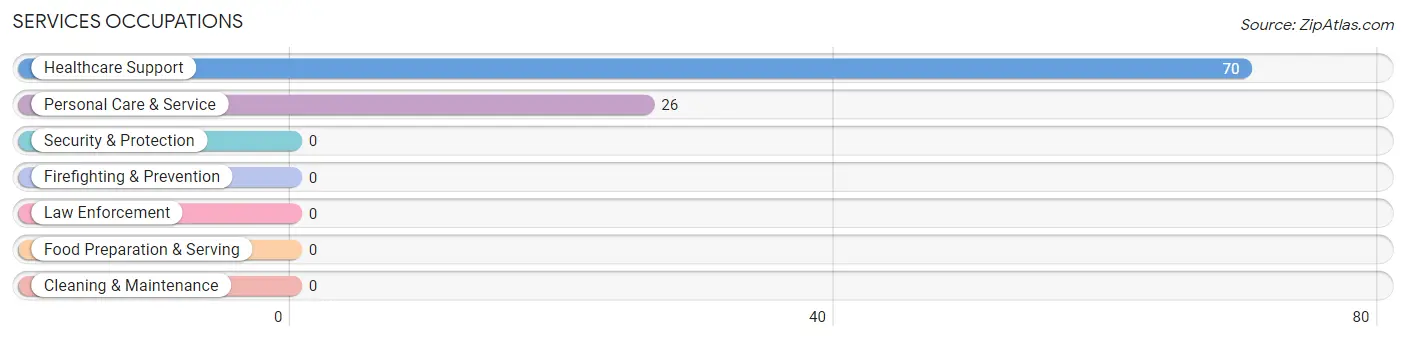
Services Occupations
The most common Services occupations in Little Falls are Healthcare Support (70 | 12.6%), and Personal Care & Service (26 | 4.7%).
Services Occupations by Sex
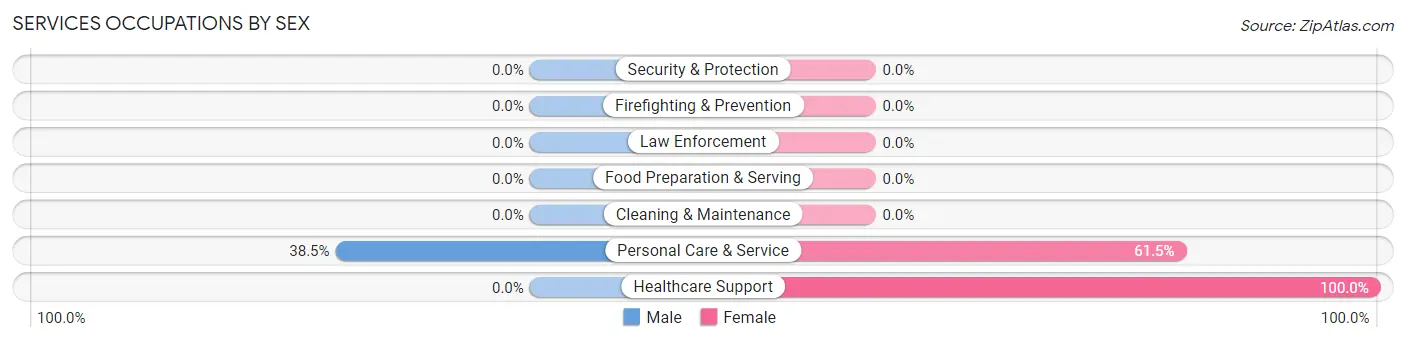
| Occupation | Male | Female |
| Healthcare Support | 0 (0.0%) | 70 (100.0%) |
| Security & Protection | 0 (0.0%) | 0 (0.0%) |
| Firefighting & Prevention | 0 (0.0%) | 0 (0.0%) |
| Law Enforcement | 0 (0.0%) | 0 (0.0%) |
| Food Preparation & Serving | 0 (0.0%) | 0 (0.0%) |
| Cleaning & Maintenance | 0 (0.0%) | 0 (0.0%) |
| Personal Care & Service | 10 (38.5%) | 16 (61.5%) |
| Total (Category) | 10 (10.4%) | 86 (89.6%) |
| Total (Overall) | 214 (38.4%) | 343 (61.6%) |
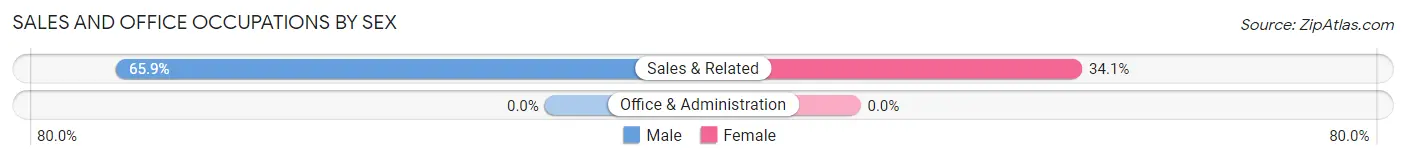
Sales and Office Occupations
The most common Sales and Office occupations in Little Falls are , and Sales & Related (44 | 7.9%).
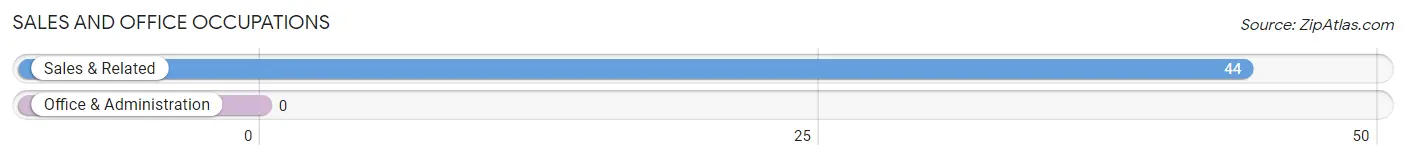
Sales and Office Occupations by Sex
| Occupation | Male | Female |
| Sales & Related | 29 (65.9%) | 15 (34.1%) |
| Office & Administration | 0 (0.0%) | 0 (0.0%) |
| Total (Category) | 29 (65.9%) | 15 (34.1%) |
| Total (Overall) | 214 (38.4%) | 343 (61.6%) |
Natural Resources, Construction and Maintenance Occupations
The most common Natural Resources, Construction and Maintenance occupations in Little Falls are Installation, Maintenance & Repair (50 | 9.0%), and Construction & Extraction (33 | 5.9%).
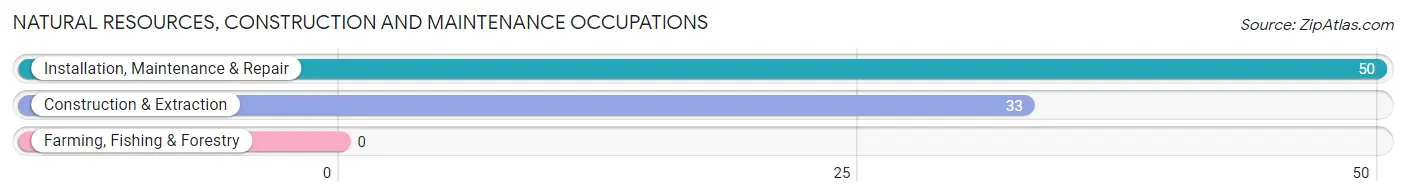
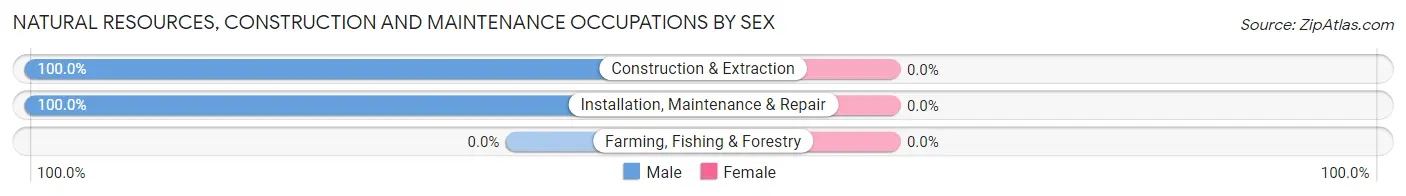
Natural Resources, Construction and Maintenance Occupations by Sex
| Occupation | Male | Female |
| Farming, Fishing & Forestry | 0 (0.0%) | 0 (0.0%) |
| Construction & Extraction | 33 (100.0%) | 0 (0.0%) |
| Installation, Maintenance & Repair | 50 (100.0%) | 0 (0.0%) |
| Total (Category) | 83 (100.0%) | 0 (0.0%) |
| Total (Overall) | 214 (38.4%) | 343 (61.6%) |
Production, Transportation and Moving Occupations
The most common Production, Transportation and Moving occupations in Little Falls are Transportation (33 | 5.9%), and Material Moving (1 | 0.2%).
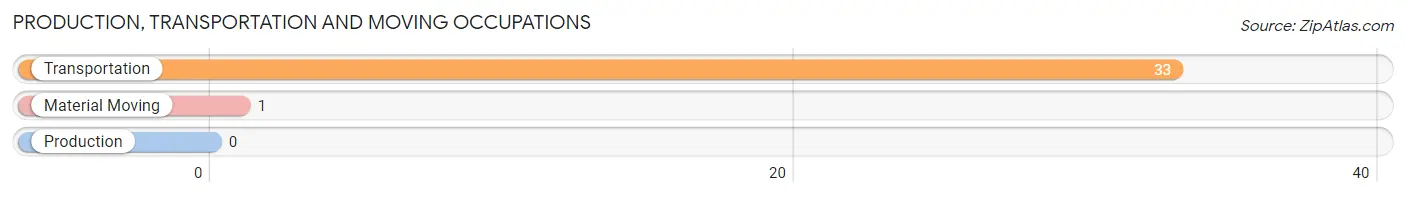
Production, Transportation and Moving Occupations by Sex
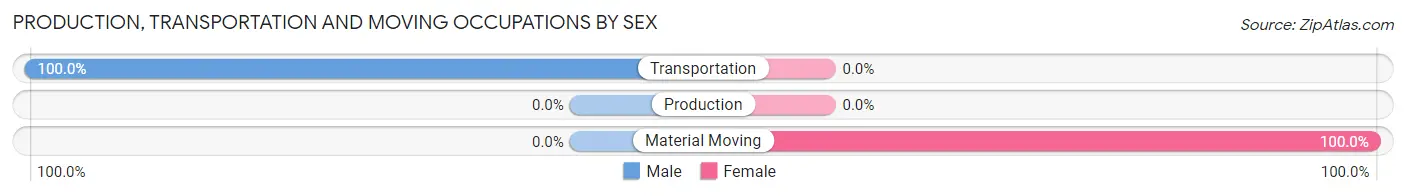
| Occupation | Male | Female |
| Production | 0 (0.0%) | 0 (0.0%) |
| Transportation | 33 (100.0%) | 0 (0.0%) |
| Material Moving | 0 (0.0%) | 1 (100.0%) |
| Total (Category) | 33 (97.1%) | 1 (2.9%) |
| Total (Overall) | 214 (38.4%) | 343 (61.6%) |
Employment Industries by Sex in Little Falls
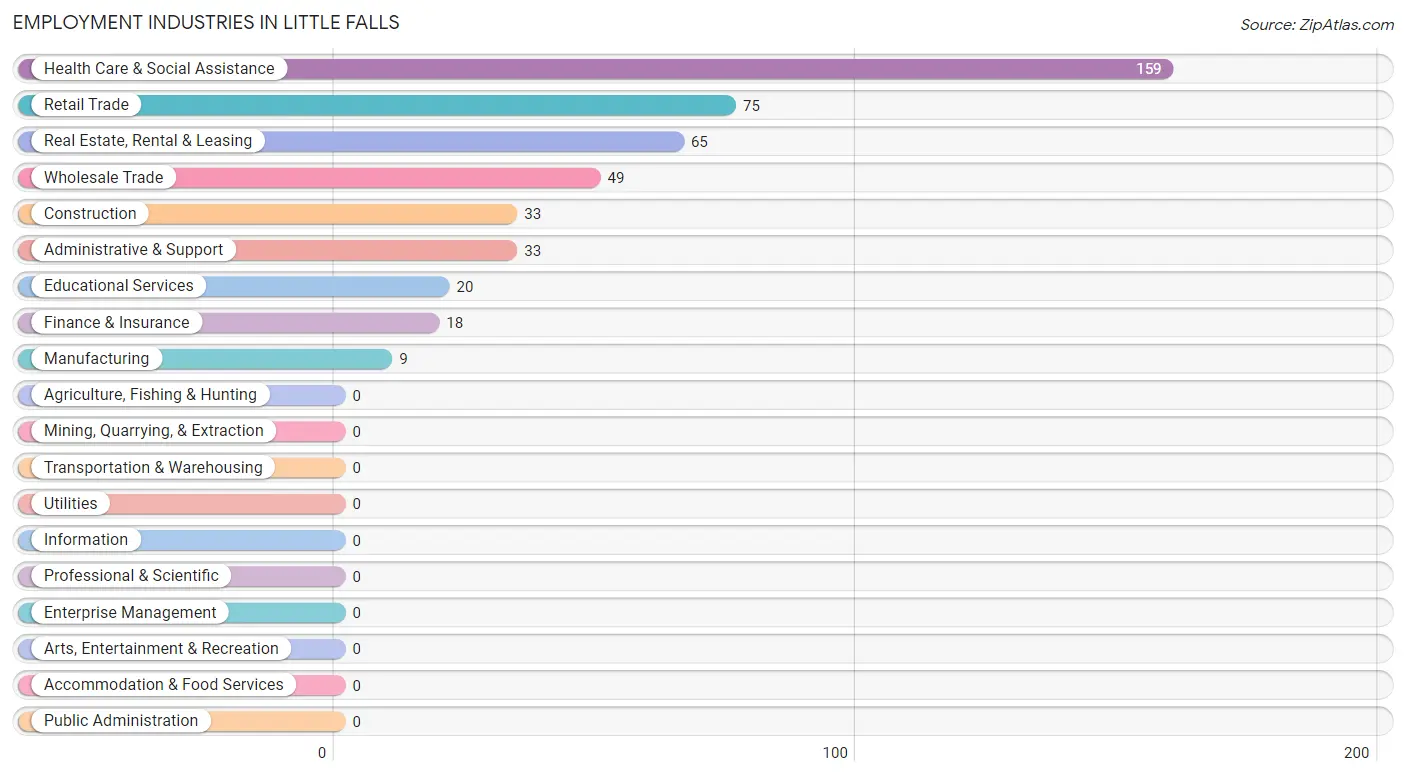
Employment Industries in Little Falls
The major employment industries in Little Falls include Health Care & Social Assistance (159 | 28.5%), Retail Trade (75 | 13.5%), Real Estate, Rental & Leasing (65 | 11.7%), Wholesale Trade (49 | 8.8%), and Construction (33 | 5.9%).
Employment Industries by Sex in Little Falls
The Little Falls industries that see more men than women are Construction (100.0%), Finance & Insurance (100.0%), and Administrative & Support (100.0%), whereas the industries that tend to have a higher number of women are Manufacturing (100.0%), Health Care & Social Assistance (100.0%), and Educational Services (80.0%).
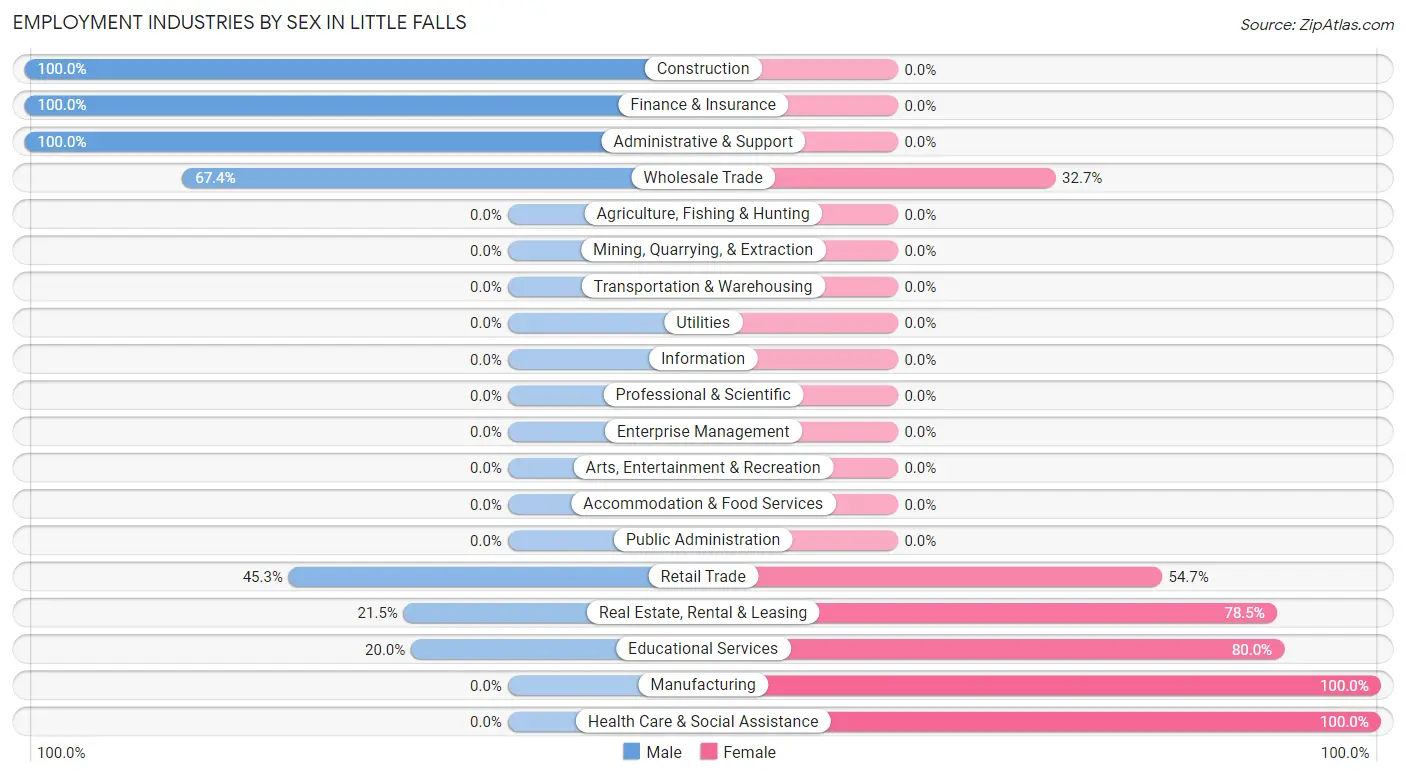
| Industry | Male | Female |
| Agriculture, Fishing & Hunting | 0 (0.0%) | 0 (0.0%) |
| Mining, Quarrying, & Extraction | 0 (0.0%) | 0 (0.0%) |
| Construction | 33 (100.0%) | 0 (0.0%) |
| Manufacturing | 0 (0.0%) | 9 (100.0%) |
| Wholesale Trade | 33 (67.3%) | 16 (32.7%) |
| Retail Trade | 34 (45.3%) | 41 (54.7%) |
| Transportation & Warehousing | 0 (0.0%) | 0 (0.0%) |
| Utilities | 0 (0.0%) | 0 (0.0%) |
| Information | 0 (0.0%) | 0 (0.0%) |
| Finance & Insurance | 18 (100.0%) | 0 (0.0%) |
| Real Estate, Rental & Leasing | 14 (21.5%) | 51 (78.5%) |
| Professional & Scientific | 0 (0.0%) | 0 (0.0%) |
| Enterprise Management | 0 (0.0%) | 0 (0.0%) |
| Administrative & Support | 33 (100.0%) | 0 (0.0%) |
| Educational Services | 4 (20.0%) | 16 (80.0%) |
| Health Care & Social Assistance | 0 (0.0%) | 159 (100.0%) |
| Arts, Entertainment & Recreation | 0 (0.0%) | 0 (0.0%) |
| Accommodation & Food Services | 0 (0.0%) | 0 (0.0%) |
| Public Administration | 0 (0.0%) | 0 (0.0%) |
| Total | 214 (38.4%) | 343 (61.6%) |
Education in Little Falls
School Enrollment in Little Falls
The most common levels of schooling among the 142 students in Little Falls are elementary school (87 | 61.3%), college / undergraduate (31 | 21.8%), and middle school (15 | 10.6%).
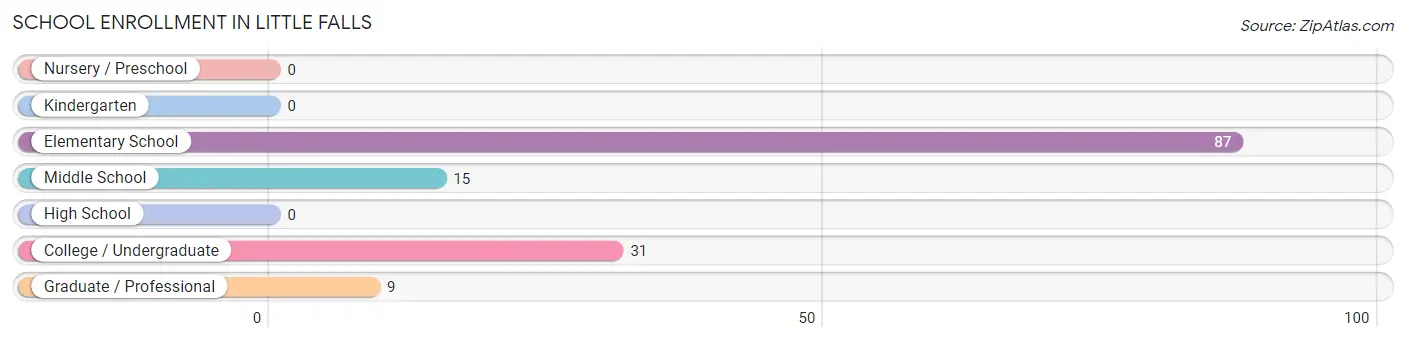
| School Level | # Students | % Students |
| Nursery / Preschool | 0 | 0.0% |
| Kindergarten | 0 | 0.0% |
| Elementary School | 87 | 61.3% |
| Middle School | 15 | 10.6% |
| High School | 0 | 0.0% |
| College / Undergraduate | 31 | 21.8% |
| Graduate / Professional | 9 | 6.3% |
| Total | 142 | 100.0% |
School Enrollment by Age by Funding Source in Little Falls
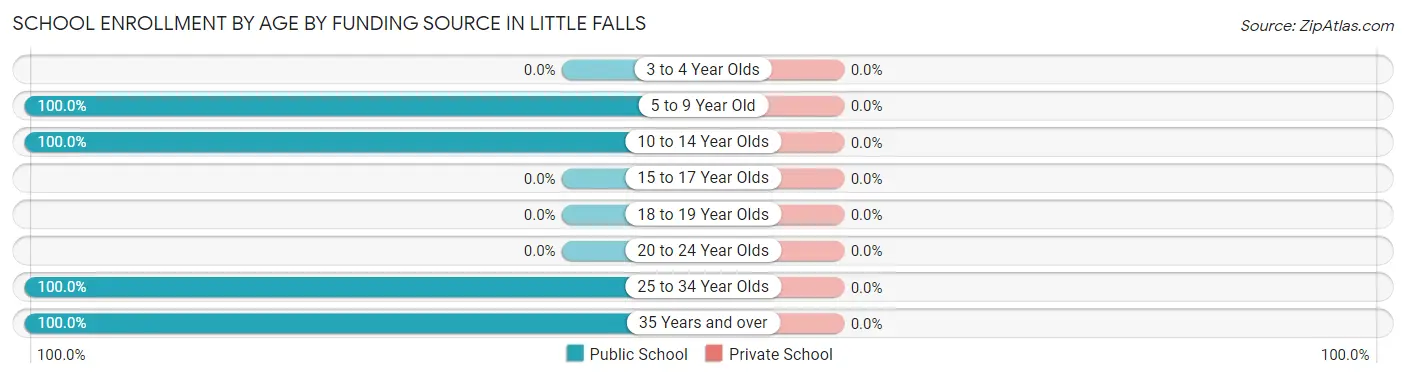
| Age Bracket | Public School | Private School |
| 3 to 4 Year Olds | 0 (0.0%) | 0 (0.0%) |
| 5 to 9 Year Old | 87 (100.0%) | 0 (0.0%) |
| 10 to 14 Year Olds | 15 (100.0%) | 0 (0.0%) |
| 15 to 17 Year Olds | 0 (0.0%) | 0 (0.0%) |
| 18 to 19 Year Olds | 0 (0.0%) | 0 (0.0%) |
| 20 to 24 Year Olds | 0 (0.0%) | 0 (0.0%) |
| 25 to 34 Year Olds | 9 (100.0%) | 0 (0.0%) |
| 35 Years and over | 31 (100.0%) | 0 (0.0%) |
| Total | 142 (100.0%) | 0 (0.0%) |
Educational Attainment by Field of Study in Little Falls
Education (38 | 27.1%), literature & languages (30 | 21.4%), bio, nature & agricultural (24 | 17.1%), social sciences (16 | 11.4%), and business (15 | 10.7%) are the most common fields of study among 140 individuals in Little Falls who have obtained a bachelor's degree or higher.
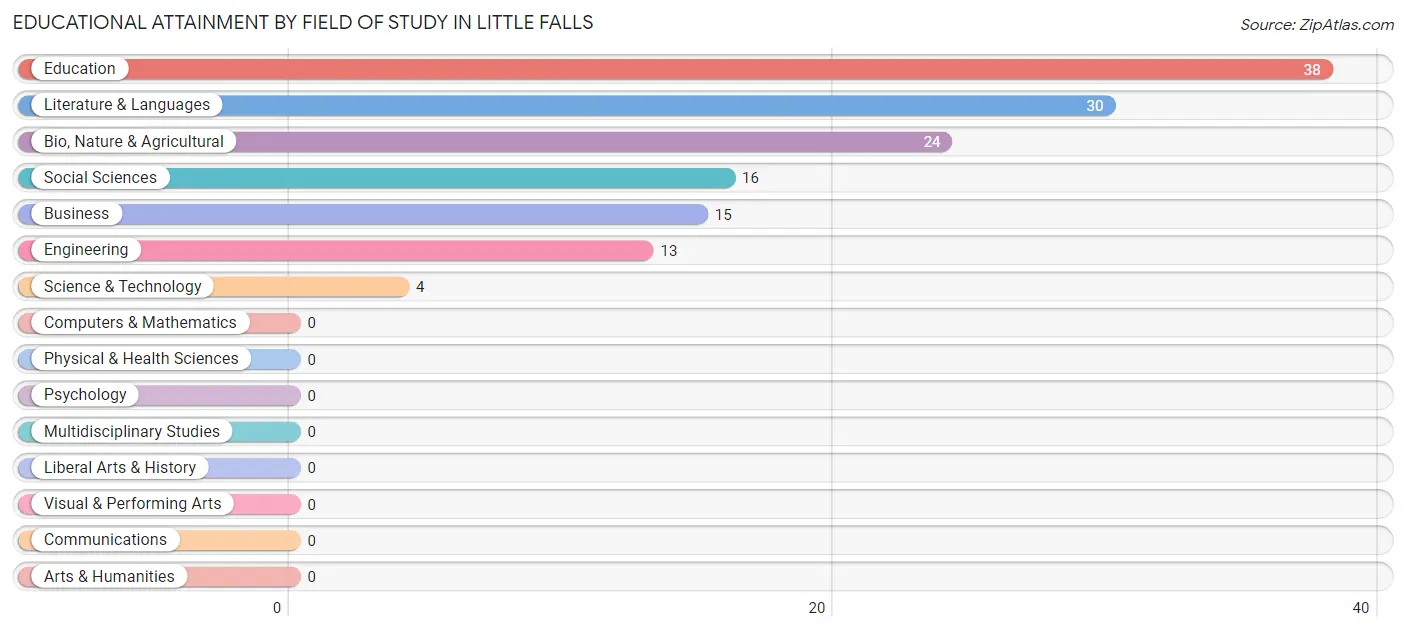
| Field of Study | # Graduates | % Graduates |
| Computers & Mathematics | 0 | 0.0% |
| Bio, Nature & Agricultural | 24 | 17.1% |
| Physical & Health Sciences | 0 | 0.0% |
| Psychology | 0 | 0.0% |
| Social Sciences | 16 | 11.4% |
| Engineering | 13 | 9.3% |
| Multidisciplinary Studies | 0 | 0.0% |
| Science & Technology | 4 | 2.9% |
| Business | 15 | 10.7% |
| Education | 38 | 27.1% |
| Literature & Languages | 30 | 21.4% |
| Liberal Arts & History | 0 | 0.0% |
| Visual & Performing Arts | 0 | 0.0% |
| Communications | 0 | 0.0% |
| Arts & Humanities | 0 | 0.0% |
| Total | 140 | 100.0% |
Transportation & Commute in Little Falls
Vehicle Availability by Sex in Little Falls
The most prevalent vehicle ownership categories in Little Falls are males with 2 vehicles (79, accounting for 39.7%) and females with 2 vehicles (157, making up 23.1%).
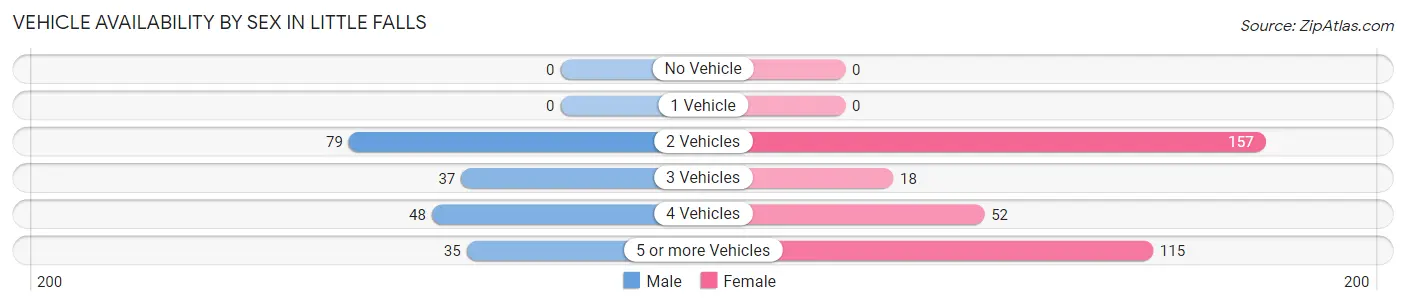
| Vehicles Available | Male | Female |
| No Vehicle | 0 (0.0%) | 0 (0.0%) |
| 1 Vehicle | 0 (0.0%) | 0 (0.0%) |
| 2 Vehicles | 79 (39.7%) | 157 (45.9%) |
| 3 Vehicles | 37 (18.6%) | 18 (5.3%) |
| 4 Vehicles | 48 (24.1%) | 52 (15.2%) |
| 5 or more Vehicles | 35 (17.6%) | 115 (33.6%) |
| Total | 199 (100.0%) | 342 (100.0%) |
Commute Time in Little Falls
The most frequently occuring commute durations in Little Falls are 30 to 34 minutes (140 commuters, 25.8%), 20 to 24 minutes (138 commuters, 25.5%), and 5 to 9 minutes (55 commuters, 10.2%).
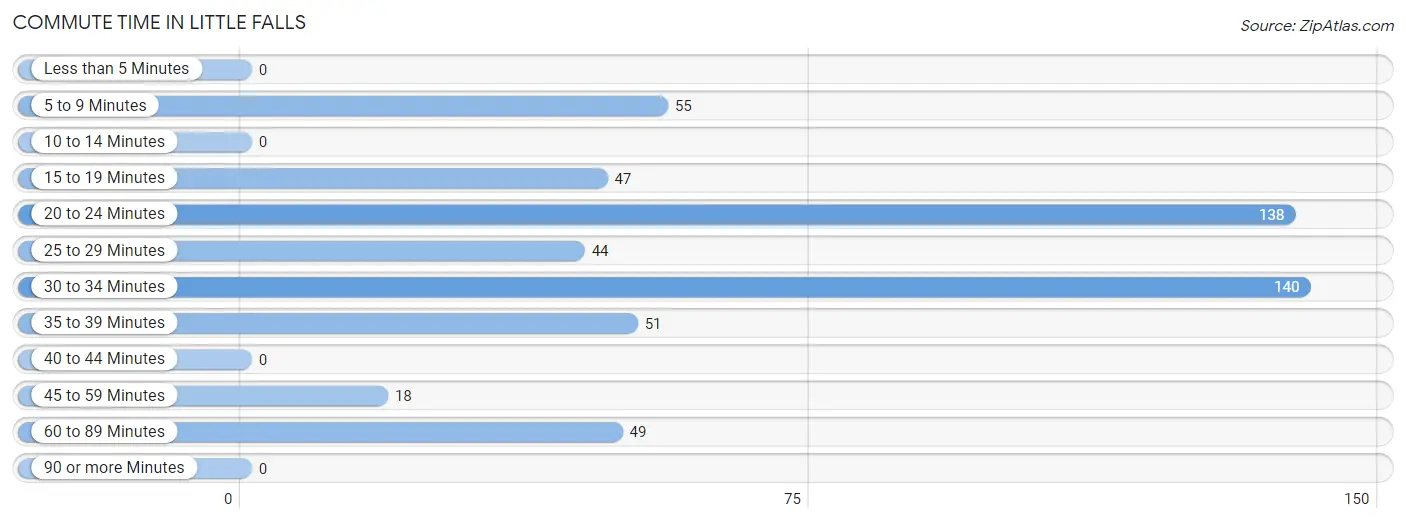
| Commute Time | # Commuters | % Commuters |
| Less than 5 Minutes | 0 | 0.0% |
| 5 to 9 Minutes | 55 | 10.2% |
| 10 to 14 Minutes | 0 | 0.0% |
| 15 to 19 Minutes | 47 | 8.7% |
| 20 to 24 Minutes | 138 | 25.5% |
| 25 to 29 Minutes | 44 | 8.1% |
| 30 to 34 Minutes | 140 | 25.8% |
| 35 to 39 Minutes | 51 | 9.4% |
| 40 to 44 Minutes | 0 | 0.0% |
| 45 to 59 Minutes | 18 | 3.3% |
| 60 to 89 Minutes | 49 | 9.0% |
| 90 or more Minutes | 0 | 0.0% |
Commute Time by Sex in Little Falls
The most common commute times in Little Falls are 20 to 24 minutes (63 commuters, 31.7%) for males and 30 to 34 minutes (122 commuters, 35.6%) for females.
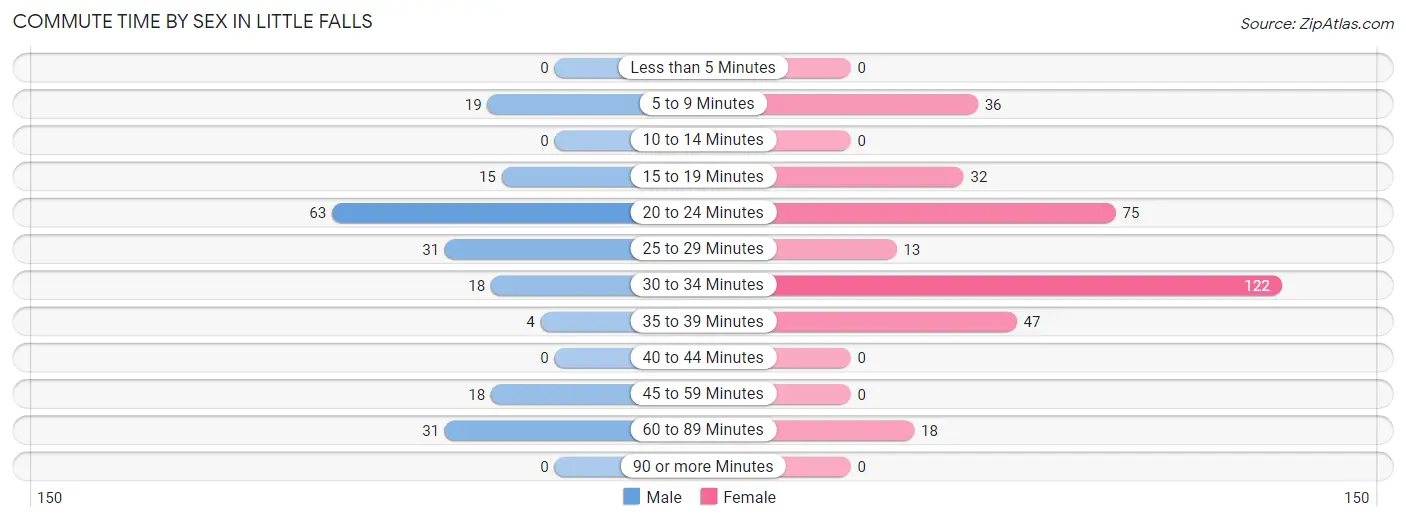
| Commute Time | Male | Female |
| Less than 5 Minutes | 0 (0.0%) | 0 (0.0%) |
| 5 to 9 Minutes | 19 (9.6%) | 36 (10.5%) |
| 10 to 14 Minutes | 0 (0.0%) | 0 (0.0%) |
| 15 to 19 Minutes | 15 (7.5%) | 32 (9.3%) |
| 20 to 24 Minutes | 63 (31.7%) | 75 (21.9%) |
| 25 to 29 Minutes | 31 (15.6%) | 13 (3.8%) |
| 30 to 34 Minutes | 18 (9.0%) | 122 (35.6%) |
| 35 to 39 Minutes | 4 (2.0%) | 47 (13.7%) |
| 40 to 44 Minutes | 0 (0.0%) | 0 (0.0%) |
| 45 to 59 Minutes | 18 (9.0%) | 0 (0.0%) |
| 60 to 89 Minutes | 31 (15.6%) | 18 (5.2%) |
| 90 or more Minutes | 0 (0.0%) | 0 (0.0%) |
Time of Departure to Work by Sex in Little Falls
The most frequent times of departure to work in Little Falls are 6:30 AM to 6:59 AM (63, 31.7%) for males and 7:00 AM to 7:29 AM (171, 49.8%) for females.
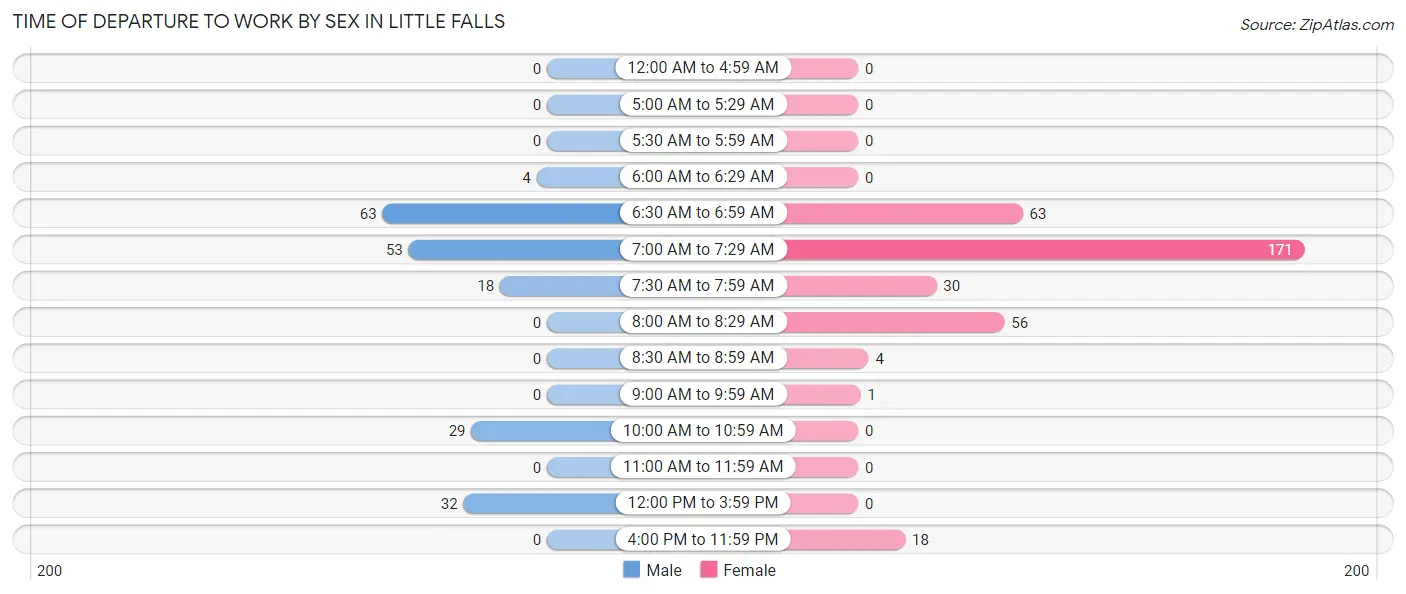
| Time of Departure | Male | Female |
| 12:00 AM to 4:59 AM | 0 (0.0%) | 0 (0.0%) |
| 5:00 AM to 5:29 AM | 0 (0.0%) | 0 (0.0%) |
| 5:30 AM to 5:59 AM | 0 (0.0%) | 0 (0.0%) |
| 6:00 AM to 6:29 AM | 4 (2.0%) | 0 (0.0%) |
| 6:30 AM to 6:59 AM | 63 (31.7%) | 63 (18.4%) |
| 7:00 AM to 7:29 AM | 53 (26.6%) | 171 (49.8%) |
| 7:30 AM to 7:59 AM | 18 (9.0%) | 30 (8.7%) |
| 8:00 AM to 8:29 AM | 0 (0.0%) | 56 (16.3%) |
| 8:30 AM to 8:59 AM | 0 (0.0%) | 4 (1.2%) |
| 9:00 AM to 9:59 AM | 0 (0.0%) | 1 (0.3%) |
| 10:00 AM to 10:59 AM | 29 (14.6%) | 0 (0.0%) |
| 11:00 AM to 11:59 AM | 0 (0.0%) | 0 (0.0%) |
| 12:00 PM to 3:59 PM | 32 (16.1%) | 0 (0.0%) |
| 4:00 PM to 11:59 PM | 0 (0.0%) | 18 (5.2%) |
| Total | 199 (100.0%) | 343 (100.0%) |
Housing Occupancy in Little Falls
Occupancy by Ownership in Little Falls
Of the total 290 dwellings in Little Falls, owner-occupied units account for 223 (76.9%), while renter-occupied units make up 67 (23.1%).
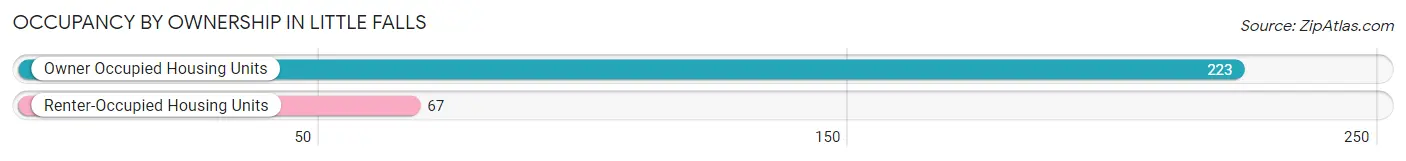
| Occupancy | # Housing Units | % Housing Units |
| Owner Occupied Housing Units | 223 | 76.9% |
| Renter-Occupied Housing Units | 67 | 23.1% |
| Total Occupied Housing Units | 290 | 100.0% |
Occupancy by Household Size in Little Falls
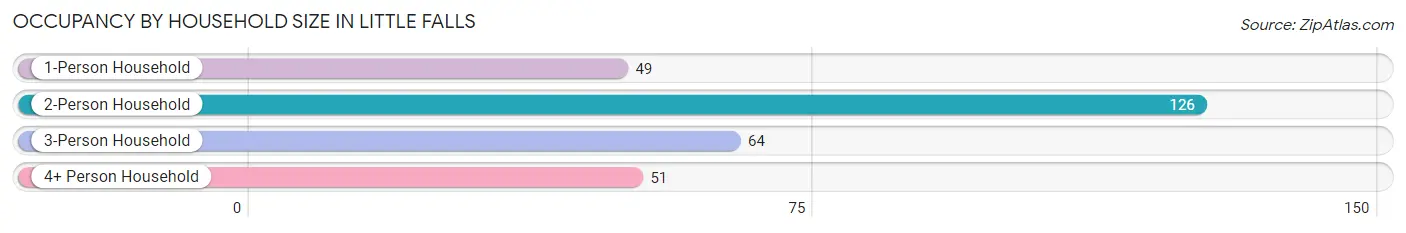
| Household Size | # Housing Units | % Housing Units |
| 1-Person Household | 49 | 16.9% |
| 2-Person Household | 126 | 43.4% |
| 3-Person Household | 64 | 22.1% |
| 4+ Person Household | 51 | 17.6% |
| Total Housing Units | 290 | 100.0% |
Occupancy by Ownership by Household Size in Little Falls
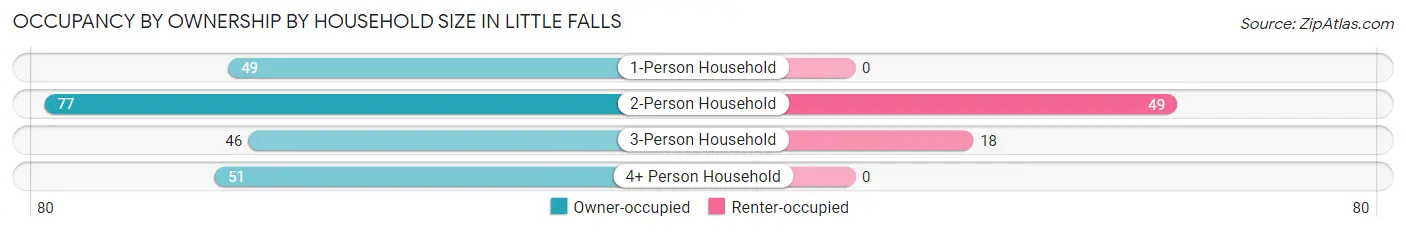
| Household Size | Owner-occupied | Renter-occupied |
| 1-Person Household | 49 (100.0%) | 0 (0.0%) |
| 2-Person Household | 77 (61.1%) | 49 (38.9%) |
| 3-Person Household | 46 (71.9%) | 18 (28.1%) |
| 4+ Person Household | 51 (100.0%) | 0 (0.0%) |
| Total Housing Units | 223 (76.9%) | 67 (23.1%) |
Occupancy by Educational Attainment in Little Falls
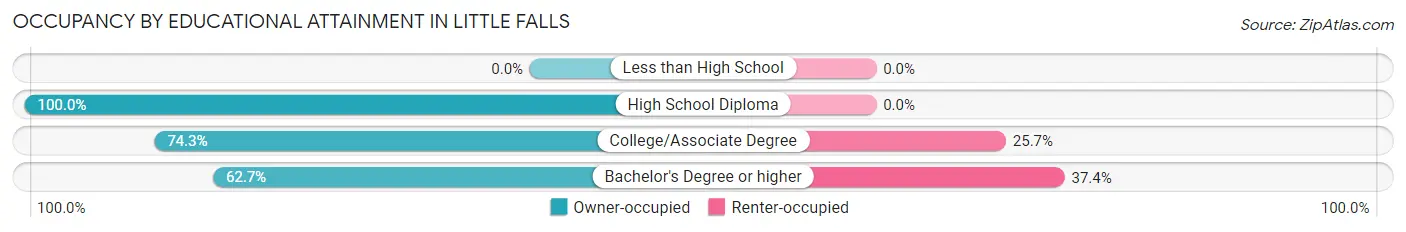
| Household Size | Owner-occupied | Renter-occupied |
| Less than High School | 0 (0.0%) | 0 (0.0%) |
| High School Diploma | 67 (100.0%) | 0 (0.0%) |
| College/Associate Degree | 104 (74.3%) | 36 (25.7%) |
| Bachelor's Degree or higher | 52 (62.6%) | 31 (37.3%) |
Occupancy by Age of Householder in Little Falls
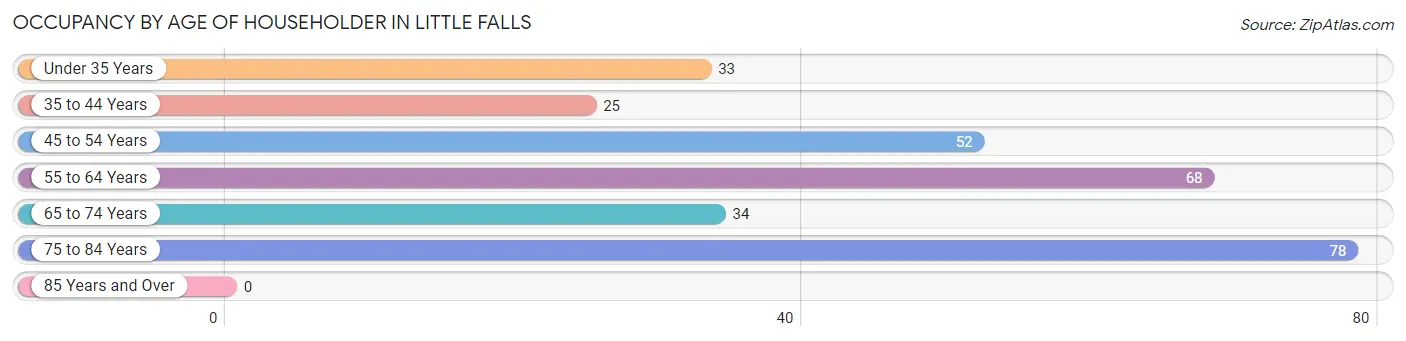
| Age Bracket | # Households | % Households |
| Under 35 Years | 33 | 11.4% |
| 35 to 44 Years | 25 | 8.6% |
| 45 to 54 Years | 52 | 17.9% |
| 55 to 64 Years | 68 | 23.4% |
| 65 to 74 Years | 34 | 11.7% |
| 75 to 84 Years | 78 | 26.9% |
| 85 Years and Over | 0 | 0.0% |
| Total | 290 | 100.0% |
Housing Finances in Little Falls
Median Income by Occupancy in Little Falls
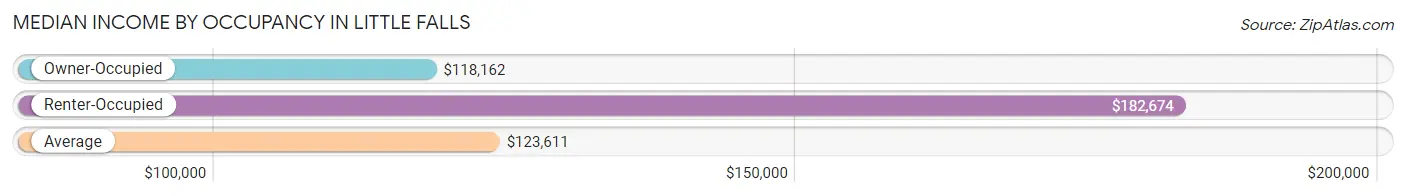
| Occupancy Type | # Households | Median Income |
| Owner-Occupied | 223 (76.9%) | $118,162 |
| Renter-Occupied | 67 (23.1%) | $182,674 |
| Average | 290 (100.0%) | $123,611 |
Occupancy by Householder Income Bracket in Little Falls
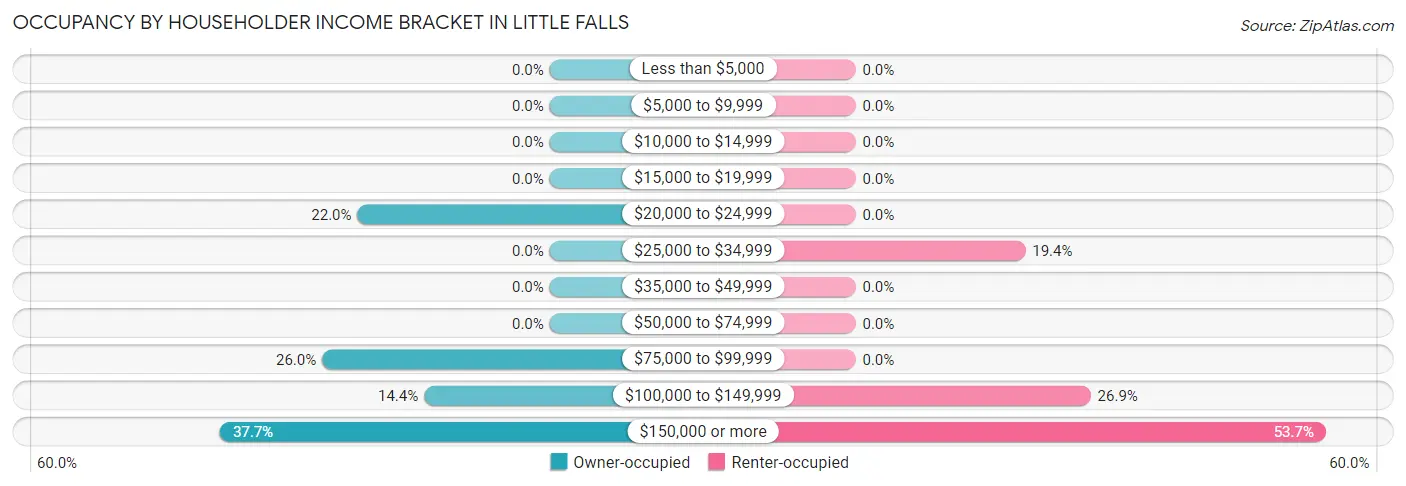
| Income Bracket | Owner-occupied | Renter-occupied |
| Less than $5,000 | 0 (0.0%) | 0 (0.0%) |
| $5,000 to $9,999 | 0 (0.0%) | 0 (0.0%) |
| $10,000 to $14,999 | 0 (0.0%) | 0 (0.0%) |
| $15,000 to $19,999 | 0 (0.0%) | 0 (0.0%) |
| $20,000 to $24,999 | 49 (22.0%) | 0 (0.0%) |
| $25,000 to $34,999 | 0 (0.0%) | 13 (19.4%) |
| $35,000 to $49,999 | 0 (0.0%) | 0 (0.0%) |
| $50,000 to $74,999 | 0 (0.0%) | 0 (0.0%) |
| $75,000 to $99,999 | 58 (26.0%) | 0 (0.0%) |
| $100,000 to $149,999 | 32 (14.3%) | 18 (26.9%) |
| $150,000 or more | 84 (37.7%) | 36 (53.7%) |
| Total | 223 (100.0%) | 67 (100.0%) |
Monthly Housing Cost Tiers in Little Falls
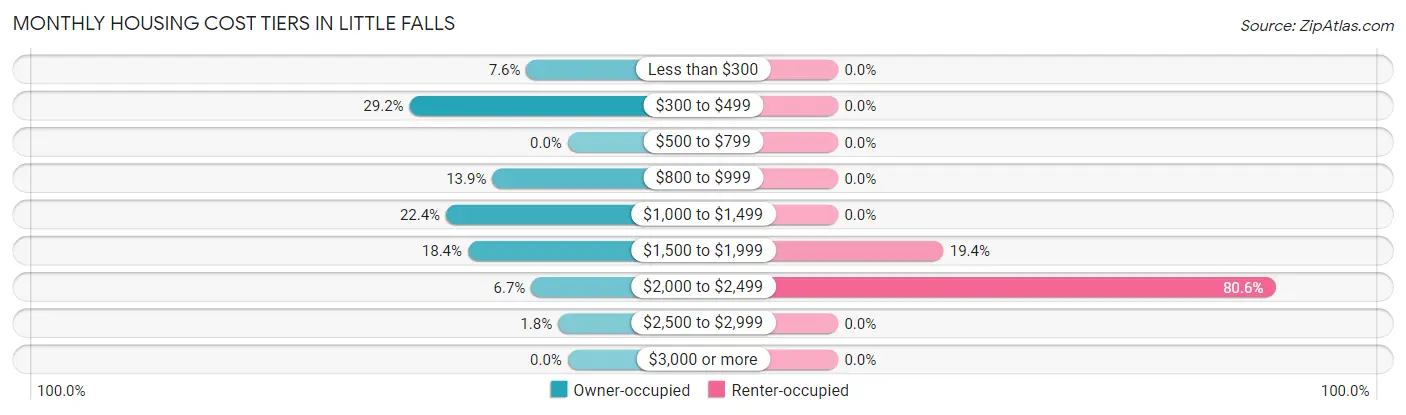
| Monthly Cost | Owner-occupied | Renter-occupied |
| Less than $300 | 17 (7.6%) | 0 (0.0%) |
| $300 to $499 | 65 (29.1%) | 0 (0.0%) |
| $500 to $799 | 0 (0.0%) | 0 (0.0%) |
| $800 to $999 | 31 (13.9%) | 0 (0.0%) |
| $1,000 to $1,499 | 50 (22.4%) | 0 (0.0%) |
| $1,500 to $1,999 | 41 (18.4%) | 13 (19.4%) |
| $2,000 to $2,499 | 15 (6.7%) | 54 (80.6%) |
| $2,500 to $2,999 | 4 (1.8%) | 0 (0.0%) |
| $3,000 or more | 0 (0.0%) | 0 (0.0%) |
| Total | 223 (100.0%) | 67 (100.0%) |
Physical Housing Characteristics in Little Falls
Housing Structures in Little Falls
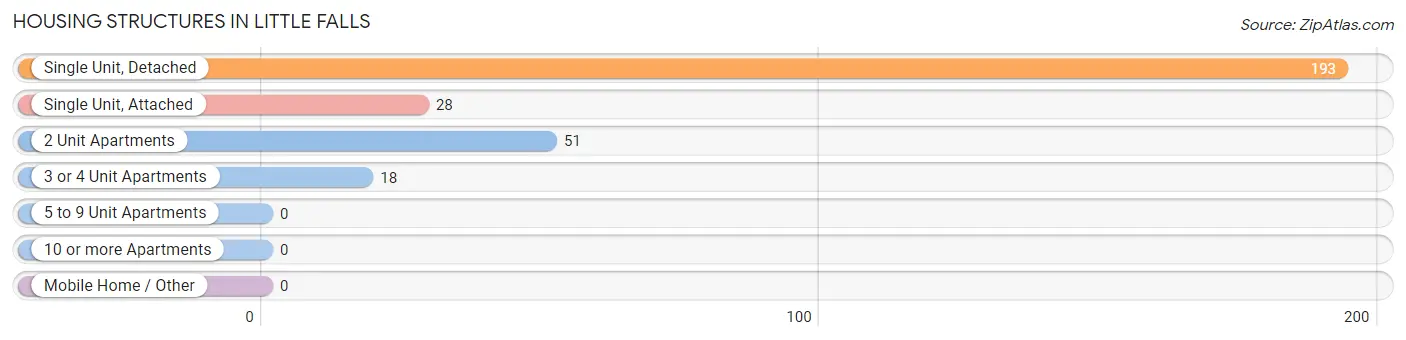
| Structure Type | # Housing Units | % Housing Units |
| Single Unit, Detached | 193 | 66.5% |
| Single Unit, Attached | 28 | 9.7% |
| 2 Unit Apartments | 51 | 17.6% |
| 3 or 4 Unit Apartments | 18 | 6.2% |
| 5 to 9 Unit Apartments | 0 | 0.0% |
| 10 or more Apartments | 0 | 0.0% |
| Mobile Home / Other | 0 | 0.0% |
| Total | 290 | 100.0% |
Housing Structures by Occupancy in Little Falls
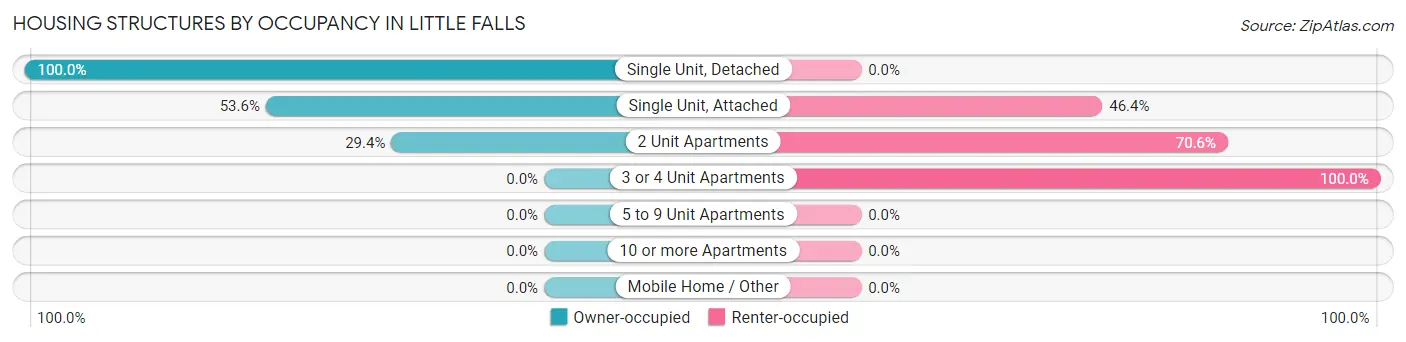
| Structure Type | Owner-occupied | Renter-occupied |
| Single Unit, Detached | 193 (100.0%) | 0 (0.0%) |
| Single Unit, Attached | 15 (53.6%) | 13 (46.4%) |
| 2 Unit Apartments | 15 (29.4%) | 36 (70.6%) |
| 3 or 4 Unit Apartments | 0 (0.0%) | 18 (100.0%) |
| 5 to 9 Unit Apartments | 0 (0.0%) | 0 (0.0%) |
| 10 or more Apartments | 0 (0.0%) | 0 (0.0%) |
| Mobile Home / Other | 0 (0.0%) | 0 (0.0%) |
| Total | 223 (76.9%) | 67 (23.1%) |
Housing Structures by Number of Rooms in Little Falls
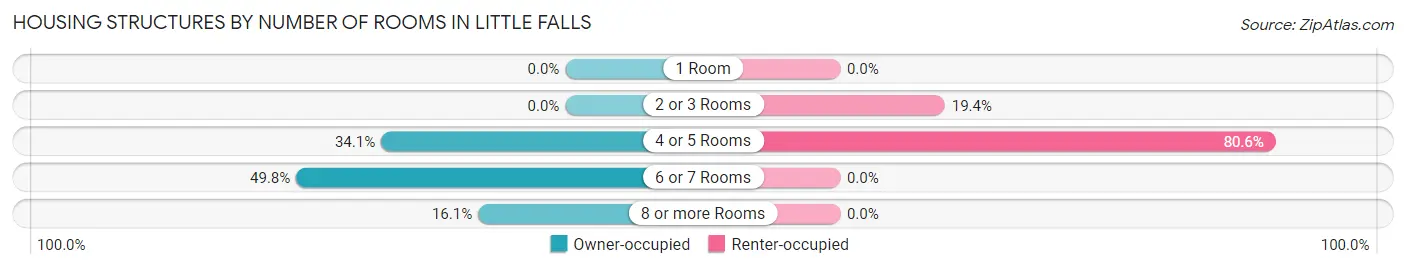
| Number of Rooms | Owner-occupied | Renter-occupied |
| 1 Room | 0 (0.0%) | 0 (0.0%) |
| 2 or 3 Rooms | 0 (0.0%) | 13 (19.4%) |
| 4 or 5 Rooms | 76 (34.1%) | 54 (80.6%) |
| 6 or 7 Rooms | 111 (49.8%) | 0 (0.0%) |
| 8 or more Rooms | 36 (16.1%) | 0 (0.0%) |
| Total | 223 (100.0%) | 67 (100.0%) |
Housing Structure by Heating Type in Little Falls
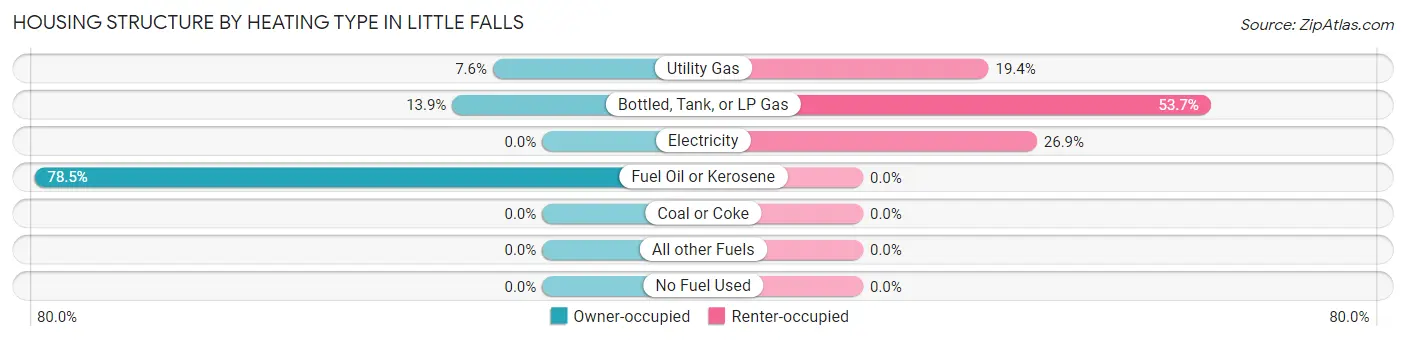
| Heating Type | Owner-occupied | Renter-occupied |
| Utility Gas | 17 (7.6%) | 13 (19.4%) |
| Bottled, Tank, or LP Gas | 31 (13.9%) | 36 (53.7%) |
| Electricity | 0 (0.0%) | 18 (26.9%) |
| Fuel Oil or Kerosene | 175 (78.5%) | 0 (0.0%) |
| Coal or Coke | 0 (0.0%) | 0 (0.0%) |
| All other Fuels | 0 (0.0%) | 0 (0.0%) |
| No Fuel Used | 0 (0.0%) | 0 (0.0%) |
| Total | 223 (100.0%) | 67 (100.0%) |
Household Vehicle Usage in Little Falls
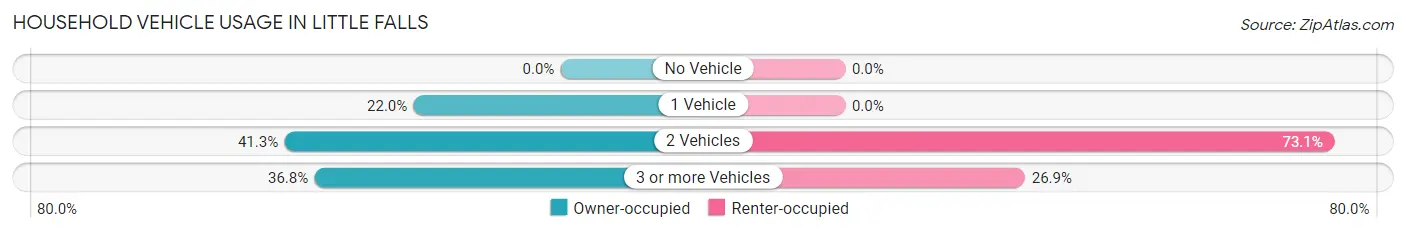
| Vehicles per Household | Owner-occupied | Renter-occupied |
| No Vehicle | 0 (0.0%) | 0 (0.0%) |
| 1 Vehicle | 49 (22.0%) | 0 (0.0%) |
| 2 Vehicles | 92 (41.3%) | 49 (73.1%) |
| 3 or more Vehicles | 82 (36.8%) | 18 (26.9%) |
| Total | 223 (100.0%) | 67 (100.0%) |
Real Estate & Mortgages in Little Falls
Real Estate and Mortgage Overview in Little Falls
| Characteristic | Without Mortgage | With Mortgage |
| Housing Units | 128 | 95 |
| Median Property Value | - | - |
| Median Household Income | $80,000 | $70 |
| Monthly Housing Costs | $472 | $0 |
| Real Estate Taxes | - | - |
Property Value by Mortgage Status in Little Falls
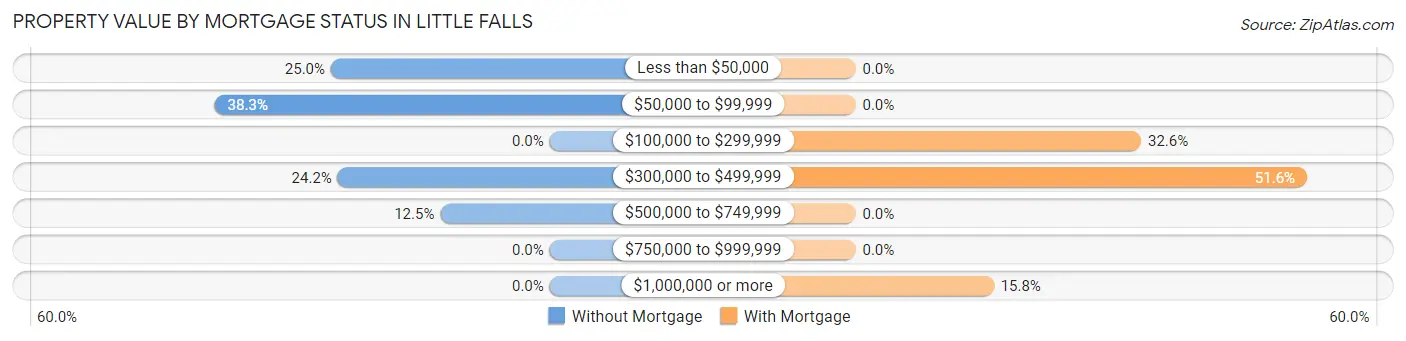
| Property Value | Without Mortgage | With Mortgage |
| Less than $50,000 | 32 (25.0%) | 0 (0.0%) |
| $50,000 to $99,999 | 49 (38.3%) | 0 (0.0%) |
| $100,000 to $299,999 | 0 (0.0%) | 31 (32.6%) |
| $300,000 to $499,999 | 31 (24.2%) | 49 (51.6%) |
| $500,000 to $749,999 | 16 (12.5%) | 0 (0.0%) |
| $750,000 to $999,999 | 0 (0.0%) | 0 (0.0%) |
| $1,000,000 or more | 0 (0.0%) | 15 (15.8%) |
| Total | 128 (100.0%) | 95 (100.0%) |
Household Income by Mortgage Status in Little Falls
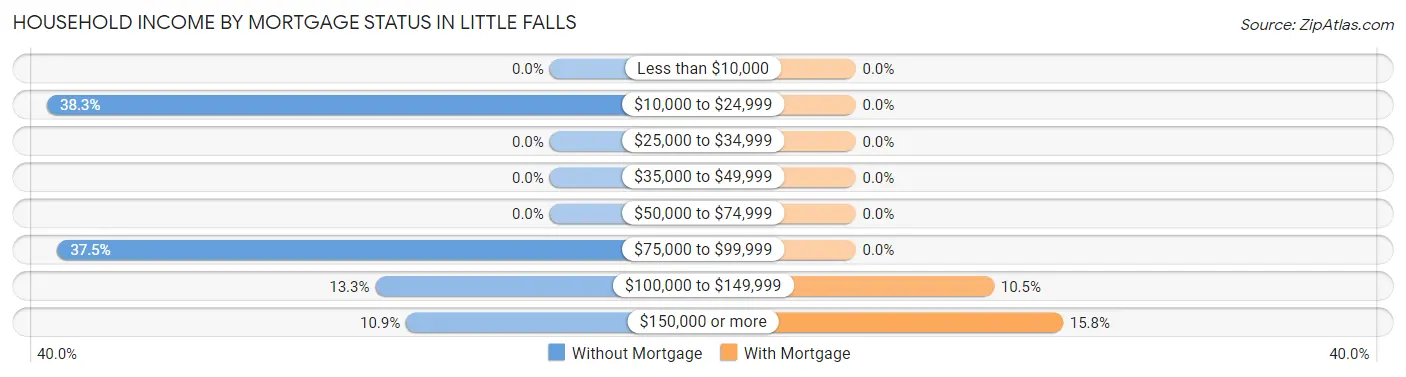
| Household Income | Without Mortgage | With Mortgage |
| Less than $10,000 | 0 (0.0%) | 0 (0.0%) |
| $10,000 to $24,999 | 49 (38.3%) | 0 (0.0%) |
| $25,000 to $34,999 | 0 (0.0%) | 0 (0.0%) |
| $35,000 to $49,999 | 0 (0.0%) | 0 (0.0%) |
| $50,000 to $74,999 | 0 (0.0%) | 0 (0.0%) |
| $75,000 to $99,999 | 48 (37.5%) | 0 (0.0%) |
| $100,000 to $149,999 | 17 (13.3%) | 10 (10.5%) |
| $150,000 or more | 14 (10.9%) | 15 (15.8%) |
| Total | 128 (100.0%) | 95 (100.0%) |
Property Value to Household Income Ratio in Little Falls
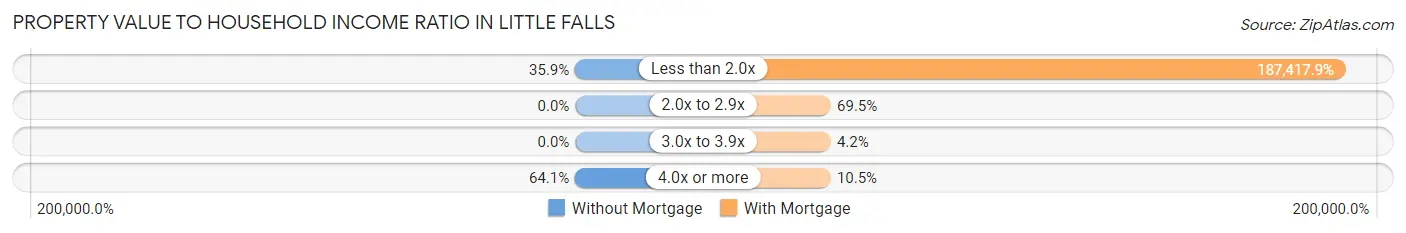
| Value-to-Income Ratio | Without Mortgage | With Mortgage |
| Less than 2.0x | 46 (35.9%) | 178,047 (187,417.9%) |
| 2.0x to 2.9x | 0 (0.0%) | 66 (69.5%) |
| 3.0x to 3.9x | 0 (0.0%) | 4 (4.2%) |
| 4.0x or more | 82 (64.1%) | 10 (10.5%) |
| Total | 128 (100.0%) | 95 (100.0%) |
Real Estate Taxes by Mortgage Status in Little Falls
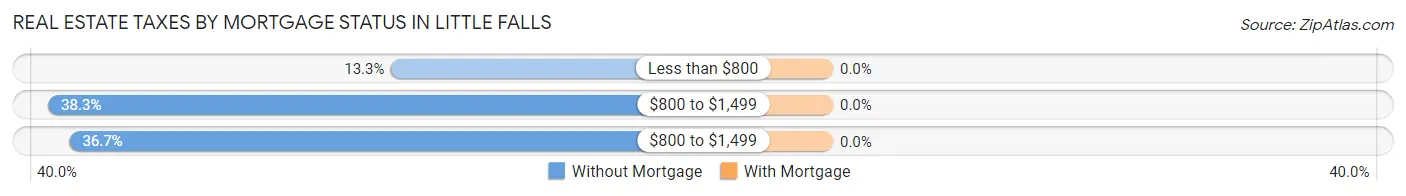
| Property Taxes | Without Mortgage | With Mortgage |
| Less than $800 | 17 (13.3%) | 0 (0.0%) |
| $800 to $1,499 | 49 (38.3%) | 0 (0.0%) |
| $800 to $1,499 | 47 (36.7%) | 0 (0.0%) |
| Total | 128 (100.0%) | 95 (100.0%) |
Health & Disability in Little Falls
Health Insurance Coverage by Age in Little Falls
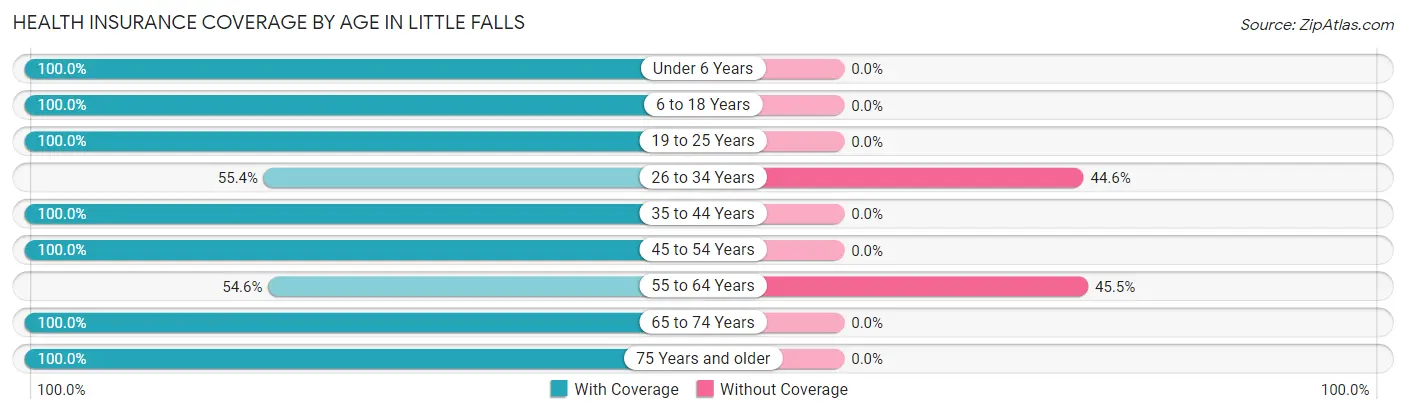
| Age Bracket | With Coverage | Without Coverage |
| Under 6 Years | 31 (100.0%) | 0 (0.0%) |
| 6 to 18 Years | 140 (100.0%) | 0 (0.0%) |
| 19 to 25 Years | 122 (100.0%) | 0 (0.0%) |
| 26 to 34 Years | 72 (55.4%) | 58 (44.6%) |
| 35 to 44 Years | 66 (100.0%) | 0 (0.0%) |
| 45 to 54 Years | 68 (100.0%) | 0 (0.0%) |
| 55 to 64 Years | 84 (54.5%) | 70 (45.5%) |
| 65 to 74 Years | 86 (100.0%) | 0 (0.0%) |
| 75 Years and older | 94 (100.0%) | 0 (0.0%) |
| Total | 763 (85.6%) | 128 (14.4%) |
Health Insurance Coverage by Citizenship Status in Little Falls
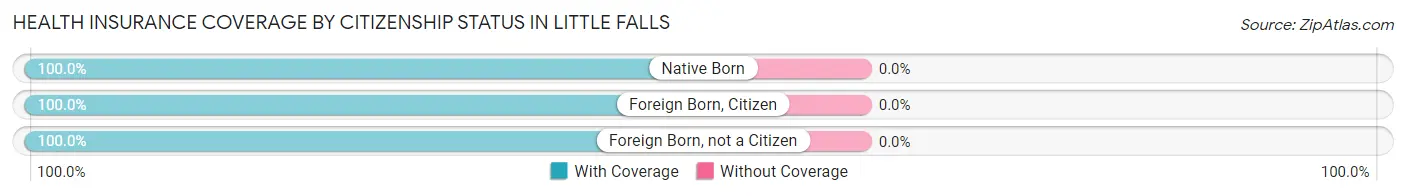
| Citizenship Status | With Coverage | Without Coverage |
| Native Born | 31 (100.0%) | 0 (0.0%) |
| Foreign Born, Citizen | 140 (100.0%) | 0 (0.0%) |
| Foreign Born, not a Citizen | 122 (100.0%) | 0 (0.0%) |
Health Insurance Coverage by Household Income in Little Falls
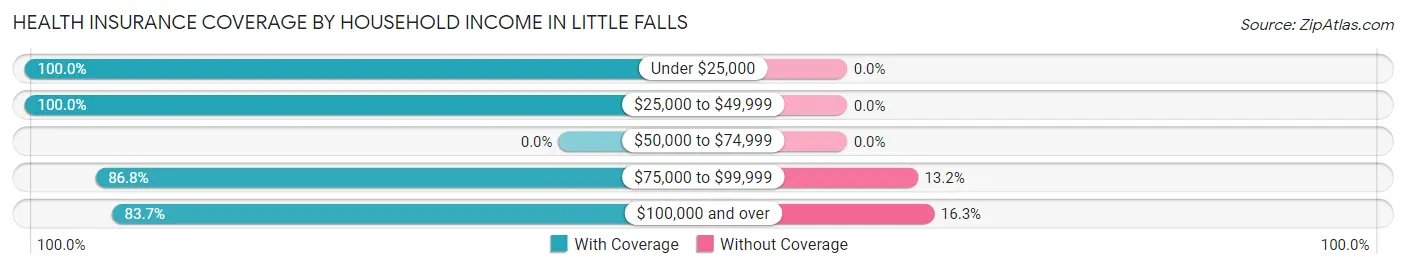
| Household Income | With Coverage | Without Coverage |
| Under $25,000 | 49 (100.0%) | 0 (0.0%) |
| $25,000 to $49,999 | 28 (100.0%) | 0 (0.0%) |
| $50,000 to $74,999 | 0 (0.0%) | 0 (0.0%) |
| $75,000 to $99,999 | 118 (86.8%) | 18 (13.2%) |
| $100,000 and over | 564 (83.7%) | 110 (16.3%) |
Public vs Private Health Insurance Coverage by Age in Little Falls
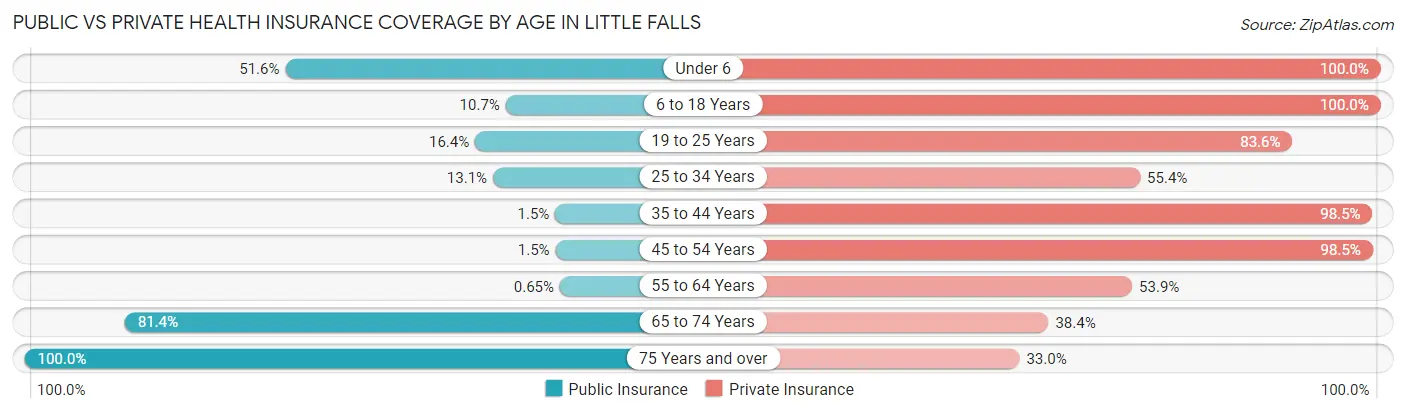
| Age Bracket | Public Insurance | Private Insurance |
| Under 6 | 16 (51.6%) | 31 (100.0%) |
| 6 to 18 Years | 15 (10.7%) | 140 (100.0%) |
| 19 to 25 Years | 20 (16.4%) | 102 (83.6%) |
| 25 to 34 Years | 17 (13.1%) | 72 (55.4%) |
| 35 to 44 Years | 1 (1.5%) | 65 (98.5%) |
| 45 to 54 Years | 1 (1.5%) | 67 (98.5%) |
| 55 to 64 Years | 1 (0.6%) | 83 (53.9%) |
| 65 to 74 Years | 70 (81.4%) | 33 (38.4%) |
| 75 Years and over | 94 (100.0%) | 31 (33.0%) |
| Total | 235 (26.4%) | 624 (70.0%) |
Disability Status by Sex by Age in Little Falls
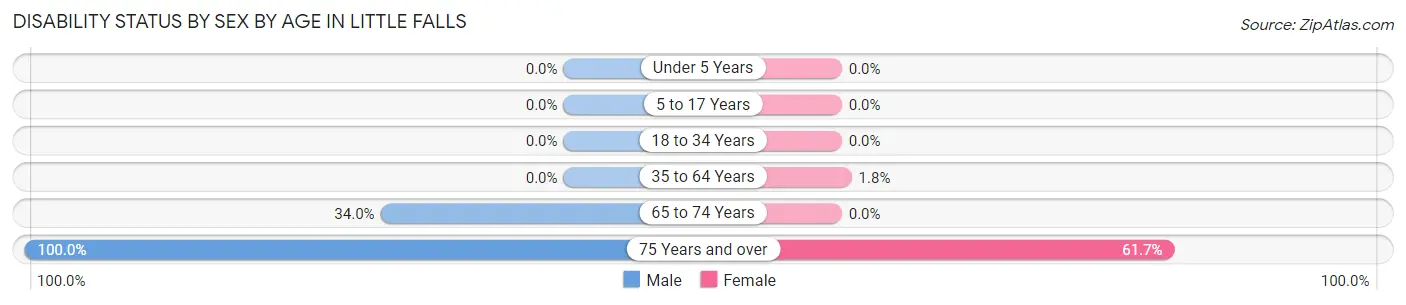
| Age Bracket | Male | Female |
| Under 5 Years | 0 (0.0%) | 0 (0.0%) |
| 5 to 17 Years | 0 (0.0%) | 0 (0.0%) |
| 18 to 34 Years | 0 (0.0%) | 0 (0.0%) |
| 35 to 64 Years | 0 (0.0%) | 3 (1.8%) |
| 65 to 74 Years | 18 (34.0%) | 0 (0.0%) |
| 75 Years and over | 13 (100.0%) | 50 (61.7%) |
Disability Class by Sex by Age in Little Falls
Disability Class: Hearing Difficulty
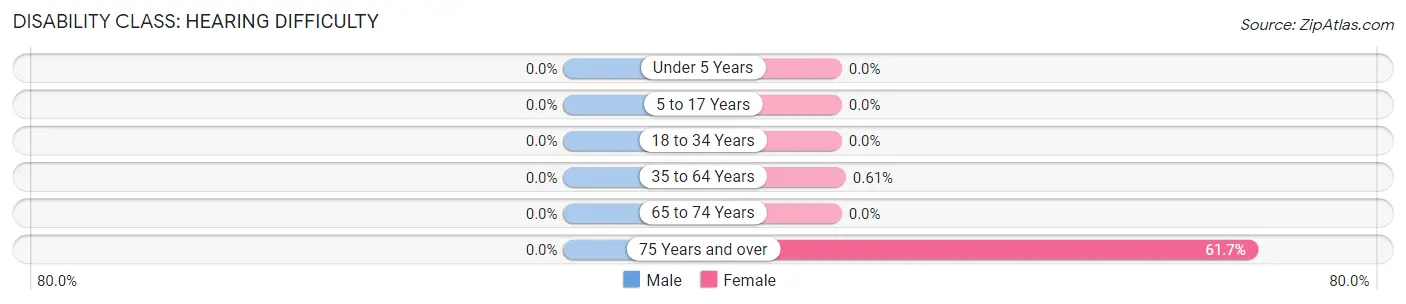
| Age Bracket | Male | Female |
| Under 5 Years | 0 (0.0%) | 0 (0.0%) |
| 5 to 17 Years | 0 (0.0%) | 0 (0.0%) |
| 18 to 34 Years | 0 (0.0%) | 0 (0.0%) |
| 35 to 64 Years | 0 (0.0%) | 1 (0.6%) |
| 65 to 74 Years | 0 (0.0%) | 0 (0.0%) |
| 75 Years and over | 0 (0.0%) | 50 (61.7%) |
Disability Class: Vision Difficulty
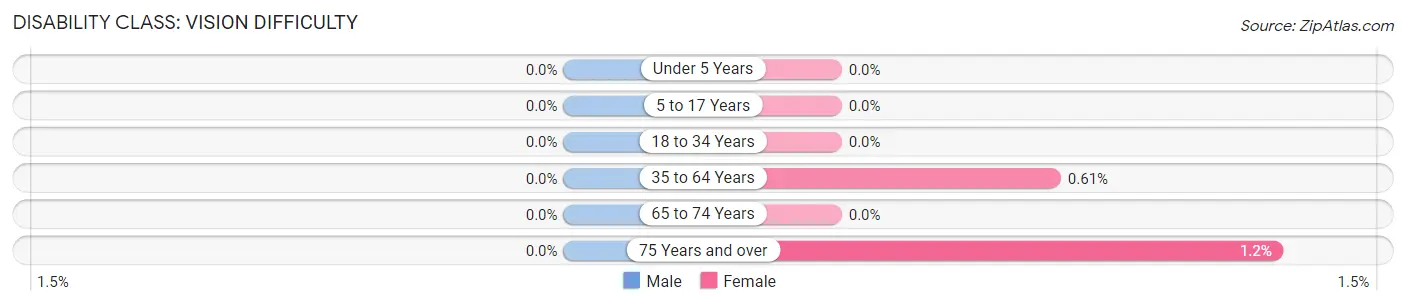
| Age Bracket | Male | Female |
| Under 5 Years | 0 (0.0%) | 0 (0.0%) |
| 5 to 17 Years | 0 (0.0%) | 0 (0.0%) |
| 18 to 34 Years | 0 (0.0%) | 0 (0.0%) |
| 35 to 64 Years | 0 (0.0%) | 1 (0.6%) |
| 65 to 74 Years | 0 (0.0%) | 0 (0.0%) |
| 75 Years and over | 0 (0.0%) | 1 (1.2%) |
Disability Class: Cognitive Difficulty
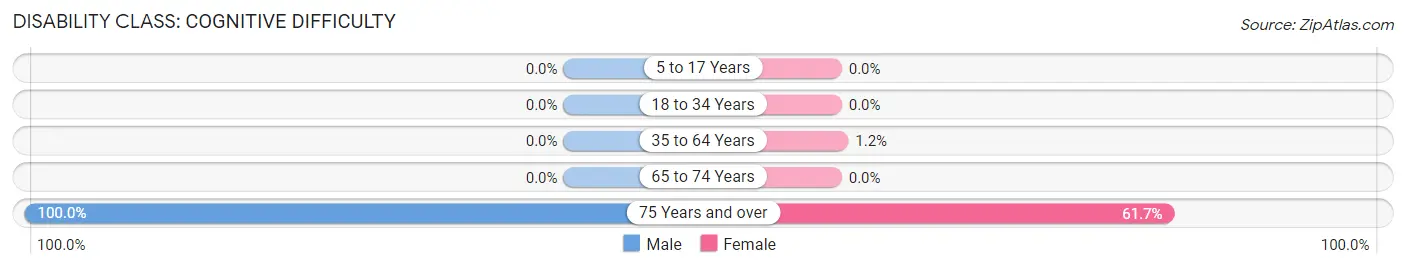
| Age Bracket | Male | Female |
| 5 to 17 Years | 0 (0.0%) | 0 (0.0%) |
| 18 to 34 Years | 0 (0.0%) | 0 (0.0%) |
| 35 to 64 Years | 0 (0.0%) | 2 (1.2%) |
| 65 to 74 Years | 0 (0.0%) | 0 (0.0%) |
| 75 Years and over | 13 (100.0%) | 50 (61.7%) |
Disability Class: Ambulatory Difficulty
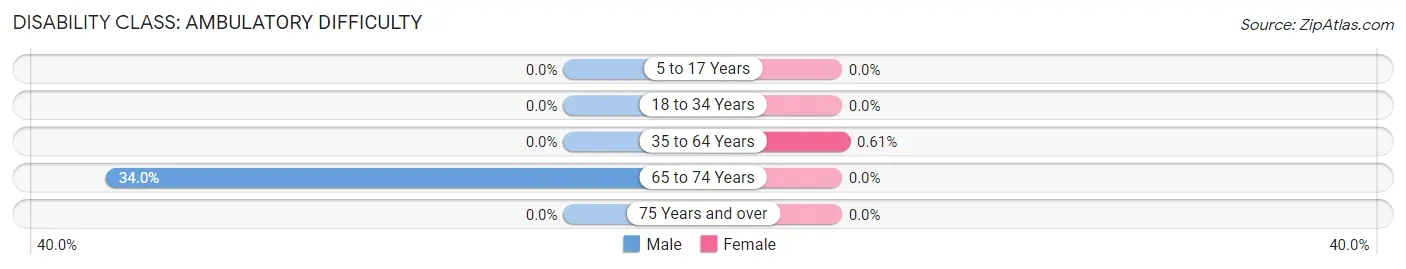
| Age Bracket | Male | Female |
| 5 to 17 Years | 0 (0.0%) | 0 (0.0%) |
| 18 to 34 Years | 0 (0.0%) | 0 (0.0%) |
| 35 to 64 Years | 0 (0.0%) | 1 (0.6%) |
| 65 to 74 Years | 18 (34.0%) | 0 (0.0%) |
| 75 Years and over | 0 (0.0%) | 0 (0.0%) |
Disability Class: Self-Care Difficulty
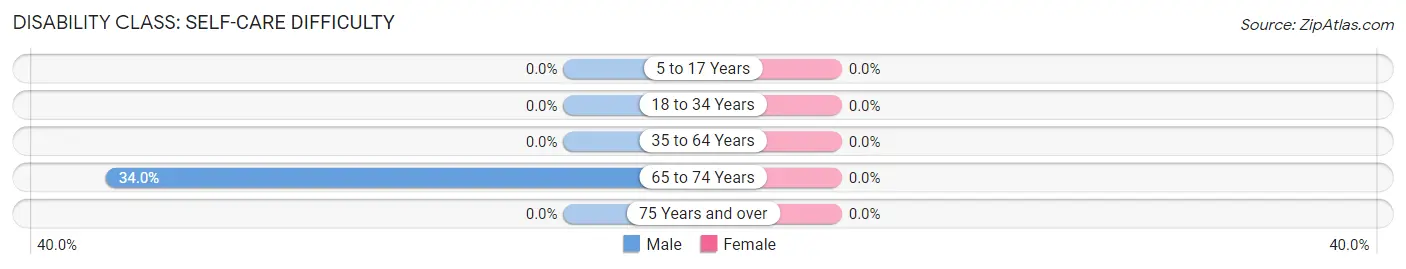
| Age Bracket | Male | Female |
| 5 to 17 Years | 0 (0.0%) | 0 (0.0%) |
| 18 to 34 Years | 0 (0.0%) | 0 (0.0%) |
| 35 to 64 Years | 0 (0.0%) | 0 (0.0%) |
| 65 to 74 Years | 18 (34.0%) | 0 (0.0%) |
| 75 Years and over | 0 (0.0%) | 0 (0.0%) |
Technology Access in Little Falls
Computing Device Access in Little Falls
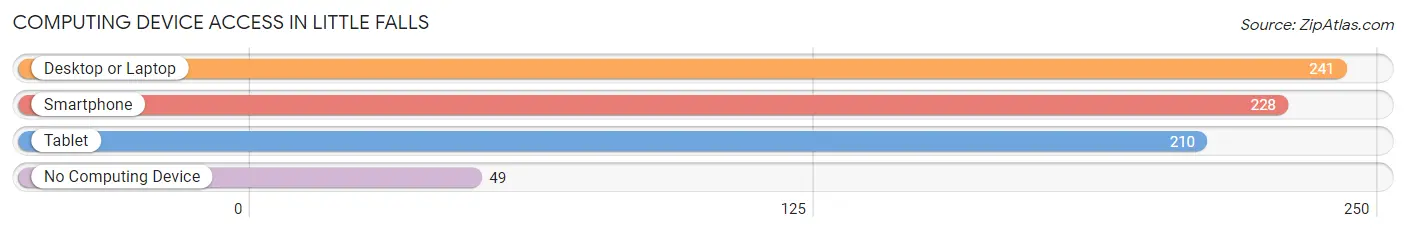
| Device Type | # Households | % Households |
| Desktop or Laptop | 241 | 83.1% |
| Smartphone | 228 | 78.6% |
| Tablet | 210 | 72.4% |
| No Computing Device | 49 | 16.9% |
| Total | 290 | 100.0% |
Internet Access in Little Falls
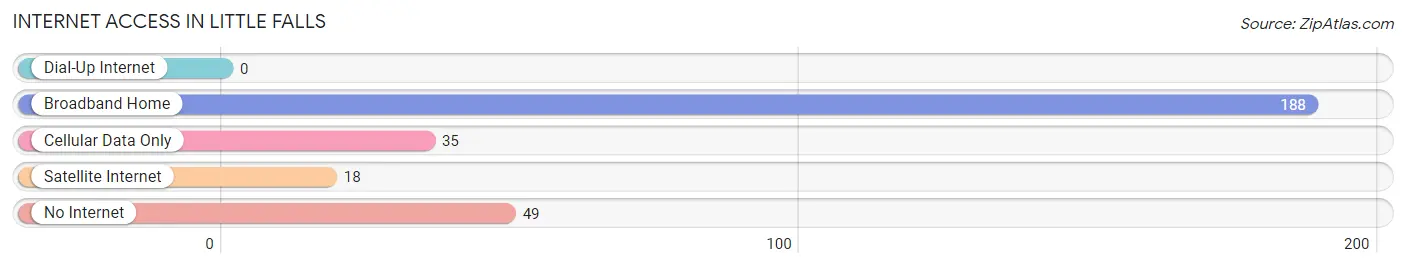
| Internet Type | # Households | % Households |
| Dial-Up Internet | 0 | 0.0% |
| Broadband Home | 188 | 64.8% |
| Cellular Data Only | 35 | 12.1% |
| Satellite Internet | 18 | 6.2% |
| No Internet | 49 | 16.9% |
| Total | 290 | 100.0% |
Little Falls Summary
History
Little Falls, Maine is a small town located in the western part of the state, in the foothills of the White Mountains. It was first settled in 1790 by a group of settlers from Massachusetts, led by Captain John Little. The town was originally known as Little's Falls, but the name was changed to Little Falls in 1820.
The town was an important stop on the stagecoach route between Portland and Bangor, and was also a major stop on the Maine Central Railroad. The railroad brought tourists to the area, and the town became a popular summer destination. The town was also home to several mills, including a paper mill, a sawmill, and a gristmill.
The town was incorporated in 1820, and the first town meeting was held in 1821. The town has remained relatively small, with a population of just over 1,000 people in 2020.
Geography
Little Falls is located in western Maine, in the foothills of the White Mountains. It is bordered by the towns of Rangeley to the north, Eustis to the east, and Kingfield to the south. The town is situated on the banks of the Dead River, which flows through the center of town.
The town is located in a rural area, and is surrounded by forests and mountains. The highest point in the town is the summit of Little Falls Mountain, which rises to an elevation of 1,845 feet.
Economy
The economy of Little Falls is largely based on tourism and outdoor recreation. The town is home to several ski resorts, including Saddleback Mountain and Big Squaw Mountain. The town is also home to several lakes, including Flagstaff Lake and Rangeley Lake, which are popular for fishing, boating, and swimming.
The town is also home to several small businesses, including restaurants, shops, and lodging. The town is also home to several small manufacturing companies, including a paper mill and a sawmill.
Demographics
As of the 2010 census, the population of Little Falls was 1,068. The racial makeup of the town was 97.3% White, 0.7% African American, 0.3% Native American, 0.2% Asian, 0.1% Pacific Islander, 0.2% from other races, and 1.3% from two or more races. Hispanic or Latino of any race were 0.7% of the population.
The median income for a household in the town was $37,500, and the median income for a family was $45,000. The per capita income for the town was $20,845. About 11.2% of families and 14.2% of the population were below the poverty line, including 18.2% of those under age 18 and 8.3% of those age 65 or over.
Common Questions
What is Per Capita Income in Little Falls?
Per Capita income in Little Falls is $68,523.
What is the Median Family Income in Little Falls?
Median Family Income in Little Falls is $179,531.
What is the Median Household income in Little Falls?
Median Household Income in Little Falls is $123,611.
What is Income or Wage Gap in Little Falls?
Income or Wage Gap in Little Falls is 12.6%.
Women in Little Falls earn 87.4 cents for every dollar earned by a man.
What is Inequality or Gini Index in Little Falls?
Inequality or Gini Index in Little Falls is 0.56.
What is the Total Population of Little Falls?
Total Population of Little Falls is 891.
What is the Total Male Population of Little Falls?
Total Male Population of Little Falls is 346.
What is the Total Female Population of Little Falls?
Total Female Population of Little Falls is 545.
What is the Ratio of Males per 100 Females in Little Falls?
There are 63.49 Males per 100 Females in Little Falls.
What is the Ratio of Females per 100 Males in Little Falls?
There are 157.51 Females per 100 Males in Little Falls.
What is the Median Population Age in Little Falls?
Median Population Age in Little Falls is 35.3 Years.
What is the Average Family Size in Little Falls
Average Family Size in Little Falls is 3.8 People.
What is the Average Household Size in Little Falls
Average Household Size in Little Falls is 3.1 People.
How Large is the Labor Force in Little Falls?
There are 557 People in the Labor Forcein in Little Falls.
What is the Percentage of People in the Labor Force in Little Falls?
77.4% of People are in the Labor Force in Little Falls.