Hillandale, MD Map & Demographics
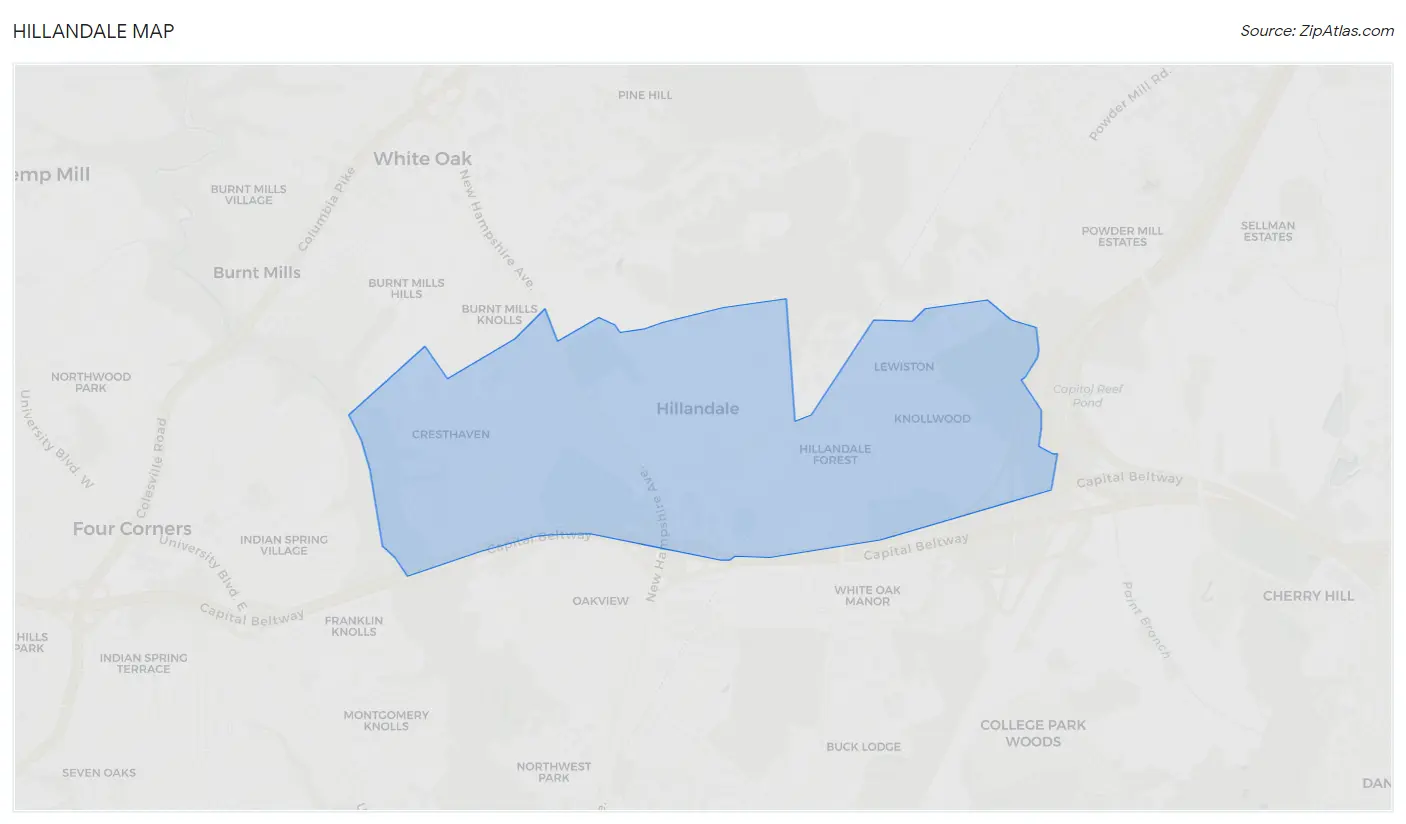
Hillandale Map
Hillandale Overview
$52,880
PER CAPITA INCOME
$151,912
AVG FAMILY INCOME
$144,018
AVG HOUSEHOLD INCOME
28.8%
WAGE / INCOME GAP [ % ]
71.2¢/ $1
WAGE / INCOME GAP [ $ ]
0.33
INEQUALITY / GINI INDEX
5,002
TOTAL POPULATION
2,506
MALE POPULATION
2,496
FEMALE POPULATION
100.40
MALES / 100 FEMALES
99.60
FEMALES / 100 MALES
39.0
MEDIAN AGE
3.7
AVG FAMILY SIZE
3.3
AVG HOUSEHOLD SIZE
3,073
LABOR FORCE [ PEOPLE ]
74.3%
PERCENT IN LABOR FORCE
7.9%
UNEMPLOYMENT RATE
Income in Hillandale
Income Overview in Hillandale
Per Capita Income in Hillandale is $52,880, while median incomes of families and households are $151,912 and $144,018 respectively.
| Characteristic | Number | Measure |
| Per Capita Income | 5,002 | $52,880 |
| Median Family Income | 1,172 | $151,912 |
| Mean Family Income | 1,172 | $188,164 |
| Median Household Income | 1,515 | $144,018 |
| Mean Household Income | 1,515 | $171,811 |
| Income Deficit | 1,172 | $0 |
| Wage / Income Gap (%) | 5,002 | 28.78% |
| Wage / Income Gap ($) | 5,002 | 71.22¢ per $1 |
| Gini / Inequality Index | 5,002 | 0.33 |
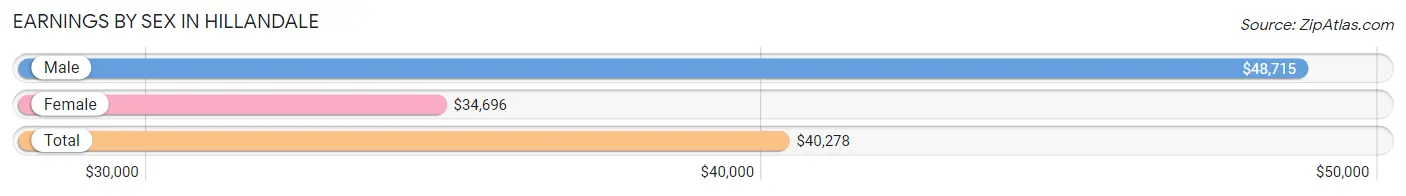
Earnings by Sex in Hillandale
Average Earnings in Hillandale are $40,278, $48,715 for men and $34,696 for women, a difference of 28.8%.
| Sex | Number | Average Earnings |
| Male | 1,593 (52.5%) | $48,715 |
| Female | 1,443 (47.5%) | $34,696 |
| Total | 3,036 (100.0%) | $40,278 |
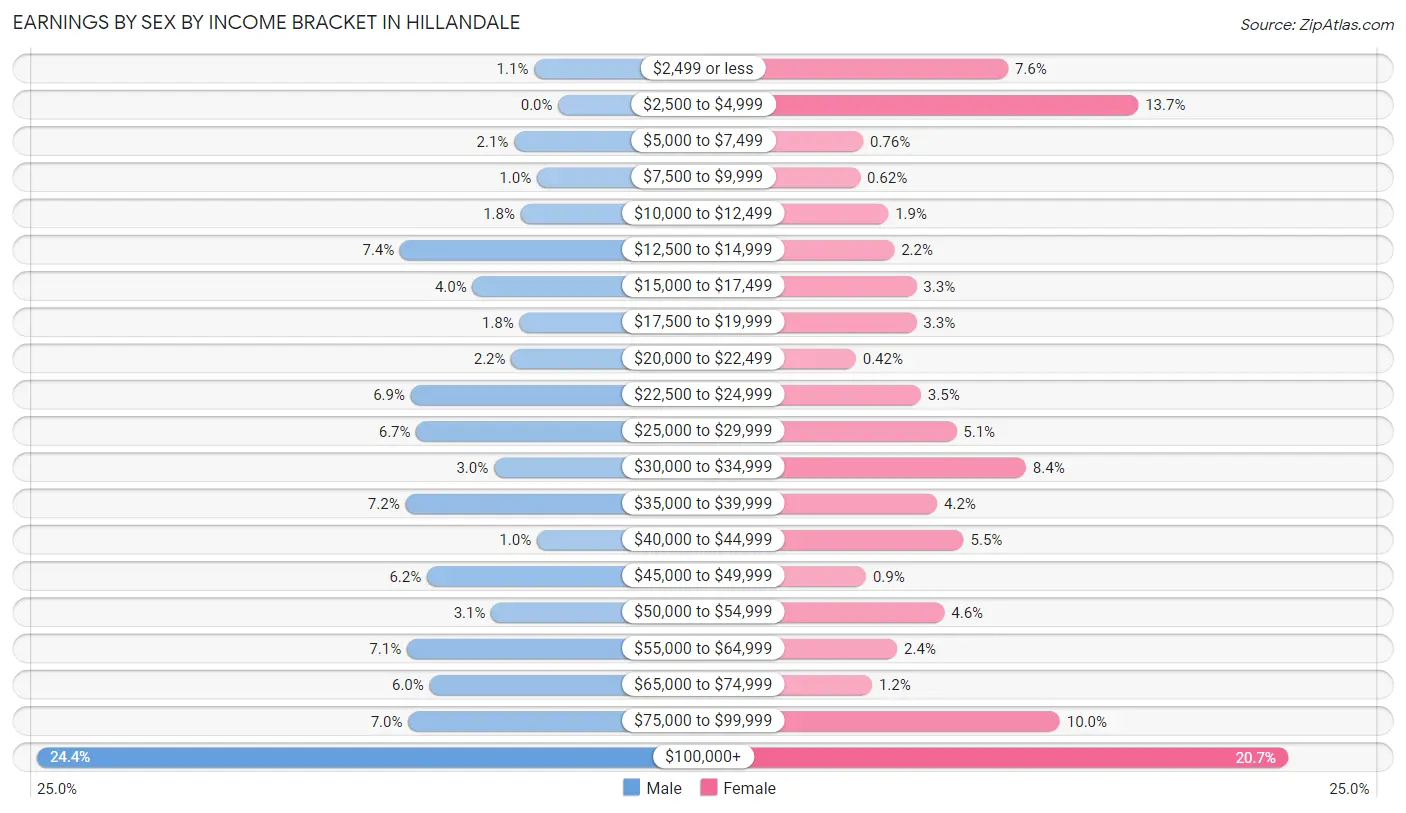
Earnings by Sex by Income Bracket in Hillandale
The most common earnings brackets in Hillandale are $100,000+ for men (389 | 24.4%) and $100,000+ for women (298 | 20.6%).
| Income | Male | Female |
| $2,499 or less | 18 (1.1%) | 109 (7.5%) |
| $2,500 to $4,999 | 0 (0.0%) | 197 (13.7%) |
| $5,000 to $7,499 | 33 (2.1%) | 11 (0.8%) |
| $7,500 to $9,999 | 16 (1.0%) | 9 (0.6%) |
| $10,000 to $12,499 | 28 (1.8%) | 28 (1.9%) |
| $12,500 to $14,999 | 118 (7.4%) | 32 (2.2%) |
| $15,000 to $17,499 | 64 (4.0%) | 47 (3.3%) |
| $17,500 to $19,999 | 29 (1.8%) | 47 (3.3%) |
| $20,000 to $22,499 | 35 (2.2%) | 6 (0.4%) |
| $22,500 to $24,999 | 110 (6.9%) | 50 (3.5%) |
| $25,000 to $29,999 | 106 (6.7%) | 74 (5.1%) |
| $30,000 to $34,999 | 48 (3.0%) | 121 (8.4%) |
| $35,000 to $39,999 | 114 (7.2%) | 61 (4.2%) |
| $40,000 to $44,999 | 16 (1.0%) | 79 (5.5%) |
| $45,000 to $49,999 | 98 (6.1%) | 13 (0.9%) |
| $50,000 to $54,999 | 50 (3.1%) | 66 (4.6%) |
| $55,000 to $64,999 | 113 (7.1%) | 34 (2.4%) |
| $65,000 to $74,999 | 96 (6.0%) | 17 (1.2%) |
| $75,000 to $99,999 | 112 (7.0%) | 144 (10.0%) |
| $100,000+ | 389 (24.4%) | 298 (20.6%) |
| Total | 1,593 (100.0%) | 1,443 (100.0%) |
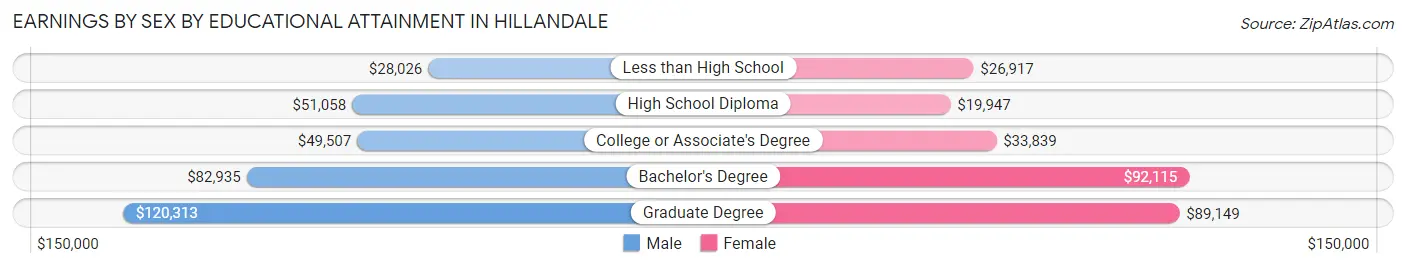
Earnings by Sex by Educational Attainment in Hillandale
Average earnings in Hillandale are $55,511 for men and $43,098 for women, a difference of 22.4%. Men with an educational attainment of graduate degree enjoy the highest average annual earnings of $120,313, while those with less than high school education earn the least with $28,026. Women with an educational attainment of bachelor's degree earn the most with the average annual earnings of $92,115, while those with high school diploma education have the smallest earnings of $19,947.
| Educational Attainment | Male Income | Female Income |
| Less than High School | $28,026 | $26,917 |
| High School Diploma | $51,058 | $19,947 |
| College or Associate's Degree | $49,507 | $33,839 |
| Bachelor's Degree | $82,935 | $92,115 |
| Graduate Degree | $120,313 | $89,149 |
| Total | $55,511 | $43,098 |
Family Income in Hillandale
Family Income Brackets in Hillandale
According to the Hillandale family income data, there are 499 families falling into the $200,000+ income range, which is the most common income bracket and makes up 42.6% of all families.
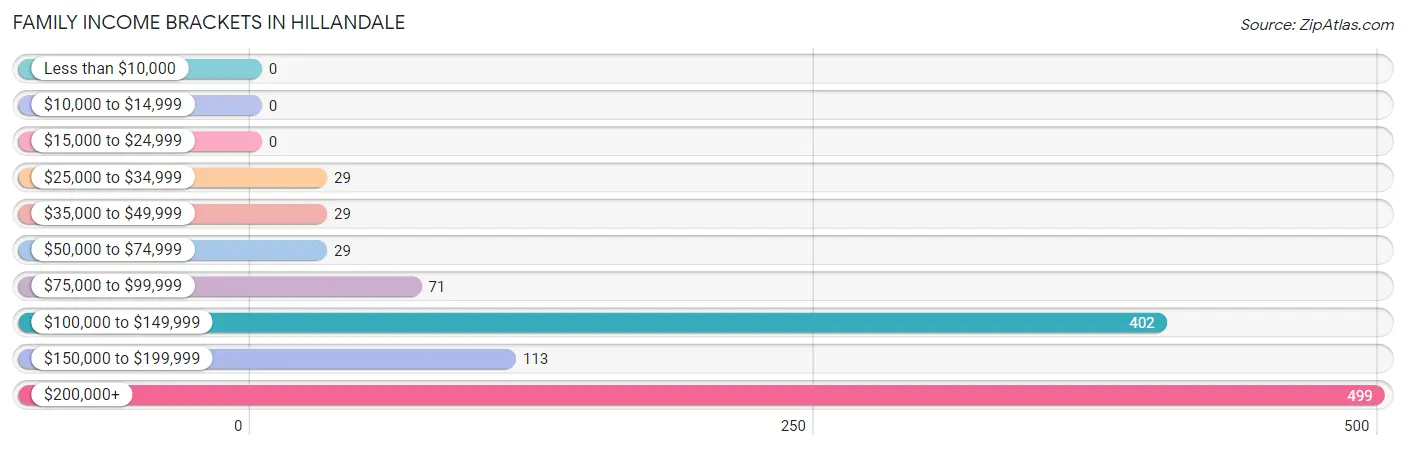
| Income Bracket | # Families | % Families |
| Less than $10,000 | 0 | 0.0% |
| $10,000 to $14,999 | 0 | 0.0% |
| $15,000 to $24,999 | 0 | 0.0% |
| $25,000 to $34,999 | 29 | 2.5% |
| $35,000 to $49,999 | 29 | 2.5% |
| $50,000 to $74,999 | 29 | 2.5% |
| $75,000 to $99,999 | 71 | 6.1% |
| $100,000 to $149,999 | 402 | 34.3% |
| $150,000 to $199,999 | 113 | 9.6% |
| $200,000+ | 499 | 42.6% |
Family Income by Famaliy Size in Hillandale
6-person families (87 | 7.4%) account for the highest median family income in Hillandale with $250,001 per family, while 2-person families (416 | 35.5%) have the highest median income of $83,672 per family member.
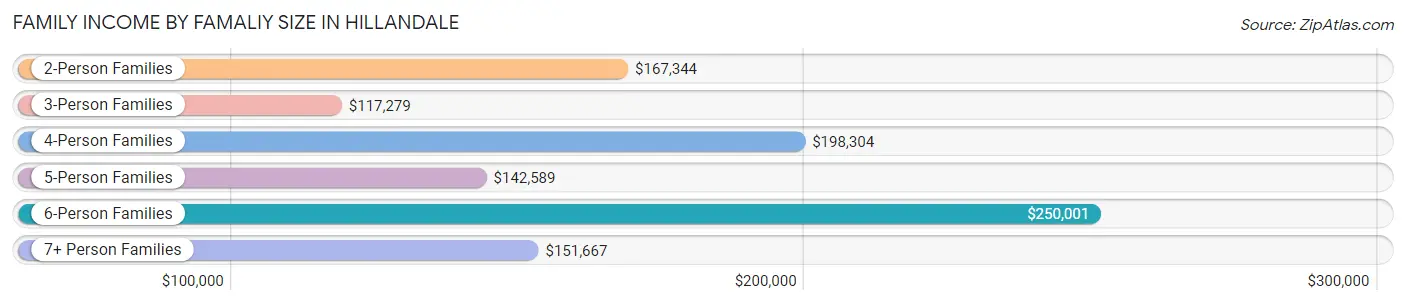
| Income Bracket | # Families | Median Income |
| 2-Person Families | 416 (35.5%) | $167,344 |
| 3-Person Families | 251 (21.4%) | $117,279 |
| 4-Person Families | 221 (18.9%) | $198,304 |
| 5-Person Families | 141 (12.0%) | $142,589 |
| 6-Person Families | 87 (7.4%) | $250,001 |
| 7+ Person Families | 56 (4.8%) | $151,667 |
| Total | 1,172 (100.0%) | $151,912 |
Family Income by Number of Earners in Hillandale
The median family income in Hillandale is $151,912, with families comprising 2 earners (428) having the highest median family income of $200,938, while families with no earners (149) have the lowest median family income of $109,114, accounting for 36.5% and 12.7% of families, respectively.
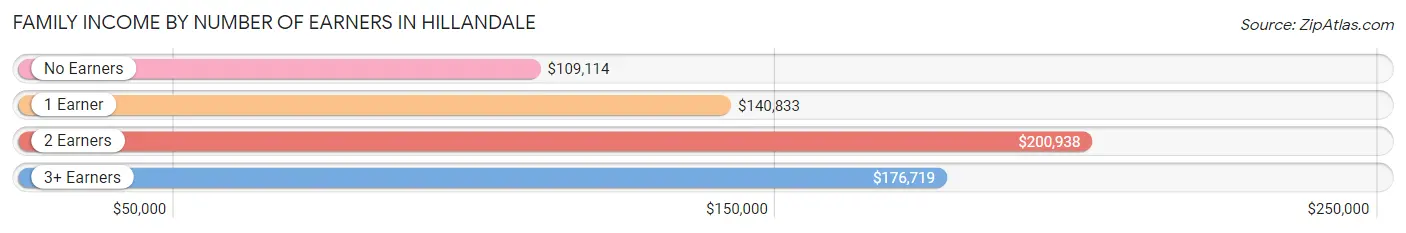
| Number of Earners | # Families | Median Income |
| No Earners | 149 (12.7%) | $109,114 |
| 1 Earner | 250 (21.3%) | $140,833 |
| 2 Earners | 428 (36.5%) | $200,938 |
| 3+ Earners | 345 (29.4%) | $176,719 |
| Total | 1,172 (100.0%) | $151,912 |
Household Income in Hillandale
Household Income Brackets in Hillandale
With 547 households falling in the category, the $200,000+ income range is the most frequent in Hillandale, accounting for 36.1% of all households. In contrast, only 3 households (0.2%) fall into the less than $10,000 income bracket, making it the least populous group.

| Income Bracket | # Households | % Households |
| Less than $10,000 | 3 | 0.2% |
| $10,000 to $14,999 | 33 | 2.2% |
| $15,000 to $24,999 | 17 | 1.1% |
| $25,000 to $34,999 | 29 | 1.9% |
| $35,000 to $49,999 | 61 | 4.0% |
| $50,000 to $74,999 | 133 | 8.8% |
| $75,000 to $99,999 | 70 | 4.6% |
| $100,000 to $149,999 | 444 | 29.3% |
| $150,000 to $199,999 | 177 | 11.7% |
| $200,000+ | 547 | 36.1% |
Household Income by Householder Age in Hillandale
The median household income in Hillandale is $144,018, with the highest median household income of $192,031 found in the 45 to 64 years age bracket for the primary householder. A total of 638 households (42.1%) fall into this category.
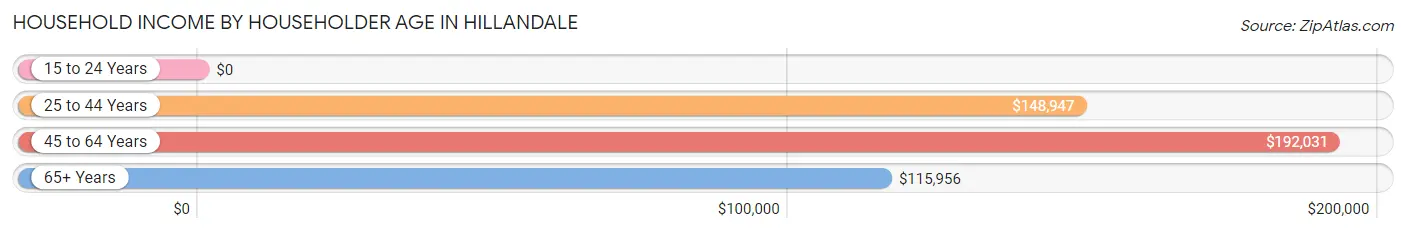
| Income Bracket | # Households | Median Income |
| 15 to 24 Years | 0 (0.0%) | $0 |
| 25 to 44 Years | 392 (25.9%) | $148,947 |
| 45 to 64 Years | 638 (42.1%) | $192,031 |
| 65+ Years | 485 (32.0%) | $115,956 |
| Total | 1,515 (100.0%) | $144,018 |
Poverty in Hillandale
Income Below Poverty by Sex and Age in Hillandale
With 7.0% poverty level for males and 3.4% for females among the residents of Hillandale, 15 year old males and under 5 year old females are the most vulnerable to poverty, with 30 males (58.8%) and 35 females (16.3%) in their respective age groups living below the poverty level.
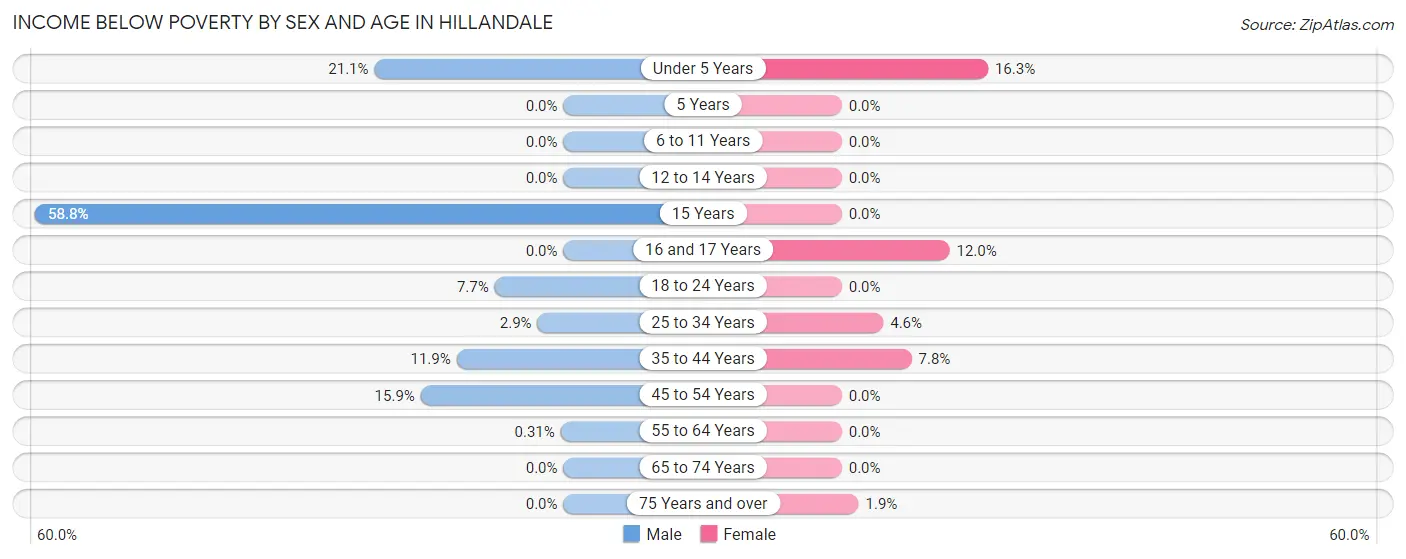
| Age Bracket | Male | Female |
| Under 5 Years | 36 (21.0%) | 35 (16.3%) |
| 5 Years | 0 (0.0%) | 0 (0.0%) |
| 6 to 11 Years | 0 (0.0%) | 0 (0.0%) |
| 12 to 14 Years | 0 (0.0%) | 0 (0.0%) |
| 15 Years | 30 (58.8%) | 0 (0.0%) |
| 16 and 17 Years | 0 (0.0%) | 9 (12.0%) |
| 18 to 24 Years | 18 (7.7%) | 0 (0.0%) |
| 25 to 34 Years | 11 (2.9%) | 14 (4.6%) |
| 35 to 44 Years | 29 (11.9%) | 23 (7.8%) |
| 45 to 54 Years | 51 (15.9%) | 0 (0.0%) |
| 55 to 64 Years | 1 (0.3%) | 0 (0.0%) |
| 65 to 74 Years | 0 (0.0%) | 0 (0.0%) |
| 75 Years and over | 0 (0.0%) | 4 (1.9%) |
| Total | 176 (7.0%) | 85 (3.4%) |
Income Above Poverty by Sex and Age in Hillandale
According to the poverty statistics in Hillandale, males aged 5 years and females aged 5 years are the age groups that are most secure financially, with 100.0% of males and 100.0% of females in these age groups living above the poverty line.
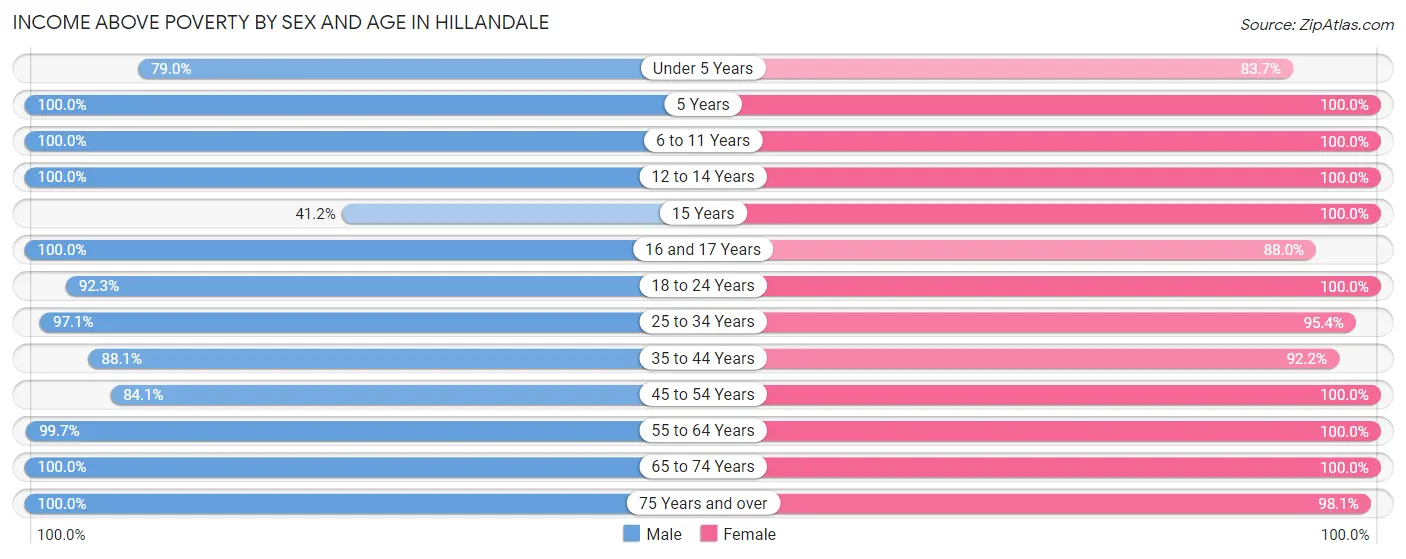
| Age Bracket | Male | Female |
| Under 5 Years | 135 (78.9%) | 180 (83.7%) |
| 5 Years | 39 (100.0%) | 23 (100.0%) |
| 6 to 11 Years | 126 (100.0%) | 127 (100.0%) |
| 12 to 14 Years | 21 (100.0%) | 72 (100.0%) |
| 15 Years | 21 (41.2%) | 16 (100.0%) |
| 16 and 17 Years | 44 (100.0%) | 66 (88.0%) |
| 18 to 24 Years | 217 (92.3%) | 258 (100.0%) |
| 25 to 34 Years | 369 (97.1%) | 289 (95.4%) |
| 35 to 44 Years | 215 (88.1%) | 273 (92.2%) |
| 45 to 54 Years | 270 (84.1%) | 312 (100.0%) |
| 55 to 64 Years | 321 (99.7%) | 286 (100.0%) |
| 65 to 74 Years | 393 (100.0%) | 298 (100.0%) |
| 75 Years and over | 154 (100.0%) | 210 (98.1%) |
| Total | 2,325 (93.0%) | 2,410 (96.6%) |
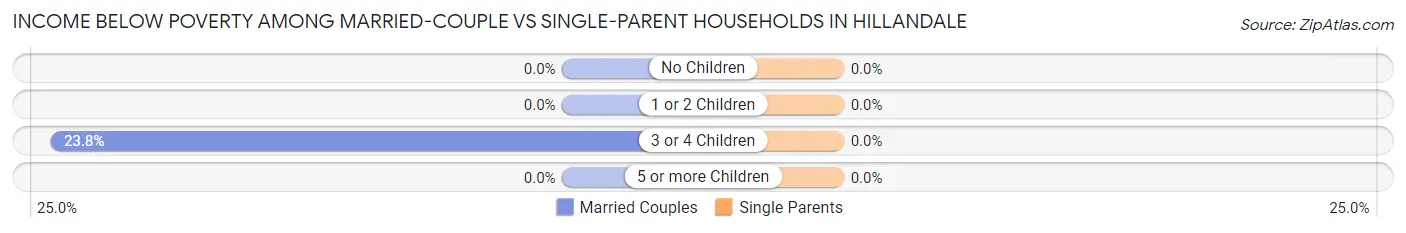
Income Below Poverty Among Married-Couple Families in Hillandale
The poverty statistics for married-couple families in Hillandale show that 2.8% or 29 of the total 1,041 families live below the poverty line. Families with 3 or 4 children have the highest poverty rate of 23.8%, comprising of 29 families. On the other hand, families with no children have the lowest poverty rate of 0.0%, which includes 0 families.
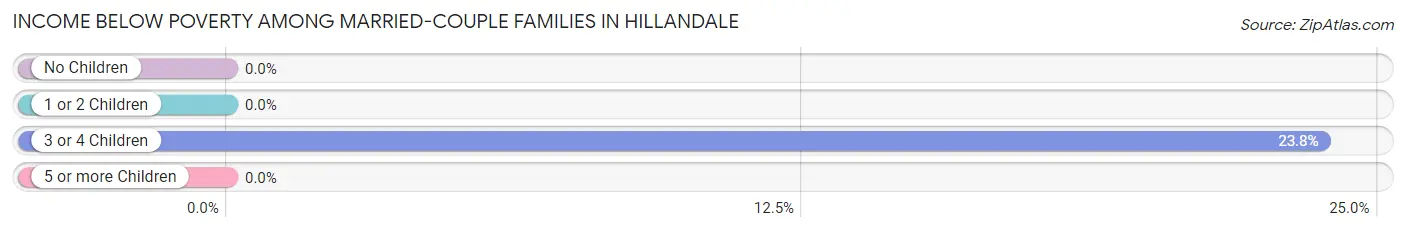
| Children | Above Poverty | Below Poverty |
| No Children | 647 (100.0%) | 0 (0.0%) |
| 1 or 2 Children | 272 (100.0%) | 0 (0.0%) |
| 3 or 4 Children | 93 (76.2%) | 29 (23.8%) |
| 5 or more Children | 0 (0.0%) | 0 (0.0%) |
| Total | 1,012 (97.2%) | 29 (2.8%) |
Income Below Poverty Among Single-Parent Households in Hillandale
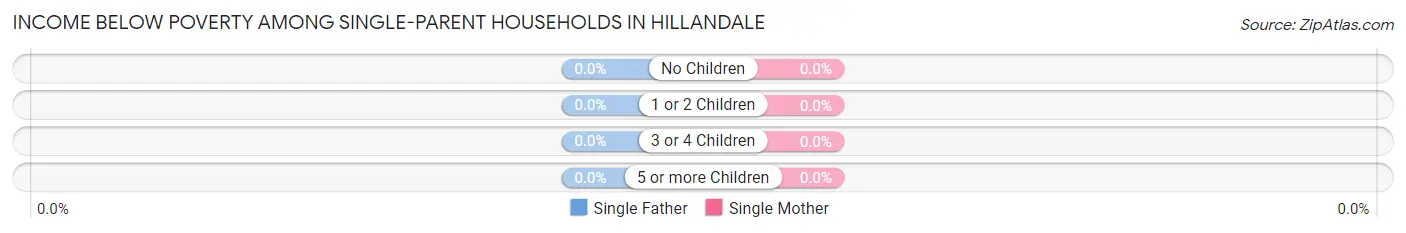
| Children | Single Father | Single Mother |
| No Children | 0 (0.0%) | 0 (0.0%) |
| 1 or 2 Children | 0 (0.0%) | 0 (0.0%) |
| 3 or 4 Children | 0 (0.0%) | 0 (0.0%) |
| 5 or more Children | 0 (0.0%) | 0 (0.0%) |
| Total | 0 (0.0%) | 0 (0.0%) |
Income Below Poverty Among Married-Couple vs Single-Parent Households in Hillandale
| Children | Married-Couple Families | Single-Parent Households |
| No Children | 0 (0.0%) | 0 (0.0%) |
| 1 or 2 Children | 0 (0.0%) | 0 (0.0%) |
| 3 or 4 Children | 29 (23.8%) | 0 (0.0%) |
| 5 or more Children | 0 (0.0%) | 0 (0.0%) |
| Total | 29 (2.8%) | 0 (0.0%) |
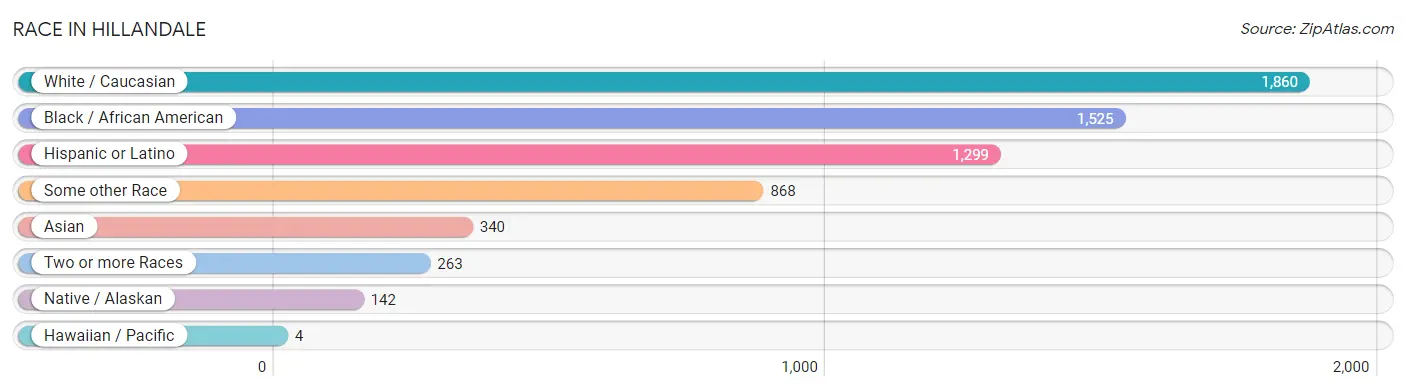
Race in Hillandale
The most populous races in Hillandale are White / Caucasian (1,860 | 37.2%), Black / African American (1,525 | 30.5%), and Hispanic or Latino (1,299 | 26.0%).
| Race | # Population | % Population |
| Asian | 340 | 6.8% |
| Black / African American | 1,525 | 30.5% |
| Hawaiian / Pacific | 4 | 0.1% |
| Hispanic or Latino | 1,299 | 26.0% |
| Native / Alaskan | 142 | 2.8% |
| White / Caucasian | 1,860 | 37.2% |
| Two or more Races | 263 | 5.3% |
| Some other Race | 868 | 17.3% |
| Total | 5,002 | 100.0% |
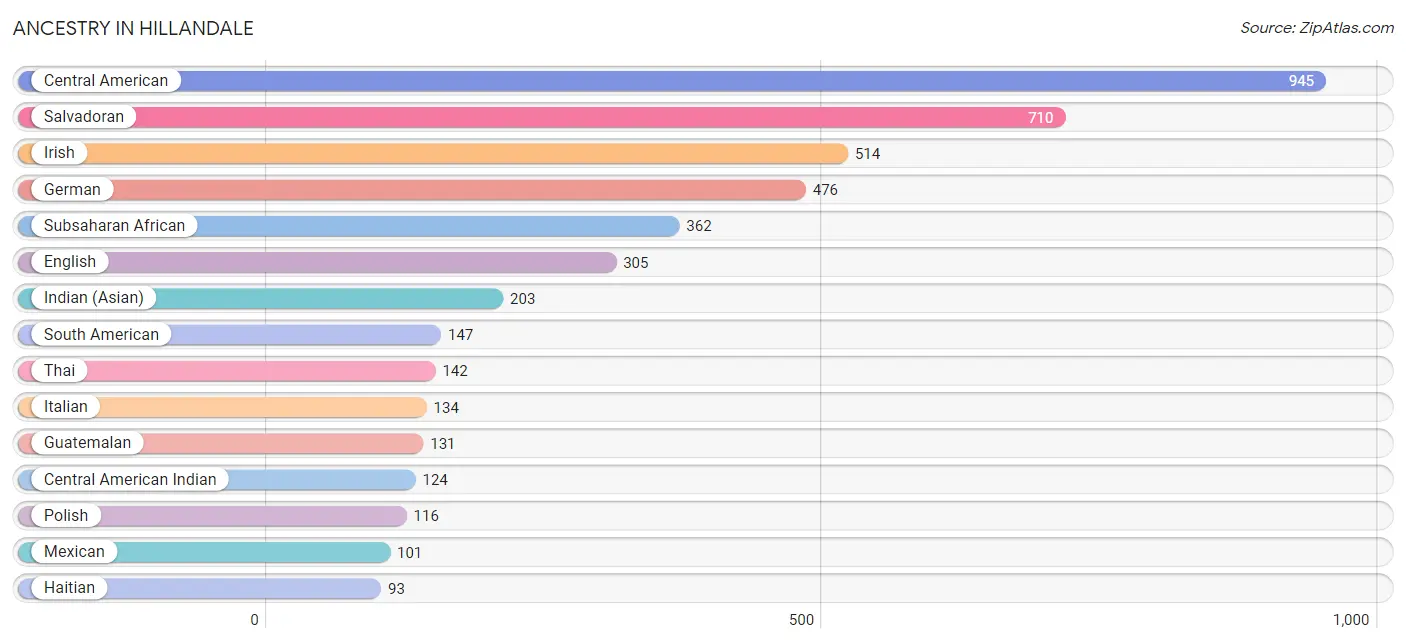
Ancestry in Hillandale
The most populous ancestries reported in Hillandale are Central American (945 | 18.9%), Salvadoran (710 | 14.2%), Irish (514 | 10.3%), German (476 | 9.5%), and Subsaharan African (362 | 7.2%), together accounting for 60.1% of all Hillandale residents.
| Ancestry | # Population | % Population |
| Afghan | 6 | 0.1% |
| American | 61 | 1.2% |
| Arab | 4 | 0.1% |
| Argentinean | 57 | 1.1% |
| Austrian | 19 | 0.4% |
| Bhutanese | 28 | 0.6% |
| British | 22 | 0.4% |
| Burmese | 7 | 0.1% |
| Central American | 945 | 18.9% |
| Central American Indian | 124 | 2.5% |
| Colombian | 16 | 0.3% |
| Cuban | 16 | 0.3% |
| Czech | 8 | 0.2% |
| Dominican | 61 | 1.2% |
| Dutch | 9 | 0.2% |
| Egyptian | 4 | 0.1% |
| English | 305 | 6.1% |
| Ethiopian | 41 | 0.8% |
| European | 43 | 0.9% |
| French | 65 | 1.3% |
| French Canadian | 7 | 0.1% |
| German | 476 | 9.5% |
| Ghanaian | 28 | 0.6% |
| Greek | 65 | 1.3% |
| Guatemalan | 131 | 2.6% |
| Guyanese | 24 | 0.5% |
| Haitian | 93 | 1.9% |
| Honduran | 79 | 1.6% |
| Hungarian | 70 | 1.4% |
| Indian (Asian) | 203 | 4.1% |
| Iranian | 7 | 0.1% |
| Irish | 514 | 10.3% |
| Italian | 134 | 2.7% |
| Jamaican | 57 | 1.1% |
| Malaysian | 15 | 0.3% |
| Mexican | 101 | 2.0% |
| Nicaraguan | 25 | 0.5% |
| Nigerian | 55 | 1.1% |
| Northern European | 10 | 0.2% |
| Norwegian | 32 | 0.6% |
| Pakistani | 52 | 1.0% |
| Peruvian | 56 | 1.1% |
| Polish | 116 | 2.3% |
| Russian | 82 | 1.6% |
| Salvadoran | 710 | 14.2% |
| Scotch-Irish | 11 | 0.2% |
| Scottish | 73 | 1.5% |
| Slovene | 9 | 0.2% |
| South American | 147 | 2.9% |
| South American Indian | 49 | 1.0% |
| Subsaharan African | 362 | 7.2% |
| Swedish | 25 | 0.5% |
| Thai | 142 | 2.8% |
| Trinidadian and Tobagonian | 12 | 0.2% |
| Turkish | 6 | 0.1% |
| Ukrainian | 38 | 0.8% |
| Welsh | 27 | 0.5% |
| Yugoslavian | 33 | 0.7% | View All 58 Rows |
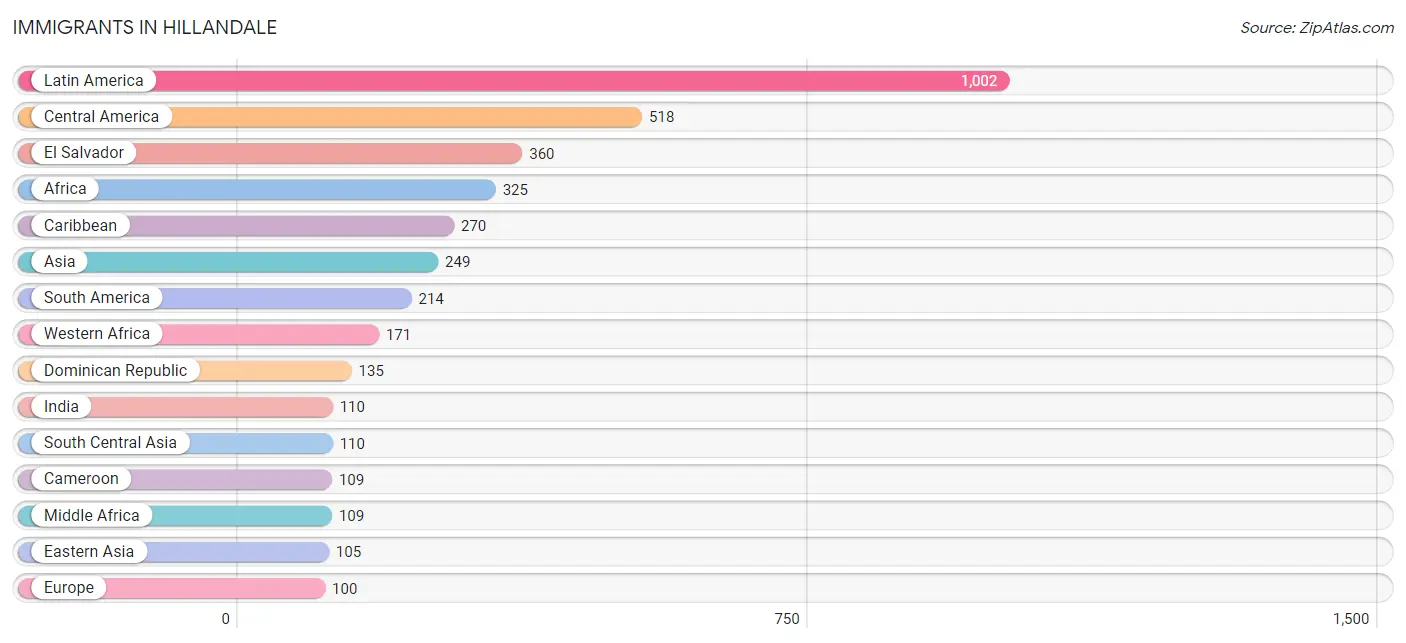
Immigrants in Hillandale
The most numerous immigrant groups reported in Hillandale came from Latin America (1,002 | 20.0%), Central America (518 | 10.4%), El Salvador (360 | 7.2%), Africa (325 | 6.5%), and Caribbean (270 | 5.4%), together accounting for 49.5% of all Hillandale residents.
| Immigration Origin | # Population | % Population |
| Africa | 325 | 6.5% |
| Argentina | 57 | 1.1% |
| Asia | 249 | 5.0% |
| Bosnia and Herzegovina | 3 | 0.1% |
| Cameroon | 109 | 2.2% |
| Canada | 38 | 0.8% |
| Caribbean | 270 | 5.4% |
| Central America | 518 | 10.4% |
| China | 98 | 2.0% |
| Colombia | 16 | 0.3% |
| Cuba | 16 | 0.3% |
| Dominican Republic | 135 | 2.7% |
| Eastern Africa | 41 | 0.8% |
| Eastern Asia | 105 | 2.1% |
| Eastern Europe | 43 | 0.9% |
| Egypt | 4 | 0.1% |
| El Salvador | 360 | 7.2% |
| Ethiopia | 41 | 0.8% |
| Europe | 100 | 2.0% |
| Germany | 10 | 0.2% |
| Ghana | 15 | 0.3% |
| Greece | 47 | 0.9% |
| Guatemala | 80 | 1.6% |
| Guyana | 95 | 1.9% |
| Haiti | 50 | 1.0% |
| Honduras | 4 | 0.1% |
| Hong Kong | 48 | 1.0% |
| Hungary | 10 | 0.2% |
| India | 110 | 2.2% |
| Jamaica | 57 | 1.1% |
| Korea | 7 | 0.1% |
| Laos | 11 | 0.2% |
| Latin America | 1,002 | 20.0% |
| Liberia | 21 | 0.4% |
| Mexico | 40 | 0.8% |
| Middle Africa | 109 | 2.2% |
| Nicaragua | 34 | 0.7% |
| Nigeria | 55 | 1.1% |
| Northern Africa | 4 | 0.1% |
| Peru | 46 | 0.9% |
| Singapore | 17 | 0.3% |
| South America | 214 | 4.3% |
| South Central Asia | 110 | 2.2% |
| South Eastern Asia | 34 | 0.7% |
| Southern Europe | 47 | 0.9% |
| Taiwan | 17 | 0.3% |
| Thailand | 6 | 0.1% |
| Trinidad and Tobago | 12 | 0.2% |
| Western Africa | 171 | 3.4% |
| Western Europe | 10 | 0.2% | View All 50 Rows |
Sex and Age in Hillandale
Sex and Age in Hillandale
The most populous age groups in Hillandale are 65 to 69 Years (223 | 8.9%) for men and 30 to 34 Years (236 | 9.5%) for women.
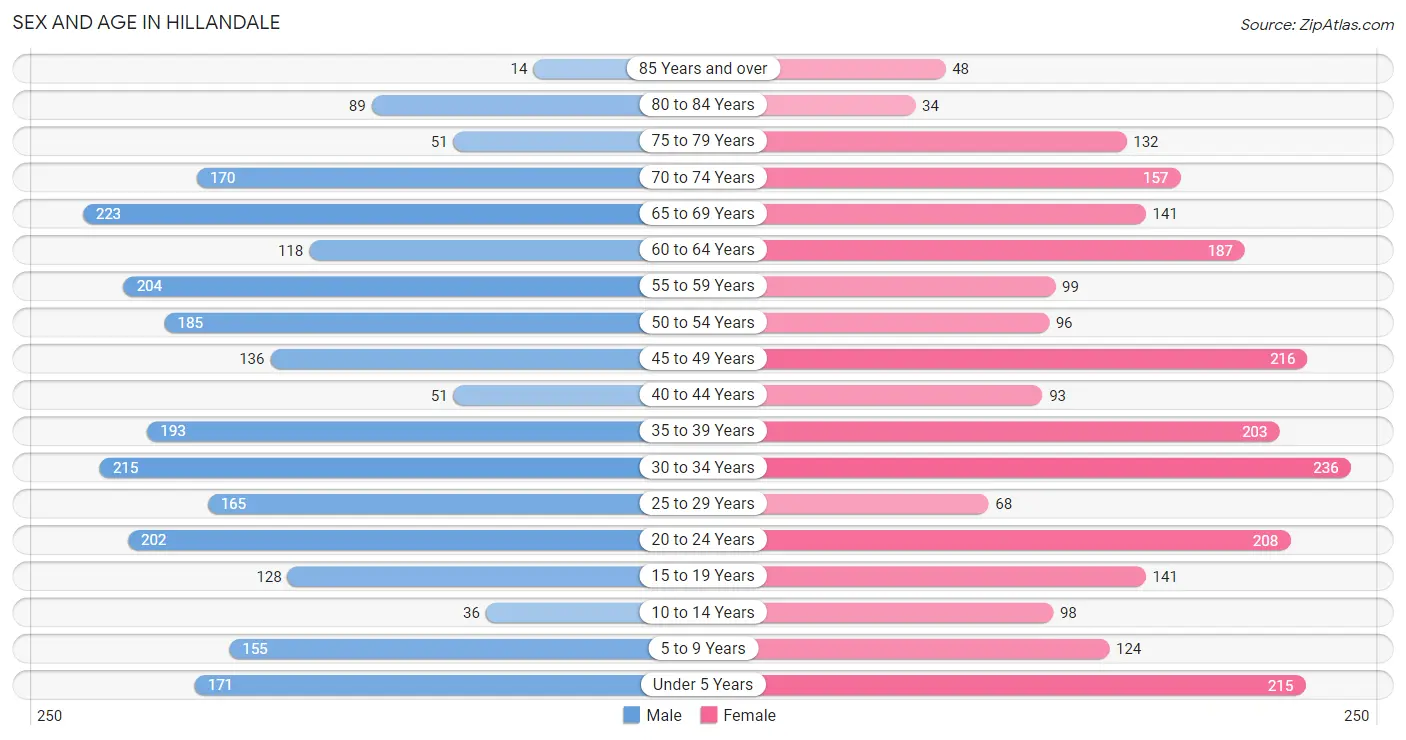
| Age Bracket | Male | Female |
| Under 5 Years | 171 (6.8%) | 215 (8.6%) |
| 5 to 9 Years | 155 (6.2%) | 124 (5.0%) |
| 10 to 14 Years | 36 (1.4%) | 98 (3.9%) |
| 15 to 19 Years | 128 (5.1%) | 141 (5.7%) |
| 20 to 24 Years | 202 (8.1%) | 208 (8.3%) |
| 25 to 29 Years | 165 (6.6%) | 68 (2.7%) |
| 30 to 34 Years | 215 (8.6%) | 236 (9.5%) |
| 35 to 39 Years | 193 (7.7%) | 203 (8.1%) |
| 40 to 44 Years | 51 (2.0%) | 93 (3.7%) |
| 45 to 49 Years | 136 (5.4%) | 216 (8.6%) |
| 50 to 54 Years | 185 (7.4%) | 96 (3.8%) |
| 55 to 59 Years | 204 (8.1%) | 99 (4.0%) |
| 60 to 64 Years | 118 (4.7%) | 187 (7.5%) |
| 65 to 69 Years | 223 (8.9%) | 141 (5.7%) |
| 70 to 74 Years | 170 (6.8%) | 157 (6.3%) |
| 75 to 79 Years | 51 (2.0%) | 132 (5.3%) |
| 80 to 84 Years | 89 (3.5%) | 34 (1.4%) |
| 85 Years and over | 14 (0.6%) | 48 (1.9%) |
| Total | 2,506 (100.0%) | 2,496 (100.0%) |
Families and Households in Hillandale
Median Family Size in Hillandale
The median family size in Hillandale is 3.74 persons per family, with single male/father families (37 | 3.2%) accounting for the largest median family size of 5.11 persons per family. On the other hand, married-couple families (1,041 | 88.8%) represent the smallest median family size with 3.63 persons per family.
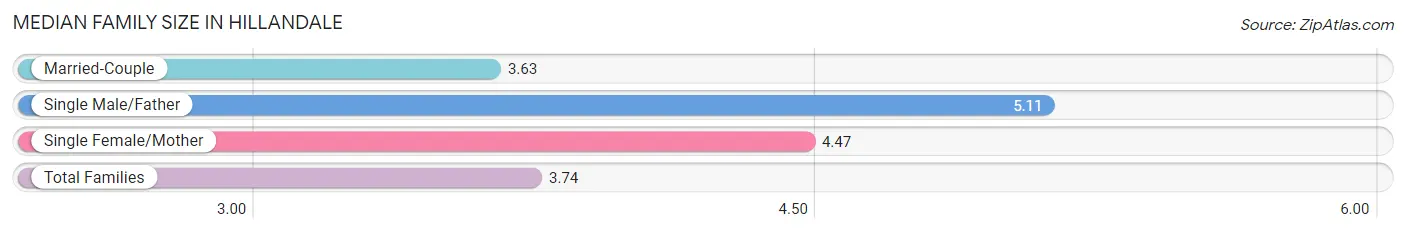
| Family Type | # Families | Family Size |
| Married-Couple | 1,041 (88.8%) | 3.63 |
| Single Male/Father | 37 (3.2%) | 5.11 |
| Single Female/Mother | 94 (8.0%) | 4.47 |
| Total Families | 1,172 (100.0%) | 3.74 |
Median Household Size in Hillandale
The median household size in Hillandale is 3.26 persons per household, with single male/father households (37 | 2.4%) accounting for the largest median household size of 6.35 persons per household. non-family households (343 | 22.6%) represent the smallest median household size with 1.11 persons per household.
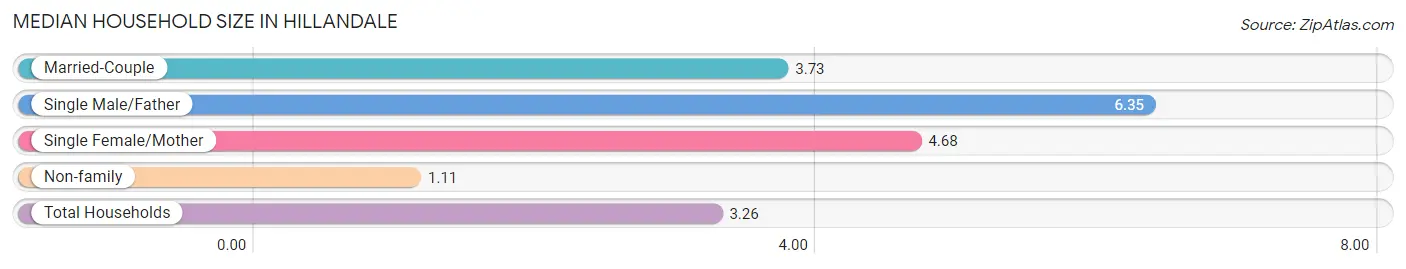
| Household Type | # Households | Household Size |
| Married-Couple | 1,041 (68.7%) | 3.73 |
| Single Male/Father | 37 (2.4%) | 6.35 |
| Single Female/Mother | 94 (6.2%) | 4.68 |
| Non-family | 343 (22.6%) | 1.11 |
| Total Households | 1,515 (100.0%) | 3.26 |
Household Size by Marriage Status in Hillandale
Out of a total of 1,515 households in Hillandale, 1,172 (77.4%) are family households, while 343 (22.6%) are nonfamily households. The most numerous type of family households are 2-person households, comprising 399, and the most common type of nonfamily households are 1-person households, comprising 310.
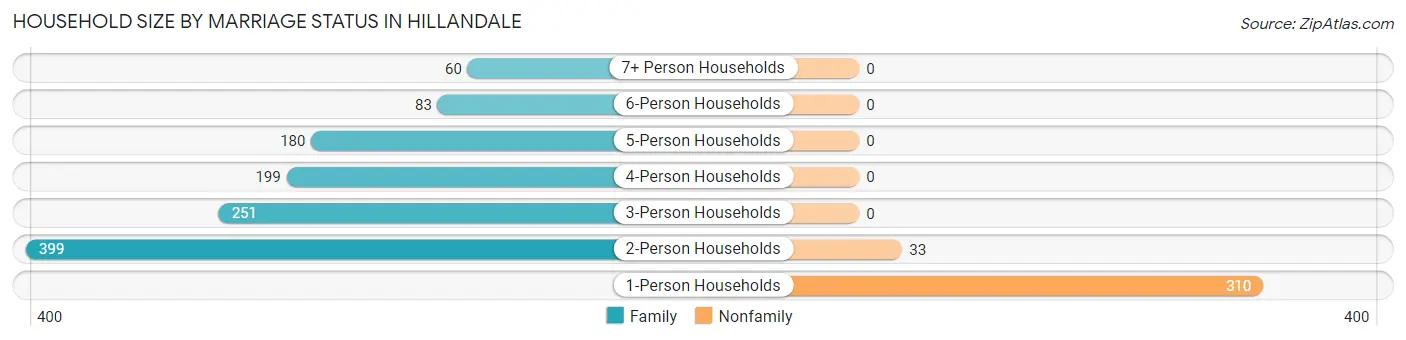
| Household Size | Family Households | Nonfamily Households |
| 1-Person Households | - | 310 (20.5%) |
| 2-Person Households | 399 (26.3%) | 33 (2.2%) |
| 3-Person Households | 251 (16.6%) | 0 (0.0%) |
| 4-Person Households | 199 (13.1%) | 0 (0.0%) |
| 5-Person Households | 180 (11.9%) | 0 (0.0%) |
| 6-Person Households | 83 (5.5%) | 0 (0.0%) |
| 7+ Person Households | 60 (4.0%) | 0 (0.0%) |
| Total | 1,172 (77.4%) | 343 (22.6%) |
Female Fertility in Hillandale
Fertility by Age in Hillandale
Average fertility rate in Hillandale is 56.0 births per 1,000 women. Women in the age bracket of 35 to 50 years have the highest fertility rate with 104.0 births per 1,000 women. Women in the age bracket of 35 to 50 years acount for 83.6% of all women with births.
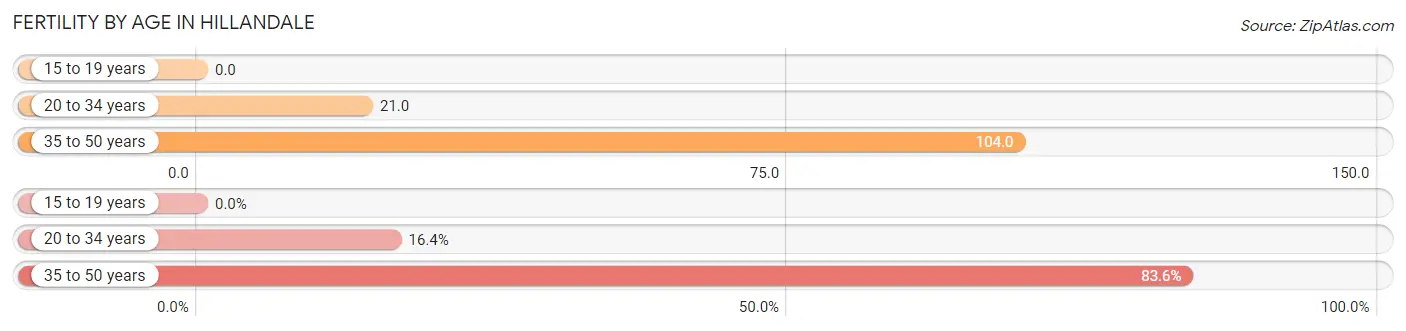
| Age Bracket | Women with Births | Births / 1,000 Women |
| 15 to 19 years | 0 (0.0%) | 0.0 |
| 20 to 34 years | 11 (16.4%) | 21.0 |
| 35 to 50 years | 56 (83.6%) | 104.0 |
| Total | 67 (100.0%) | 56.0 |
Fertility by Age by Marriage Status in Hillandale
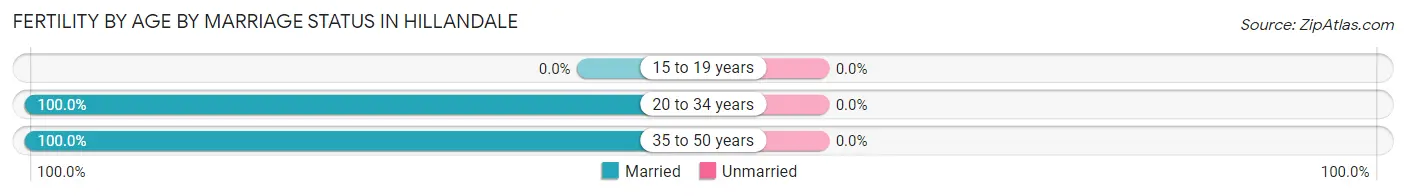
| Age Bracket | Married | Unmarried |
| 15 to 19 years | 0 (0.0%) | 0 (0.0%) |
| 20 to 34 years | 11 (100.0%) | 0 (0.0%) |
| 35 to 50 years | 56 (100.0%) | 0 (0.0%) |
| Total | 67 (100.0%) | 0 (0.0%) |
Fertility by Education in Hillandale
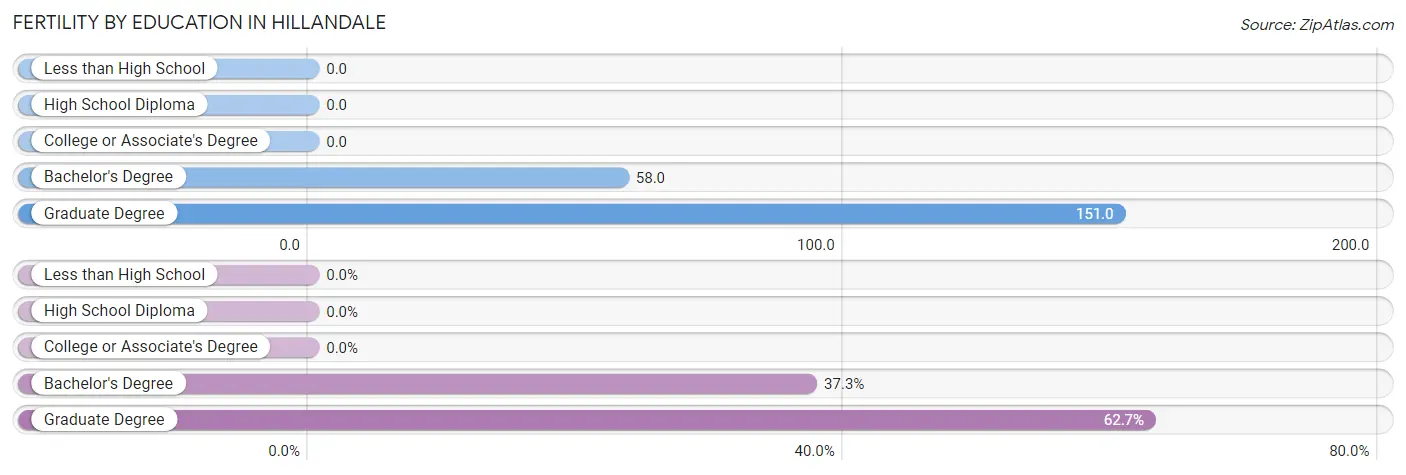
| Educational Attainment | Women with Births | Births / 1,000 Women |
| Less than High School | 0 (0.0%) | 0.0 |
| High School Diploma | 0 (0.0%) | 0.0 |
| College or Associate's Degree | 0 (0.0%) | 0.0 |
| Bachelor's Degree | 25 (37.3%) | 58.0 |
| Graduate Degree | 42 (62.7%) | 151.0 |
| Total | 67 (100.0%) | 56.0 |
Fertility by Education by Marriage Status in Hillandale
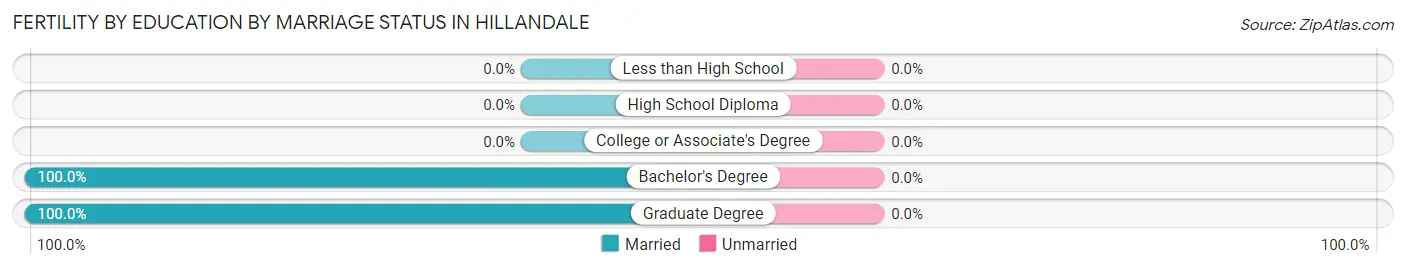
| Educational Attainment | Married | Unmarried |
| Less than High School | 0 (0.0%) | 0 (0.0%) |
| High School Diploma | 0 (0.0%) | 0 (0.0%) |
| College or Associate's Degree | 0 (0.0%) | 0 (0.0%) |
| Bachelor's Degree | 25 (100.0%) | 0 (0.0%) |
| Graduate Degree | 42 (100.0%) | 0 (0.0%) |
| Total | 67 (100.0%) | 0 (0.0%) |
Employment Characteristics in Hillandale
Employment by Class of Employer in Hillandale
Among the 2,717 employed individuals in Hillandale, private company employees (1,635 | 60.2%), not-for-profit organizations (368 | 13.5%), and federal government employees (278 | 10.2%) make up the most common classes of employment.
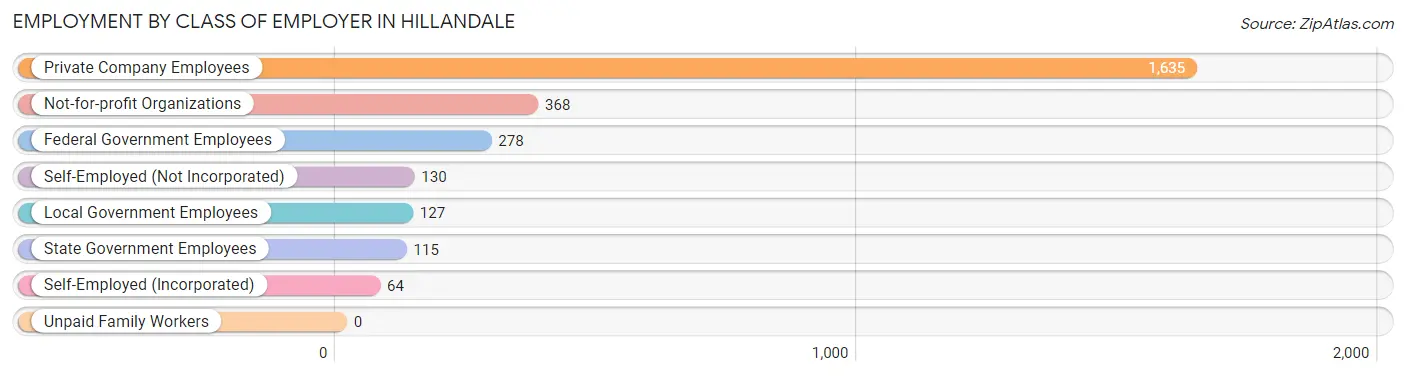
| Employer Class | # Employees | % Employees |
| Private Company Employees | 1,635 | 60.2% |
| Self-Employed (Incorporated) | 64 | 2.4% |
| Self-Employed (Not Incorporated) | 130 | 4.8% |
| Not-for-profit Organizations | 368 | 13.5% |
| Local Government Employees | 127 | 4.7% |
| State Government Employees | 115 | 4.2% |
| Federal Government Employees | 278 | 10.2% |
| Unpaid Family Workers | 0 | 0.0% |
| Total | 2,717 | 100.0% |
Employment Status by Age in Hillandale
According to the labor force statistics for Hillandale, out of the total population over 16 years of age (4,136), 74.3% or 3,073 individuals are in the labor force, with 7.9% or 243 of them unemployed. The age group with the highest labor force participation rate is 25 to 29 years, with 99.6% or 232 individuals in the labor force. Within the labor force, the 20 to 24 years age range has the highest percentage of unemployed individuals, with 20.6% or 80 of them being unemployed.
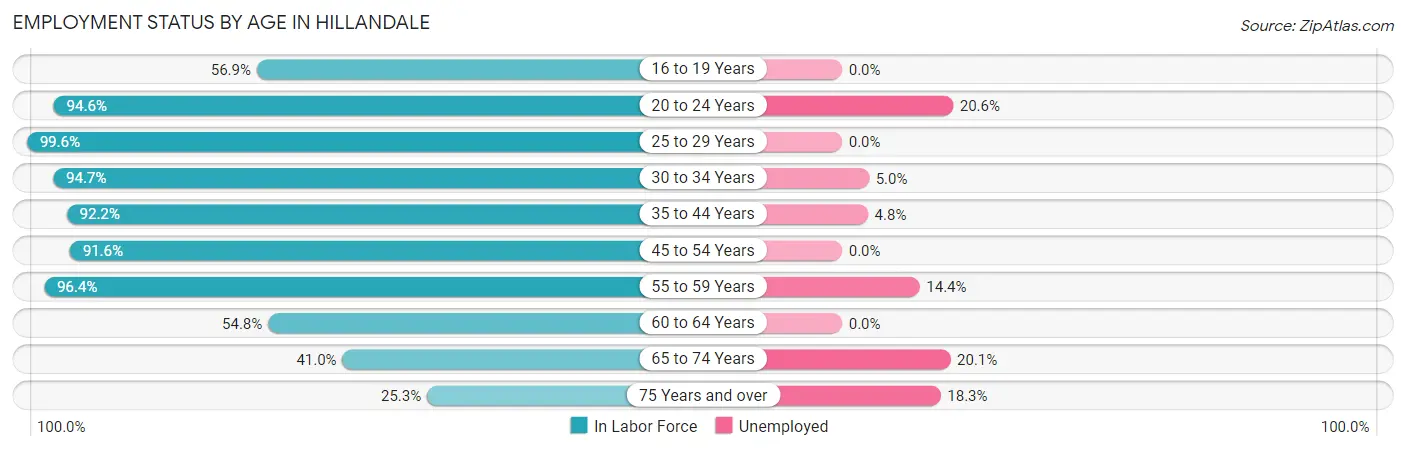
| Age Bracket | In Labor Force | Unemployed |
| 16 to 19 Years | 115 (56.9%) | 0 (0.0%) |
| 20 to 24 Years | 388 (94.6%) | 80 (20.6%) |
| 25 to 29 Years | 232 (99.6%) | 0 (0.0%) |
| 30 to 34 Years | 427 (94.7%) | 21 (5.0%) |
| 35 to 44 Years | 498 (92.2%) | 24 (4.8%) |
| 45 to 54 Years | 580 (91.6%) | 0 (0.0%) |
| 55 to 59 Years | 292 (96.4%) | 42 (14.4%) |
| 60 to 64 Years | 167 (54.8%) | 0 (0.0%) |
| 65 to 74 Years | 283 (41.0%) | 57 (20.1%) |
| 75 Years and over | 93 (25.3%) | 17 (18.3%) |
| Total | 3,073 (74.3%) | 243 (7.9%) |
Employment Status by Educational Attainment in Hillandale
According to labor force statistics for Hillandale, 89.1% of individuals (2,196) out of the total population between 25 and 64 years of age (2,465) are in the labor force, with 4.0% or 88 of them being unemployed. The group with the highest labor force participation rate are those with the educational attainment of bachelor's degree or higher, with 93.0% or 1,045 individuals in the labor force. Within the labor force, individuals with high school diploma education have the highest percentage of unemployment, with 7.1% or 30 of them being unemployed.
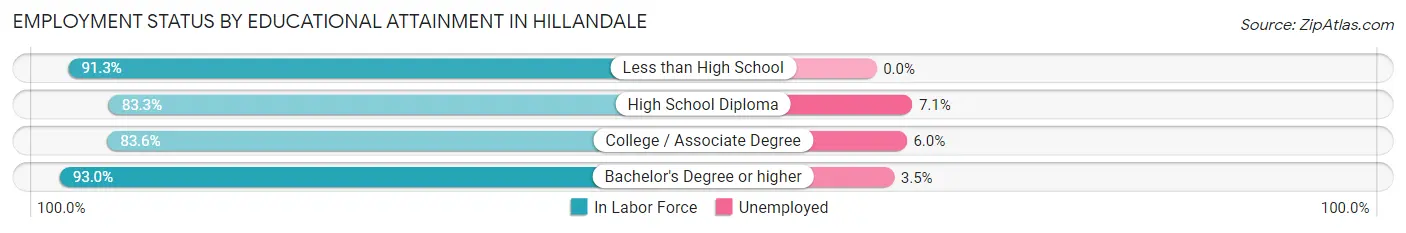
| Educational Attainment | In Labor Force | Unemployed |
| Less than High School | 376 (91.3%) | 0 (0.0%) |
| High School Diploma | 424 (83.3%) | 36 (7.1%) |
| College / Associate Degree | 351 (83.6%) | 25 (6.0%) |
| Bachelor's Degree or higher | 1,045 (93.0%) | 39 (3.5%) |
| Total | 2,196 (89.1%) | 99 (4.0%) |
Employment Occupations by Sex in Hillandale
Management, Business, Science and Arts Occupations
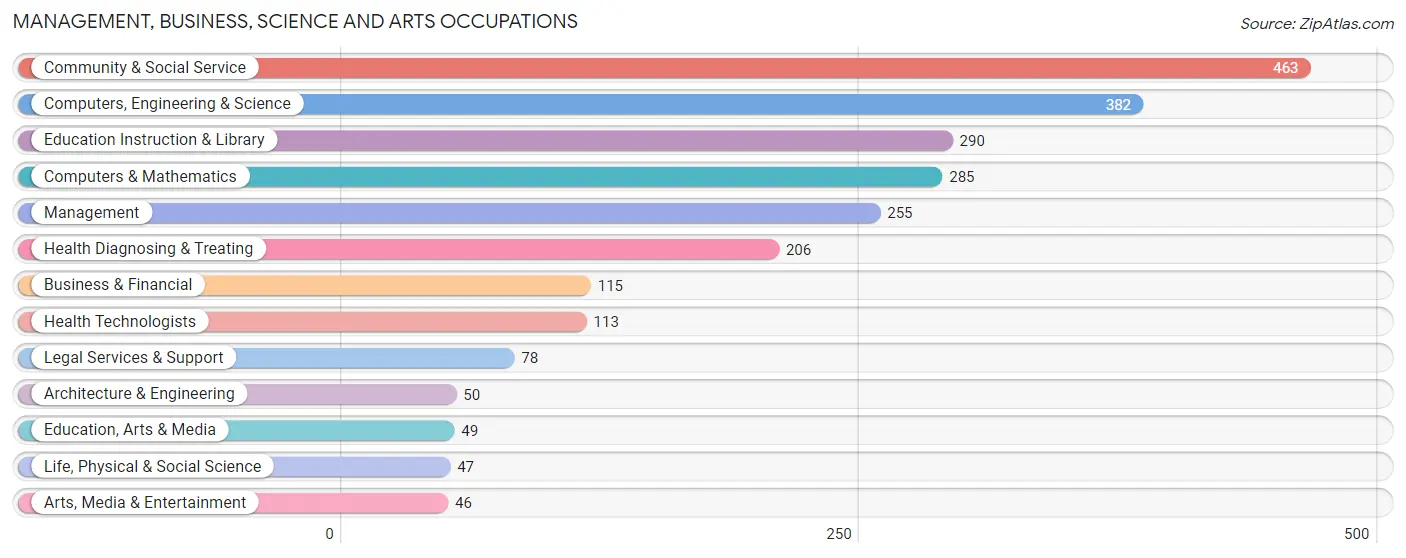
The most common Management, Business, Science and Arts occupations in Hillandale are Community & Social Service (463 | 16.4%), Computers, Engineering & Science (382 | 13.5%), Education Instruction & Library (290 | 10.3%), Computers & Mathematics (285 | 10.1%), and Management (255 | 9.0%).
Management, Business, Science and Arts Occupations by Sex
Within the Management, Business, Science and Arts occupations in Hillandale, the most male-oriented occupations are Architecture & Engineering (100.0%), Computers & Mathematics (96.8%), and Business & Financial (93.0%), while the most female-oriented occupations are Life, Physical & Social Science (100.0%), Arts, Media & Entertainment (100.0%), and Health Diagnosing & Treating (73.8%).
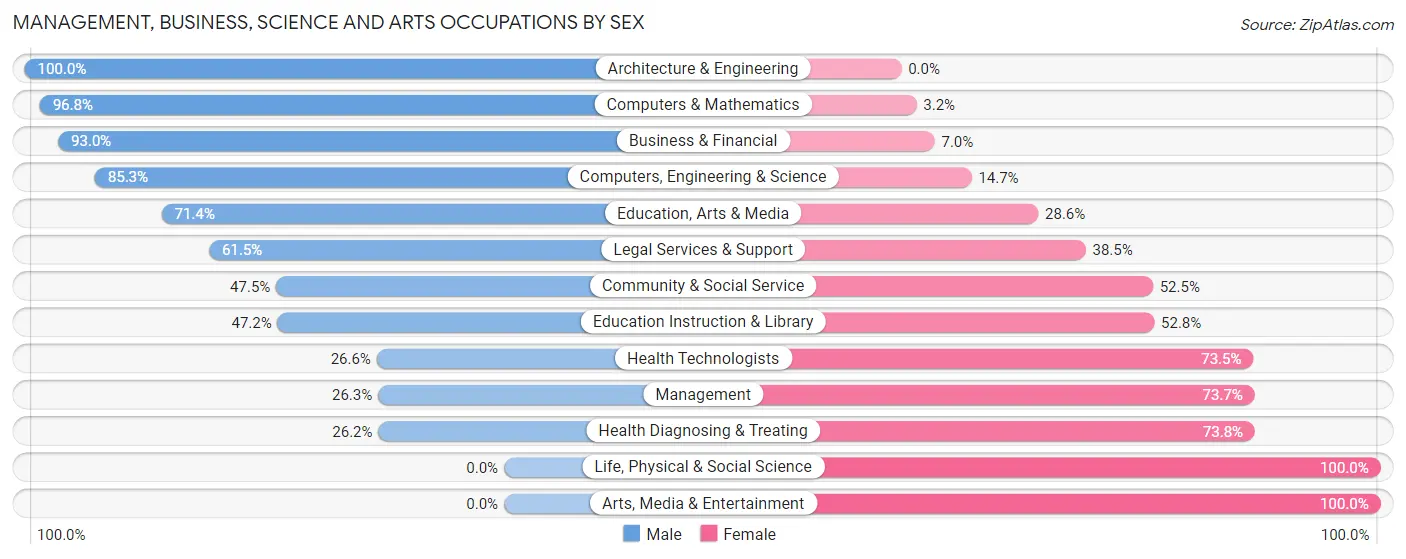
| Occupation | Male | Female |
| Management | 67 (26.3%) | 188 (73.7%) |
| Business & Financial | 107 (93.0%) | 8 (7.0%) |
| Computers, Engineering & Science | 326 (85.3%) | 56 (14.7%) |
| Computers & Mathematics | 276 (96.8%) | 9 (3.2%) |
| Architecture & Engineering | 50 (100.0%) | 0 (0.0%) |
| Life, Physical & Social Science | 0 (0.0%) | 47 (100.0%) |
| Community & Social Service | 220 (47.5%) | 243 (52.5%) |
| Education, Arts & Media | 35 (71.4%) | 14 (28.6%) |
| Legal Services & Support | 48 (61.5%) | 30 (38.5%) |
| Education Instruction & Library | 137 (47.2%) | 153 (52.8%) |
| Arts, Media & Entertainment | 0 (0.0%) | 46 (100.0%) |
| Health Diagnosing & Treating | 54 (26.2%) | 152 (73.8%) |
| Health Technologists | 30 (26.6%) | 83 (73.5%) |
| Total (Category) | 774 (54.5%) | 647 (45.5%) |
| Total (Overall) | 1,565 (55.4%) | 1,258 (44.6%) |
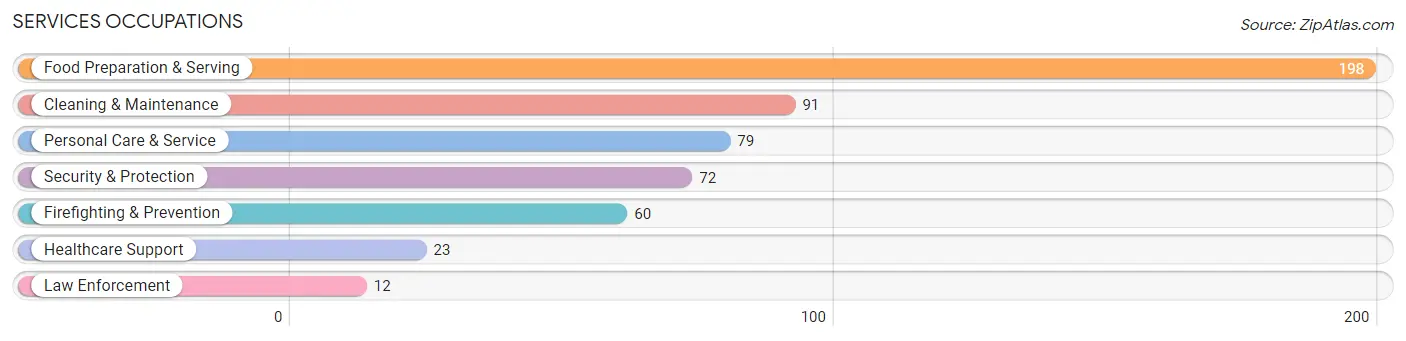
Services Occupations
The most common Services occupations in Hillandale are Food Preparation & Serving (198 | 7.0%), Cleaning & Maintenance (91 | 3.2%), Personal Care & Service (79 | 2.8%), Security & Protection (72 | 2.5%), and Firefighting & Prevention (60 | 2.1%).
Services Occupations by Sex
Within the Services occupations in Hillandale, the most male-oriented occupations are Law Enforcement (100.0%), Personal Care & Service (62.0%), and Food Preparation & Serving (40.4%), while the most female-oriented occupations are Cleaning & Maintenance (82.4%), Healthcare Support (73.9%), and Firefighting & Prevention (73.3%).
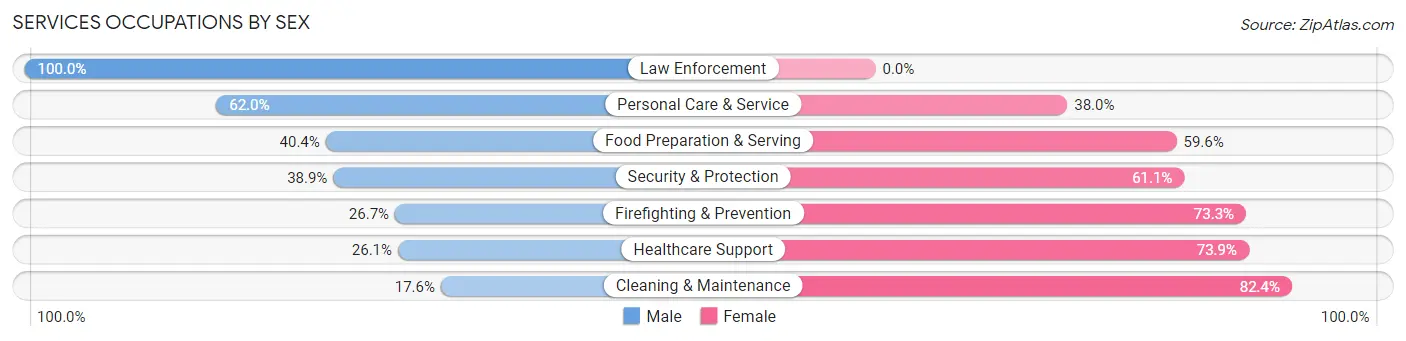
| Occupation | Male | Female |
| Healthcare Support | 6 (26.1%) | 17 (73.9%) |
| Security & Protection | 28 (38.9%) | 44 (61.1%) |
| Firefighting & Prevention | 16 (26.7%) | 44 (73.3%) |
| Law Enforcement | 12 (100.0%) | 0 (0.0%) |
| Food Preparation & Serving | 80 (40.4%) | 118 (59.6%) |
| Cleaning & Maintenance | 16 (17.6%) | 75 (82.4%) |
| Personal Care & Service | 49 (62.0%) | 30 (38.0%) |
| Total (Category) | 179 (38.7%) | 284 (61.3%) |
| Total (Overall) | 1,565 (55.4%) | 1,258 (44.6%) |
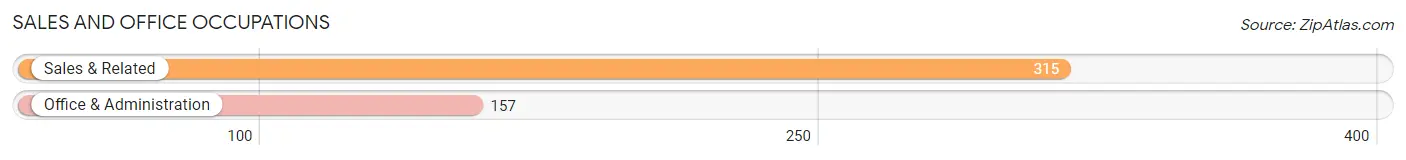
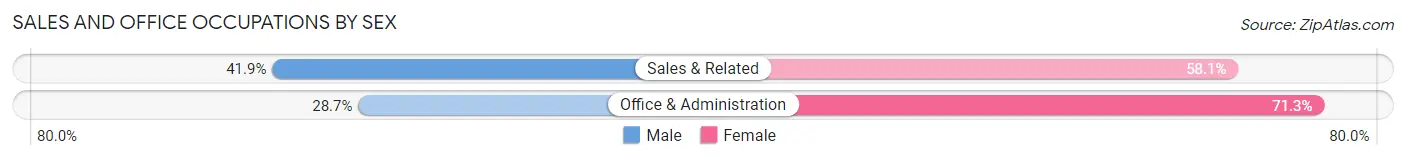
Sales and Office Occupations
The most common Sales and Office occupations in Hillandale are Sales & Related (315 | 11.2%), and Office & Administration (157 | 5.6%).
Sales and Office Occupations by Sex
| Occupation | Male | Female |
| Sales & Related | 132 (41.9%) | 183 (58.1%) |
| Office & Administration | 45 (28.7%) | 112 (71.3%) |
| Total (Category) | 177 (37.5%) | 295 (62.5%) |
| Total (Overall) | 1,565 (55.4%) | 1,258 (44.6%) |
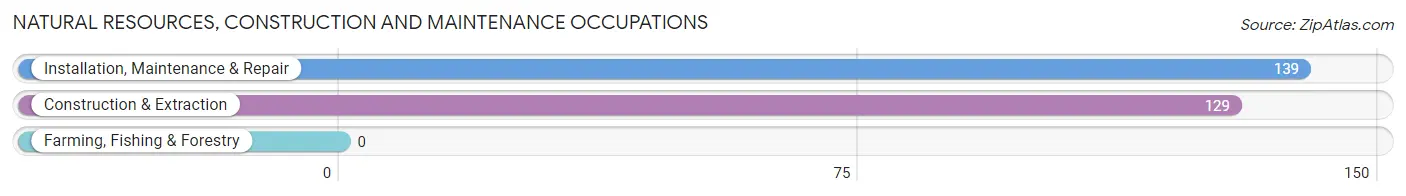
Natural Resources, Construction and Maintenance Occupations
The most common Natural Resources, Construction and Maintenance occupations in Hillandale are Installation, Maintenance & Repair (139 | 4.9%), and Construction & Extraction (129 | 4.6%).
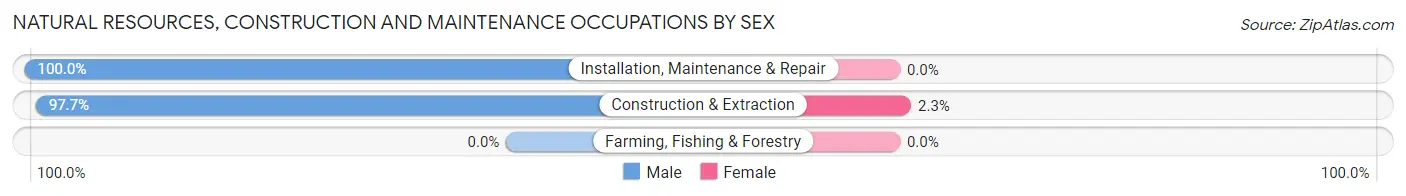
Natural Resources, Construction and Maintenance Occupations by Sex
| Occupation | Male | Female |
| Farming, Fishing & Forestry | 0 (0.0%) | 0 (0.0%) |
| Construction & Extraction | 126 (97.7%) | 3 (2.3%) |
| Installation, Maintenance & Repair | 139 (100.0%) | 0 (0.0%) |
| Total (Category) | 265 (98.9%) | 3 (1.1%) |
| Total (Overall) | 1,565 (55.4%) | 1,258 (44.6%) |
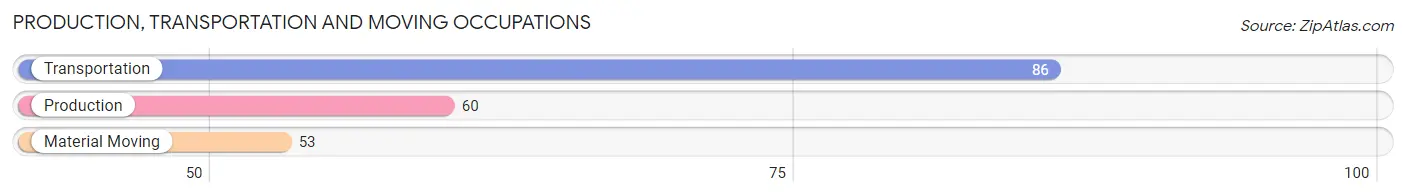
Production, Transportation and Moving Occupations
The most common Production, Transportation and Moving occupations in Hillandale are Transportation (86 | 3.0%), Production (60 | 2.1%), and Material Moving (53 | 1.9%).
Production, Transportation and Moving Occupations by Sex
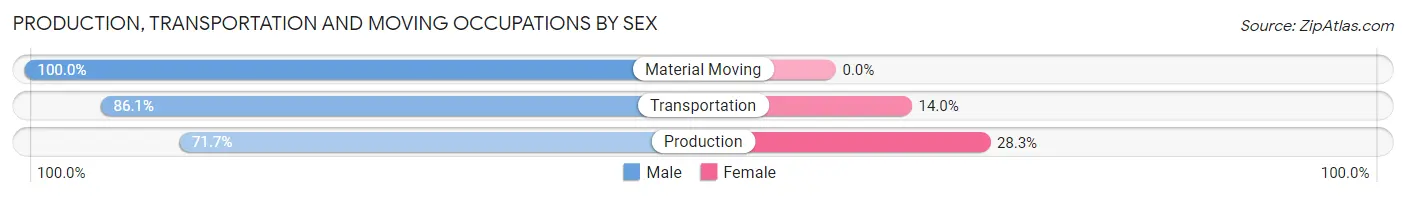
| Occupation | Male | Female |
| Production | 43 (71.7%) | 17 (28.3%) |
| Transportation | 74 (86.1%) | 12 (14.0%) |
| Material Moving | 53 (100.0%) | 0 (0.0%) |
| Total (Category) | 170 (85.4%) | 29 (14.6%) |
| Total (Overall) | 1,565 (55.4%) | 1,258 (44.6%) |
Employment Industries by Sex in Hillandale
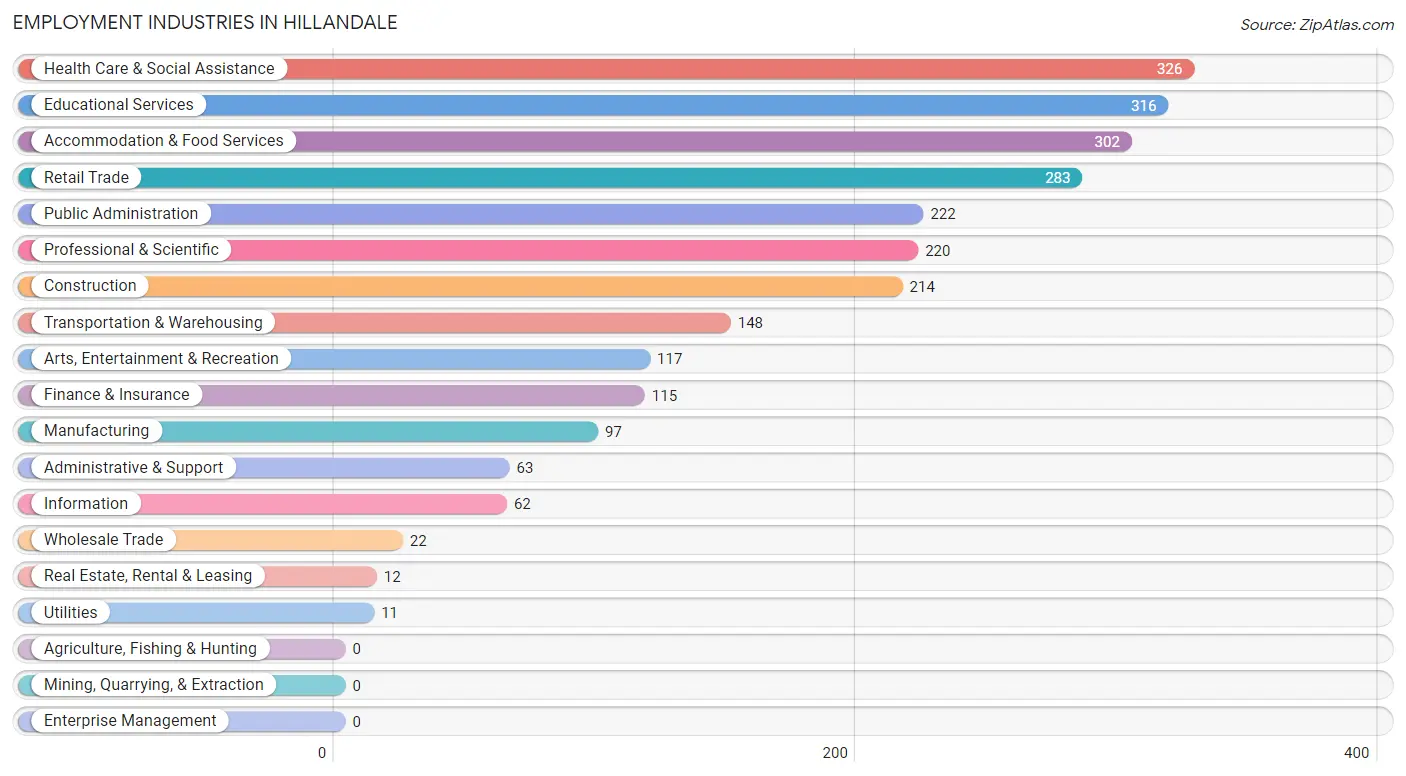
Employment Industries in Hillandale
The major employment industries in Hillandale include Health Care & Social Assistance (326 | 11.6%), Educational Services (316 | 11.2%), Accommodation & Food Services (302 | 10.7%), Retail Trade (283 | 10.0%), and Public Administration (222 | 7.9%).
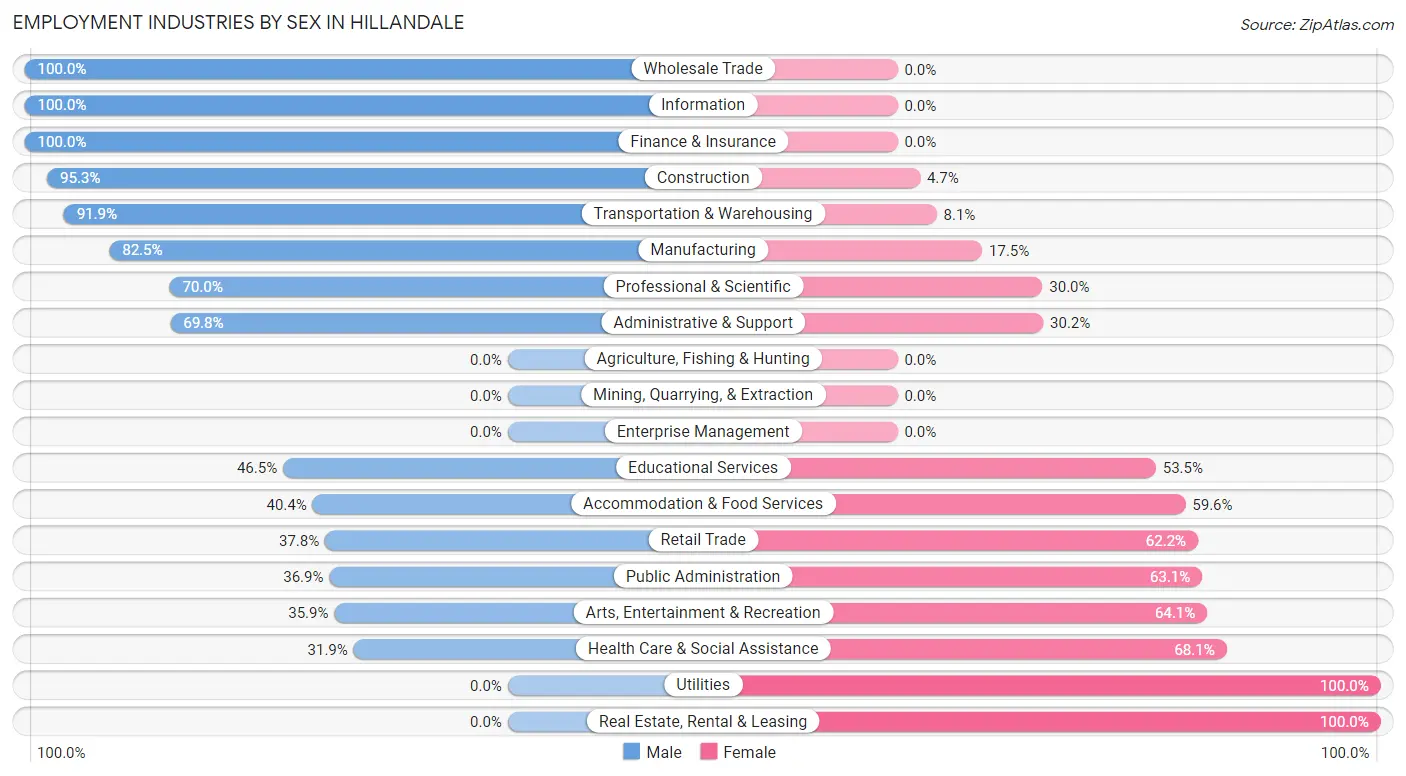
Employment Industries by Sex in Hillandale
The Hillandale industries that see more men than women are Wholesale Trade (100.0%), Information (100.0%), and Finance & Insurance (100.0%), whereas the industries that tend to have a higher number of women are Utilities (100.0%), Real Estate, Rental & Leasing (100.0%), and Health Care & Social Assistance (68.1%).
| Industry | Male | Female |
| Agriculture, Fishing & Hunting | 0 (0.0%) | 0 (0.0%) |
| Mining, Quarrying, & Extraction | 0 (0.0%) | 0 (0.0%) |
| Construction | 204 (95.3%) | 10 (4.7%) |
| Manufacturing | 80 (82.5%) | 17 (17.5%) |
| Wholesale Trade | 22 (100.0%) | 0 (0.0%) |
| Retail Trade | 107 (37.8%) | 176 (62.2%) |
| Transportation & Warehousing | 136 (91.9%) | 12 (8.1%) |
| Utilities | 0 (0.0%) | 11 (100.0%) |
| Information | 62 (100.0%) | 0 (0.0%) |
| Finance & Insurance | 115 (100.0%) | 0 (0.0%) |
| Real Estate, Rental & Leasing | 0 (0.0%) | 12 (100.0%) |
| Professional & Scientific | 154 (70.0%) | 66 (30.0%) |
| Enterprise Management | 0 (0.0%) | 0 (0.0%) |
| Administrative & Support | 44 (69.8%) | 19 (30.2%) |
| Educational Services | 147 (46.5%) | 169 (53.5%) |
| Health Care & Social Assistance | 104 (31.9%) | 222 (68.1%) |
| Arts, Entertainment & Recreation | 42 (35.9%) | 75 (64.1%) |
| Accommodation & Food Services | 122 (40.4%) | 180 (59.6%) |
| Public Administration | 82 (36.9%) | 140 (63.1%) |
| Total | 1,565 (55.4%) | 1,258 (44.6%) |
Education in Hillandale
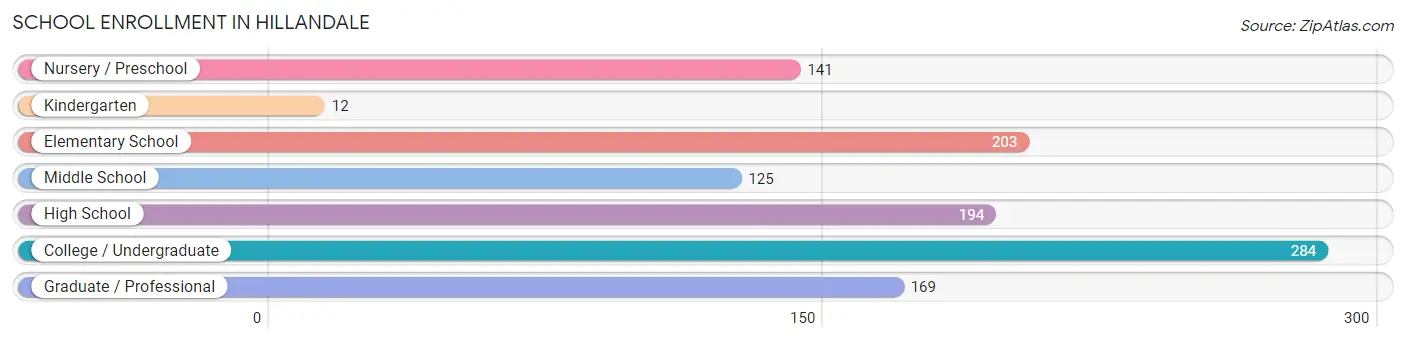
School Enrollment in Hillandale
The most common levels of schooling among the 1,128 students in Hillandale are college / undergraduate (284 | 25.2%), elementary school (203 | 18.0%), and high school (194 | 17.2%).
| School Level | # Students | % Students |
| Nursery / Preschool | 141 | 12.5% |
| Kindergarten | 12 | 1.1% |
| Elementary School | 203 | 18.0% |
| Middle School | 125 | 11.1% |
| High School | 194 | 17.2% |
| College / Undergraduate | 284 | 25.2% |
| Graduate / Professional | 169 | 15.0% |
| Total | 1,128 | 100.0% |
School Enrollment by Age by Funding Source in Hillandale
Out of a total of 1,128 students who are enrolled in schools in Hillandale, 390 (34.6%) attend a private institution, while the remaining 738 (65.4%) are enrolled in public schools. The age group of 35 years and over has the highest likelihood of being enrolled in private schools, with 85 (68.0% in the age bracket) enrolled. Conversely, the age group of 18 to 19 year olds has the lowest likelihood of being enrolled in a private school, with 69 (100.0% in the age bracket) attending a public institution.
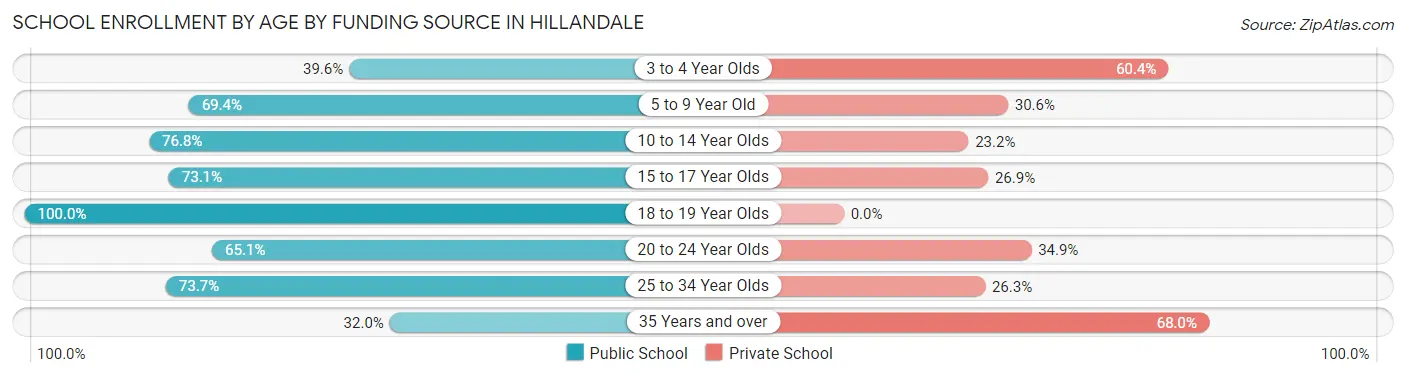
| Age Bracket | Public School | Private School |
| 3 to 4 Year Olds | 36 (39.6%) | 55 (60.4%) |
| 5 to 9 Year Old | 184 (69.4%) | 81 (30.6%) |
| 10 to 14 Year Olds | 96 (76.8%) | 29 (23.2%) |
| 15 to 17 Year Olds | 136 (73.1%) | 50 (26.9%) |
| 18 to 19 Year Olds | 69 (100.0%) | 0 (0.0%) |
| 20 to 24 Year Olds | 149 (65.1%) | 80 (34.9%) |
| 25 to 34 Year Olds | 28 (73.7%) | 10 (26.3%) |
| 35 Years and over | 40 (32.0%) | 85 (68.0%) |
| Total | 738 (65.4%) | 390 (34.6%) |
Educational Attainment by Field of Study in Hillandale
Social sciences (269 | 14.3%), business (248 | 13.2%), liberal arts & history (195 | 10.4%), bio, nature & agricultural (165 | 8.8%), and engineering (150 | 8.0%) are the most common fields of study among 1,874 individuals in Hillandale who have obtained a bachelor's degree or higher.
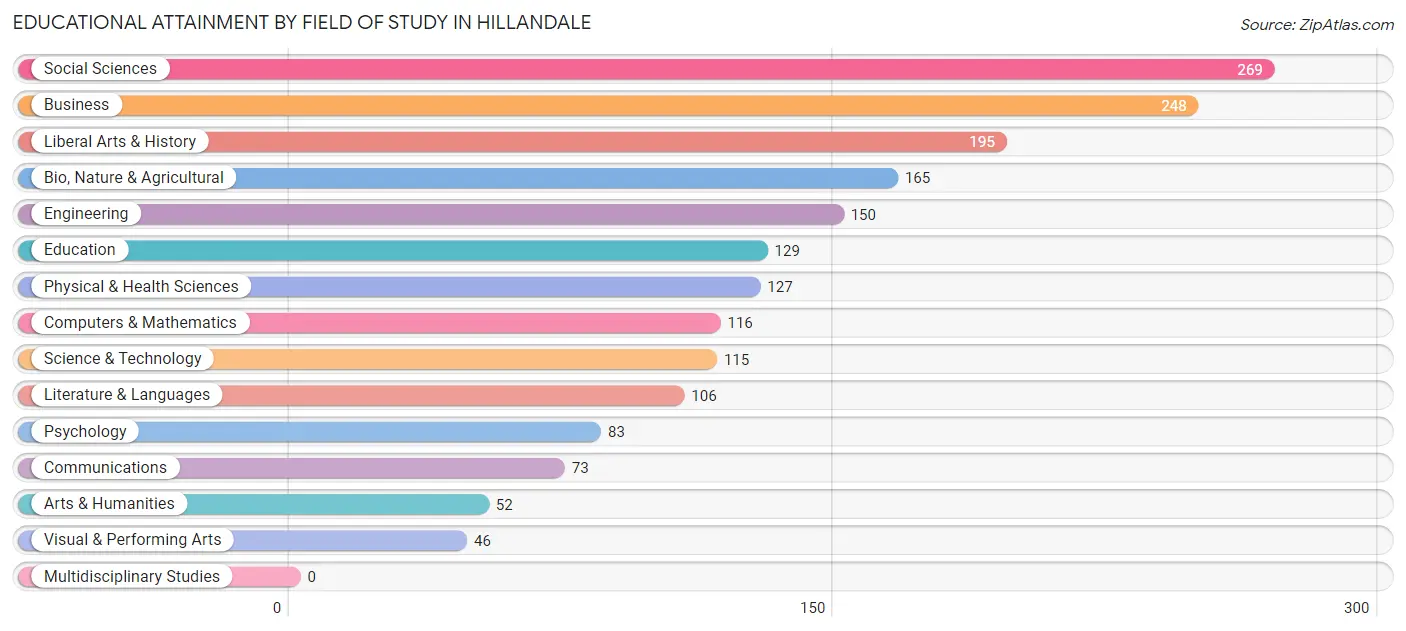
| Field of Study | # Graduates | % Graduates |
| Computers & Mathematics | 116 | 6.2% |
| Bio, Nature & Agricultural | 165 | 8.8% |
| Physical & Health Sciences | 127 | 6.8% |
| Psychology | 83 | 4.4% |
| Social Sciences | 269 | 14.3% |
| Engineering | 150 | 8.0% |
| Multidisciplinary Studies | 0 | 0.0% |
| Science & Technology | 115 | 6.1% |
| Business | 248 | 13.2% |
| Education | 129 | 6.9% |
| Literature & Languages | 106 | 5.7% |
| Liberal Arts & History | 195 | 10.4% |
| Visual & Performing Arts | 46 | 2.5% |
| Communications | 73 | 3.9% |
| Arts & Humanities | 52 | 2.8% |
| Total | 1,874 | 100.0% |
Transportation & Commute in Hillandale
Vehicle Availability by Sex in Hillandale
The most prevalent vehicle ownership categories in Hillandale are males with 2 vehicles (521, accounting for 33.8%) and females with 2 vehicles (323, making up 44.8%).
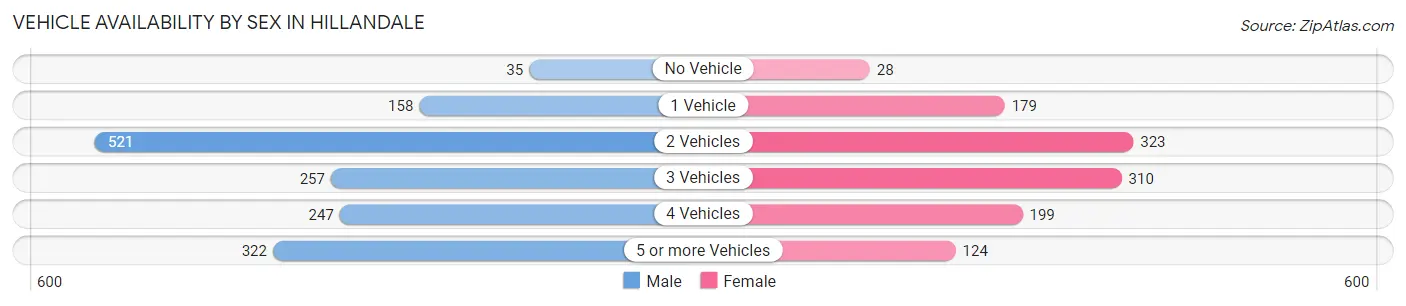
| Vehicles Available | Male | Female |
| No Vehicle | 35 (2.3%) | 28 (2.4%) |
| 1 Vehicle | 158 (10.3%) | 179 (15.4%) |
| 2 Vehicles | 521 (33.8%) | 323 (27.8%) |
| 3 Vehicles | 257 (16.7%) | 310 (26.7%) |
| 4 Vehicles | 247 (16.0%) | 199 (17.1%) |
| 5 or more Vehicles | 322 (20.9%) | 124 (10.7%) |
| Total | 1,540 (100.0%) | 1,163 (100.0%) |
Commute Time in Hillandale
The most frequently occuring commute durations in Hillandale are 30 to 34 minutes (475 commuters, 20.1%), 40 to 44 minutes (334 commuters, 14.1%), and 20 to 24 minutes (305 commuters, 12.9%).
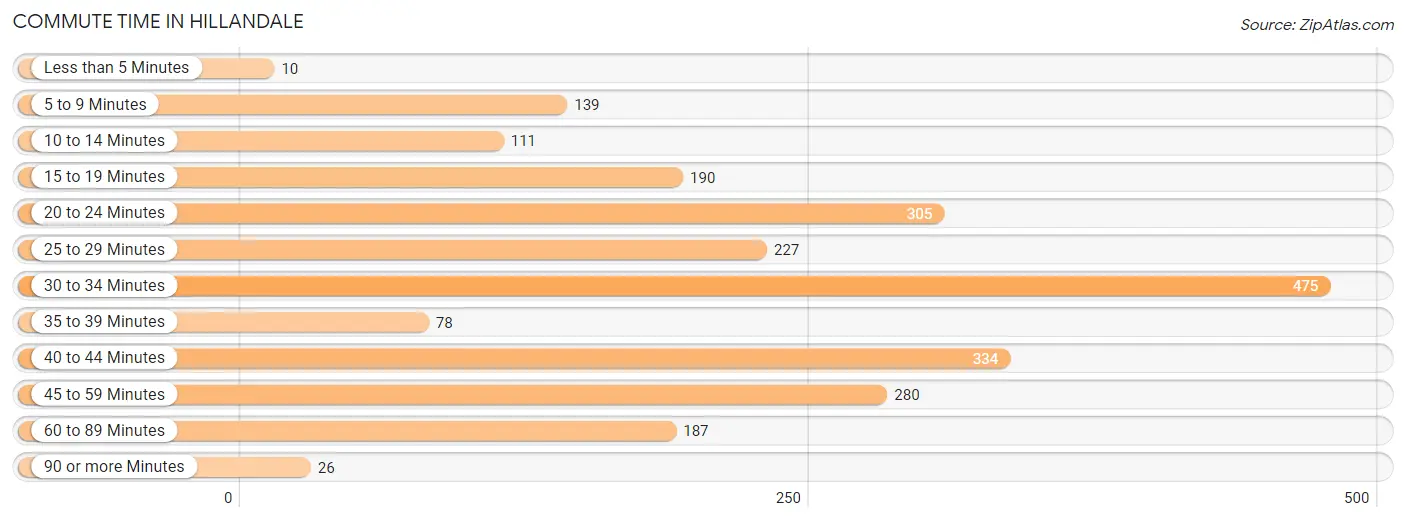
| Commute Time | # Commuters | % Commuters |
| Less than 5 Minutes | 10 | 0.4% |
| 5 to 9 Minutes | 139 | 5.9% |
| 10 to 14 Minutes | 111 | 4.7% |
| 15 to 19 Minutes | 190 | 8.0% |
| 20 to 24 Minutes | 305 | 12.9% |
| 25 to 29 Minutes | 227 | 9.6% |
| 30 to 34 Minutes | 475 | 20.1% |
| 35 to 39 Minutes | 78 | 3.3% |
| 40 to 44 Minutes | 334 | 14.1% |
| 45 to 59 Minutes | 280 | 11.8% |
| 60 to 89 Minutes | 187 | 7.9% |
| 90 or more Minutes | 26 | 1.1% |
Commute Time by Sex in Hillandale
The most common commute times in Hillandale are 30 to 34 minutes (311 commuters, 22.1%) for males and 30 to 34 minutes (164 commuters, 17.2%) for females.
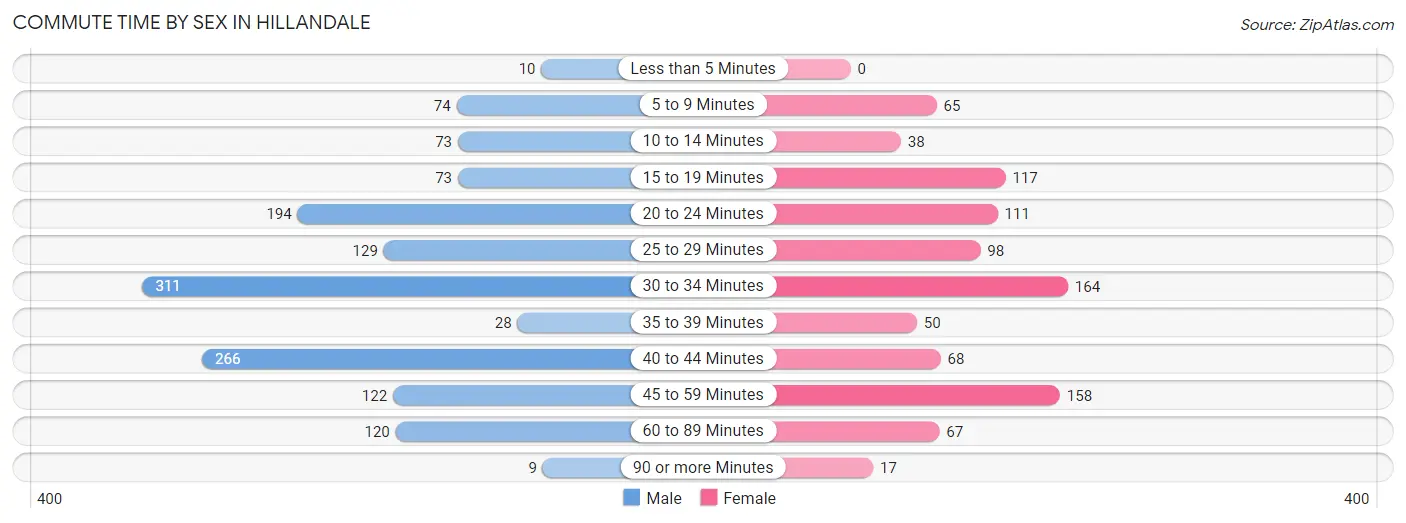
| Commute Time | Male | Female |
| Less than 5 Minutes | 10 (0.7%) | 0 (0.0%) |
| 5 to 9 Minutes | 74 (5.2%) | 65 (6.8%) |
| 10 to 14 Minutes | 73 (5.2%) | 38 (4.0%) |
| 15 to 19 Minutes | 73 (5.2%) | 117 (12.3%) |
| 20 to 24 Minutes | 194 (13.8%) | 111 (11.7%) |
| 25 to 29 Minutes | 129 (9.2%) | 98 (10.3%) |
| 30 to 34 Minutes | 311 (22.1%) | 164 (17.2%) |
| 35 to 39 Minutes | 28 (2.0%) | 50 (5.2%) |
| 40 to 44 Minutes | 266 (18.9%) | 68 (7.1%) |
| 45 to 59 Minutes | 122 (8.7%) | 158 (16.6%) |
| 60 to 89 Minutes | 120 (8.5%) | 67 (7.0%) |
| 90 or more Minutes | 9 (0.6%) | 17 (1.8%) |
Time of Departure to Work by Sex in Hillandale
The most frequent times of departure to work in Hillandale are 8:00 AM to 8:29 AM (280, 19.9%) for males and 8:00 AM to 8:29 AM (192, 20.2%) for females.
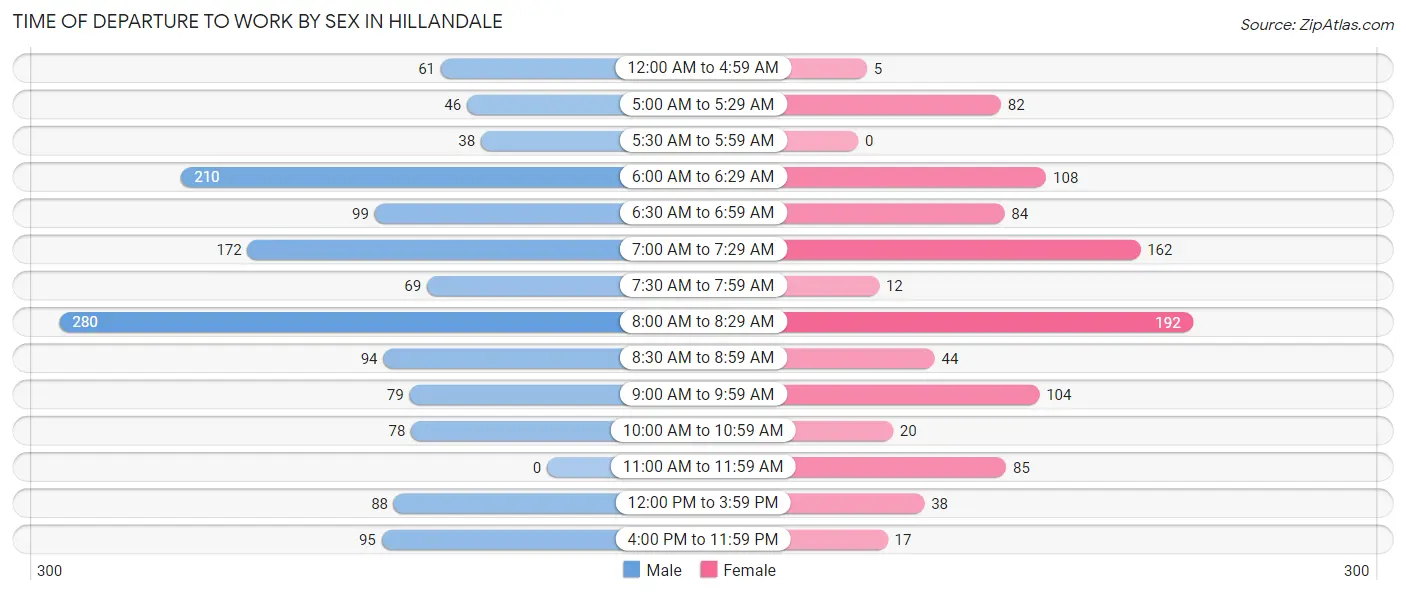
| Time of Departure | Male | Female |
| 12:00 AM to 4:59 AM | 61 (4.3%) | 5 (0.5%) |
| 5:00 AM to 5:29 AM | 46 (3.3%) | 82 (8.6%) |
| 5:30 AM to 5:59 AM | 38 (2.7%) | 0 (0.0%) |
| 6:00 AM to 6:29 AM | 210 (14.9%) | 108 (11.3%) |
| 6:30 AM to 6:59 AM | 99 (7.0%) | 84 (8.8%) |
| 7:00 AM to 7:29 AM | 172 (12.2%) | 162 (17.0%) |
| 7:30 AM to 7:59 AM | 69 (4.9%) | 12 (1.3%) |
| 8:00 AM to 8:29 AM | 280 (19.9%) | 192 (20.2%) |
| 8:30 AM to 8:59 AM | 94 (6.7%) | 44 (4.6%) |
| 9:00 AM to 9:59 AM | 79 (5.6%) | 104 (10.9%) |
| 10:00 AM to 10:59 AM | 78 (5.5%) | 20 (2.1%) |
| 11:00 AM to 11:59 AM | 0 (0.0%) | 85 (8.9%) |
| 12:00 PM to 3:59 PM | 88 (6.2%) | 38 (4.0%) |
| 4:00 PM to 11:59 PM | 95 (6.7%) | 17 (1.8%) |
| Total | 1,409 (100.0%) | 953 (100.0%) |
Housing Occupancy in Hillandale
Occupancy by Ownership in Hillandale
Of the total 1,515 dwellings in Hillandale, owner-occupied units account for 1,326 (87.5%), while renter-occupied units make up 189 (12.5%).
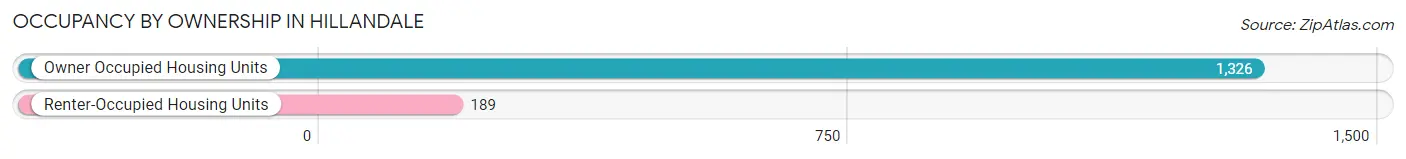
| Occupancy | # Housing Units | % Housing Units |
| Owner Occupied Housing Units | 1,326 | 87.5% |
| Renter-Occupied Housing Units | 189 | 12.5% |
| Total Occupied Housing Units | 1,515 | 100.0% |
Occupancy by Household Size in Hillandale
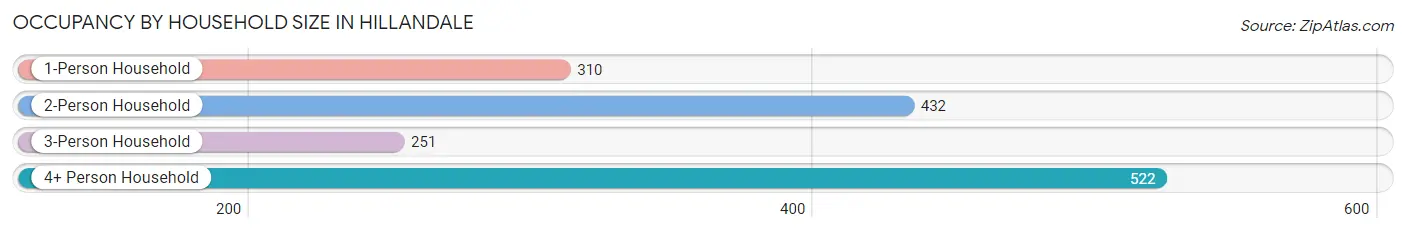
| Household Size | # Housing Units | % Housing Units |
| 1-Person Household | 310 | 20.5% |
| 2-Person Household | 432 | 28.5% |
| 3-Person Household | 251 | 16.6% |
| 4+ Person Household | 522 | 34.5% |
| Total Housing Units | 1,515 | 100.0% |
Occupancy by Ownership by Household Size in Hillandale
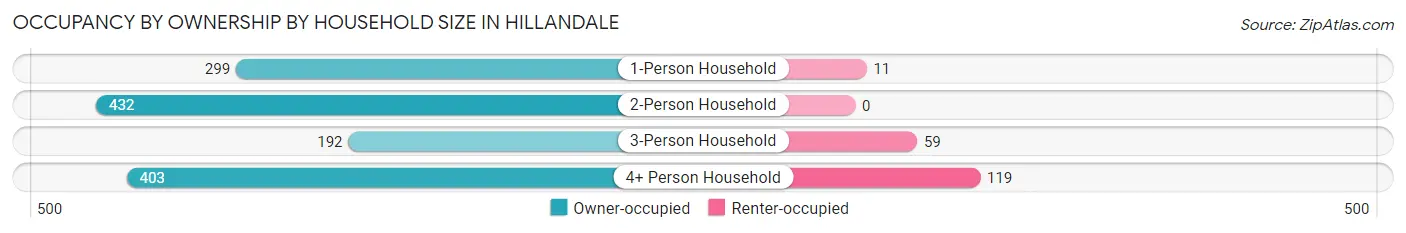
| Household Size | Owner-occupied | Renter-occupied |
| 1-Person Household | 299 (96.5%) | 11 (3.5%) |
| 2-Person Household | 432 (100.0%) | 0 (0.0%) |
| 3-Person Household | 192 (76.5%) | 59 (23.5%) |
| 4+ Person Household | 403 (77.2%) | 119 (22.8%) |
| Total Housing Units | 1,326 (87.5%) | 189 (12.5%) |
Occupancy by Educational Attainment in Hillandale
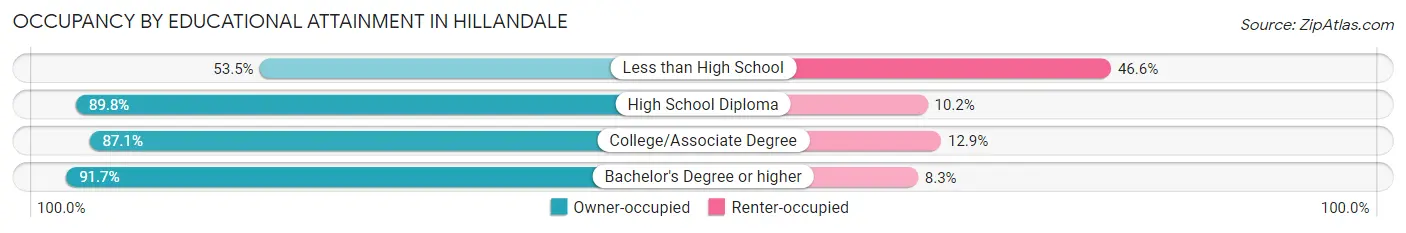
| Household Size | Owner-occupied | Renter-occupied |
| Less than High School | 62 (53.4%) | 54 (46.6%) |
| High School Diploma | 256 (89.8%) | 29 (10.2%) |
| College/Associate Degree | 264 (87.1%) | 39 (12.9%) |
| Bachelor's Degree or higher | 744 (91.7%) | 67 (8.3%) |
Occupancy by Age of Householder in Hillandale
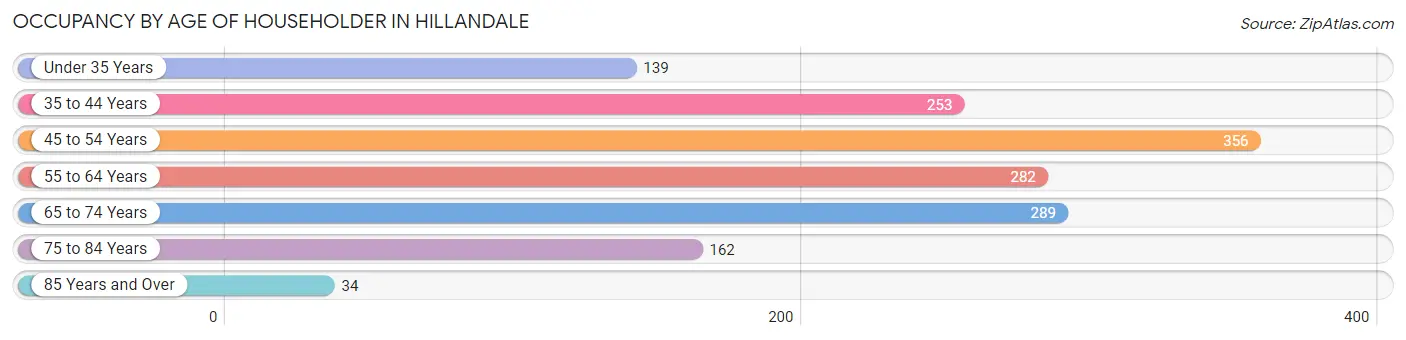
| Age Bracket | # Households | % Households |
| Under 35 Years | 139 | 9.2% |
| 35 to 44 Years | 253 | 16.7% |
| 45 to 54 Years | 356 | 23.5% |
| 55 to 64 Years | 282 | 18.6% |
| 65 to 74 Years | 289 | 19.1% |
| 75 to 84 Years | 162 | 10.7% |
| 85 Years and Over | 34 | 2.2% |
| Total | 1,515 | 100.0% |
Housing Finances in Hillandale
Median Income by Occupancy in Hillandale
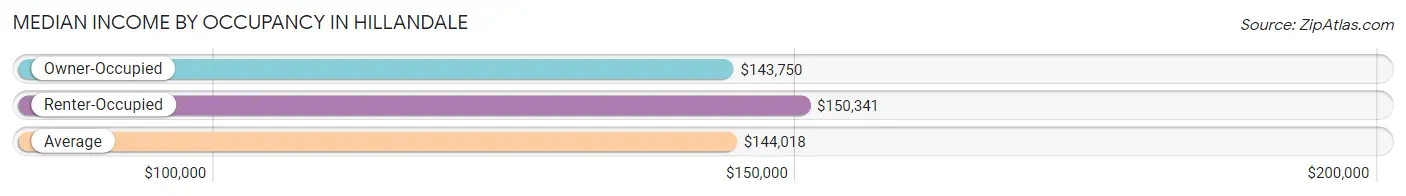
| Occupancy Type | # Households | Median Income |
| Owner-Occupied | 1,326 (87.5%) | $143,750 |
| Renter-Occupied | 189 (12.5%) | $150,341 |
| Average | 1,515 (100.0%) | $144,018 |
Occupancy by Householder Income Bracket in Hillandale
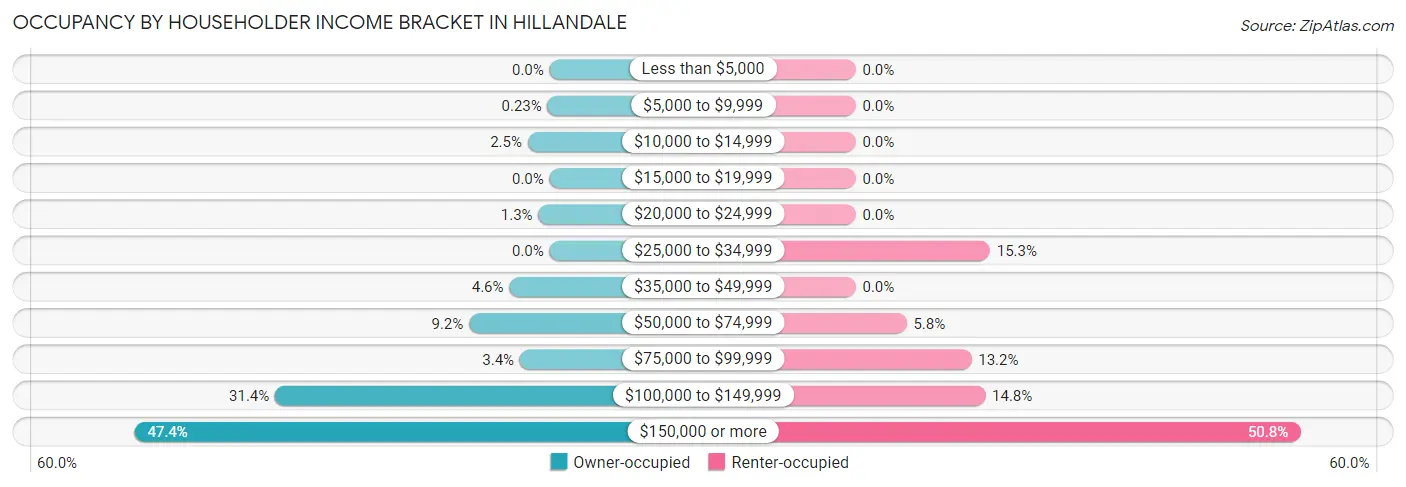
| Income Bracket | Owner-occupied | Renter-occupied |
| Less than $5,000 | 0 (0.0%) | 0 (0.0%) |
| $5,000 to $9,999 | 3 (0.2%) | 0 (0.0%) |
| $10,000 to $14,999 | 33 (2.5%) | 0 (0.0%) |
| $15,000 to $19,999 | 0 (0.0%) | 0 (0.0%) |
| $20,000 to $24,999 | 17 (1.3%) | 0 (0.0%) |
| $25,000 to $34,999 | 0 (0.0%) | 29 (15.3%) |
| $35,000 to $49,999 | 61 (4.6%) | 0 (0.0%) |
| $50,000 to $74,999 | 122 (9.2%) | 11 (5.8%) |
| $75,000 to $99,999 | 45 (3.4%) | 25 (13.2%) |
| $100,000 to $149,999 | 416 (31.4%) | 28 (14.8%) |
| $150,000 or more | 629 (47.4%) | 96 (50.8%) |
| Total | 1,326 (100.0%) | 189 (100.0%) |
Monthly Housing Cost Tiers in Hillandale
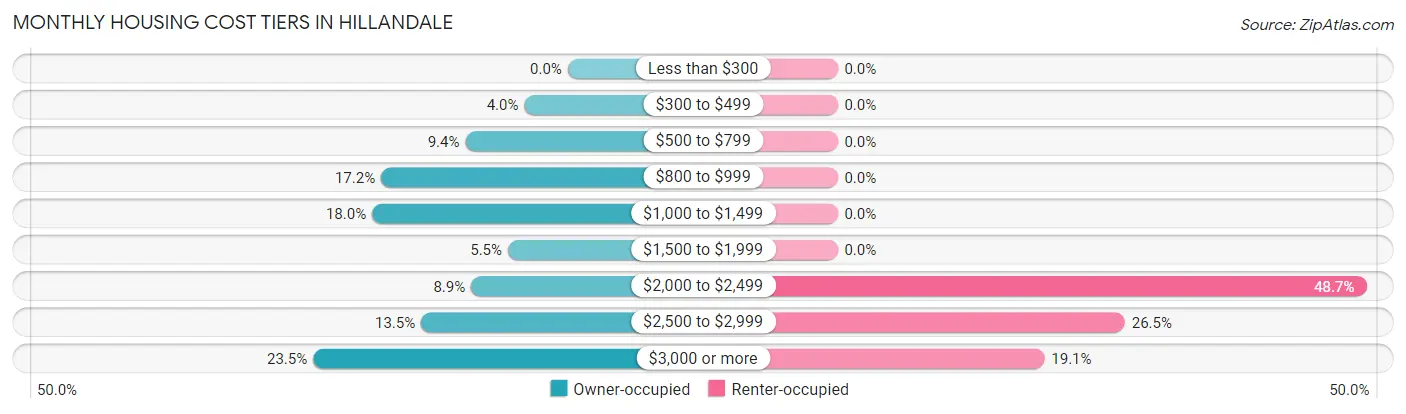
| Monthly Cost | Owner-occupied | Renter-occupied |
| Less than $300 | 0 (0.0%) | 0 (0.0%) |
| $300 to $499 | 53 (4.0%) | 0 (0.0%) |
| $500 to $799 | 125 (9.4%) | 0 (0.0%) |
| $800 to $999 | 228 (17.2%) | 0 (0.0%) |
| $1,000 to $1,499 | 239 (18.0%) | 0 (0.0%) |
| $1,500 to $1,999 | 73 (5.5%) | 0 (0.0%) |
| $2,000 to $2,499 | 118 (8.9%) | 92 (48.7%) |
| $2,500 to $2,999 | 179 (13.5%) | 50 (26.5%) |
| $3,000 or more | 311 (23.4%) | 36 (19.1%) |
| Total | 1,326 (100.0%) | 189 (100.0%) |
Physical Housing Characteristics in Hillandale
Housing Structures in Hillandale
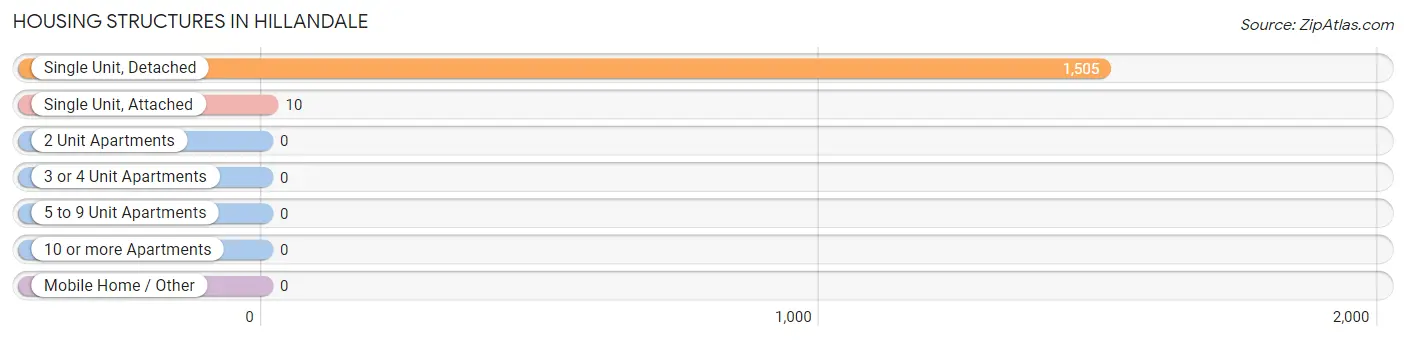
| Structure Type | # Housing Units | % Housing Units |
| Single Unit, Detached | 1,505 | 99.3% |
| Single Unit, Attached | 10 | 0.7% |
| 2 Unit Apartments | 0 | 0.0% |
| 3 or 4 Unit Apartments | 0 | 0.0% |
| 5 to 9 Unit Apartments | 0 | 0.0% |
| 10 or more Apartments | 0 | 0.0% |
| Mobile Home / Other | 0 | 0.0% |
| Total | 1,515 | 100.0% |
Housing Structures by Occupancy in Hillandale
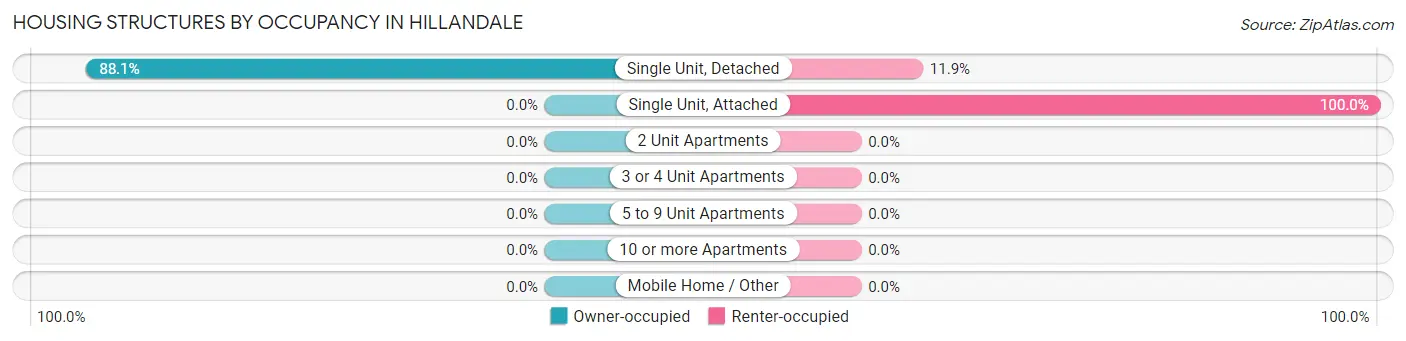
| Structure Type | Owner-occupied | Renter-occupied |
| Single Unit, Detached | 1,326 (88.1%) | 179 (11.9%) |
| Single Unit, Attached | 0 (0.0%) | 10 (100.0%) |
| 2 Unit Apartments | 0 (0.0%) | 0 (0.0%) |
| 3 or 4 Unit Apartments | 0 (0.0%) | 0 (0.0%) |
| 5 to 9 Unit Apartments | 0 (0.0%) | 0 (0.0%) |
| 10 or more Apartments | 0 (0.0%) | 0 (0.0%) |
| Mobile Home / Other | 0 (0.0%) | 0 (0.0%) |
| Total | 1,326 (87.5%) | 189 (12.5%) |
Housing Structures by Number of Rooms in Hillandale
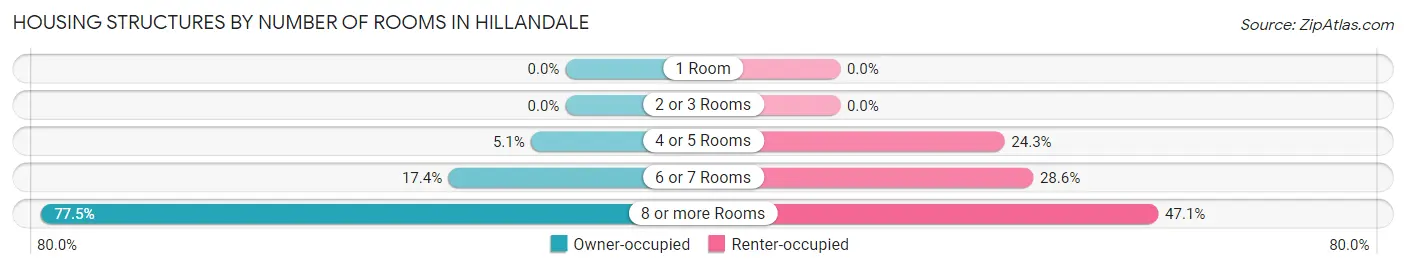
| Number of Rooms | Owner-occupied | Renter-occupied |
| 1 Room | 0 (0.0%) | 0 (0.0%) |
| 2 or 3 Rooms | 0 (0.0%) | 0 (0.0%) |
| 4 or 5 Rooms | 68 (5.1%) | 46 (24.3%) |
| 6 or 7 Rooms | 230 (17.3%) | 54 (28.6%) |
| 8 or more Rooms | 1,028 (77.5%) | 89 (47.1%) |
| Total | 1,326 (100.0%) | 189 (100.0%) |
Housing Structure by Heating Type in Hillandale
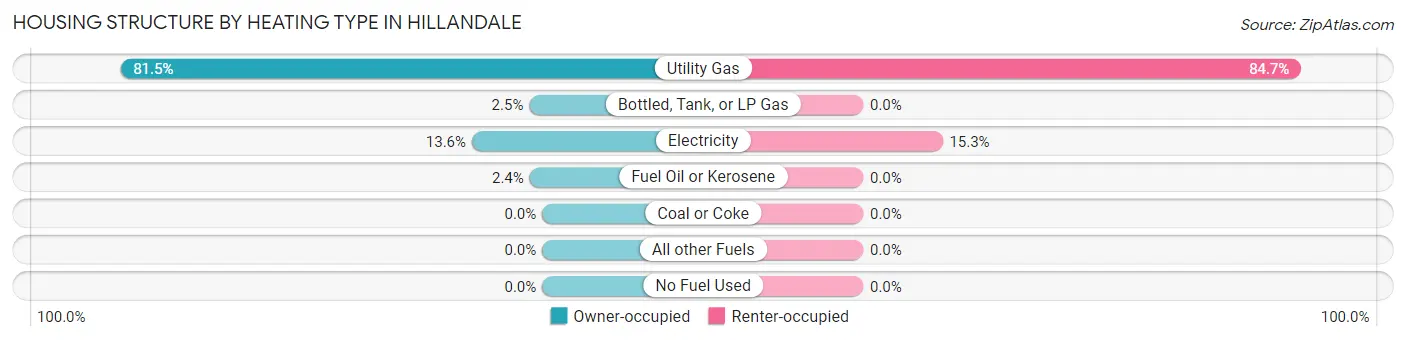
| Heating Type | Owner-occupied | Renter-occupied |
| Utility Gas | 1,081 (81.5%) | 160 (84.7%) |
| Bottled, Tank, or LP Gas | 33 (2.5%) | 0 (0.0%) |
| Electricity | 180 (13.6%) | 29 (15.3%) |
| Fuel Oil or Kerosene | 32 (2.4%) | 0 (0.0%) |
| Coal or Coke | 0 (0.0%) | 0 (0.0%) |
| All other Fuels | 0 (0.0%) | 0 (0.0%) |
| No Fuel Used | 0 (0.0%) | 0 (0.0%) |
| Total | 1,326 (100.0%) | 189 (100.0%) |
Household Vehicle Usage in Hillandale
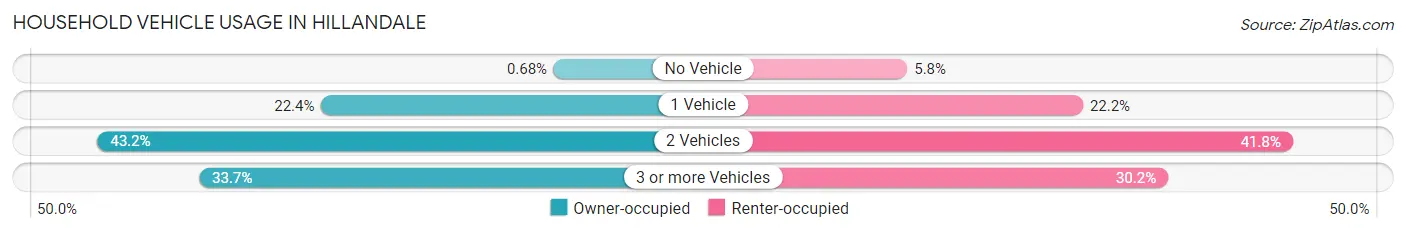
| Vehicles per Household | Owner-occupied | Renter-occupied |
| No Vehicle | 9 (0.7%) | 11 (5.8%) |
| 1 Vehicle | 297 (22.4%) | 42 (22.2%) |
| 2 Vehicles | 573 (43.2%) | 79 (41.8%) |
| 3 or more Vehicles | 447 (33.7%) | 57 (30.2%) |
| Total | 1,326 (100.0%) | 189 (100.0%) |
Real Estate & Mortgages in Hillandale
Real Estate and Mortgage Overview in Hillandale
| Characteristic | Without Mortgage | With Mortgage |
| Housing Units | 576 | 750 |
| Median Property Value | $478,200 | $504,500 |
| Median Household Income | $116,117 | $499 |
| Monthly Housing Costs | $937 | $311 |
| Real Estate Taxes | $5,593 | $0 |
Property Value by Mortgage Status in Hillandale
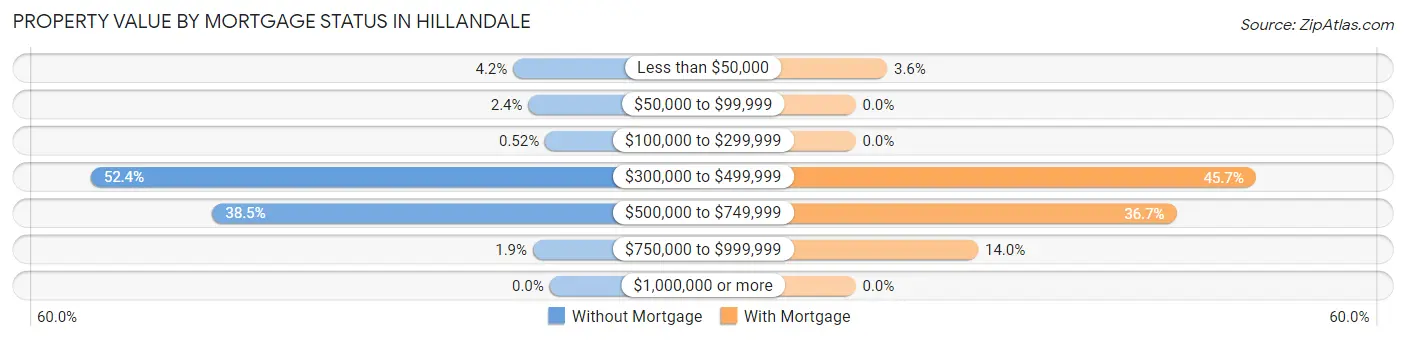
| Property Value | Without Mortgage | With Mortgage |
| Less than $50,000 | 24 (4.2%) | 27 (3.6%) |
| $50,000 to $99,999 | 14 (2.4%) | 0 (0.0%) |
| $100,000 to $299,999 | 3 (0.5%) | 0 (0.0%) |
| $300,000 to $499,999 | 302 (52.4%) | 343 (45.7%) |
| $500,000 to $749,999 | 222 (38.5%) | 275 (36.7%) |
| $750,000 to $999,999 | 11 (1.9%) | 105 (14.0%) |
| $1,000,000 or more | 0 (0.0%) | 0 (0.0%) |
| Total | 576 (100.0%) | 750 (100.0%) |
Household Income by Mortgage Status in Hillandale
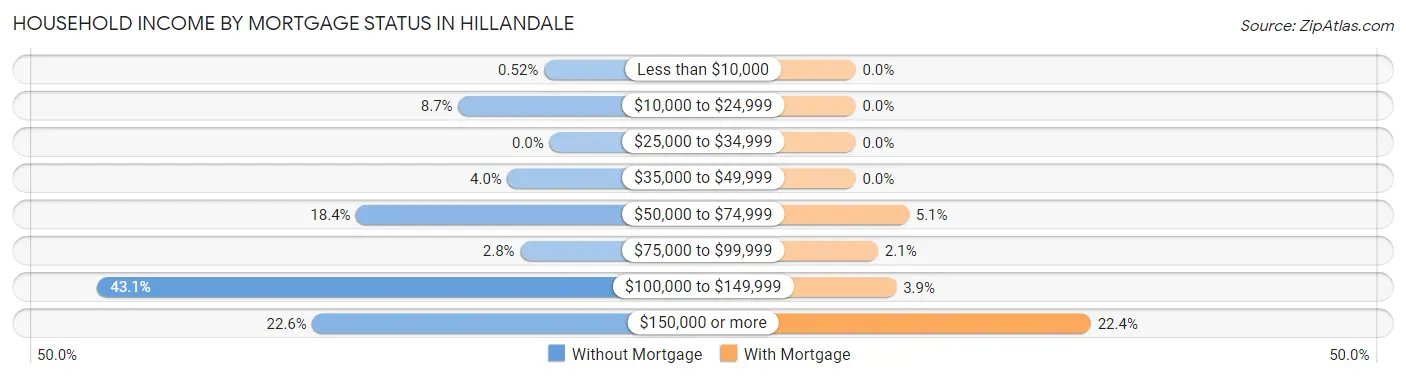
| Household Income | Without Mortgage | With Mortgage |
| Less than $10,000 | 3 (0.5%) | 0 (0.0%) |
| $10,000 to $24,999 | 50 (8.7%) | 0 (0.0%) |
| $25,000 to $34,999 | 0 (0.0%) | 0 (0.0%) |
| $35,000 to $49,999 | 23 (4.0%) | 0 (0.0%) |
| $50,000 to $74,999 | 106 (18.4%) | 38 (5.1%) |
| $75,000 to $99,999 | 16 (2.8%) | 16 (2.1%) |
| $100,000 to $149,999 | 248 (43.1%) | 29 (3.9%) |
| $150,000 or more | 130 (22.6%) | 168 (22.4%) |
| Total | 576 (100.0%) | 750 (100.0%) |
Property Value to Household Income Ratio in Hillandale
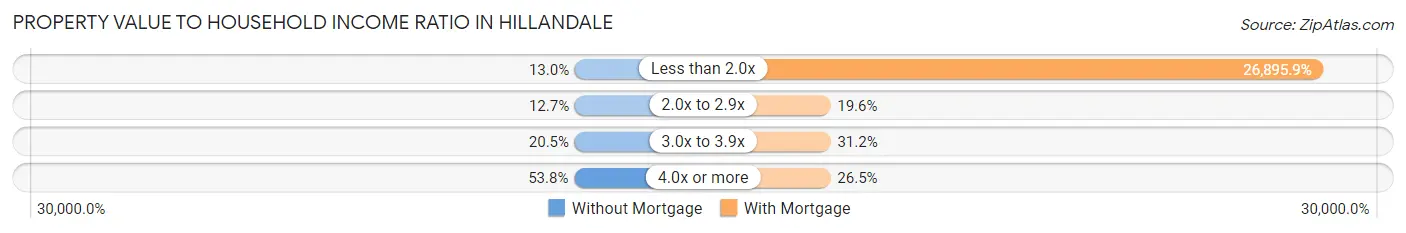
| Value-to-Income Ratio | Without Mortgage | With Mortgage |
| Less than 2.0x | 75 (13.0%) | 201,719 (26,895.9%) |
| 2.0x to 2.9x | 73 (12.7%) | 147 (19.6%) |
| 3.0x to 3.9x | 118 (20.5%) | 234 (31.2%) |
| 4.0x or more | 310 (53.8%) | 199 (26.5%) |
| Total | 576 (100.0%) | 750 (100.0%) |
Real Estate Taxes by Mortgage Status in Hillandale
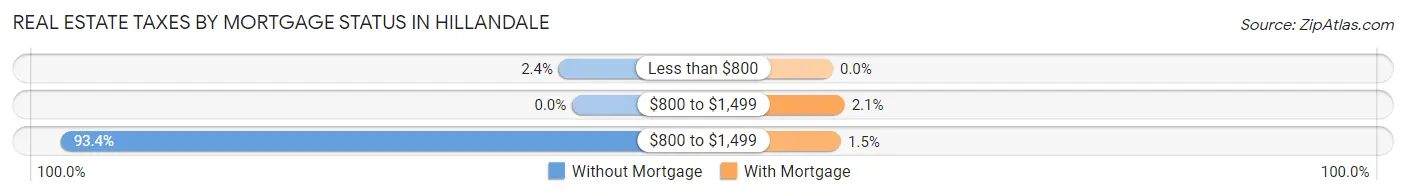
| Property Taxes | Without Mortgage | With Mortgage |
| Less than $800 | 14 (2.4%) | 0 (0.0%) |
| $800 to $1,499 | 0 (0.0%) | 16 (2.1%) |
| $800 to $1,499 | 538 (93.4%) | 11 (1.5%) |
| Total | 576 (100.0%) | 750 (100.0%) |
Health & Disability in Hillandale
Health Insurance Coverage by Age in Hillandale
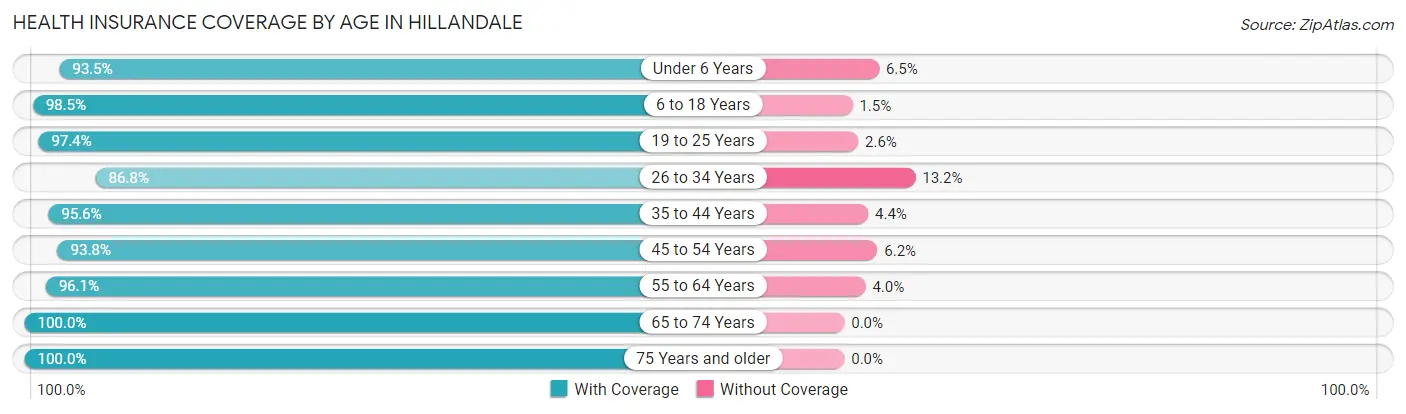
| Age Bracket | With Coverage | Without Coverage |
| Under 6 Years | 419 (93.5%) | 29 (6.5%) |
| 6 to 18 Years | 584 (98.5%) | 9 (1.5%) |
| 19 to 25 Years | 455 (97.4%) | 12 (2.6%) |
| 26 to 34 Years | 557 (86.8%) | 85 (13.2%) |
| 35 to 44 Years | 516 (95.6%) | 24 (4.4%) |
| 45 to 54 Years | 594 (93.8%) | 39 (6.2%) |
| 55 to 64 Years | 584 (96.1%) | 24 (4.0%) |
| 65 to 74 Years | 691 (100.0%) | 0 (0.0%) |
| 75 Years and older | 368 (100.0%) | 0 (0.0%) |
| Total | 4,768 (95.6%) | 222 (4.4%) |
Health Insurance Coverage by Citizenship Status in Hillandale
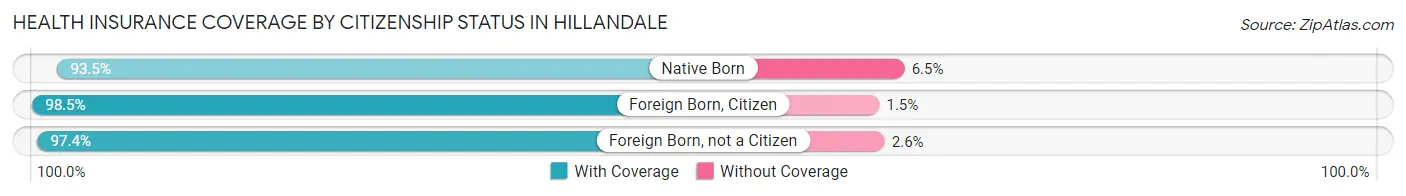
| Citizenship Status | With Coverage | Without Coverage |
| Native Born | 419 (93.5%) | 29 (6.5%) |
| Foreign Born, Citizen | 584 (98.5%) | 9 (1.5%) |
| Foreign Born, not a Citizen | 455 (97.4%) | 12 (2.6%) |
Health Insurance Coverage by Household Income in Hillandale
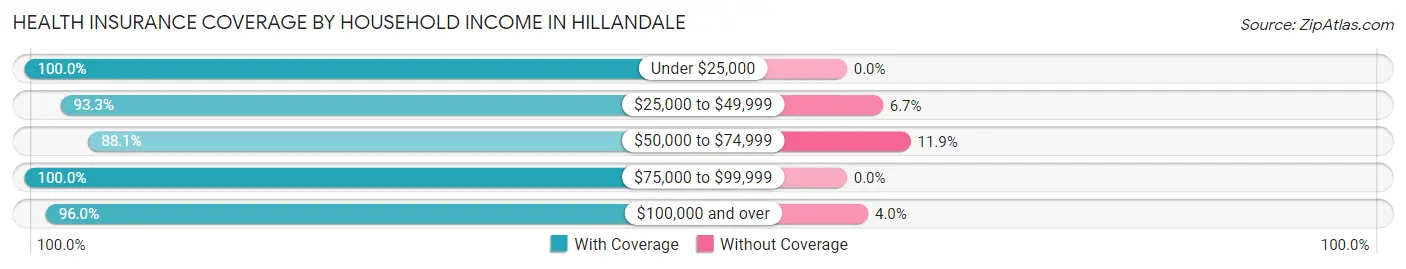
| Household Income | With Coverage | Without Coverage |
| Under $25,000 | 53 (100.0%) | 0 (0.0%) |
| $25,000 to $49,999 | 249 (93.3%) | 18 (6.7%) |
| $50,000 to $74,999 | 177 (88.1%) | 24 (11.9%) |
| $75,000 to $99,999 | 159 (100.0%) | 0 (0.0%) |
| $100,000 and over | 4,078 (96.0%) | 169 (4.0%) |
Public vs Private Health Insurance Coverage by Age in Hillandale
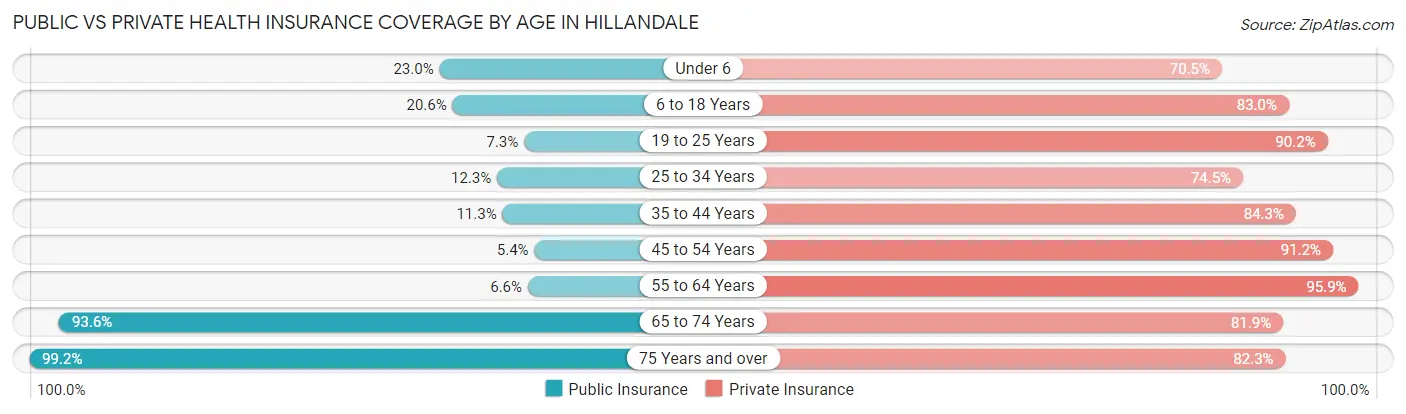
| Age Bracket | Public Insurance | Private Insurance |
| Under 6 | 103 (23.0%) | 316 (70.5%) |
| 6 to 18 Years | 122 (20.6%) | 492 (83.0%) |
| 19 to 25 Years | 34 (7.3%) | 421 (90.1%) |
| 25 to 34 Years | 79 (12.3%) | 478 (74.5%) |
| 35 to 44 Years | 61 (11.3%) | 455 (84.3%) |
| 45 to 54 Years | 34 (5.4%) | 577 (91.1%) |
| 55 to 64 Years | 40 (6.6%) | 583 (95.9%) |
| 65 to 74 Years | 647 (93.6%) | 566 (81.9%) |
| 75 Years and over | 365 (99.2%) | 303 (82.3%) |
| Total | 1,485 (29.8%) | 4,191 (84.0%) |
Disability Status by Sex by Age in Hillandale
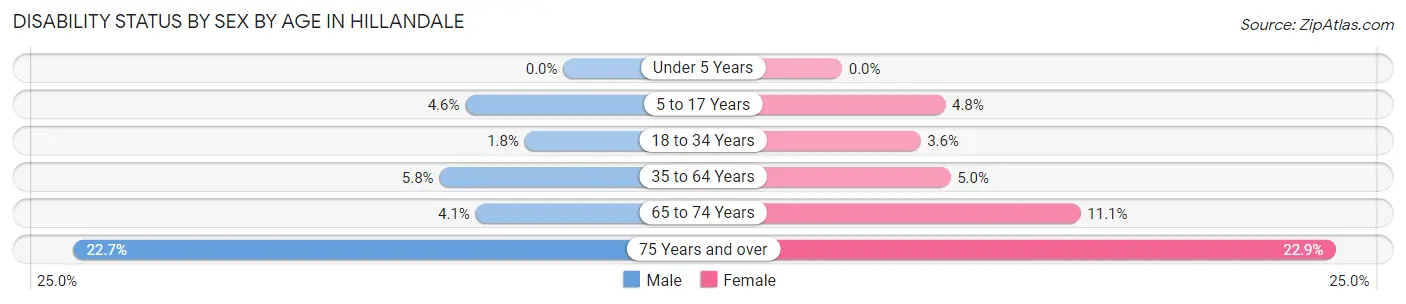
| Age Bracket | Male | Female |
| Under 5 Years | 0 (0.0%) | 0 (0.0%) |
| 5 to 17 Years | 13 (4.5%) | 15 (4.8%) |
| 18 to 34 Years | 11 (1.8%) | 20 (3.6%) |
| 35 to 64 Years | 51 (5.8%) | 45 (5.0%) |
| 65 to 74 Years | 16 (4.1%) | 33 (11.1%) |
| 75 Years and over | 35 (22.7%) | 49 (22.9%) |
Disability Class by Sex by Age in Hillandale
Disability Class: Hearing Difficulty
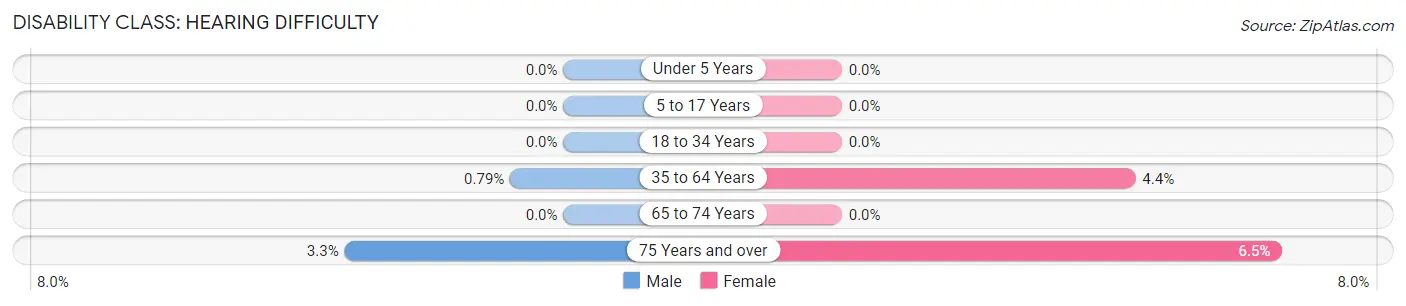
| Age Bracket | Male | Female |
| Under 5 Years | 0 (0.0%) | 0 (0.0%) |
| 5 to 17 Years | 0 (0.0%) | 0 (0.0%) |
| 18 to 34 Years | 0 (0.0%) | 0 (0.0%) |
| 35 to 64 Years | 7 (0.8%) | 39 (4.4%) |
| 65 to 74 Years | 0 (0.0%) | 0 (0.0%) |
| 75 Years and over | 5 (3.3%) | 14 (6.5%) |
Disability Class: Vision Difficulty
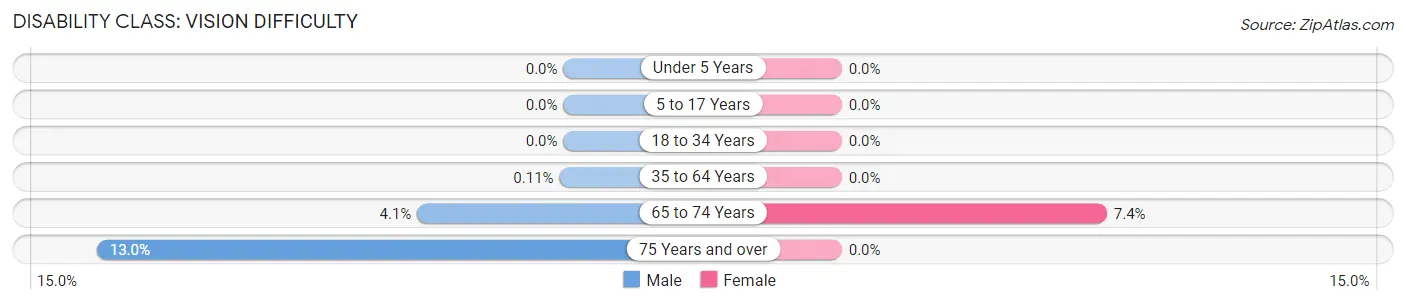
| Age Bracket | Male | Female |
| Under 5 Years | 0 (0.0%) | 0 (0.0%) |
| 5 to 17 Years | 0 (0.0%) | 0 (0.0%) |
| 18 to 34 Years | 0 (0.0%) | 0 (0.0%) |
| 35 to 64 Years | 1 (0.1%) | 0 (0.0%) |
| 65 to 74 Years | 16 (4.1%) | 22 (7.4%) |
| 75 Years and over | 20 (13.0%) | 0 (0.0%) |
Disability Class: Cognitive Difficulty
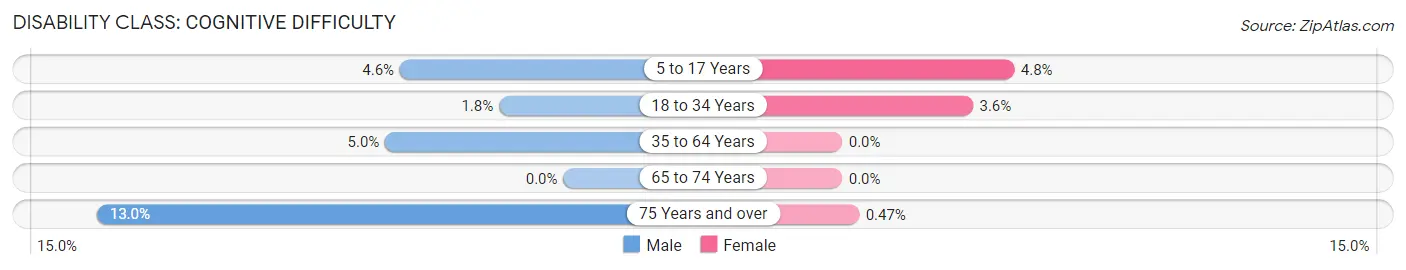
| Age Bracket | Male | Female |
| 5 to 17 Years | 13 (4.5%) | 15 (4.8%) |
| 18 to 34 Years | 11 (1.8%) | 20 (3.6%) |
| 35 to 64 Years | 44 (5.0%) | 0 (0.0%) |
| 65 to 74 Years | 0 (0.0%) | 0 (0.0%) |
| 75 Years and over | 20 (13.0%) | 1 (0.5%) |
Disability Class: Ambulatory Difficulty
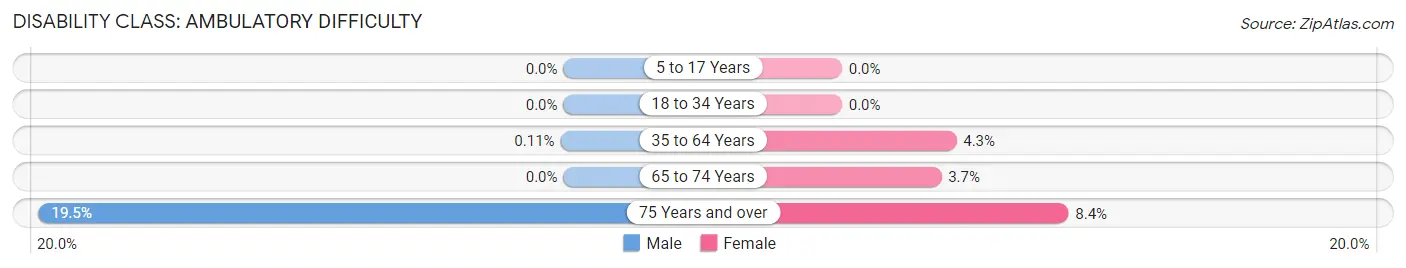
| Age Bracket | Male | Female |
| 5 to 17 Years | 0 (0.0%) | 0 (0.0%) |
| 18 to 34 Years | 0 (0.0%) | 0 (0.0%) |
| 35 to 64 Years | 1 (0.1%) | 38 (4.3%) |
| 65 to 74 Years | 0 (0.0%) | 11 (3.7%) |
| 75 Years and over | 30 (19.5%) | 18 (8.4%) |
Disability Class: Self-Care Difficulty
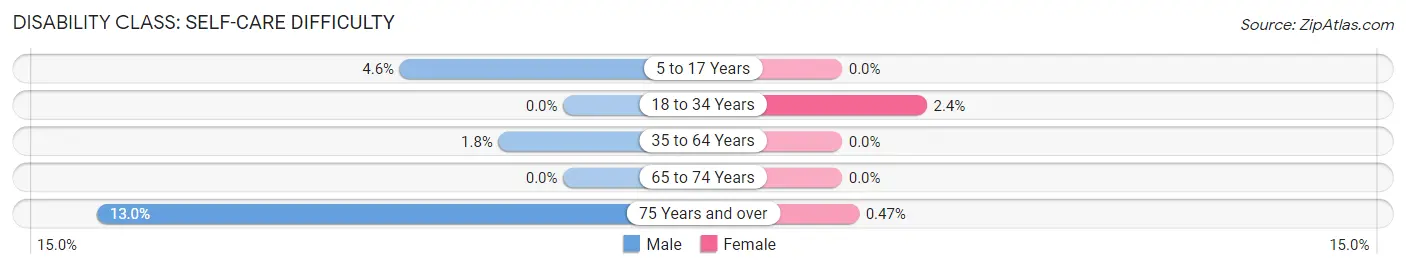
| Age Bracket | Male | Female |
| 5 to 17 Years | 13 (4.5%) | 0 (0.0%) |
| 18 to 34 Years | 0 (0.0%) | 13 (2.4%) |
| 35 to 64 Years | 16 (1.8%) | 0 (0.0%) |
| 65 to 74 Years | 0 (0.0%) | 0 (0.0%) |
| 75 Years and over | 20 (13.0%) | 1 (0.5%) |
Technology Access in Hillandale
Computing Device Access in Hillandale
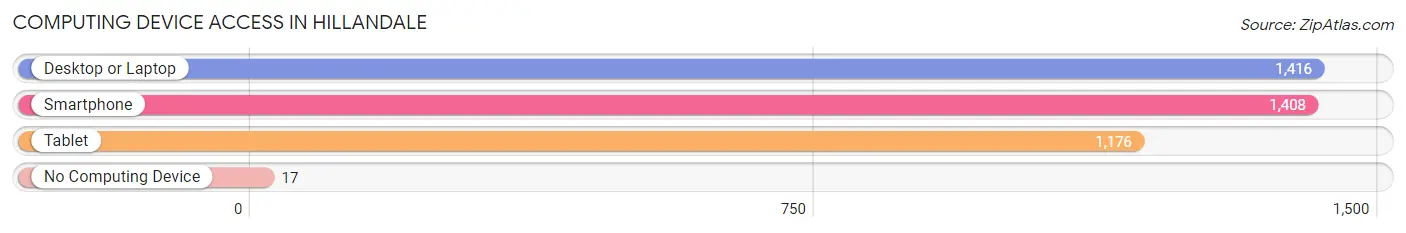
| Device Type | # Households | % Households |
| Desktop or Laptop | 1,416 | 93.5% |
| Smartphone | 1,408 | 92.9% |
| Tablet | 1,176 | 77.6% |
| No Computing Device | 17 | 1.1% |
| Total | 1,515 | 100.0% |
Internet Access in Hillandale
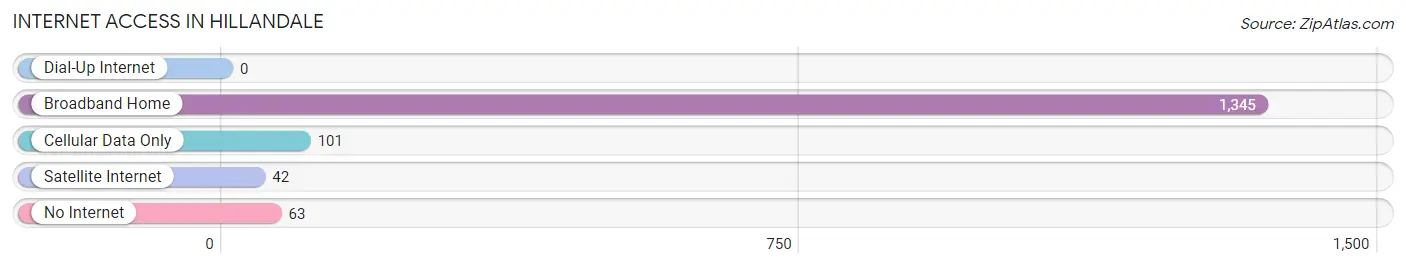
| Internet Type | # Households | % Households |
| Dial-Up Internet | 0 | 0.0% |
| Broadband Home | 1,345 | 88.8% |
| Cellular Data Only | 101 | 6.7% |
| Satellite Internet | 42 | 2.8% |
| No Internet | 63 | 4.2% |
| Total | 1,515 | 100.0% |
Hillandale Summary
Hillandale is a census-designated place (CDP) located in Montgomery County, Maryland, United States. It is situated in the northern part of the county, just south of the city of Rockville. As of the 2010 census, the population of Hillandale was 8,845.
History
The area that is now Hillandale was first settled in the late 1700s by the Hill family, who owned a large tract of land in the area. The family built a large house on the property, which was later used as a schoolhouse. The area was known as Hill’s Dale until the early 1900s, when it was changed to Hillandale.
In the early 1900s, the area was mostly farmland, with a few small businesses. In the 1950s, the area began to experience rapid growth as the Washington, D.C. metropolitan area expanded. The area was annexed by the city of Rockville in 1954, and the population of Hillandale began to grow rapidly.
Geography
Hillandale is located at 39°3'25" North, 77°9'25" West (39.056944, -77.156944). It is situated in the northern part of Montgomery County, just south of the city of Rockville. The area is bordered by the city of Rockville to the north, the city of Gaithersburg to the east, and the city of Silver Spring to the south.
The total area of Hillandale is 2.2 square miles, all of which is land. The terrain is mostly flat, with some rolling hills. The area is located in the Piedmont region of Maryland, and is part of the Atlantic Coastal Plain.
Economy
The economy of Hillandale is largely based on the service industry. The area is home to a number of restaurants, retail stores, and other businesses. The area is also home to a number of corporate offices, including those of Marriott International, Lockheed Martin, and the National Institutes of Health.
Demographics
As of the 2010 census, there were 8,845 people, 3,541 households, and 2,092 families residing in Hillandale. The population density was 4,039.3 people per square mile. The racial makeup of the area was 57.2% White, 22.3% African American, 0.4% Native American, 11.2% Asian, 0.1% Pacific Islander, 5.2% from other races, and 3.7% from two or more races. Hispanic or Latino of any race were 11.3% of the population.
The median income for a household in Hillandale was $76,945, and the median income for a family was $90,945. The per capita income for the area was $35,945. About 4.2% of families and 6.2% of the population were below the poverty line, including 8.2% of those under age 18 and 4.2% of those age 65 or over.
Common Questions
What is Per Capita Income in Hillandale?
Per Capita income in Hillandale is $52,880.
What is the Median Family Income in Hillandale?
Median Family Income in Hillandale is $151,912.
What is the Median Household income in Hillandale?
Median Household Income in Hillandale is $144,018.
What is Income or Wage Gap in Hillandale?
Income or Wage Gap in Hillandale is 28.8%.
Women in Hillandale earn 71.2 cents for every dollar earned by a man.
What is Inequality or Gini Index in Hillandale?
Inequality or Gini Index in Hillandale is 0.33.
What is the Total Population of Hillandale?
Total Population of Hillandale is 5,002.
What is the Total Male Population of Hillandale?
Total Male Population of Hillandale is 2,506.
What is the Total Female Population of Hillandale?
Total Female Population of Hillandale is 2,496.
What is the Ratio of Males per 100 Females in Hillandale?
There are 100.40 Males per 100 Females in Hillandale.
What is the Ratio of Females per 100 Males in Hillandale?
There are 99.60 Females per 100 Males in Hillandale.
What is the Median Population Age in Hillandale?
Median Population Age in Hillandale is 39.0 Years.
What is the Average Family Size in Hillandale
Average Family Size in Hillandale is 3.7 People.
What is the Average Household Size in Hillandale
Average Household Size in Hillandale is 3.3 People.
How Large is the Labor Force in Hillandale?
There are 3,073 People in the Labor Forcein in Hillandale.
What is the Percentage of People in the Labor Force in Hillandale?
74.3% of People are in the Labor Force in Hillandale.
What is the Unemployment Rate in Hillandale?
Unemployment Rate in Hillandale is 7.9%.