Sausal, NM Map & Demographics
Sausal Map
Sausal Overview
$25,276
PER CAPITA INCOME
$71,875
AVG FAMILY INCOME
0.35
INEQUALITY / GINI INDEX
497
TOTAL POPULATION
324
MALE POPULATION
173
FEMALE POPULATION
187.28
MALES / 100 FEMALES
53.40
FEMALES / 100 MALES
48.3
MEDIAN AGE
4.5
AVG FAMILY SIZE
2.7
AVG HOUSEHOLD SIZE
236
LABOR FORCE [ PEOPLE ]
47.5%
PERCENT IN LABOR FORCE
19.5%
UNEMPLOYMENT RATE
Income in Sausal
Income Overview in Sausal
| Characteristic | Number | Measure |
| Per Capita Income | 497 | $25,276 |
| Median Family Income | 67 | $71,875 |
| Mean Family Income | 67 | $79,778 |
| Median Household Income | 185 | $0 |
| Mean Household Income | 185 | $64,048 |
| Income Deficit | 67 | $0 |
| Wage / Income Gap (%) | 497 | 0.00% |
| Wage / Income Gap ($) | 497 | 100.00¢ per $1 |
| Gini / Inequality Index | 497 | 0.35 |
Earnings by Sex in Sausal
| Sex | Number | Average Earnings |
| Male | 146 (76.8%) | $0 |
| Female | 44 (23.2%) | $0 |
| Total | 190 (100.0%) | $0 |
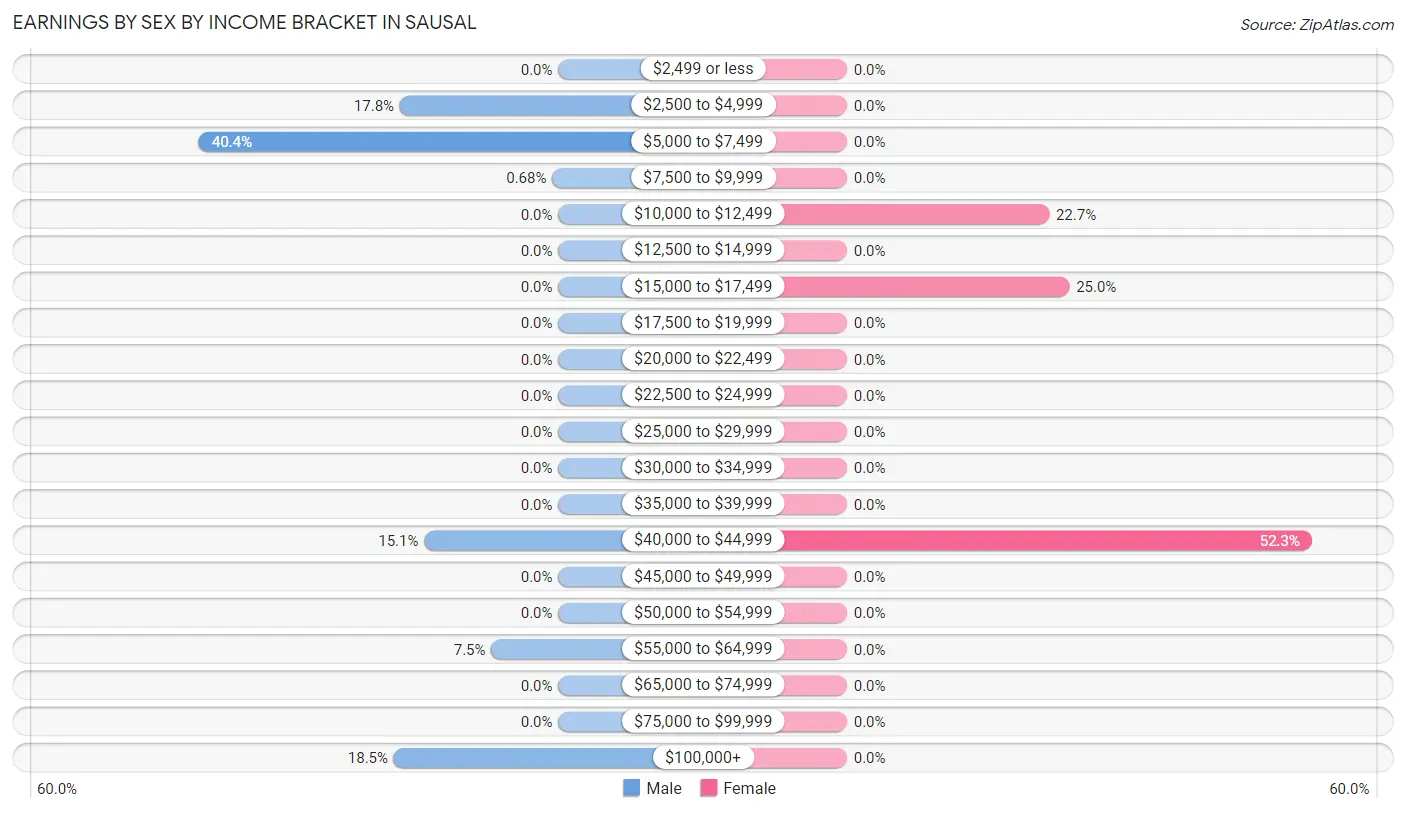
Earnings by Sex by Income Bracket in Sausal
The most common earnings brackets in Sausal are $5,000 to $7,499 for men (59 | 40.4%) and $40,000 to $44,999 for women (23 | 52.3%).
| Income | Male | Female |
| $2,499 or less | 0 (0.0%) | 0 (0.0%) |
| $2,500 to $4,999 | 26 (17.8%) | 0 (0.0%) |
| $5,000 to $7,499 | 59 (40.4%) | 0 (0.0%) |
| $7,500 to $9,999 | 1 (0.7%) | 0 (0.0%) |
| $10,000 to $12,499 | 0 (0.0%) | 10 (22.7%) |
| $12,500 to $14,999 | 0 (0.0%) | 0 (0.0%) |
| $15,000 to $17,499 | 0 (0.0%) | 11 (25.0%) |
| $17,500 to $19,999 | 0 (0.0%) | 0 (0.0%) |
| $20,000 to $22,499 | 0 (0.0%) | 0 (0.0%) |
| $22,500 to $24,999 | 0 (0.0%) | 0 (0.0%) |
| $25,000 to $29,999 | 0 (0.0%) | 0 (0.0%) |
| $30,000 to $34,999 | 0 (0.0%) | 0 (0.0%) |
| $35,000 to $39,999 | 0 (0.0%) | 0 (0.0%) |
| $40,000 to $44,999 | 22 (15.1%) | 23 (52.3%) |
| $45,000 to $49,999 | 0 (0.0%) | 0 (0.0%) |
| $50,000 to $54,999 | 0 (0.0%) | 0 (0.0%) |
| $55,000 to $64,999 | 11 (7.5%) | 0 (0.0%) |
| $65,000 to $74,999 | 0 (0.0%) | 0 (0.0%) |
| $75,000 to $99,999 | 0 (0.0%) | 0 (0.0%) |
| $100,000+ | 27 (18.5%) | 0 (0.0%) |
| Total | 146 (100.0%) | 44 (100.0%) |
Earnings by Sex by Educational Attainment in Sausal
| Educational Attainment | Male Income | Female Income |
| Less than High School | - | - |
| High School Diploma | - | - |
| College or Associate's Degree | - | - |
| Bachelor's Degree | - | - |
| Graduate Degree | - | - |
| Total | - | - |
Family Income in Sausal
Family Income Brackets in Sausal
According to the Sausal family income data, there are 31 families falling into the $100,000 to $149,999 income range, which is the most common income bracket and makes up 46.3% of all families.
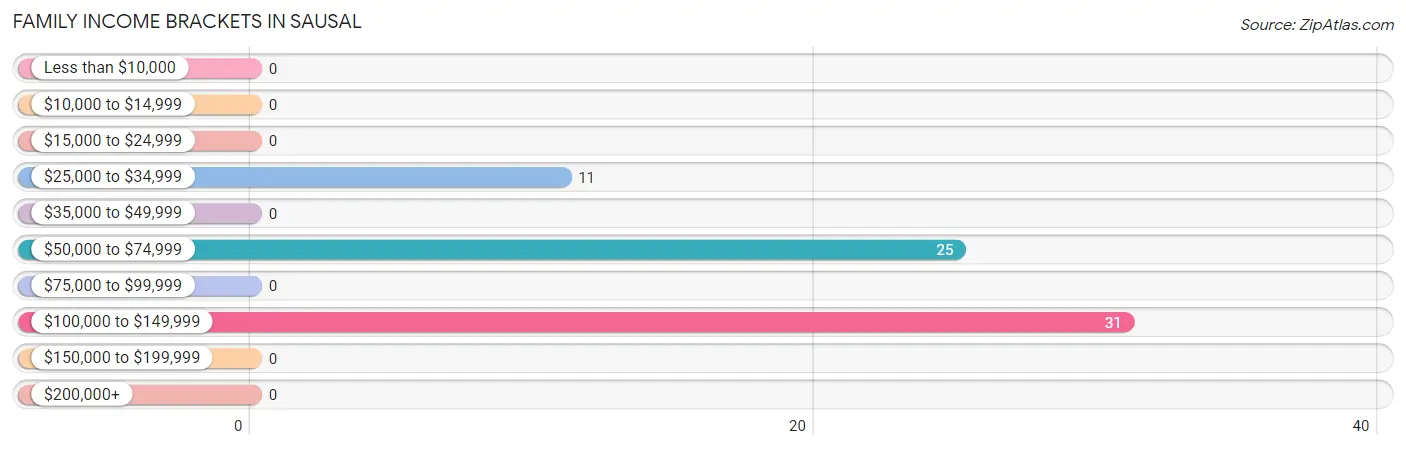
| Income Bracket | # Families | % Families |
| Less than $10,000 | 0 | 0.0% |
| $10,000 to $14,999 | 0 | 0.0% |
| $15,000 to $24,999 | 0 | 0.0% |
| $25,000 to $34,999 | 11 | 16.4% |
| $35,000 to $49,999 | 0 | 0.0% |
| $50,000 to $74,999 | 25 | 37.3% |
| $75,000 to $99,999 | 0 | 0.0% |
| $100,000 to $149,999 | 31 | 46.3% |
| $150,000 to $199,999 | 0 | 0.0% |
| $200,000+ | 0 | 0.0% |
Family Income by Famaliy Size in Sausal
2-person families (44 | 65.7%) account for the highest median family income in Sausal with $59,333 per family, while 2-person families (44 | 65.7%) have the highest median income of $29,666 per family member.
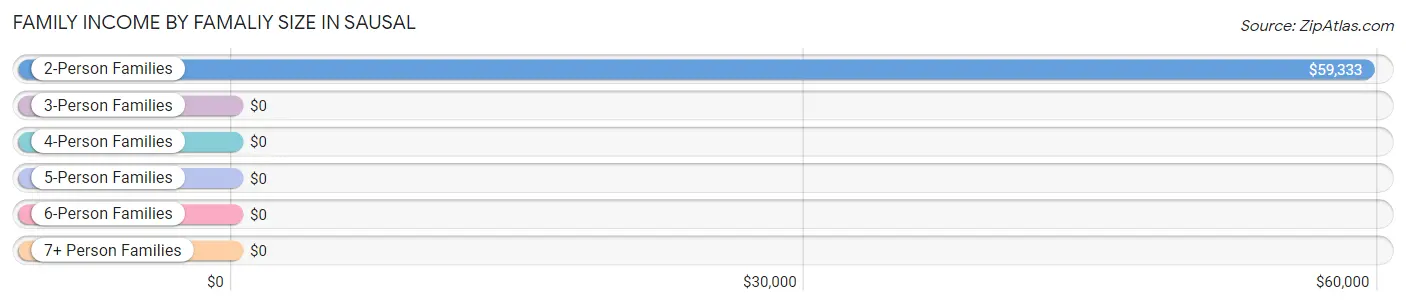
| Income Bracket | # Families | Median Income |
| 2-Person Families | 44 (65.7%) | $59,333 |
| 3-Person Families | 0 (0.0%) | $0 |
| 4-Person Families | 0 (0.0%) | $0 |
| 5-Person Families | 0 (0.0%) | $0 |
| 6-Person Families | 0 (0.0%) | $0 |
| 7+ Person Families | 23 (34.3%) | $0 |
| Total | 67 (100.0%) | $71,875 |
Family Income by Number of Earners in Sausal
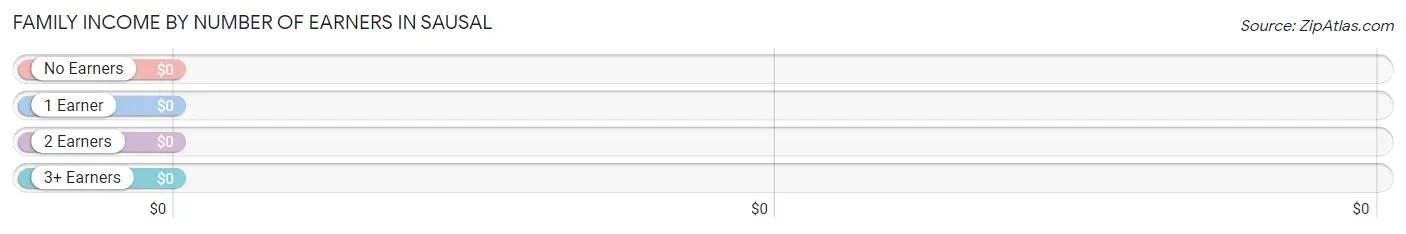
| Number of Earners | # Families | Median Income |
| No Earners | 23 (34.3%) | $0 |
| 1 Earner | 11 (16.4%) | $0 |
| 2 Earners | 10 (14.9%) | $0 |
| 3+ Earners | 23 (34.3%) | $0 |
| Total | 67 (100.0%) | $71,875 |
Household Income in Sausal
Household Income Brackets in Sausal
With 59 households falling in the category, the $35,000 to $49,999 income range is the most frequent in Sausal, accounting for 31.9% of all households.
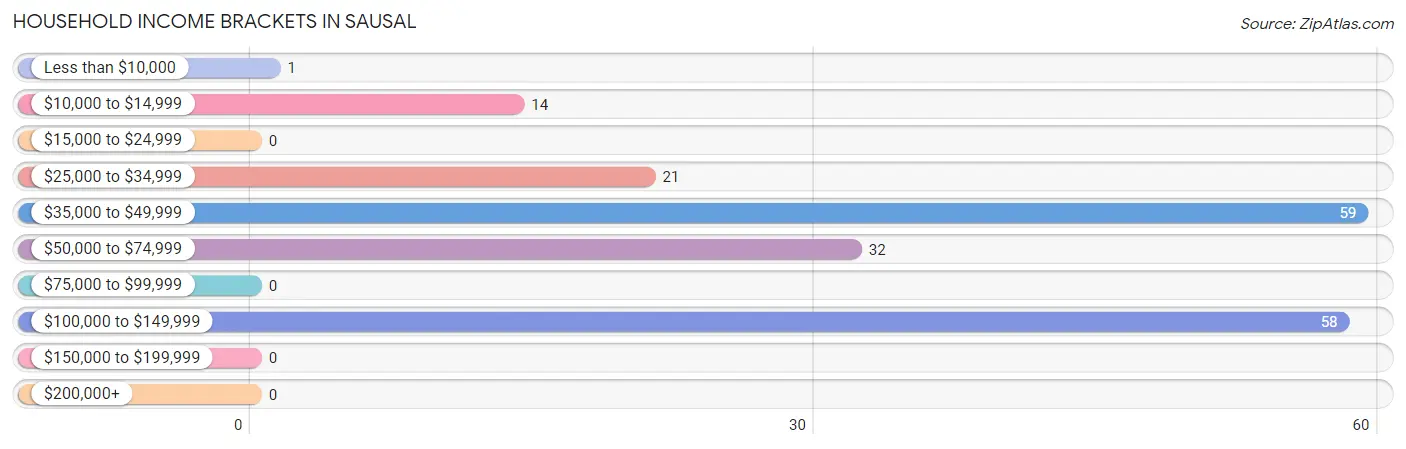
| Income Bracket | # Households | % Households |
| Less than $10,000 | 1 | 0.5% |
| $10,000 to $14,999 | 14 | 7.6% |
| $15,000 to $24,999 | 0 | 0.0% |
| $25,000 to $34,999 | 21 | 11.4% |
| $35,000 to $49,999 | 59 | 31.9% |
| $50,000 to $74,999 | 32 | 17.3% |
| $75,000 to $99,999 | 0 | 0.0% |
| $100,000 to $149,999 | 58 | 31.4% |
| $150,000 to $199,999 | 0 | 0.0% |
| $200,000+ | 0 | 0.0% |
Household Income by Householder Age in Sausal
The median household income in Sausal is $0, with the highest median household income of $108,859 found in the 45 to 64 years age bracket for the primary householder. A total of 75 households (40.5%) fall into this category.
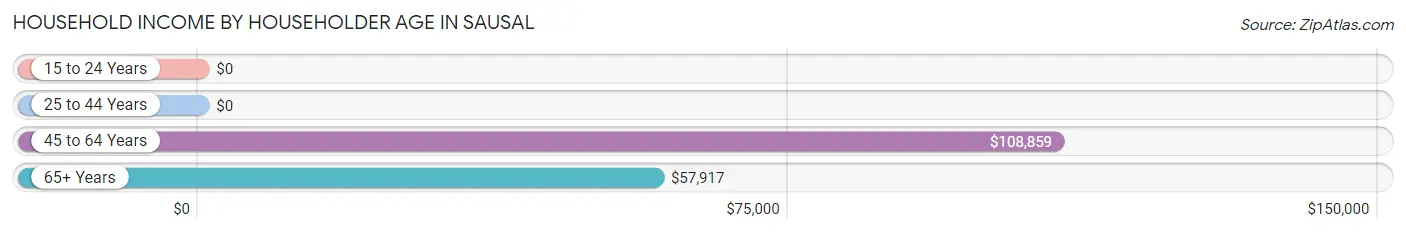
| Income Bracket | # Households | Median Income |
| 15 to 24 Years | 0 (0.0%) | $0 |
| 25 to 44 Years | 69 (37.3%) | $0 |
| 45 to 64 Years | 75 (40.5%) | $108,859 |
| 65+ Years | 41 (22.2%) | $57,917 |
| Total | 185 (100.0%) | $0 |
Poverty in Sausal
Income Below Poverty by Sex and Age in Sausal
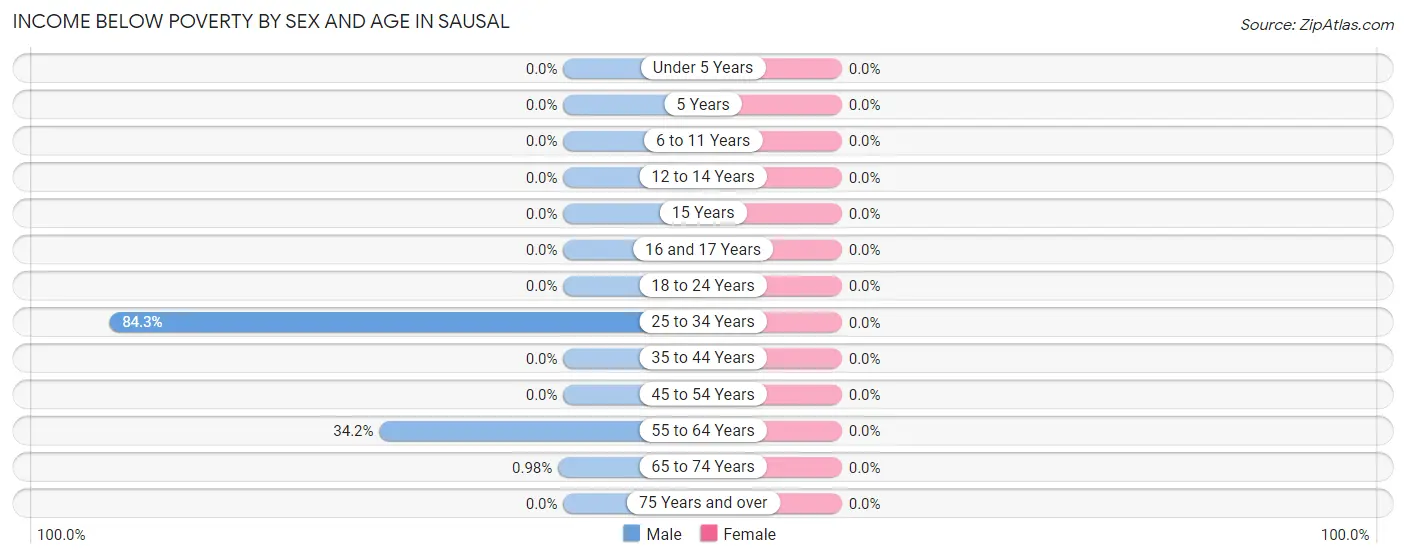
| Age Bracket | Male | Female |
| Under 5 Years | 0 (0.0%) | 0 (0.0%) |
| 5 Years | 0 (0.0%) | 0 (0.0%) |
| 6 to 11 Years | 0 (0.0%) | 0 (0.0%) |
| 12 to 14 Years | 0 (0.0%) | 0 (0.0%) |
| 15 Years | 0 (0.0%) | 0 (0.0%) |
| 16 and 17 Years | 0 (0.0%) | 0 (0.0%) |
| 18 to 24 Years | 0 (0.0%) | 0 (0.0%) |
| 25 to 34 Years | 59 (84.3%) | 0 (0.0%) |
| 35 to 44 Years | 0 (0.0%) | 0 (0.0%) |
| 45 to 54 Years | 0 (0.0%) | 0 (0.0%) |
| 55 to 64 Years | 14 (34.2%) | 0 (0.0%) |
| 65 to 74 Years | 1 (1.0%) | 0 (0.0%) |
| 75 Years and over | 0 (0.0%) | 0 (0.0%) |
| Total | 74 (22.8%) | 0 (0.0%) |
Income Above Poverty by Sex and Age in Sausal
According to the poverty statistics in Sausal, males aged 18 to 24 years and females aged 18 to 24 years are the age groups that are most secure financially, with 100.0% of males and 100.0% of females in these age groups living above the poverty line.
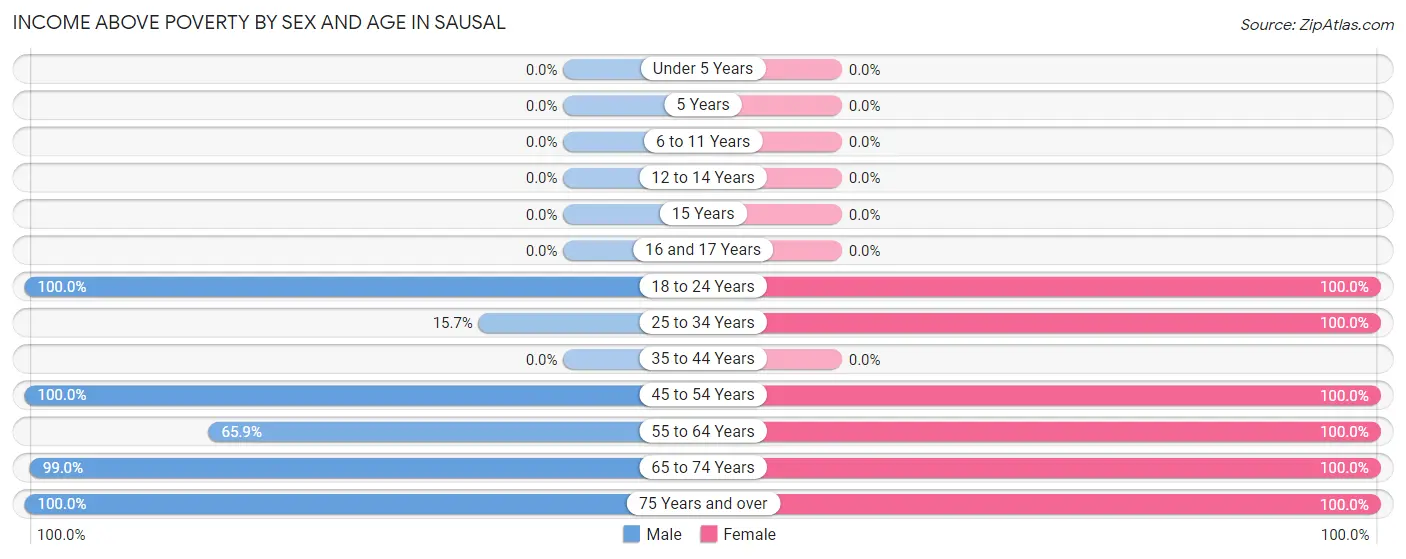
| Age Bracket | Male | Female |
| Under 5 Years | 0 (0.0%) | 0 (0.0%) |
| 5 Years | 0 (0.0%) | 0 (0.0%) |
| 6 to 11 Years | 0 (0.0%) | 0 (0.0%) |
| 12 to 14 Years | 0 (0.0%) | 0 (0.0%) |
| 15 Years | 0 (0.0%) | 0 (0.0%) |
| 16 and 17 Years | 0 (0.0%) | 0 (0.0%) |
| 18 to 24 Years | 72 (100.0%) | 68 (100.0%) |
| 25 to 34 Years | 11 (15.7%) | 10 (100.0%) |
| 35 to 44 Years | 0 (0.0%) | 0 (0.0%) |
| 45 to 54 Years | 22 (100.0%) | 23 (100.0%) |
| 55 to 64 Years | 27 (65.8%) | 11 (100.0%) |
| 65 to 74 Years | 101 (99.0%) | 55 (100.0%) |
| 75 Years and over | 17 (100.0%) | 6 (100.0%) |
| Total | 250 (77.2%) | 173 (100.0%) |
Income Below Poverty Among Married-Couple Families in Sausal
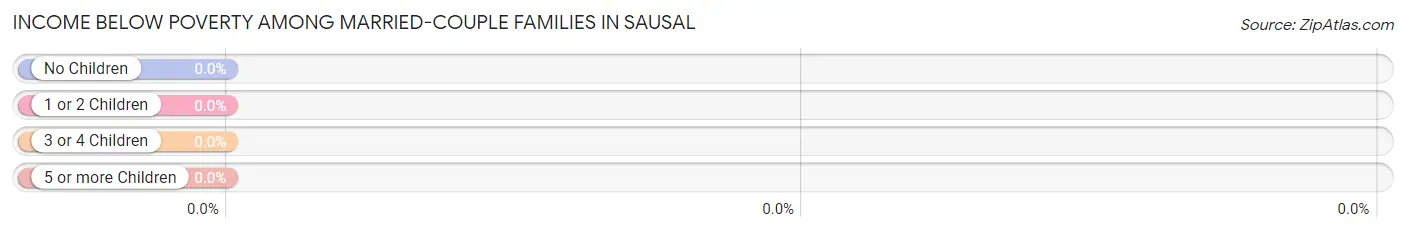
| Children | Above Poverty | Below Poverty |
| No Children | 66 (100.0%) | 0 (0.0%) |
| 1 or 2 Children | 0 (0.0%) | 0 (0.0%) |
| 3 or 4 Children | 0 (0.0%) | 0 (0.0%) |
| 5 or more Children | 0 (0.0%) | 0 (0.0%) |
| Total | 66 (100.0%) | 0 (0.0%) |
Income Below Poverty Among Single-Parent Households in Sausal
| Children | Single Father | Single Mother |
| No Children | 0 (0.0%) | 0 (0.0%) |
| 1 or 2 Children | 0 (0.0%) | 0 (0.0%) |
| 3 or 4 Children | 0 (0.0%) | 0 (0.0%) |
| 5 or more Children | 0 (0.0%) | 0 (0.0%) |
| Total | 0 (0.0%) | 0 (0.0%) |
Income Below Poverty Among Married-Couple vs Single-Parent Households in Sausal
| Children | Married-Couple Families | Single-Parent Households |
| No Children | 0 (0.0%) | 0 (0.0%) |
| 1 or 2 Children | 0 (0.0%) | 0 (0.0%) |
| 3 or 4 Children | 0 (0.0%) | 0 (0.0%) |
| 5 or more Children | 0 (0.0%) | 0 (0.0%) |
| Total | 0 (0.0%) | 0 (0.0%) |
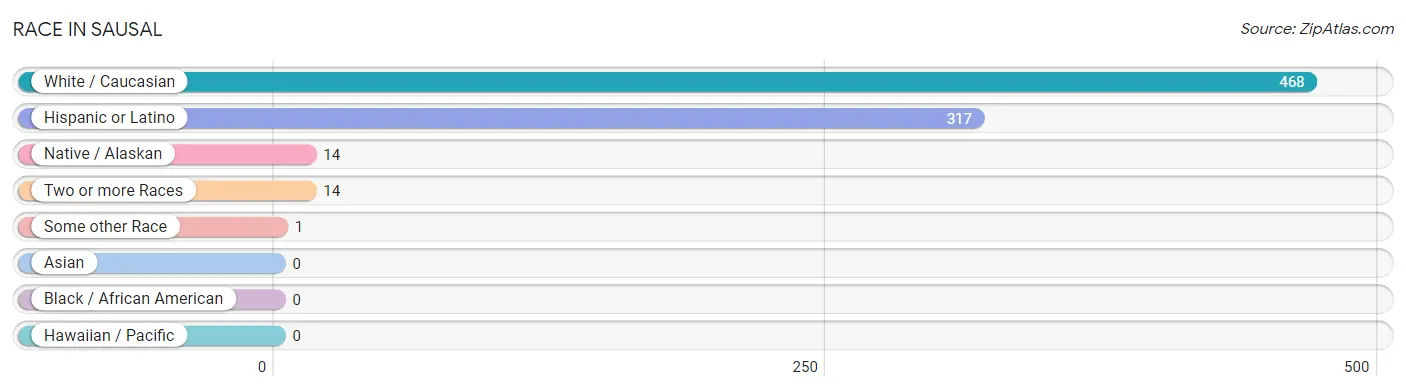
Race in Sausal
The most populous races in Sausal are White / Caucasian (468 | 94.2%), Hispanic or Latino (317 | 63.8%), and Native / Alaskan (14 | 2.8%).
| Race | # Population | % Population |
| Asian | 0 | 0.0% |
| Black / African American | 0 | 0.0% |
| Hawaiian / Pacific | 0 | 0.0% |
| Hispanic or Latino | 317 | 63.8% |
| Native / Alaskan | 14 | 2.8% |
| White / Caucasian | 468 | 94.2% |
| Two or more Races | 14 | 2.8% |
| Some other Race | 1 | 0.2% |
| Total | 497 | 100.0% |
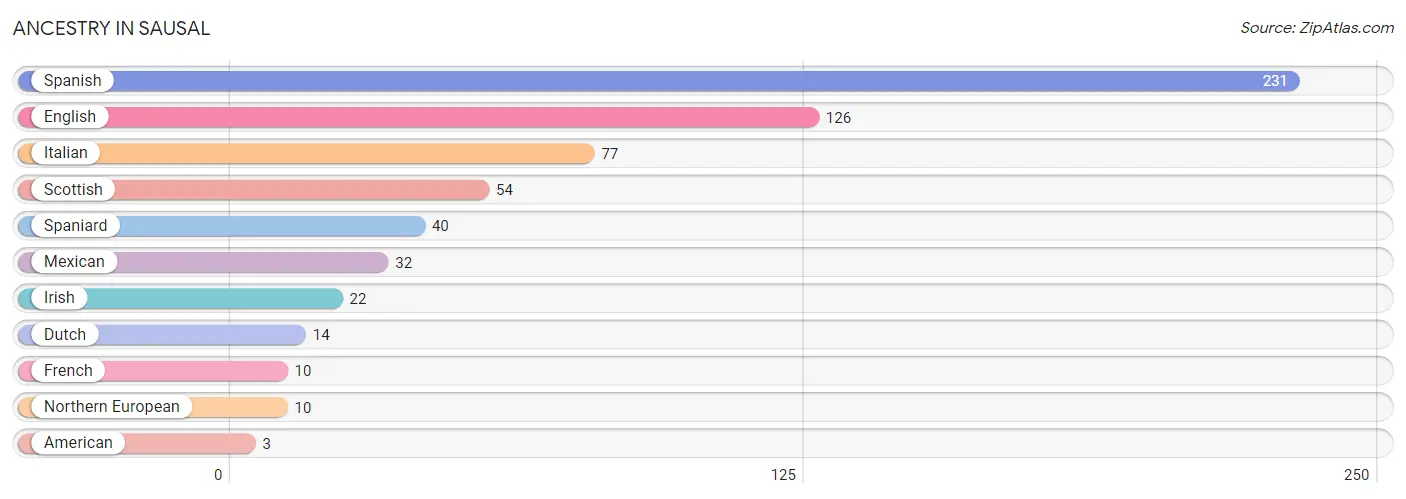
Ancestry in Sausal
The most populous ancestries reported in Sausal are Spanish (231 | 46.5%), English (126 | 25.4%), Italian (77 | 15.5%), Scottish (54 | 10.9%), and Spaniard (40 | 8.1%), together accounting for 106.2% of all Sausal residents.
| Ancestry | # Population | % Population |
| American | 3 | 0.6% |
| Dutch | 14 | 2.8% |
| English | 126 | 25.4% |
| French | 10 | 2.0% |
| Irish | 22 | 4.4% |
| Italian | 77 | 15.5% |
| Mexican | 32 | 6.4% |
| Northern European | 10 | 2.0% |
| Scottish | 54 | 10.9% |
| Spaniard | 40 | 8.1% |
| Spanish | 231 | 46.5% | View All 11 Rows |
Immigrants in Sausal

| Immigration Origin | # Population | % Population | View All 0 Rows |
Sex and Age in Sausal
Sex and Age in Sausal
The most populous age groups in Sausal are 70 to 74 Years (92 | 28.4%) for men and 15 to 19 Years (68 | 39.3%) for women.
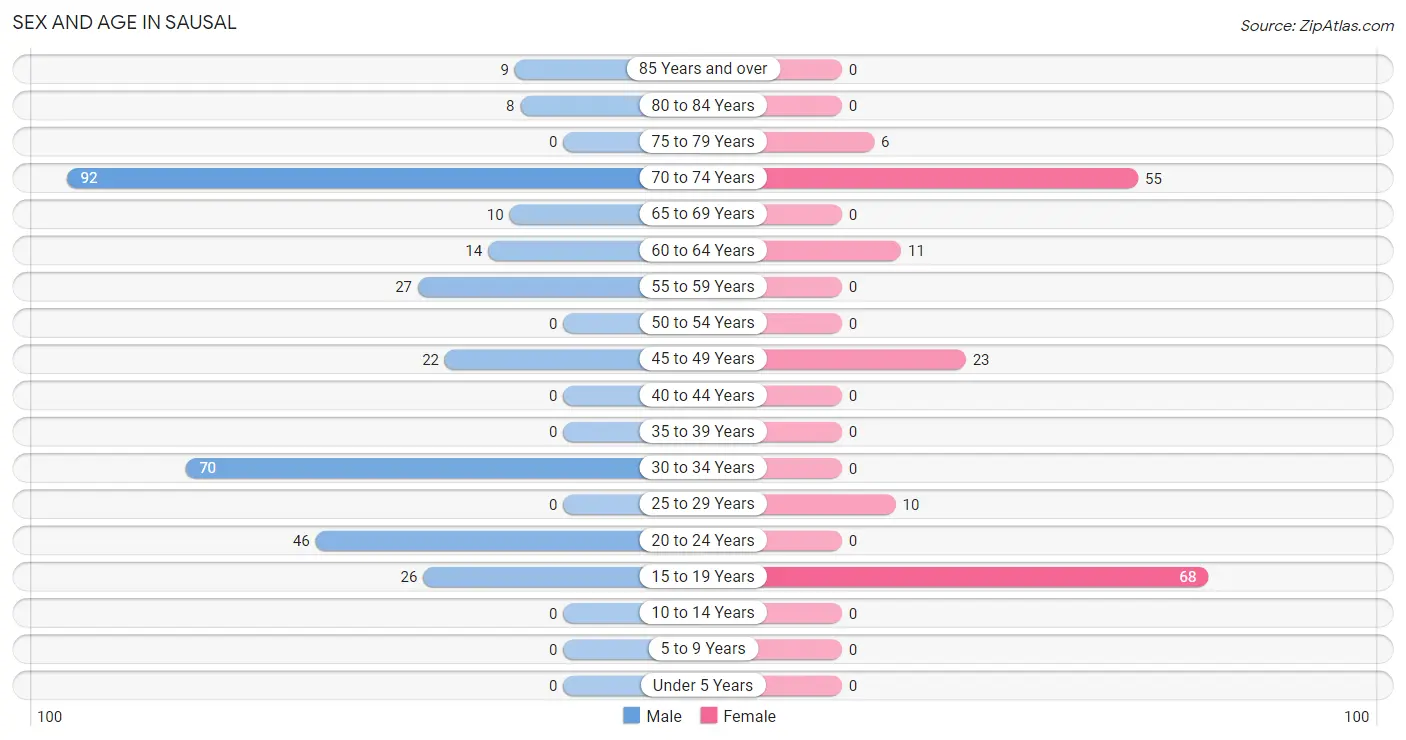
| Age Bracket | Male | Female |
| Under 5 Years | 0 (0.0%) | 0 (0.0%) |
| 5 to 9 Years | 0 (0.0%) | 0 (0.0%) |
| 10 to 14 Years | 0 (0.0%) | 0 (0.0%) |
| 15 to 19 Years | 26 (8.0%) | 68 (39.3%) |
| 20 to 24 Years | 46 (14.2%) | 0 (0.0%) |
| 25 to 29 Years | 0 (0.0%) | 10 (5.8%) |
| 30 to 34 Years | 70 (21.6%) | 0 (0.0%) |
| 35 to 39 Years | 0 (0.0%) | 0 (0.0%) |
| 40 to 44 Years | 0 (0.0%) | 0 (0.0%) |
| 45 to 49 Years | 22 (6.8%) | 23 (13.3%) |
| 50 to 54 Years | 0 (0.0%) | 0 (0.0%) |
| 55 to 59 Years | 27 (8.3%) | 0 (0.0%) |
| 60 to 64 Years | 14 (4.3%) | 11 (6.4%) |
| 65 to 69 Years | 10 (3.1%) | 0 (0.0%) |
| 70 to 74 Years | 92 (28.4%) | 55 (31.8%) |
| 75 to 79 Years | 0 (0.0%) | 6 (3.5%) |
| 80 to 84 Years | 8 (2.5%) | 0 (0.0%) |
| 85 Years and over | 9 (2.8%) | 0 (0.0%) |
| Total | 324 (100.0%) | 173 (100.0%) |
Families and Households in Sausal
Median Family Size in Sausal
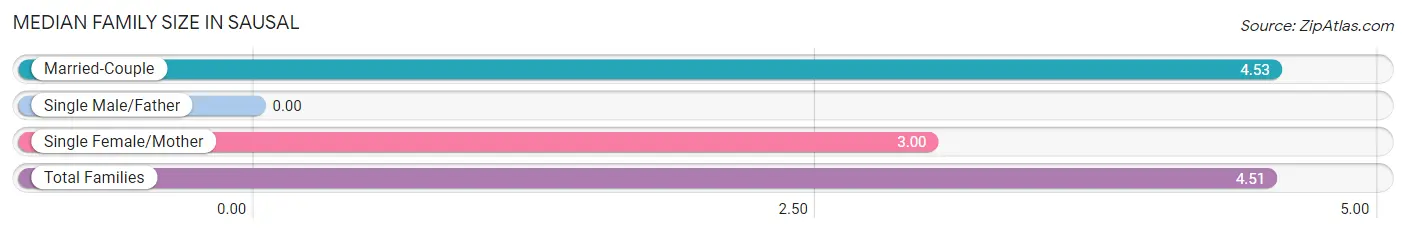
| Family Type | # Families | Family Size |
| Married-Couple | 66 (98.5%) | 4.53 |
| Single Male/Father | 0 (0.0%) | - |
| Single Female/Mother | 1 (1.5%) | 3.00 |
| Total Families | 67 (100.0%) | 4.51 |
Median Household Size in Sausal
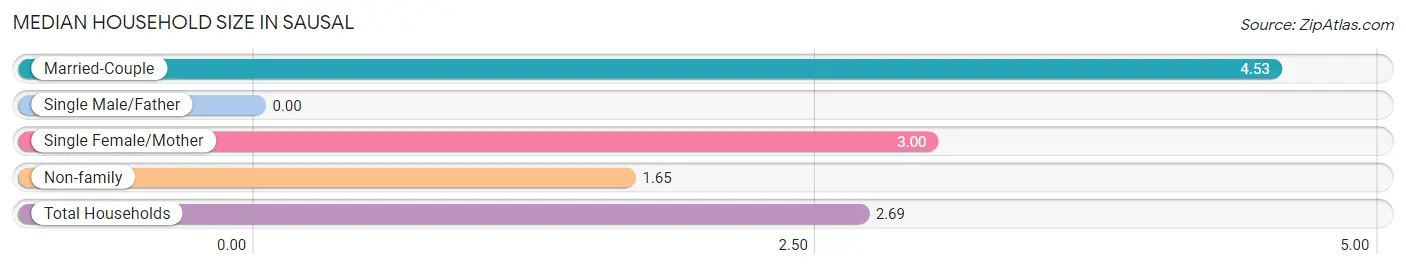
| Household Type | # Households | Household Size |
| Married-Couple | 66 (35.7%) | 4.53 |
| Single Male/Father | 0 (0.0%) | - |
| Single Female/Mother | 1 (0.5%) | 3.00 |
| Non-family | 118 (63.8%) | 1.65 |
| Total Households | 185 (100.0%) | 2.69 |
Household Size by Marriage Status in Sausal
Out of a total of 185 households in Sausal, 67 (36.2%) are family households, while 118 (63.8%) are nonfamily households. The most numerous type of family households are 2-person households, comprising 44, and the most common type of nonfamily households are 1-person households, comprising 59.
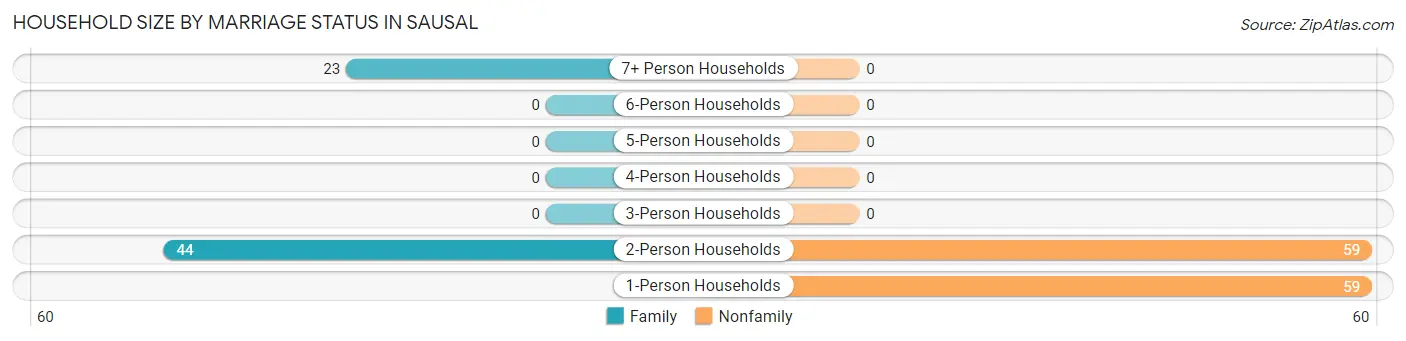
| Household Size | Family Households | Nonfamily Households |
| 1-Person Households | - | 59 (31.9%) |
| 2-Person Households | 44 (23.8%) | 59 (31.9%) |
| 3-Person Households | 0 (0.0%) | 0 (0.0%) |
| 4-Person Households | 0 (0.0%) | 0 (0.0%) |
| 5-Person Households | 0 (0.0%) | 0 (0.0%) |
| 6-Person Households | 0 (0.0%) | 0 (0.0%) |
| 7+ Person Households | 23 (12.4%) | 0 (0.0%) |
| Total | 67 (36.2%) | 118 (63.8%) |
Female Fertility in Sausal
Fertility by Age in Sausal
| Age Bracket | Women with Births | Births / 1,000 Women |
| 15 to 19 years | 0 (0.0%) | 0.0 |
| 20 to 34 years | 0 (0.0%) | 0.0 |
| 35 to 50 years | 0 (0.0%) | 0.0 |
| Total | 0 (0.0%) | 0.0 |
Fertility by Age by Marriage Status in Sausal
| Age Bracket | Married | Unmarried |
| 15 to 19 years | 0 (0.0%) | 0 (0.0%) |
| 20 to 34 years | 0 (0.0%) | 0 (0.0%) |
| 35 to 50 years | 0 (0.0%) | 0 (0.0%) |
| Total | 0 (0.0%) | 0 (0.0%) |
Fertility by Education in Sausal
| Educational Attainment | Women with Births | Births / 1,000 Women |
| Less than High School | 0 (0.0%) | 0.0 |
| High School Diploma | 0 (0.0%) | 0.0 |
| College or Associate's Degree | 0 (0.0%) | 0.0 |
| Bachelor's Degree | 0 (0.0%) | 0.0 |
| Graduate Degree | 0 (0.0%) | 0.0 |
| Total | 0 (0.0%) | 0.0 |
Fertility by Education by Marriage Status in Sausal
| Educational Attainment | Married | Unmarried |
| Less than High School | 0 (0.0%) | 0 (0.0%) |
| High School Diploma | 0 (0.0%) | 0 (0.0%) |
| College or Associate's Degree | 0 (0.0%) | 0 (0.0%) |
| Bachelor's Degree | 0 (0.0%) | 0 (0.0%) |
| Graduate Degree | 0 (0.0%) | 0 (0.0%) |
| Total | 0 (0.0%) | 0 (0.0%) |
Employment Characteristics in Sausal
Employment by Class of Employer in Sausal
Among the 190 employed individuals in Sausal, private company employees (87 | 45.8%), self-employed (not incorporated) (70 | 36.8%), and local government employees (33 | 17.4%) make up the most common classes of employment.
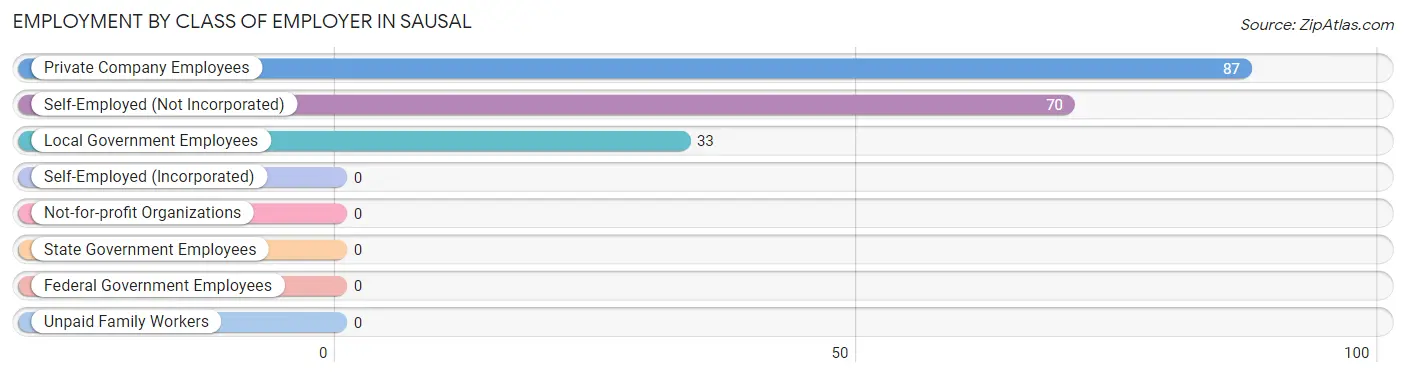
| Employer Class | # Employees | % Employees |
| Private Company Employees | 87 | 45.8% |
| Self-Employed (Incorporated) | 0 | 0.0% |
| Self-Employed (Not Incorporated) | 70 | 36.8% |
| Not-for-profit Organizations | 0 | 0.0% |
| Local Government Employees | 33 | 17.4% |
| State Government Employees | 0 | 0.0% |
| Federal Government Employees | 0 | 0.0% |
| Unpaid Family Workers | 0 | 0.0% |
| Total | 190 | 100.0% |
Employment Status by Age in Sausal
According to the labor force statistics for Sausal, out of the total population over 16 years of age (497), 47.5% or 236 individuals are in the labor force, with 19.5% or 46 of them unemployed. The age group with the highest labor force participation rate is 20 to 24 years, with 100.0% or 46 individuals in the labor force. Within the labor force, the 20 to 24 years age range has the highest percentage of unemployed individuals, with 100.0% or 46 of them being unemployed.
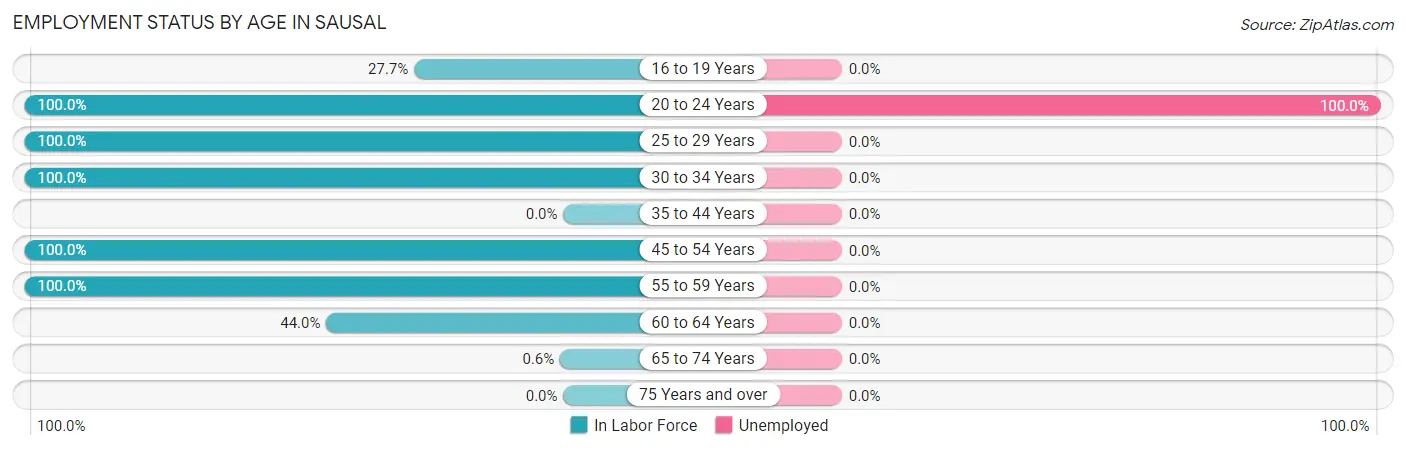
| Age Bracket | In Labor Force | Unemployed |
| 16 to 19 Years | 26 (27.7%) | 0 (0.0%) |
| 20 to 24 Years | 46 (100.0%) | 46 (100.0%) |
| 25 to 29 Years | 10 (100.0%) | 0 (0.0%) |
| 30 to 34 Years | 70 (100.0%) | 0 (0.0%) |
| 35 to 44 Years | 0 (0.0%) | 0 (0.0%) |
| 45 to 54 Years | 45 (100.0%) | 0 (0.0%) |
| 55 to 59 Years | 27 (100.0%) | 0 (0.0%) |
| 60 to 64 Years | 11 (44.0%) | 0 (0.0%) |
| 65 to 74 Years | 1 (0.6%) | 0 (0.0%) |
| 75 Years and over | 0 (0.0%) | 0 (0.0%) |
| Total | 236 (47.5%) | 46 (19.5%) |
Employment Status by Educational Attainment in Sausal
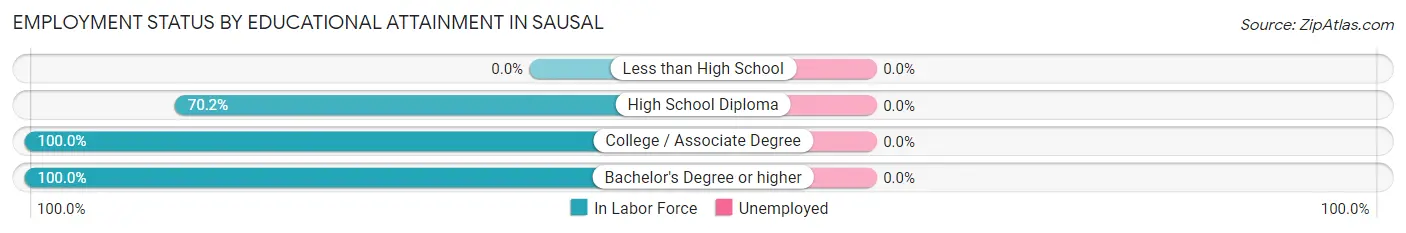
| Educational Attainment | In Labor Force | Unemployed |
| Less than High School | 0 (0.0%) | 0 (0.0%) |
| High School Diploma | 33 (70.2%) | 0 (0.0%) |
| College / Associate Degree | 103 (100.0%) | 0 (0.0%) |
| Bachelor's Degree or higher | 27 (100.0%) | 0 (0.0%) |
| Total | 163 (92.1%) | 0 (0.0%) |
Employment Occupations by Sex in Sausal
Management, Business, Science and Arts Occupations
The most common Management, Business, Science and Arts occupations in Sausal are Computers, Engineering & Science (27 | 14.2%), Architecture & Engineering (27 | 14.2%), and Health Diagnosing & Treating (10 | 5.3%).
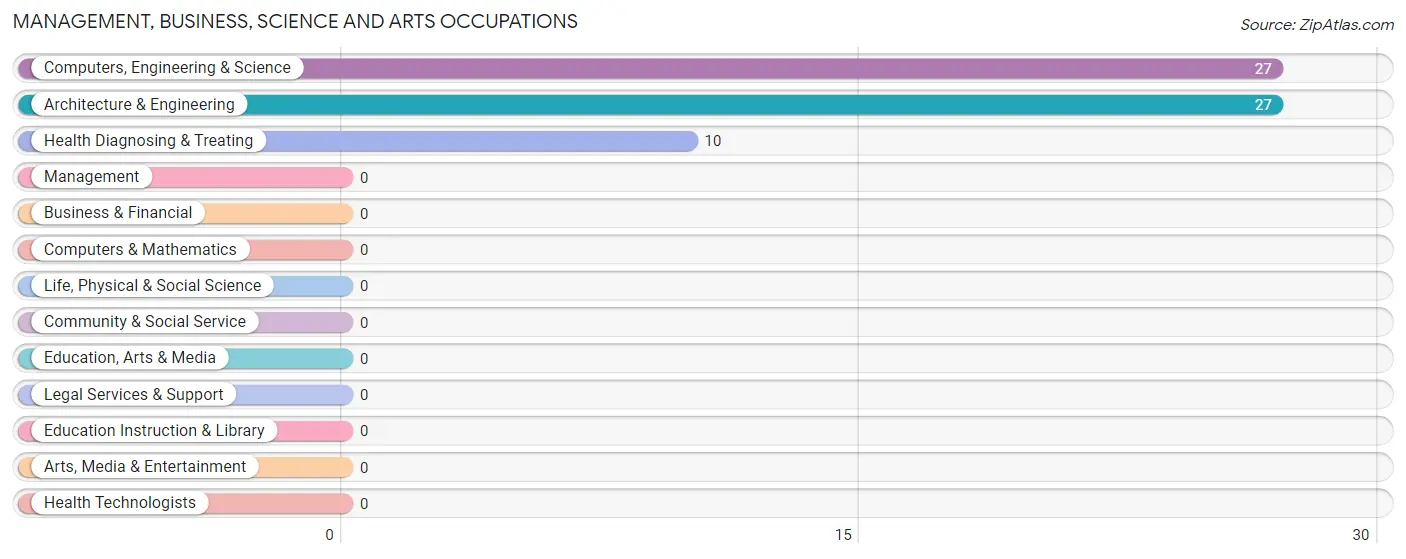
Management, Business, Science and Arts Occupations by Sex
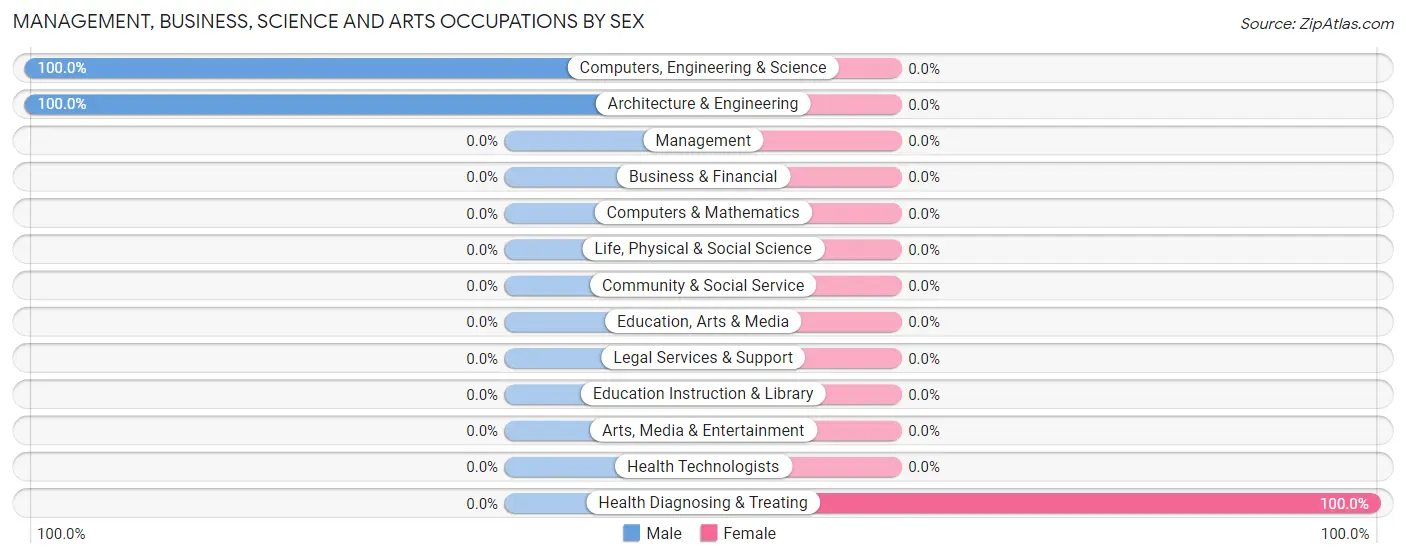
| Occupation | Male | Female |
| Management | 0 (0.0%) | 0 (0.0%) |
| Business & Financial | 0 (0.0%) | 0 (0.0%) |
| Computers, Engineering & Science | 27 (100.0%) | 0 (0.0%) |
| Computers & Mathematics | 0 (0.0%) | 0 (0.0%) |
| Architecture & Engineering | 27 (100.0%) | 0 (0.0%) |
| Life, Physical & Social Science | 0 (0.0%) | 0 (0.0%) |
| Community & Social Service | 0 (0.0%) | 0 (0.0%) |
| Education, Arts & Media | 0 (0.0%) | 0 (0.0%) |
| Legal Services & Support | 0 (0.0%) | 0 (0.0%) |
| Education Instruction & Library | 0 (0.0%) | 0 (0.0%) |
| Arts, Media & Entertainment | 0 (0.0%) | 0 (0.0%) |
| Health Diagnosing & Treating | 0 (0.0%) | 10 (100.0%) |
| Health Technologists | 0 (0.0%) | 0 (0.0%) |
| Total (Category) | 27 (73.0%) | 10 (27.0%) |
| Total (Overall) | 146 (76.8%) | 44 (23.2%) |
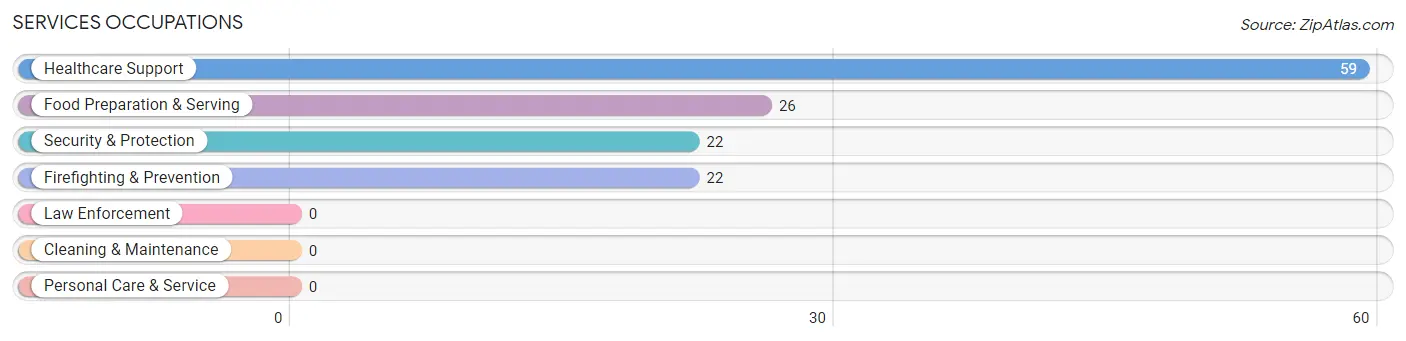
Services Occupations
The most common Services occupations in Sausal are Healthcare Support (59 | 31.0%), Food Preparation & Serving (26 | 13.7%), Security & Protection (22 | 11.6%), and Firefighting & Prevention (22 | 11.6%).
Services Occupations by Sex
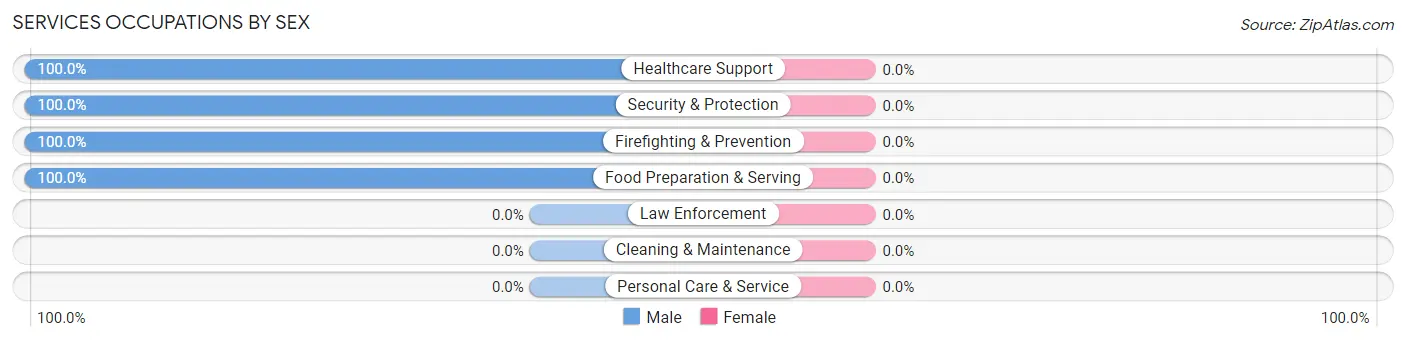
| Occupation | Male | Female |
| Healthcare Support | 59 (100.0%) | 0 (0.0%) |
| Security & Protection | 22 (100.0%) | 0 (0.0%) |
| Firefighting & Prevention | 22 (100.0%) | 0 (0.0%) |
| Law Enforcement | 0 (0.0%) | 0 (0.0%) |
| Food Preparation & Serving | 26 (100.0%) | 0 (0.0%) |
| Cleaning & Maintenance | 0 (0.0%) | 0 (0.0%) |
| Personal Care & Service | 0 (0.0%) | 0 (0.0%) |
| Total (Category) | 107 (100.0%) | 0 (0.0%) |
| Total (Overall) | 146 (76.8%) | 44 (23.2%) |
Sales and Office Occupations
The most common Sales and Office occupations in Sausal are , and Office & Administration (23 | 12.1%).
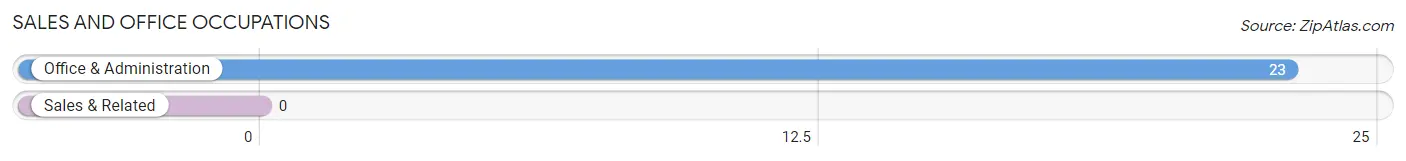
Sales and Office Occupations by Sex
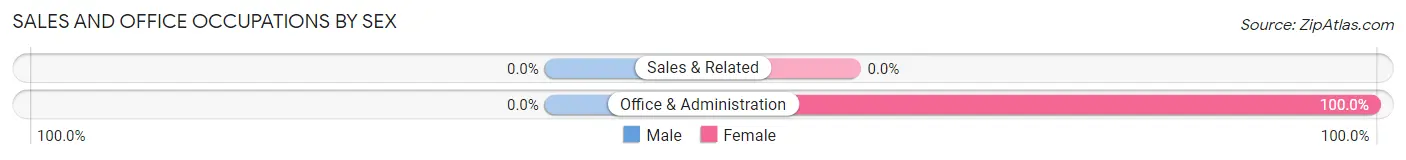
| Occupation | Male | Female |
| Sales & Related | 0 (0.0%) | 0 (0.0%) |
| Office & Administration | 0 (0.0%) | 23 (100.0%) |
| Total (Category) | 0 (0.0%) | 23 (100.0%) |
| Total (Overall) | 146 (76.8%) | 44 (23.2%) |
Natural Resources, Construction and Maintenance Occupations
The most common Natural Resources, Construction and Maintenance occupations in Sausal are , and Construction & Extraction (1 | 0.5%).
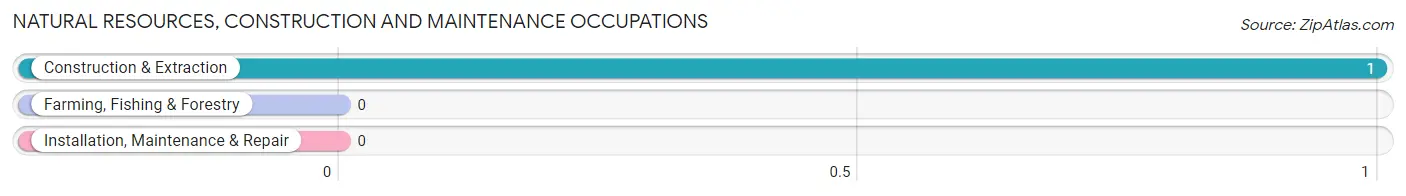
Natural Resources, Construction and Maintenance Occupations by Sex
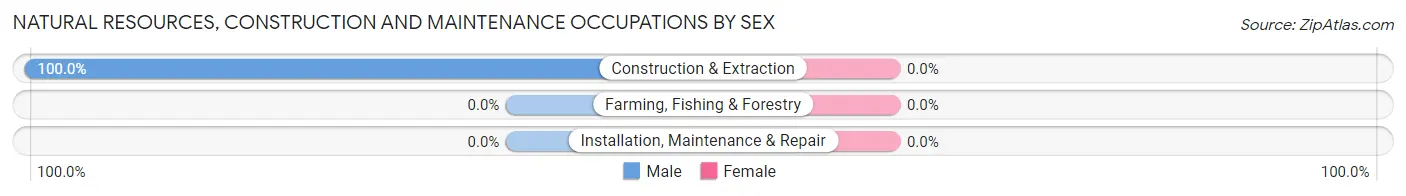
| Occupation | Male | Female |
| Farming, Fishing & Forestry | 0 (0.0%) | 0 (0.0%) |
| Construction & Extraction | 1 (100.0%) | 0 (0.0%) |
| Installation, Maintenance & Repair | 0 (0.0%) | 0 (0.0%) |
| Total (Category) | 1 (100.0%) | 0 (0.0%) |
| Total (Overall) | 146 (76.8%) | 44 (23.2%) |
Production, Transportation and Moving Occupations
The most common Production, Transportation and Moving occupations in Sausal are Production (11 | 5.8%), and Transportation (11 | 5.8%).
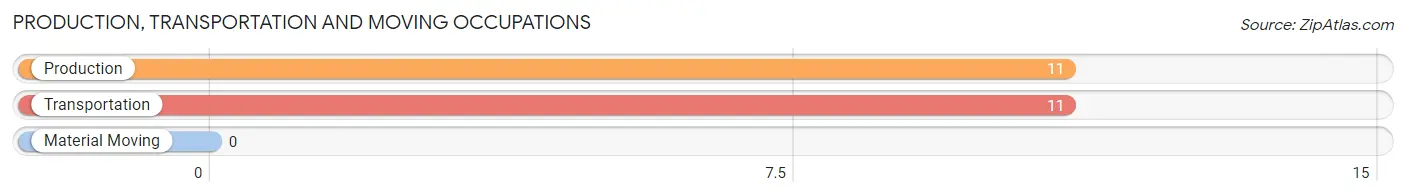
Production, Transportation and Moving Occupations by Sex
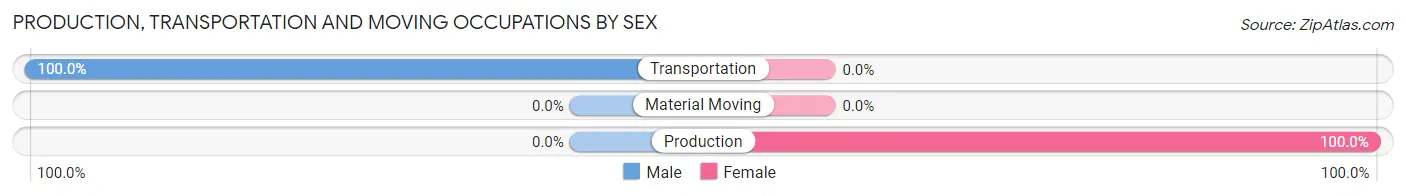
| Occupation | Male | Female |
| Production | 0 (0.0%) | 11 (100.0%) |
| Transportation | 11 (100.0%) | 0 (0.0%) |
| Material Moving | 0 (0.0%) | 0 (0.0%) |
| Total (Category) | 11 (50.0%) | 11 (50.0%) |
| Total (Overall) | 146 (76.8%) | 44 (23.2%) |
Employment Industries by Sex in Sausal
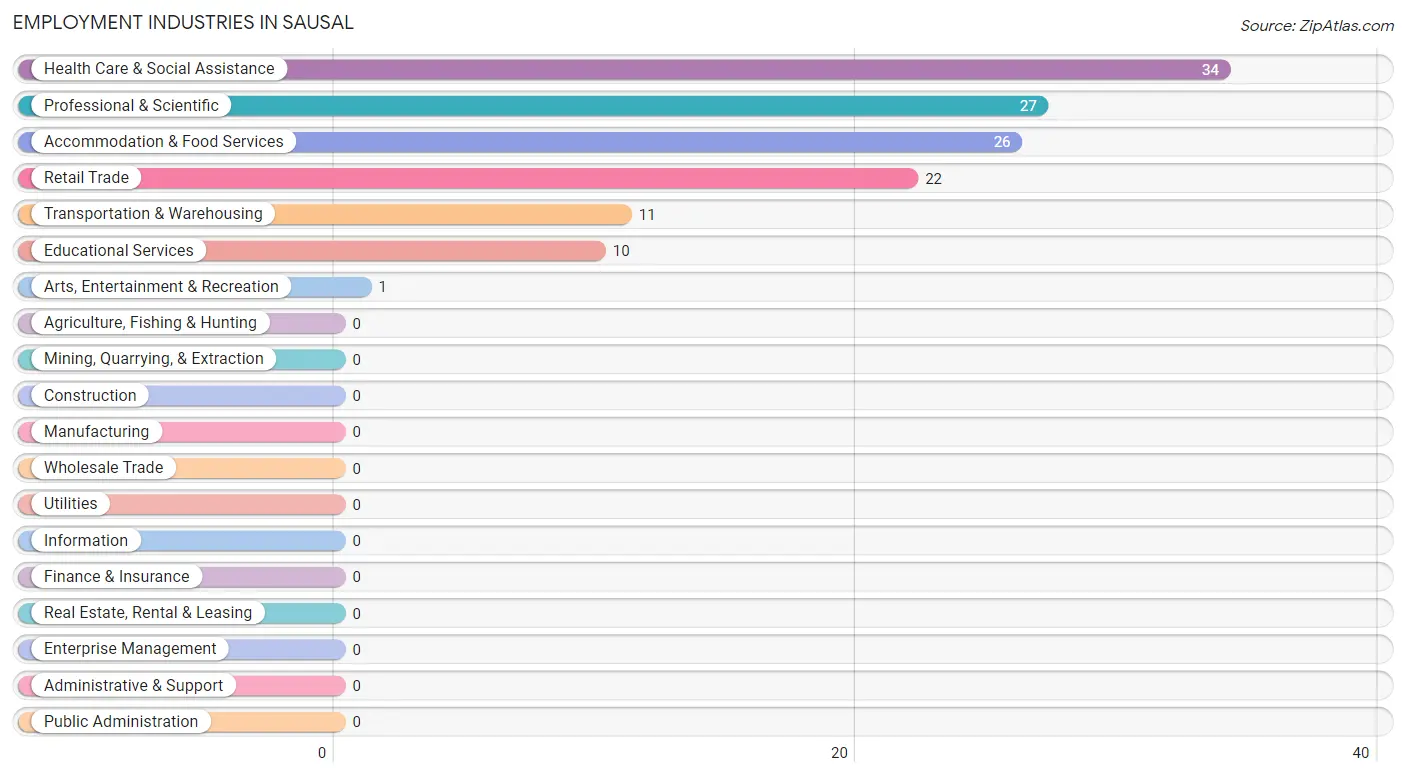
Employment Industries in Sausal
The major employment industries in Sausal include Health Care & Social Assistance (34 | 17.9%), Professional & Scientific (27 | 14.2%), Accommodation & Food Services (26 | 13.7%), Retail Trade (22 | 11.6%), and Transportation & Warehousing (11 | 5.8%).
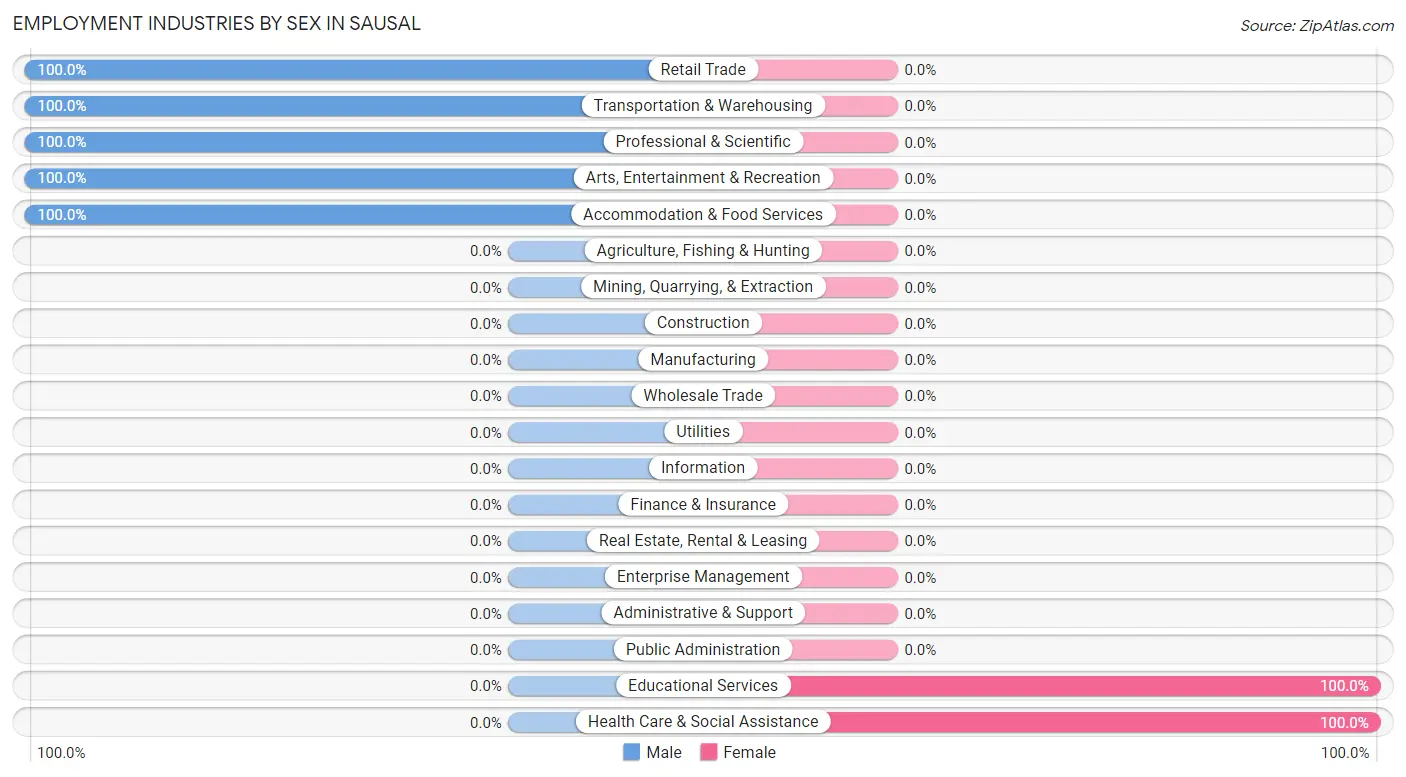
Employment Industries by Sex in Sausal
The Sausal industries that see more men than women are Retail Trade (100.0%), Transportation & Warehousing (100.0%), and Professional & Scientific (100.0%), whereas the industries that tend to have a higher number of women are Educational Services (100.0%), and Health Care & Social Assistance (100.0%).
| Industry | Male | Female |
| Agriculture, Fishing & Hunting | 0 (0.0%) | 0 (0.0%) |
| Mining, Quarrying, & Extraction | 0 (0.0%) | 0 (0.0%) |
| Construction | 0 (0.0%) | 0 (0.0%) |
| Manufacturing | 0 (0.0%) | 0 (0.0%) |
| Wholesale Trade | 0 (0.0%) | 0 (0.0%) |
| Retail Trade | 22 (100.0%) | 0 (0.0%) |
| Transportation & Warehousing | 11 (100.0%) | 0 (0.0%) |
| Utilities | 0 (0.0%) | 0 (0.0%) |
| Information | 0 (0.0%) | 0 (0.0%) |
| Finance & Insurance | 0 (0.0%) | 0 (0.0%) |
| Real Estate, Rental & Leasing | 0 (0.0%) | 0 (0.0%) |
| Professional & Scientific | 27 (100.0%) | 0 (0.0%) |
| Enterprise Management | 0 (0.0%) | 0 (0.0%) |
| Administrative & Support | 0 (0.0%) | 0 (0.0%) |
| Educational Services | 0 (0.0%) | 10 (100.0%) |
| Health Care & Social Assistance | 0 (0.0%) | 34 (100.0%) |
| Arts, Entertainment & Recreation | 1 (100.0%) | 0 (0.0%) |
| Accommodation & Food Services | 26 (100.0%) | 0 (0.0%) |
| Public Administration | 0 (0.0%) | 0 (0.0%) |
| Total | 146 (76.8%) | 44 (23.2%) |
Education in Sausal
School Enrollment in Sausal
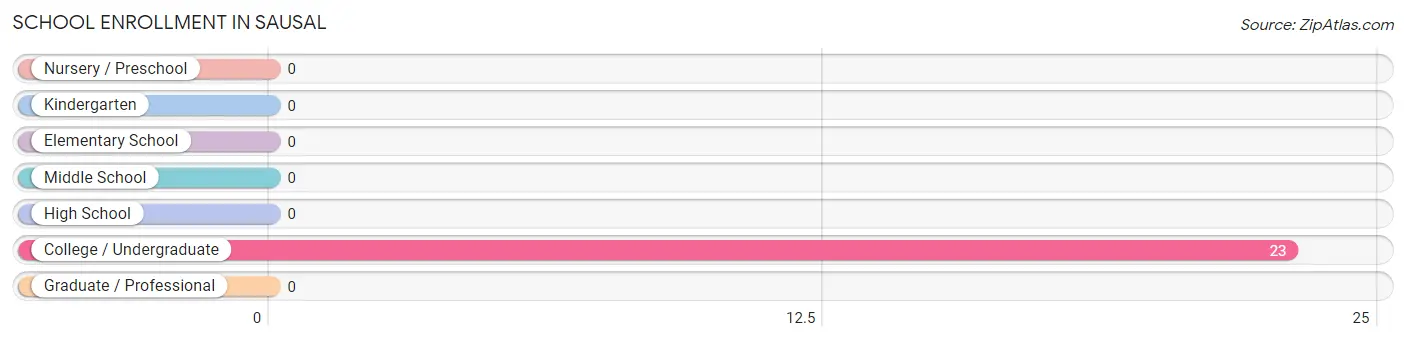
| School Level | # Students | % Students |
| Nursery / Preschool | 0 | 0.0% |
| Kindergarten | 0 | 0.0% |
| Elementary School | 0 | 0.0% |
| Middle School | 0 | 0.0% |
| High School | 0 | 0.0% |
| College / Undergraduate | 23 | 100.0% |
| Graduate / Professional | 0 | 0.0% |
| Total | 23 | 100.0% |
School Enrollment by Age by Funding Source in Sausal
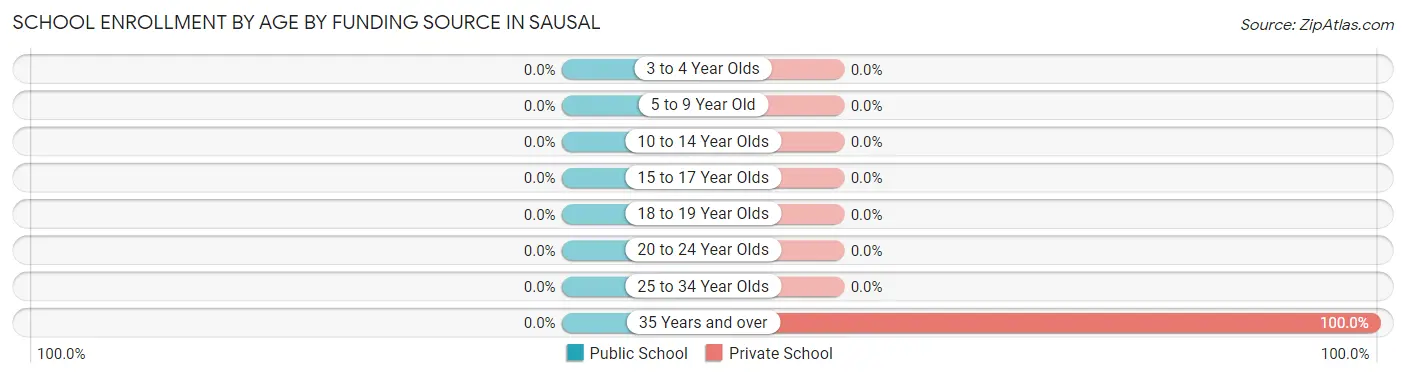
| Age Bracket | Public School | Private School |
| 3 to 4 Year Olds | 0 (0.0%) | 0 (0.0%) |
| 5 to 9 Year Old | 0 (0.0%) | 0 (0.0%) |
| 10 to 14 Year Olds | 0 (0.0%) | 0 (0.0%) |
| 15 to 17 Year Olds | 0 (0.0%) | 0 (0.0%) |
| 18 to 19 Year Olds | 0 (0.0%) | 0 (0.0%) |
| 20 to 24 Year Olds | 0 (0.0%) | 0 (0.0%) |
| 25 to 34 Year Olds | 0 (0.0%) | 0 (0.0%) |
| 35 Years and over | 0 (0.0%) | 23 (100.0%) |
| Total | 0 (0.0%) | 23 (100.0%) |
Educational Attainment by Field of Study in Sausal
Bio, nature & agricultural (77 | 53.5%), education (32 | 22.2%), engineering (27 | 18.8%), and science & technology (8 | 5.6%) are the most common fields of study among 144 individuals in Sausal who have obtained a bachelor's degree or higher.
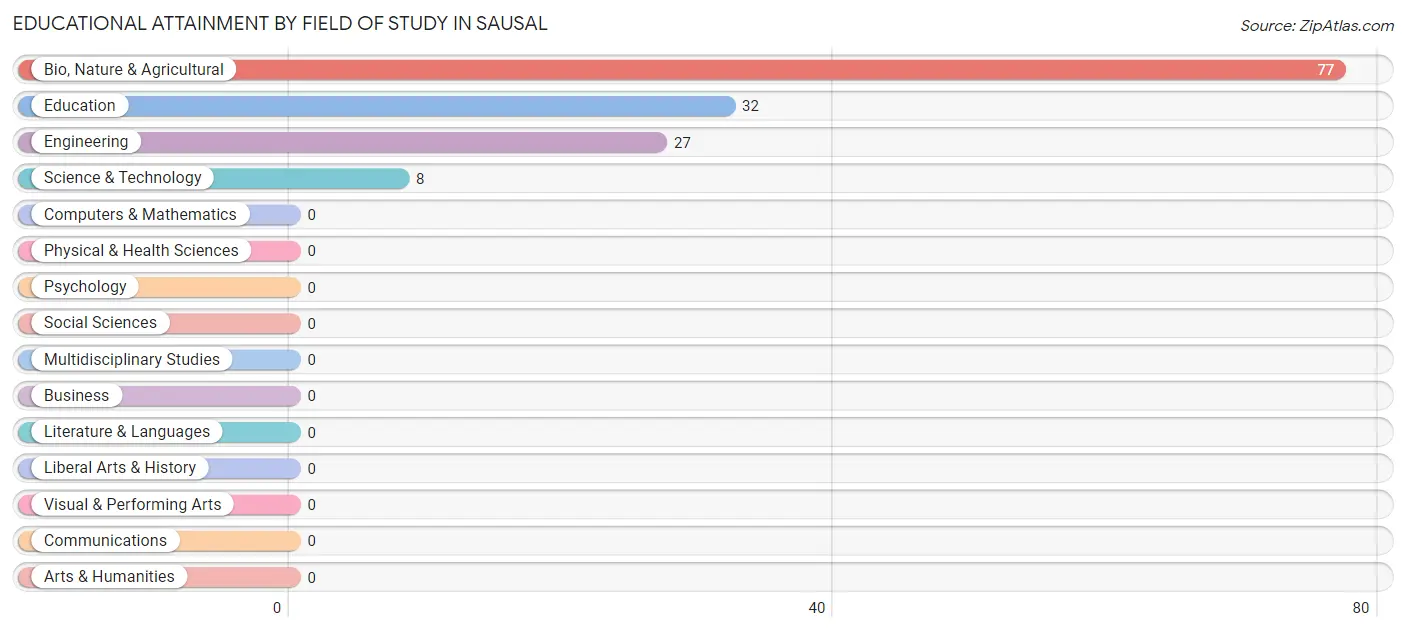
| Field of Study | # Graduates | % Graduates |
| Computers & Mathematics | 0 | 0.0% |
| Bio, Nature & Agricultural | 77 | 53.5% |
| Physical & Health Sciences | 0 | 0.0% |
| Psychology | 0 | 0.0% |
| Social Sciences | 0 | 0.0% |
| Engineering | 27 | 18.8% |
| Multidisciplinary Studies | 0 | 0.0% |
| Science & Technology | 8 | 5.6% |
| Business | 0 | 0.0% |
| Education | 32 | 22.2% |
| Literature & Languages | 0 | 0.0% |
| Liberal Arts & History | 0 | 0.0% |
| Visual & Performing Arts | 0 | 0.0% |
| Communications | 0 | 0.0% |
| Arts & Humanities | 0 | 0.0% |
| Total | 144 | 100.0% |
Transportation & Commute in Sausal
Vehicle Availability by Sex in Sausal
The most prevalent vehicle ownership categories in Sausal are males with 3 vehicles (86, accounting for 58.9%) and females with 3 vehicles (0, making up 195.4%).
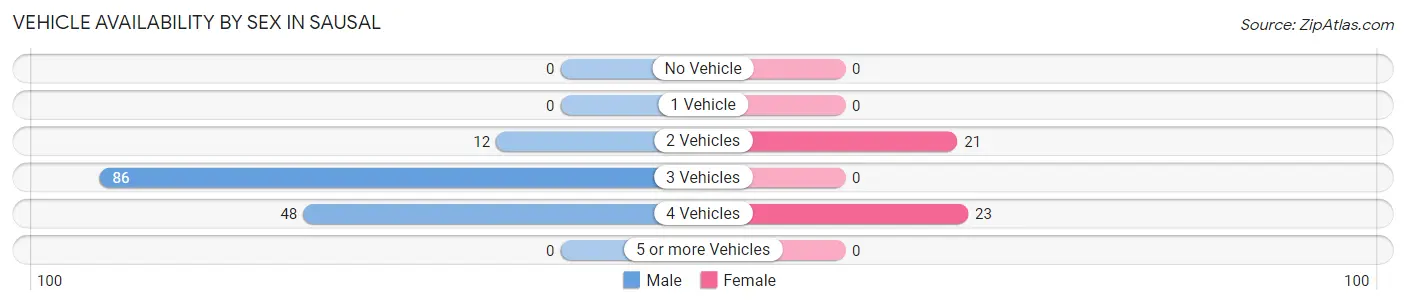
| Vehicles Available | Male | Female |
| No Vehicle | 0 (0.0%) | 0 (0.0%) |
| 1 Vehicle | 0 (0.0%) | 0 (0.0%) |
| 2 Vehicles | 12 (8.2%) | 21 (47.7%) |
| 3 Vehicles | 86 (58.9%) | 0 (0.0%) |
| 4 Vehicles | 48 (32.9%) | 23 (52.3%) |
| 5 or more Vehicles | 0 (0.0%) | 0 (0.0%) |
| Total | 146 (100.0%) | 44 (100.0%) |
Commute Time in Sausal
The most frequently occuring commute durations in Sausal are 45 to 59 minutes (51 commuters, 38.9%), 10 to 14 minutes (37 commuters, 28.2%), and 15 to 19 minutes (32 commuters, 24.4%).
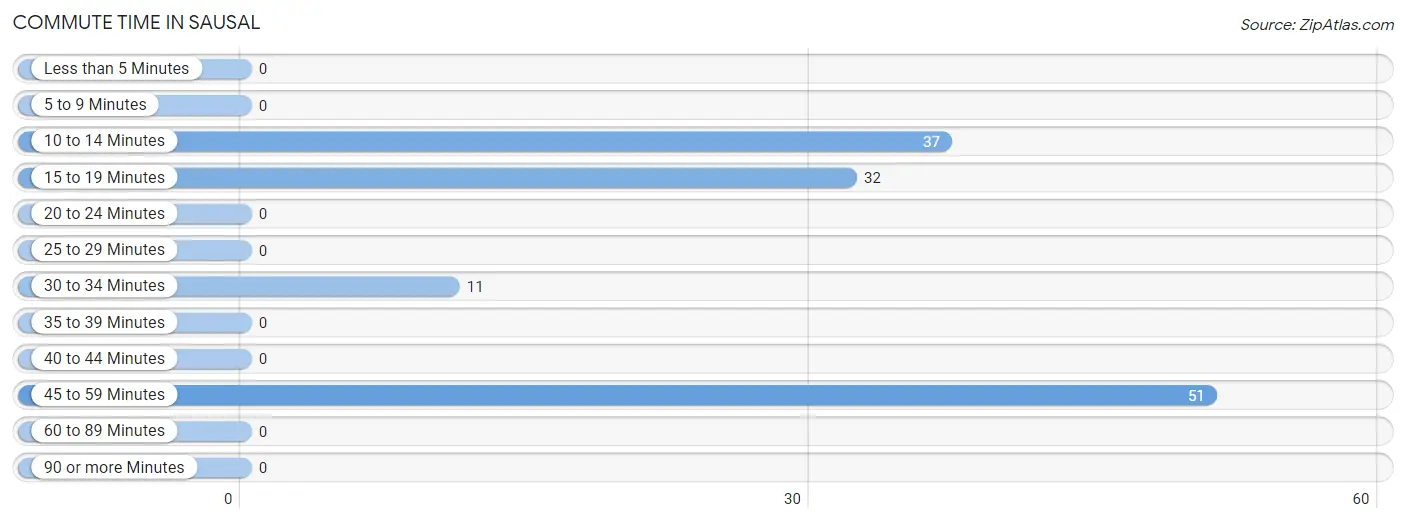
| Commute Time | # Commuters | % Commuters |
| Less than 5 Minutes | 0 | 0.0% |
| 5 to 9 Minutes | 0 | 0.0% |
| 10 to 14 Minutes | 37 | 28.2% |
| 15 to 19 Minutes | 32 | 24.4% |
| 20 to 24 Minutes | 0 | 0.0% |
| 25 to 29 Minutes | 0 | 0.0% |
| 30 to 34 Minutes | 11 | 8.4% |
| 35 to 39 Minutes | 0 | 0.0% |
| 40 to 44 Minutes | 0 | 0.0% |
| 45 to 59 Minutes | 51 | 38.9% |
| 60 to 89 Minutes | 0 | 0.0% |
| 90 or more Minutes | 0 | 0.0% |
Commute Time by Sex in Sausal
The most common commute times in Sausal are 10 to 14 minutes (37 commuters, 42.5%) for males and 45 to 59 minutes (23 commuters, 52.3%) for females.
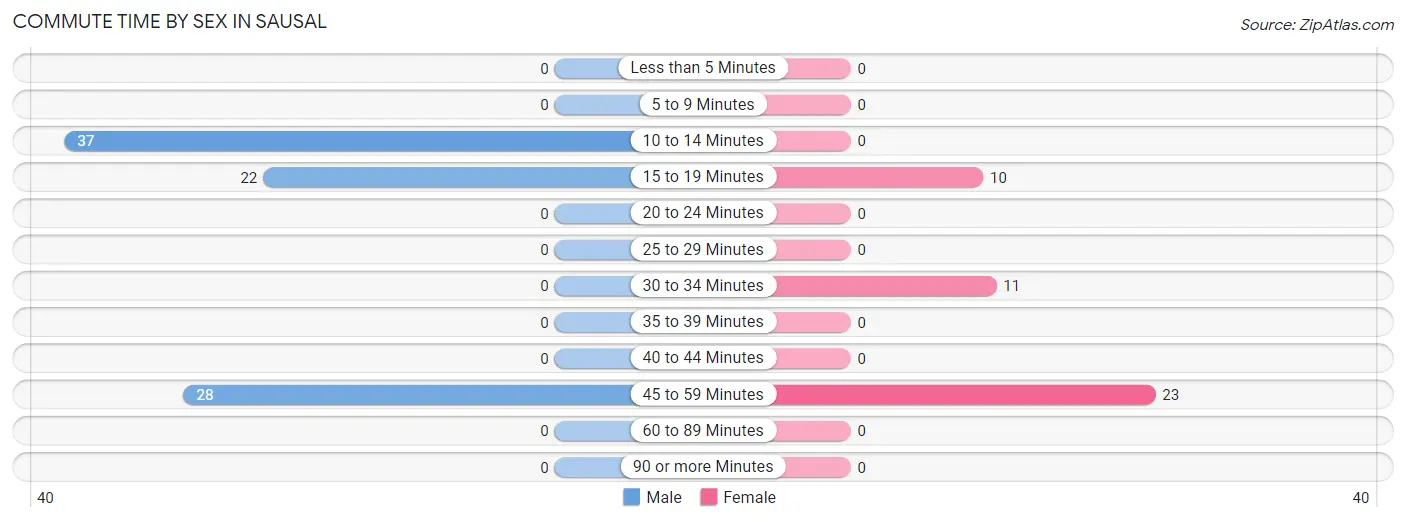
| Commute Time | Male | Female |
| Less than 5 Minutes | 0 (0.0%) | 0 (0.0%) |
| 5 to 9 Minutes | 0 (0.0%) | 0 (0.0%) |
| 10 to 14 Minutes | 37 (42.5%) | 0 (0.0%) |
| 15 to 19 Minutes | 22 (25.3%) | 10 (22.7%) |
| 20 to 24 Minutes | 0 (0.0%) | 0 (0.0%) |
| 25 to 29 Minutes | 0 (0.0%) | 0 (0.0%) |
| 30 to 34 Minutes | 0 (0.0%) | 11 (25.0%) |
| 35 to 39 Minutes | 0 (0.0%) | 0 (0.0%) |
| 40 to 44 Minutes | 0 (0.0%) | 0 (0.0%) |
| 45 to 59 Minutes | 28 (32.2%) | 23 (52.3%) |
| 60 to 89 Minutes | 0 (0.0%) | 0 (0.0%) |
| 90 or more Minutes | 0 (0.0%) | 0 (0.0%) |
Time of Departure to Work by Sex in Sausal
The most frequent times of departure to work in Sausal are 6:30 AM to 6:59 AM (27, 31.0%) for males and 6:00 AM to 6:29 AM (23, 52.3%) for females.
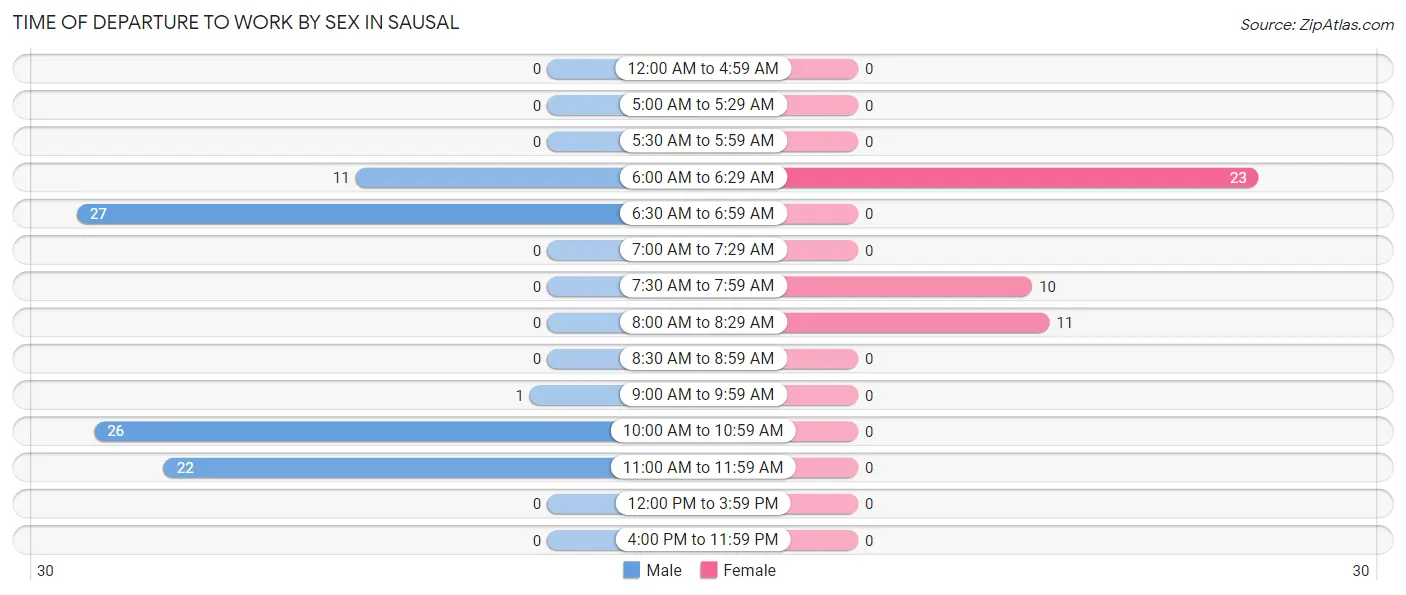
| Time of Departure | Male | Female |
| 12:00 AM to 4:59 AM | 0 (0.0%) | 0 (0.0%) |
| 5:00 AM to 5:29 AM | 0 (0.0%) | 0 (0.0%) |
| 5:30 AM to 5:59 AM | 0 (0.0%) | 0 (0.0%) |
| 6:00 AM to 6:29 AM | 11 (12.6%) | 23 (52.3%) |
| 6:30 AM to 6:59 AM | 27 (31.0%) | 0 (0.0%) |
| 7:00 AM to 7:29 AM | 0 (0.0%) | 0 (0.0%) |
| 7:30 AM to 7:59 AM | 0 (0.0%) | 10 (22.7%) |
| 8:00 AM to 8:29 AM | 0 (0.0%) | 11 (25.0%) |
| 8:30 AM to 8:59 AM | 0 (0.0%) | 0 (0.0%) |
| 9:00 AM to 9:59 AM | 1 (1.1%) | 0 (0.0%) |
| 10:00 AM to 10:59 AM | 26 (29.9%) | 0 (0.0%) |
| 11:00 AM to 11:59 AM | 22 (25.3%) | 0 (0.0%) |
| 12:00 PM to 3:59 PM | 0 (0.0%) | 0 (0.0%) |
| 4:00 PM to 11:59 PM | 0 (0.0%) | 0 (0.0%) |
| Total | 87 (100.0%) | 44 (100.0%) |
Housing Occupancy in Sausal
Occupancy by Ownership in Sausal
Of the total 185 dwellings in Sausal, owner-occupied units account for 160 (86.5%), while renter-occupied units make up 25 (13.5%).
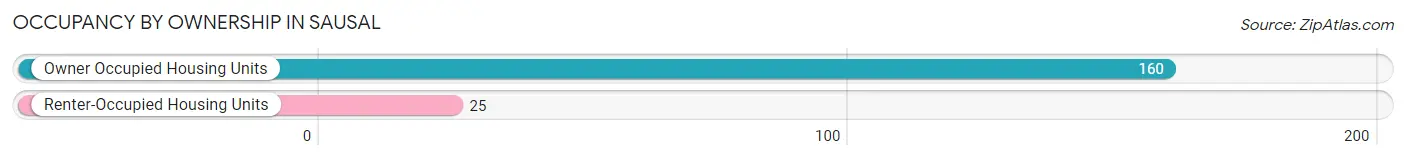
| Occupancy | # Housing Units | % Housing Units |
| Owner Occupied Housing Units | 160 | 86.5% |
| Renter-Occupied Housing Units | 25 | 13.5% |
| Total Occupied Housing Units | 185 | 100.0% |
Occupancy by Household Size in Sausal
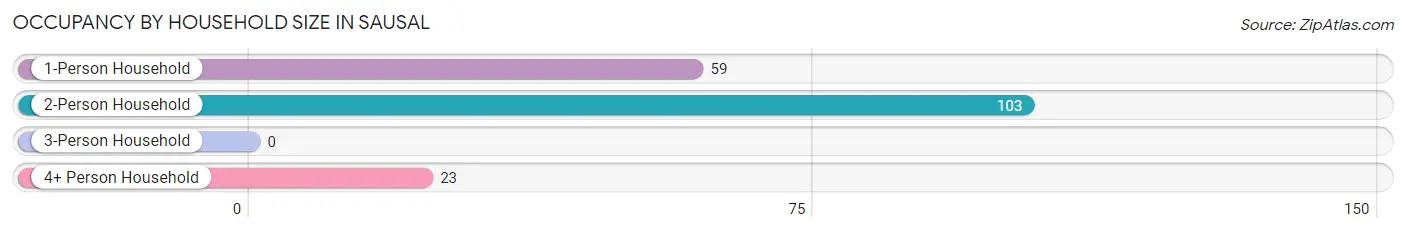
| Household Size | # Housing Units | % Housing Units |
| 1-Person Household | 59 | 31.9% |
| 2-Person Household | 103 | 55.7% |
| 3-Person Household | 0 | 0.0% |
| 4+ Person Household | 23 | 12.4% |
| Total Housing Units | 185 | 100.0% |
Occupancy by Ownership by Household Size in Sausal
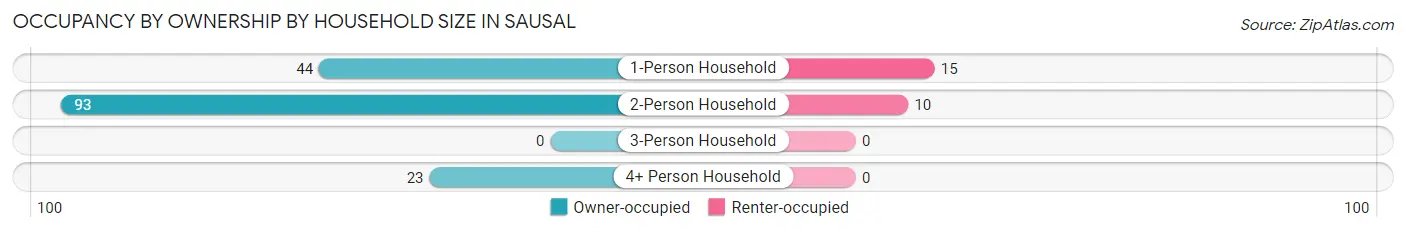
| Household Size | Owner-occupied | Renter-occupied |
| 1-Person Household | 44 (74.6%) | 15 (25.4%) |
| 2-Person Household | 93 (90.3%) | 10 (9.7%) |
| 3-Person Household | 0 (0.0%) | 0 (0.0%) |
| 4+ Person Household | 23 (100.0%) | 0 (0.0%) |
| Total Housing Units | 160 (86.5%) | 25 (13.5%) |
Occupancy by Educational Attainment in Sausal
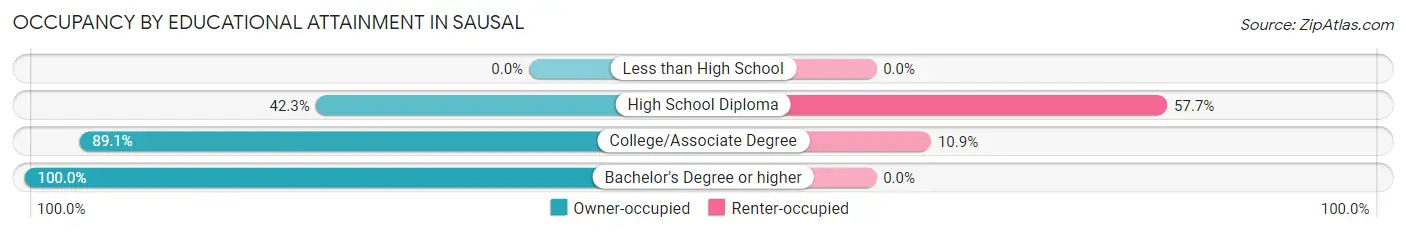
| Household Size | Owner-occupied | Renter-occupied |
| Less than High School | 0 (0.0%) | 0 (0.0%) |
| High School Diploma | 11 (42.3%) | 15 (57.7%) |
| College/Associate Degree | 82 (89.1%) | 10 (10.9%) |
| Bachelor's Degree or higher | 67 (100.0%) | 0 (0.0%) |
Occupancy by Age of Householder in Sausal
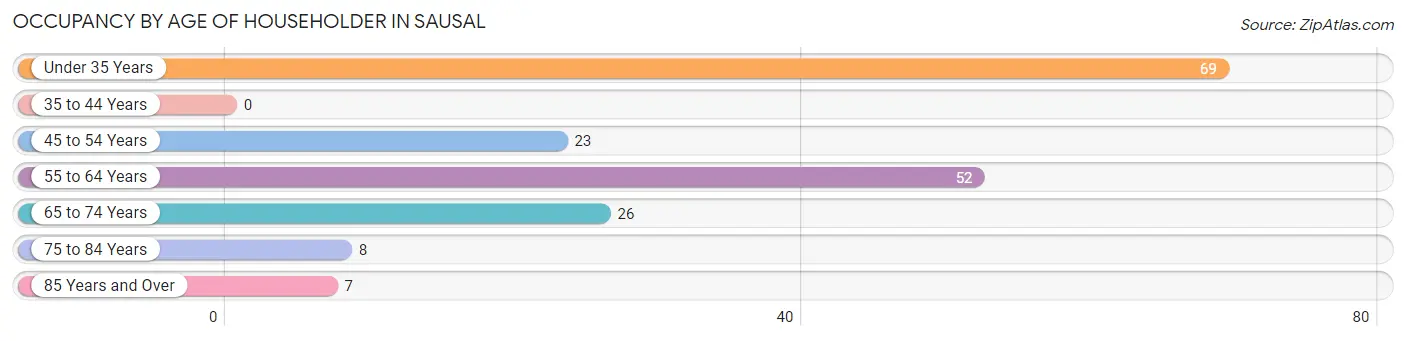
| Age Bracket | # Households | % Households |
| Under 35 Years | 69 | 37.3% |
| 35 to 44 Years | 0 | 0.0% |
| 45 to 54 Years | 23 | 12.4% |
| 55 to 64 Years | 52 | 28.1% |
| 65 to 74 Years | 26 | 14.1% |
| 75 to 84 Years | 8 | 4.3% |
| 85 Years and Over | 7 | 3.8% |
| Total | 185 | 100.0% |
Housing Finances in Sausal
Median Income by Occupancy in Sausal
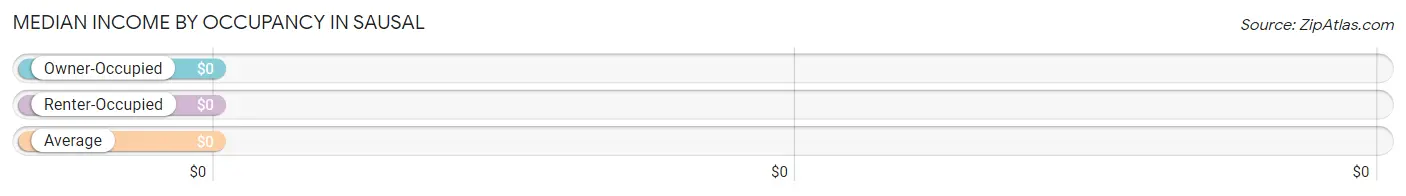
| Occupancy Type | # Households | Median Income |
| Owner-Occupied | 160 (86.5%) | $0 |
| Renter-Occupied | 25 (13.5%) | $0 |
| Average | 185 (100.0%) | $0 |
Occupancy by Householder Income Bracket in Sausal
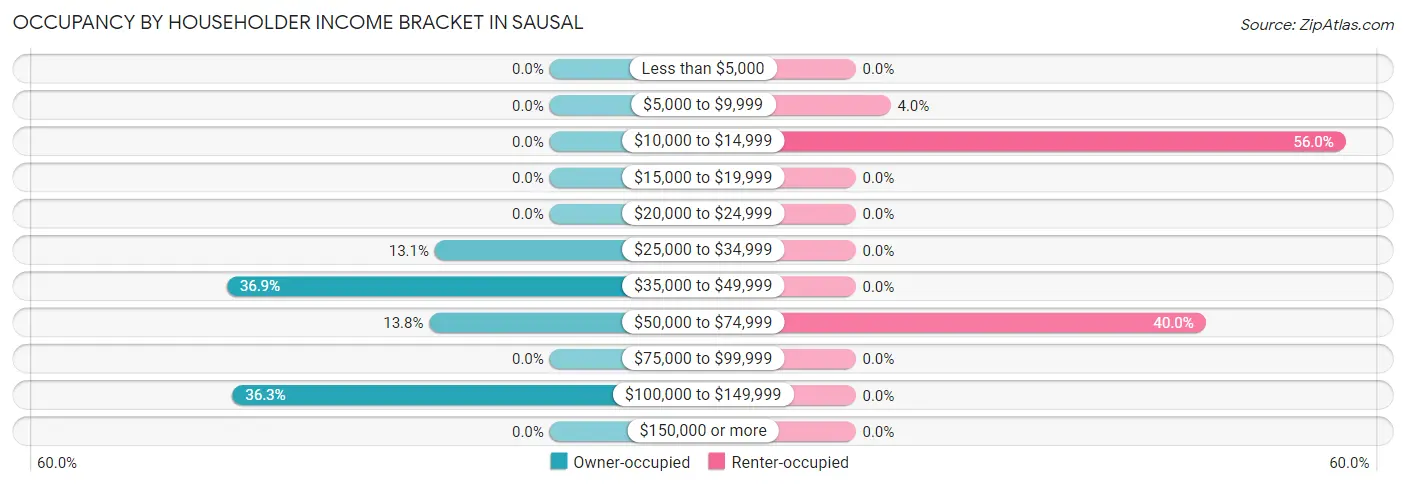
| Income Bracket | Owner-occupied | Renter-occupied |
| Less than $5,000 | 0 (0.0%) | 0 (0.0%) |
| $5,000 to $9,999 | 0 (0.0%) | 1 (4.0%) |
| $10,000 to $14,999 | 0 (0.0%) | 14 (56.0%) |
| $15,000 to $19,999 | 0 (0.0%) | 0 (0.0%) |
| $20,000 to $24,999 | 0 (0.0%) | 0 (0.0%) |
| $25,000 to $34,999 | 21 (13.1%) | 0 (0.0%) |
| $35,000 to $49,999 | 59 (36.9%) | 0 (0.0%) |
| $50,000 to $74,999 | 22 (13.8%) | 10 (40.0%) |
| $75,000 to $99,999 | 0 (0.0%) | 0 (0.0%) |
| $100,000 to $149,999 | 58 (36.2%) | 0 (0.0%) |
| $150,000 or more | 0 (0.0%) | 0 (0.0%) |
| Total | 160 (100.0%) | 25 (100.0%) |
Monthly Housing Cost Tiers in Sausal
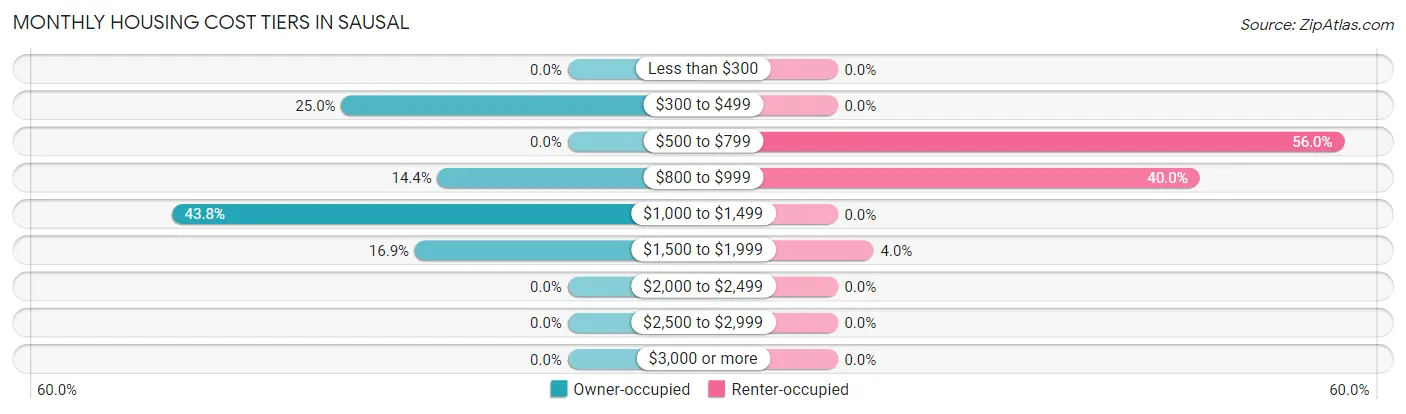
| Monthly Cost | Owner-occupied | Renter-occupied |
| Less than $300 | 0 (0.0%) | 0 (0.0%) |
| $300 to $499 | 40 (25.0%) | 0 (0.0%) |
| $500 to $799 | 0 (0.0%) | 14 (56.0%) |
| $800 to $999 | 23 (14.4%) | 10 (40.0%) |
| $1,000 to $1,499 | 70 (43.8%) | 0 (0.0%) |
| $1,500 to $1,999 | 27 (16.9%) | 1 (4.0%) |
| $2,000 to $2,499 | 0 (0.0%) | 0 (0.0%) |
| $2,500 to $2,999 | 0 (0.0%) | 0 (0.0%) |
| $3,000 or more | 0 (0.0%) | 0 (0.0%) |
| Total | 160 (100.0%) | 25 (100.0%) |
Physical Housing Characteristics in Sausal
Housing Structures in Sausal
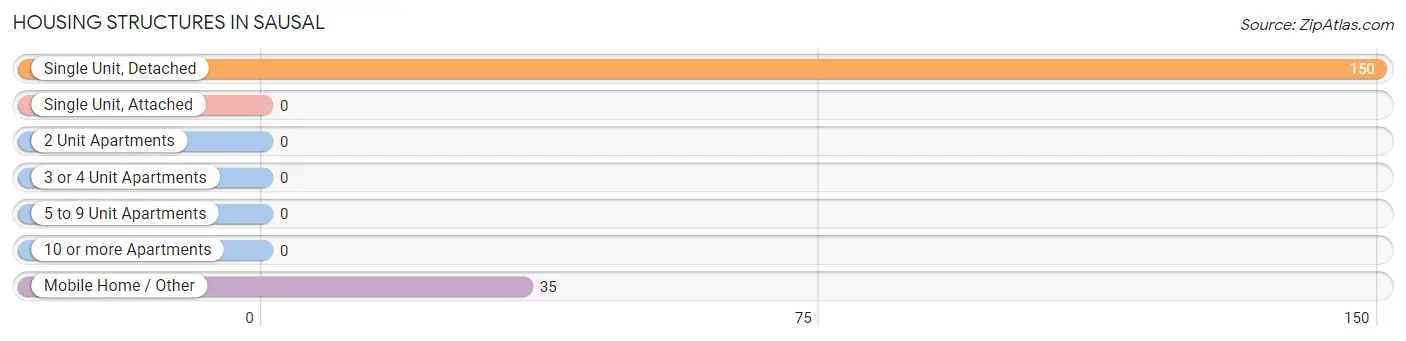
| Structure Type | # Housing Units | % Housing Units |
| Single Unit, Detached | 150 | 81.1% |
| Single Unit, Attached | 0 | 0.0% |
| 2 Unit Apartments | 0 | 0.0% |
| 3 or 4 Unit Apartments | 0 | 0.0% |
| 5 to 9 Unit Apartments | 0 | 0.0% |
| 10 or more Apartments | 0 | 0.0% |
| Mobile Home / Other | 35 | 18.9% |
| Total | 185 | 100.0% |
Housing Structures by Occupancy in Sausal
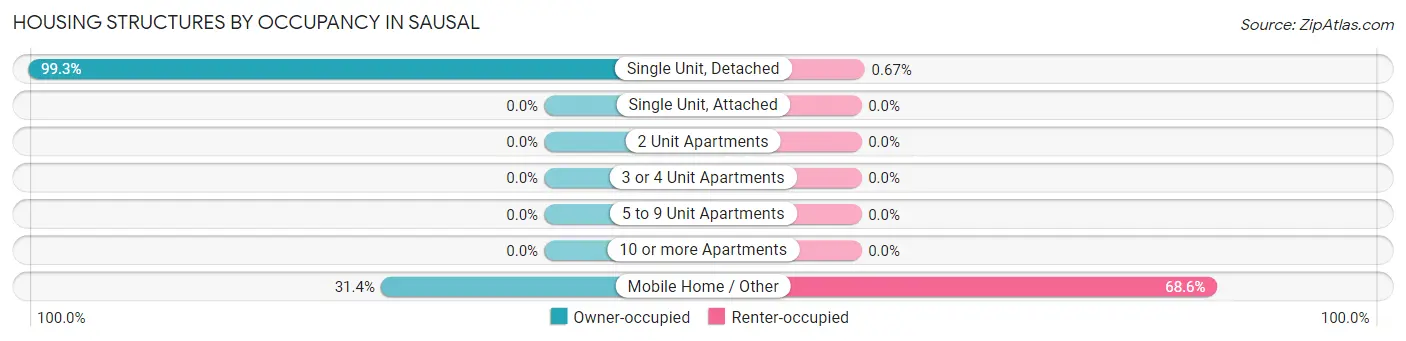
| Structure Type | Owner-occupied | Renter-occupied |
| Single Unit, Detached | 149 (99.3%) | 1 (0.7%) |
| Single Unit, Attached | 0 (0.0%) | 0 (0.0%) |
| 2 Unit Apartments | 0 (0.0%) | 0 (0.0%) |
| 3 or 4 Unit Apartments | 0 (0.0%) | 0 (0.0%) |
| 5 to 9 Unit Apartments | 0 (0.0%) | 0 (0.0%) |
| 10 or more Apartments | 0 (0.0%) | 0 (0.0%) |
| Mobile Home / Other | 11 (31.4%) | 24 (68.6%) |
| Total | 160 (86.5%) | 25 (13.5%) |
Housing Structures by Number of Rooms in Sausal
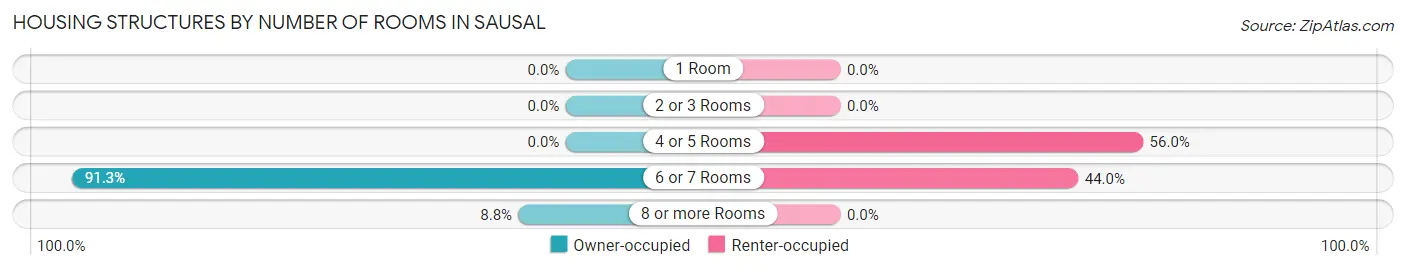
| Number of Rooms | Owner-occupied | Renter-occupied |
| 1 Room | 0 (0.0%) | 0 (0.0%) |
| 2 or 3 Rooms | 0 (0.0%) | 0 (0.0%) |
| 4 or 5 Rooms | 0 (0.0%) | 14 (56.0%) |
| 6 or 7 Rooms | 146 (91.2%) | 11 (44.0%) |
| 8 or more Rooms | 14 (8.7%) | 0 (0.0%) |
| Total | 160 (100.0%) | 25 (100.0%) |
Housing Structure by Heating Type in Sausal
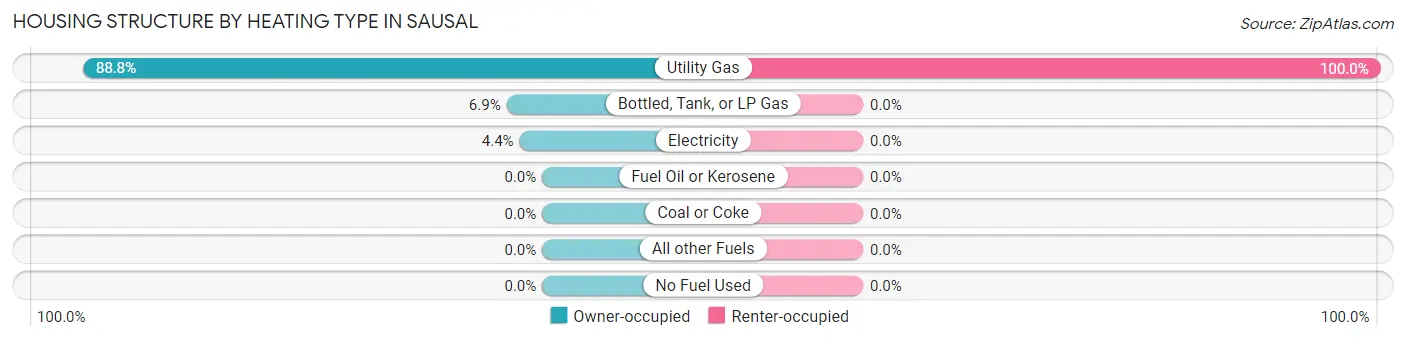
| Heating Type | Owner-occupied | Renter-occupied |
| Utility Gas | 142 (88.7%) | 25 (100.0%) |
| Bottled, Tank, or LP Gas | 11 (6.9%) | 0 (0.0%) |
| Electricity | 7 (4.4%) | 0 (0.0%) |
| Fuel Oil or Kerosene | 0 (0.0%) | 0 (0.0%) |
| Coal or Coke | 0 (0.0%) | 0 (0.0%) |
| All other Fuels | 0 (0.0%) | 0 (0.0%) |
| No Fuel Used | 0 (0.0%) | 0 (0.0%) |
| Total | 160 (100.0%) | 25 (100.0%) |
Household Vehicle Usage in Sausal
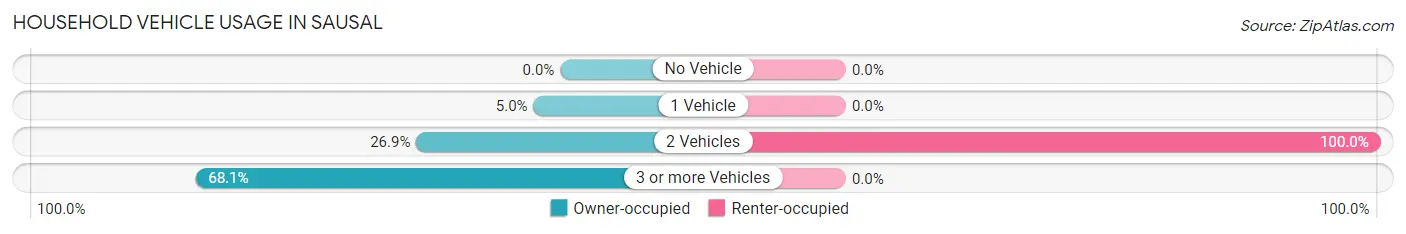
| Vehicles per Household | Owner-occupied | Renter-occupied |
| No Vehicle | 0 (0.0%) | 0 (0.0%) |
| 1 Vehicle | 8 (5.0%) | 0 (0.0%) |
| 2 Vehicles | 43 (26.9%) | 25 (100.0%) |
| 3 or more Vehicles | 109 (68.1%) | 0 (0.0%) |
| Total | 160 (100.0%) | 25 (100.0%) |
Real Estate & Mortgages in Sausal
Real Estate and Mortgage Overview in Sausal
| Characteristic | Without Mortgage | With Mortgage |
| Housing Units | 40 | 120 |
| Median Property Value | $190,000 | $222,000 |
| Median Household Income | $58,000 | $0 |
| Monthly Housing Costs | $374 | $0 |
| Real Estate Taxes | $2,143 | $23 |
Property Value by Mortgage Status in Sausal
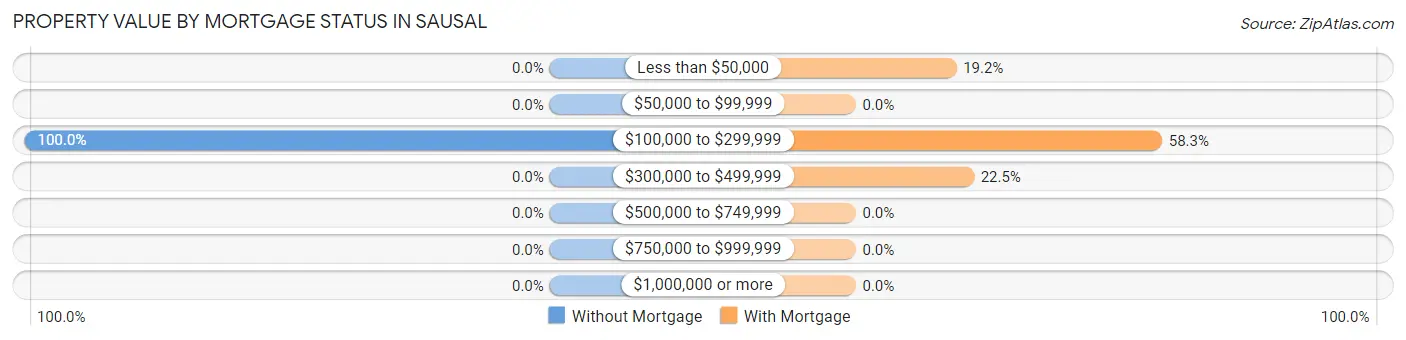
| Property Value | Without Mortgage | With Mortgage |
| Less than $50,000 | 0 (0.0%) | 23 (19.2%) |
| $50,000 to $99,999 | 0 (0.0%) | 0 (0.0%) |
| $100,000 to $299,999 | 40 (100.0%) | 70 (58.3%) |
| $300,000 to $499,999 | 0 (0.0%) | 27 (22.5%) |
| $500,000 to $749,999 | 0 (0.0%) | 0 (0.0%) |
| $750,000 to $999,999 | 0 (0.0%) | 0 (0.0%) |
| $1,000,000 or more | 0 (0.0%) | 0 (0.0%) |
| Total | 40 (100.0%) | 120 (100.0%) |
Household Income by Mortgage Status in Sausal
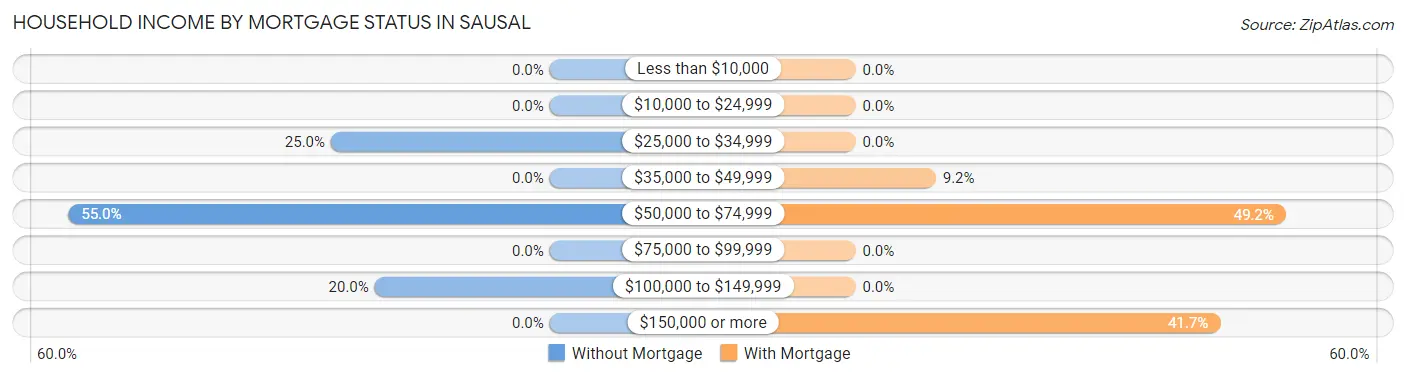
| Household Income | Without Mortgage | With Mortgage |
| Less than $10,000 | 0 (0.0%) | 0 (0.0%) |
| $10,000 to $24,999 | 0 (0.0%) | 0 (0.0%) |
| $25,000 to $34,999 | 10 (25.0%) | 0 (0.0%) |
| $35,000 to $49,999 | 0 (0.0%) | 11 (9.2%) |
| $50,000 to $74,999 | 22 (55.0%) | 59 (49.2%) |
| $75,000 to $99,999 | 0 (0.0%) | 0 (0.0%) |
| $100,000 to $149,999 | 8 (20.0%) | 0 (0.0%) |
| $150,000 or more | 0 (0.0%) | 50 (41.7%) |
| Total | 40 (100.0%) | 120 (100.0%) |
Property Value to Household Income Ratio in Sausal
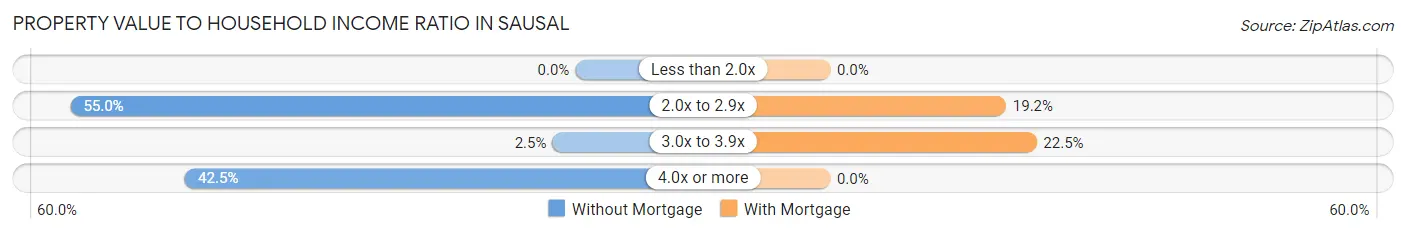
| Value-to-Income Ratio | Without Mortgage | With Mortgage |
| Less than 2.0x | 0 (0.0%) | 0 (0.0%) |
| 2.0x to 2.9x | 22 (55.0%) | 23 (19.2%) |
| 3.0x to 3.9x | 1 (2.5%) | 27 (22.5%) |
| 4.0x or more | 17 (42.5%) | 0 (0.0%) |
| Total | 40 (100.0%) | 120 (100.0%) |
Real Estate Taxes by Mortgage Status in Sausal
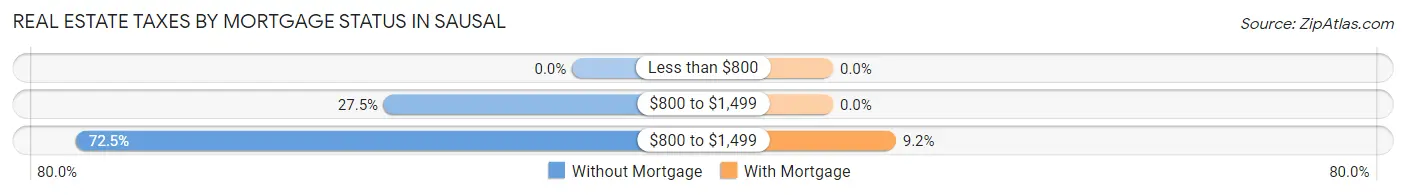
| Property Taxes | Without Mortgage | With Mortgage |
| Less than $800 | 0 (0.0%) | 0 (0.0%) |
| $800 to $1,499 | 11 (27.5%) | 0 (0.0%) |
| $800 to $1,499 | 29 (72.5%) | 11 (9.2%) |
| Total | 40 (100.0%) | 120 (100.0%) |
Health & Disability in Sausal
Health Insurance Coverage by Age in Sausal
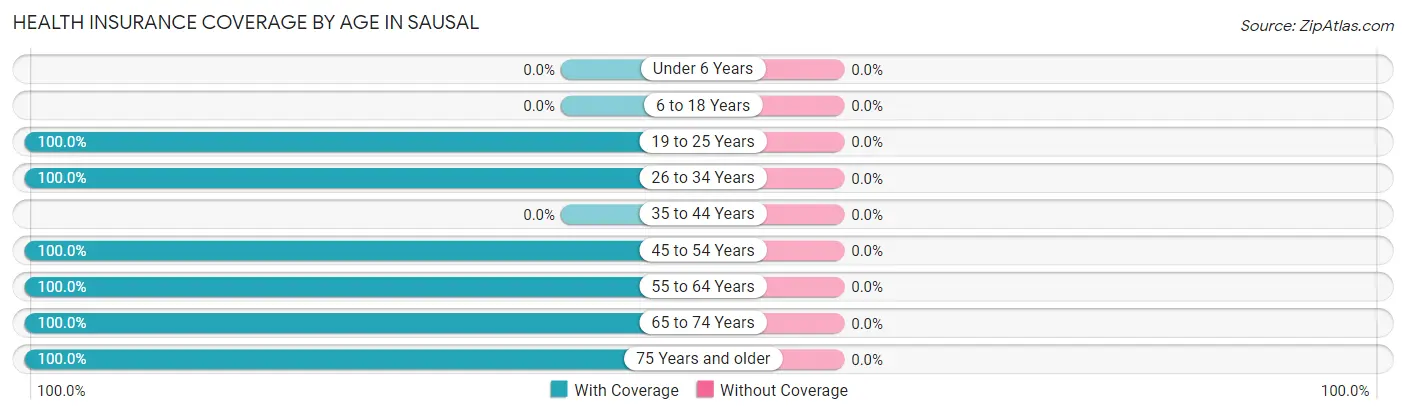
| Age Bracket | With Coverage | Without Coverage |
| Under 6 Years | 0 (0.0%) | 0 (0.0%) |
| 6 to 18 Years | 0 (0.0%) | 0 (0.0%) |
| 19 to 25 Years | 140 (100.0%) | 0 (0.0%) |
| 26 to 34 Years | 80 (100.0%) | 0 (0.0%) |
| 35 to 44 Years | 0 (0.0%) | 0 (0.0%) |
| 45 to 54 Years | 45 (100.0%) | 0 (0.0%) |
| 55 to 64 Years | 52 (100.0%) | 0 (0.0%) |
| 65 to 74 Years | 157 (100.0%) | 0 (0.0%) |
| 75 Years and older | 23 (100.0%) | 0 (0.0%) |
| Total | 497 (100.0%) | 0 (0.0%) |
Health Insurance Coverage by Citizenship Status in Sausal
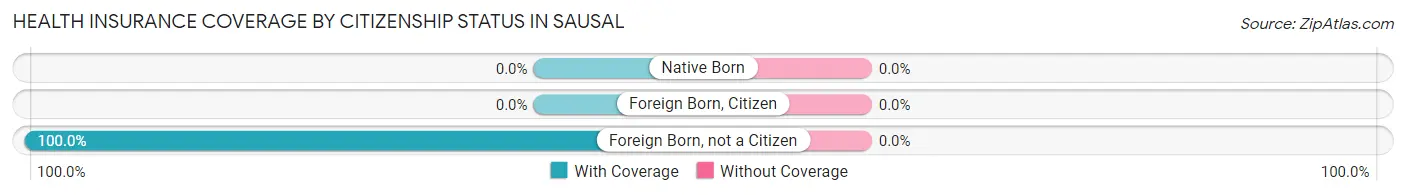
| Citizenship Status | With Coverage | Without Coverage |
| Native Born | 0 (0.0%) | 0 (0.0%) |
| Foreign Born, Citizen | 0 (0.0%) | 0 (0.0%) |
| Foreign Born, not a Citizen | 140 (100.0%) | 0 (0.0%) |
Health Insurance Coverage by Household Income in Sausal
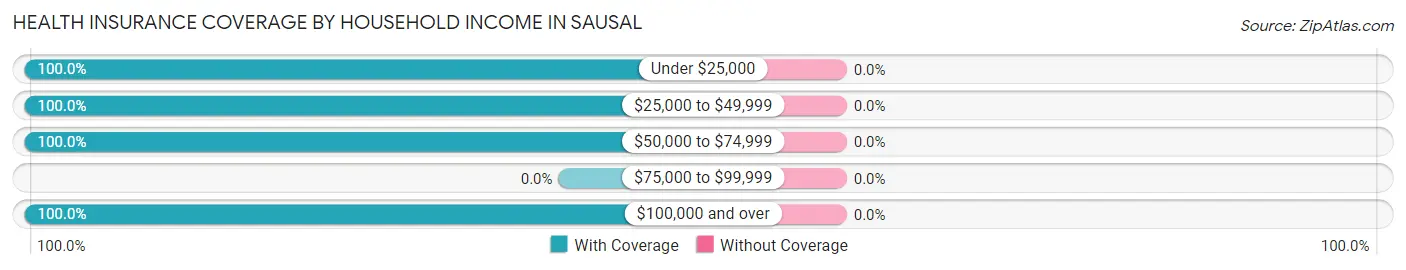
| Household Income | With Coverage | Without Coverage |
| Under $25,000 | 15 (100.0%) | 0 (0.0%) |
| $25,000 to $49,999 | 167 (100.0%) | 0 (0.0%) |
| $50,000 to $74,999 | 58 (100.0%) | 0 (0.0%) |
| $75,000 to $99,999 | 0 (0.0%) | 0 (0.0%) |
| $100,000 and over | 257 (100.0%) | 0 (0.0%) |
Public vs Private Health Insurance Coverage by Age in Sausal
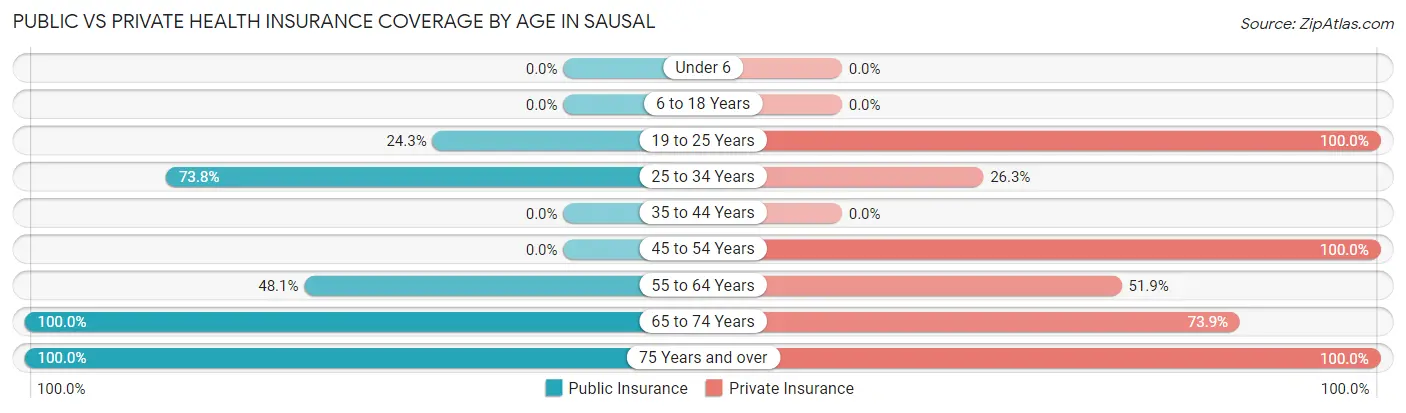
| Age Bracket | Public Insurance | Private Insurance |
| Under 6 | 0 (0.0%) | 0 (0.0%) |
| 6 to 18 Years | 0 (0.0%) | 0 (0.0%) |
| 19 to 25 Years | 34 (24.3%) | 140 (100.0%) |
| 25 to 34 Years | 59 (73.8%) | 21 (26.3%) |
| 35 to 44 Years | 0 (0.0%) | 0 (0.0%) |
| 45 to 54 Years | 0 (0.0%) | 45 (100.0%) |
| 55 to 64 Years | 25 (48.1%) | 27 (51.9%) |
| 65 to 74 Years | 157 (100.0%) | 116 (73.9%) |
| 75 Years and over | 23 (100.0%) | 23 (100.0%) |
| Total | 298 (60.0%) | 372 (74.9%) |
Disability Status by Sex by Age in Sausal
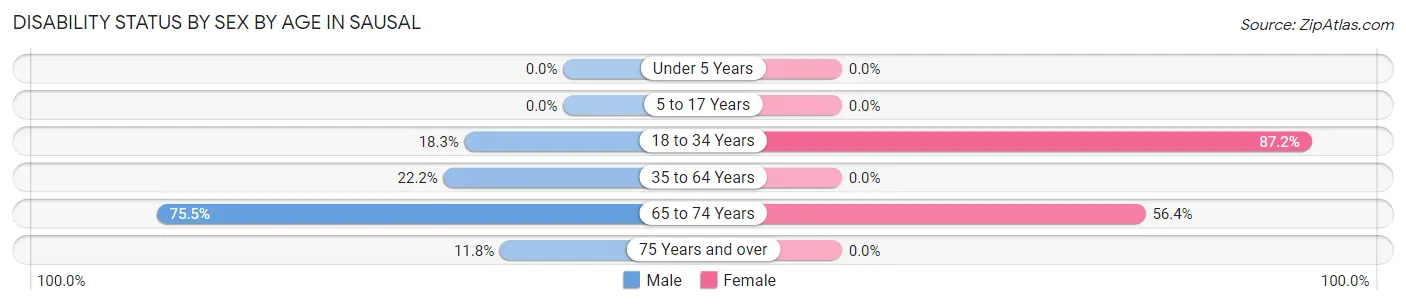
| Age Bracket | Male | Female |
| Under 5 Years | 0 (0.0%) | 0 (0.0%) |
| 5 to 17 Years | 0 (0.0%) | 0 (0.0%) |
| 18 to 34 Years | 26 (18.3%) | 68 (87.2%) |
| 35 to 64 Years | 14 (22.2%) | 0 (0.0%) |
| 65 to 74 Years | 77 (75.5%) | 31 (56.4%) |
| 75 Years and over | 2 (11.8%) | 0 (0.0%) |
Disability Class by Sex by Age in Sausal
Disability Class: Hearing Difficulty
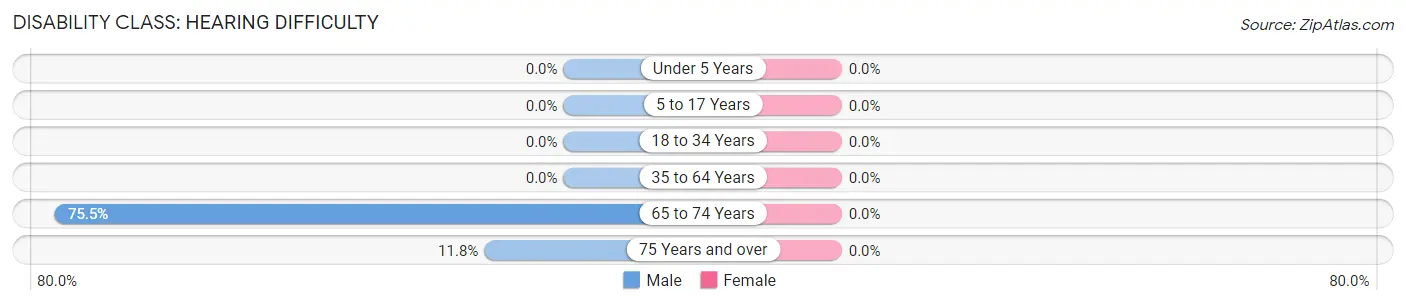
| Age Bracket | Male | Female |
| Under 5 Years | 0 (0.0%) | 0 (0.0%) |
| 5 to 17 Years | 0 (0.0%) | 0 (0.0%) |
| 18 to 34 Years | 0 (0.0%) | 0 (0.0%) |
| 35 to 64 Years | 0 (0.0%) | 0 (0.0%) |
| 65 to 74 Years | 77 (75.5%) | 0 (0.0%) |
| 75 Years and over | 2 (11.8%) | 0 (0.0%) |
Disability Class: Vision Difficulty
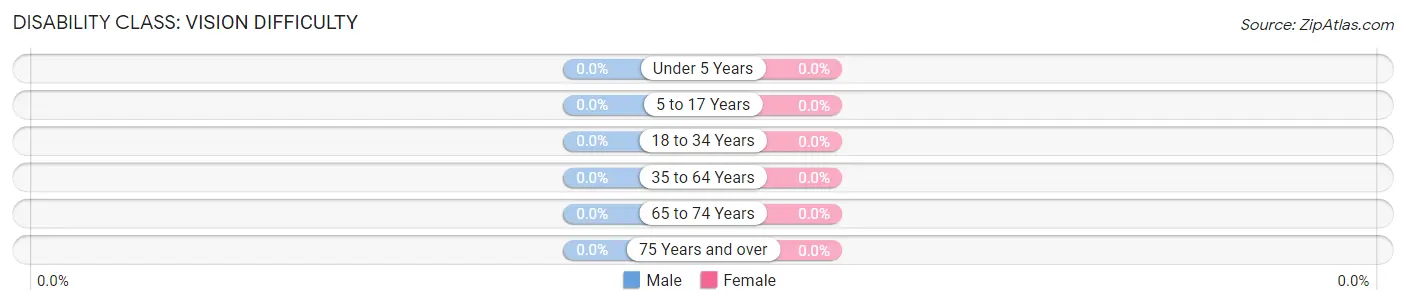
| Age Bracket | Male | Female |
| Under 5 Years | 0 (0.0%) | 0 (0.0%) |
| 5 to 17 Years | 0 (0.0%) | 0 (0.0%) |
| 18 to 34 Years | 0 (0.0%) | 0 (0.0%) |
| 35 to 64 Years | 0 (0.0%) | 0 (0.0%) |
| 65 to 74 Years | 0 (0.0%) | 0 (0.0%) |
| 75 Years and over | 0 (0.0%) | 0 (0.0%) |
Disability Class: Cognitive Difficulty
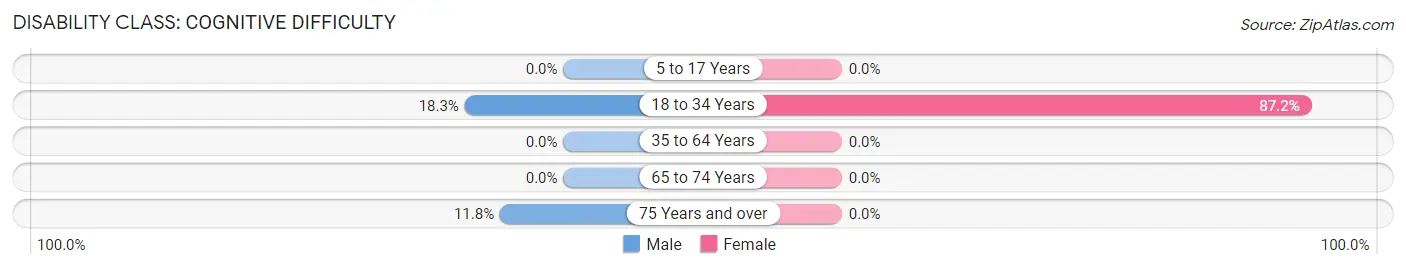
| Age Bracket | Male | Female |
| 5 to 17 Years | 0 (0.0%) | 0 (0.0%) |
| 18 to 34 Years | 26 (18.3%) | 68 (87.2%) |
| 35 to 64 Years | 0 (0.0%) | 0 (0.0%) |
| 65 to 74 Years | 0 (0.0%) | 0 (0.0%) |
| 75 Years and over | 2 (11.8%) | 0 (0.0%) |
Disability Class: Ambulatory Difficulty
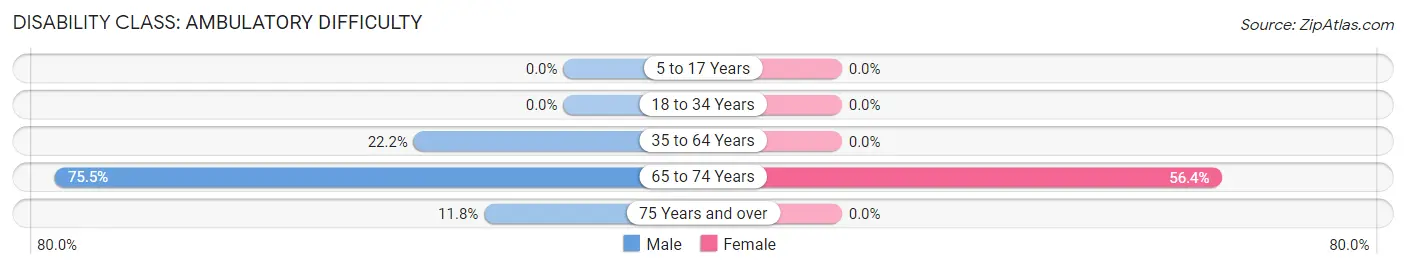
| Age Bracket | Male | Female |
| 5 to 17 Years | 0 (0.0%) | 0 (0.0%) |
| 18 to 34 Years | 0 (0.0%) | 0 (0.0%) |
| 35 to 64 Years | 14 (22.2%) | 0 (0.0%) |
| 65 to 74 Years | 77 (75.5%) | 31 (56.4%) |
| 75 Years and over | 2 (11.8%) | 0 (0.0%) |
Disability Class: Self-Care Difficulty
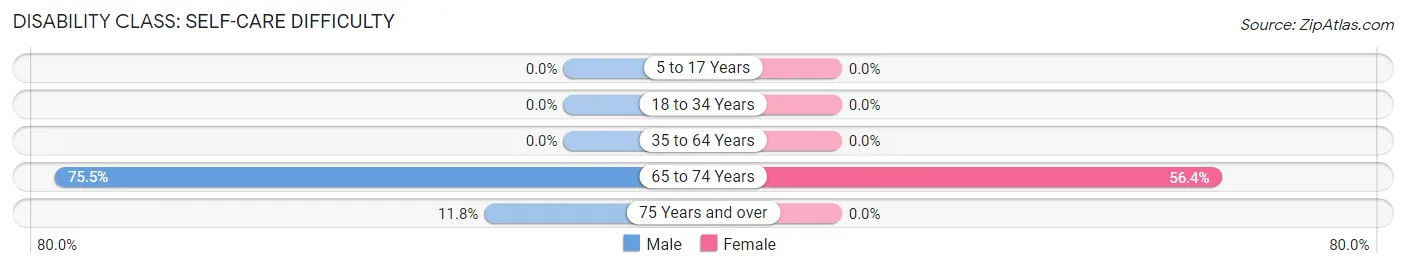
| Age Bracket | Male | Female |
| 5 to 17 Years | 0 (0.0%) | 0 (0.0%) |
| 18 to 34 Years | 0 (0.0%) | 0 (0.0%) |
| 35 to 64 Years | 0 (0.0%) | 0 (0.0%) |
| 65 to 74 Years | 77 (75.5%) | 31 (56.4%) |
| 75 Years and over | 2 (11.8%) | 0 (0.0%) |
Technology Access in Sausal
Computing Device Access in Sausal
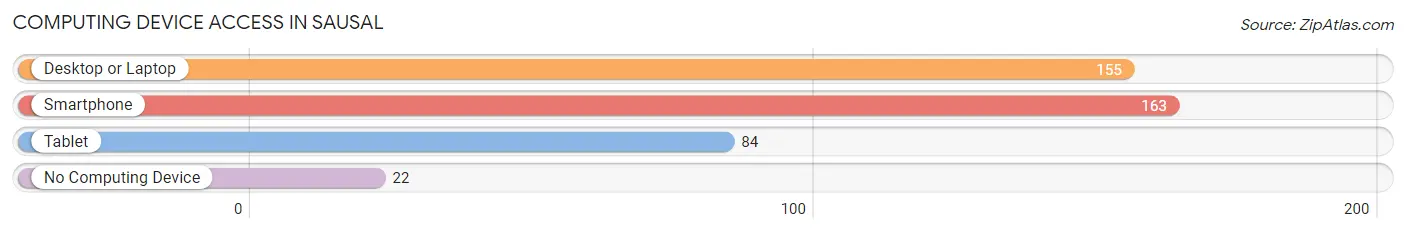
| Device Type | # Households | % Households |
| Desktop or Laptop | 155 | 83.8% |
| Smartphone | 163 | 88.1% |
| Tablet | 84 | 45.4% |
| No Computing Device | 22 | 11.9% |
| Total | 185 | 100.0% |
Internet Access in Sausal
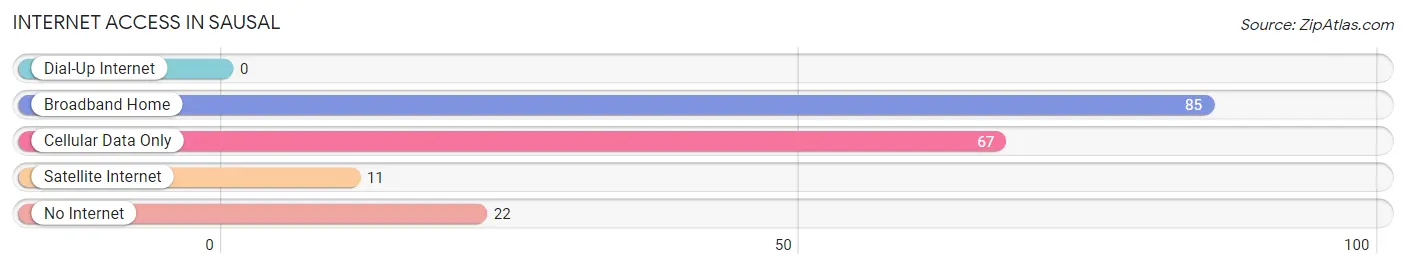
| Internet Type | # Households | % Households |
| Dial-Up Internet | 0 | 0.0% |
| Broadband Home | 85 | 46.0% |
| Cellular Data Only | 67 | 36.2% |
| Satellite Internet | 11 | 5.9% |
| No Internet | 22 | 11.9% |
| Total | 185 | 100.0% |
Sausal Summary
Sausal, New Mexico is a small unincorporated community located in the northern part of the state, in San Miguel County. It is situated in the foothills of the Sangre de Cristo Mountains, about 25 miles north of Las Vegas, New Mexico. The area is known for its scenic beauty, with rolling hills, lush vegetation, and a variety of wildlife.
History
The area now known as Sausal was originally inhabited by the Tewa Indians, who lived in the area for centuries before the arrival of the Spanish in the late 1500s. The Spanish established a mission in the area in 1620, and the area was later settled by Mexican and American settlers. The town was officially founded in 1876, and was named after the nearby Sausal Creek.
Geography
Sausal is located in the northern part of New Mexico, in San Miguel County. It is situated in the foothills of the Sangre de Cristo Mountains, about 25 miles north of Las Vegas, New Mexico. The area is known for its scenic beauty, with rolling hills, lush vegetation, and a variety of wildlife. The climate is semi-arid, with hot summers and cold winters.
Economy
The economy of Sausal is largely based on agriculture and ranching. The area is known for its production of hay, alfalfa, and other crops. Livestock production is also important to the local economy, with cattle, sheep, and horses being raised in the area. Tourism is also an important part of the local economy, with visitors coming to the area to enjoy the scenic beauty and outdoor activities.
Demographics
As of the 2010 census, the population of Sausal was 1,072. The population is largely Hispanic, with over 90% of the population identifying as Hispanic or Latino. The median household income is $30,000, and the median age is 37. The area is largely rural, with most of the population living in small towns and villages.
Sausal is a small, rural community with a rich history and a unique culture. The area is known for its scenic beauty and outdoor activities, and is a popular destination for tourists and outdoor enthusiasts. The economy is largely based on agriculture and ranching, and the population is largely Hispanic. Sausal is a great place to visit and explore, and is a great example of the beauty and culture of New Mexico.
Common Questions
What is Per Capita Income in Sausal?
Per Capita income in Sausal is $25,276.
What is the Median Family Income in Sausal?
Median Family Income in Sausal is $71,875.
What is Inequality or Gini Index in Sausal?
Inequality or Gini Index in Sausal is 0.35.
What is the Total Population of Sausal?
Total Population of Sausal is 497.
What is the Total Male Population of Sausal?
Total Male Population of Sausal is 324.
What is the Total Female Population of Sausal?
Total Female Population of Sausal is 173.
What is the Ratio of Males per 100 Females in Sausal?
There are 187.28 Males per 100 Females in Sausal.
What is the Ratio of Females per 100 Males in Sausal?
There are 53.40 Females per 100 Males in Sausal.
What is the Median Population Age in Sausal?
Median Population Age in Sausal is 48.3 Years.
What is the Average Family Size in Sausal
Average Family Size in Sausal is 4.5 People.
What is the Average Household Size in Sausal
Average Household Size in Sausal is 2.7 People.
How Large is the Labor Force in Sausal?
There are 236 People in the Labor Forcein in Sausal.
What is the Percentage of People in the Labor Force in Sausal?
47.5% of People are in the Labor Force in Sausal.
What is the Unemployment Rate in Sausal?
Unemployment Rate in Sausal is 19.5%.