Hackberry, LA Map & Demographics
Hackberry Map
Hackberry Overview
$31,696
PER CAPITA INCOME
$98,426
AVG FAMILY INCOME
$98,056
AVG HOUSEHOLD INCOME
63.4%
WAGE / INCOME GAP [ % ]
36.6¢/ $1
WAGE / INCOME GAP [ $ ]
0.26
INEQUALITY / GINI INDEX
988
TOTAL POPULATION
545
MALE POPULATION
443
FEMALE POPULATION
123.02
MALES / 100 FEMALES
81.28
FEMALES / 100 MALES
52.2
MEDIAN AGE
2.8
AVG FAMILY SIZE
2.8
AVG HOUSEHOLD SIZE
532
LABOR FORCE [ PEOPLE ]
68.6%
PERCENT IN LABOR FORCE
1.5%
UNEMPLOYMENT RATE
Hackberry Zip Codes
Hackberry Area Codes
Income in Hackberry
Income Overview in Hackberry
Per Capita Income in Hackberry is $31,696, while median incomes of families and households are $98,426 and $98,056 respectively.
| Characteristic | Number | Measure |
| Per Capita Income | 988 | $31,696 |
| Median Family Income | 326 | $98,426 |
| Mean Family Income | 326 | $103,678 |
| Median Household Income | 352 | $98,056 |
| Mean Household Income | 352 | $103,857 |
| Income Deficit | 326 | $0 |
| Wage / Income Gap (%) | 988 | 63.40% |
| Wage / Income Gap ($) | 988 | 36.60¢ per $1 |
| Gini / Inequality Index | 988 | 0.26 |
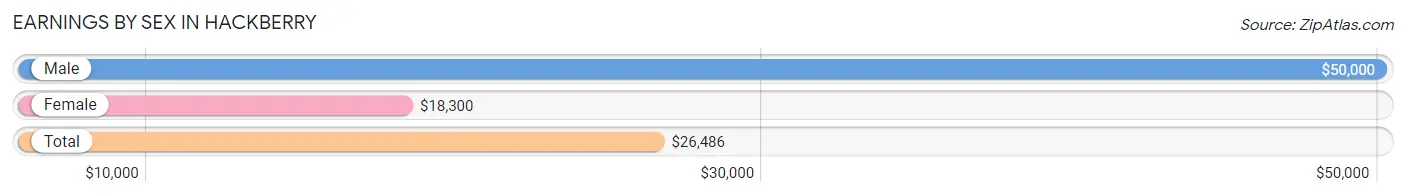
Earnings by Sex in Hackberry
Average Earnings in Hackberry are $26,486, $50,000 for men and $18,300 for women, a difference of 63.4%.
| Sex | Number | Average Earnings |
| Male | 376 (68.9%) | $50,000 |
| Female | 170 (31.1%) | $18,300 |
| Total | 546 (100.0%) | $26,486 |
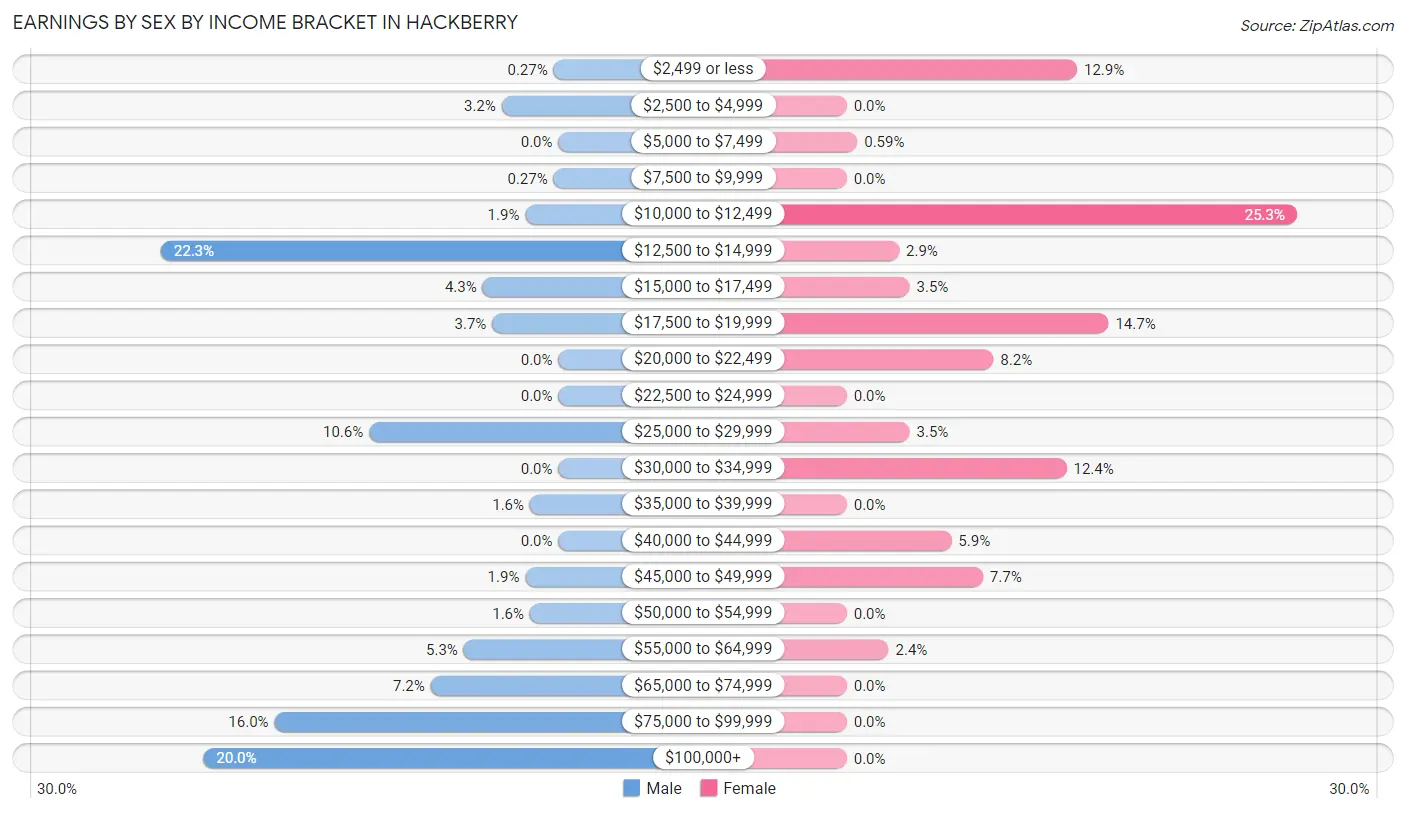
Earnings by Sex by Income Bracket in Hackberry
The most common earnings brackets in Hackberry are $12,500 to $14,999 for men (84 | 22.3%) and $10,000 to $12,499 for women (43 | 25.3%).
| Income | Male | Female |
| $2,499 or less | 1 (0.3%) | 22 (12.9%) |
| $2,500 to $4,999 | 12 (3.2%) | 0 (0.0%) |
| $5,000 to $7,499 | 0 (0.0%) | 1 (0.6%) |
| $7,500 to $9,999 | 1 (0.3%) | 0 (0.0%) |
| $10,000 to $12,499 | 7 (1.9%) | 43 (25.3%) |
| $12,500 to $14,999 | 84 (22.3%) | 5 (2.9%) |
| $15,000 to $17,499 | 16 (4.3%) | 6 (3.5%) |
| $17,500 to $19,999 | 14 (3.7%) | 25 (14.7%) |
| $20,000 to $22,499 | 0 (0.0%) | 14 (8.2%) |
| $22,500 to $24,999 | 0 (0.0%) | 0 (0.0%) |
| $25,000 to $29,999 | 40 (10.6%) | 6 (3.5%) |
| $30,000 to $34,999 | 0 (0.0%) | 21 (12.3%) |
| $35,000 to $39,999 | 6 (1.6%) | 0 (0.0%) |
| $40,000 to $44,999 | 0 (0.0%) | 10 (5.9%) |
| $45,000 to $49,999 | 7 (1.9%) | 13 (7.6%) |
| $50,000 to $54,999 | 6 (1.6%) | 0 (0.0%) |
| $55,000 to $64,999 | 20 (5.3%) | 4 (2.4%) |
| $65,000 to $74,999 | 27 (7.2%) | 0 (0.0%) |
| $75,000 to $99,999 | 60 (16.0%) | 0 (0.0%) |
| $100,000+ | 75 (20.0%) | 0 (0.0%) |
| Total | 376 (100.0%) | 170 (100.0%) |
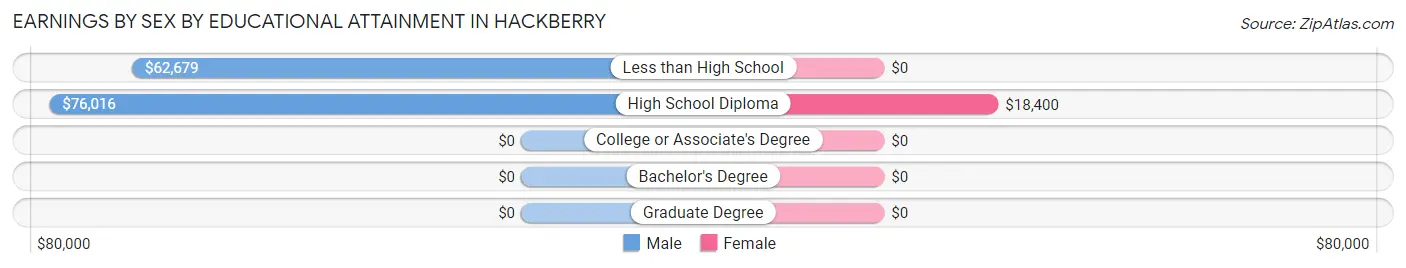
Earnings by Sex by Educational Attainment in Hackberry
Average earnings in Hackberry are $59,375 for men and $18,600 for women, a difference of 68.7%. Men with an educational attainment of high school diploma enjoy the highest average annual earnings of $76,016, while those with less than high school education earn the least with $62,679. Women with an educational attainment of high school diploma earn the most with the average annual earnings of $18,400, while those with high school diploma education have the smallest earnings of $18,400.
| Educational Attainment | Male Income | Female Income |
| Less than High School | $62,679 | $0 |
| High School Diploma | $76,016 | $18,400 |
| College or Associate's Degree | - | - |
| Bachelor's Degree | - | - |
| Graduate Degree | - | - |
| Total | $59,375 | $18,600 |
Family Income in Hackberry
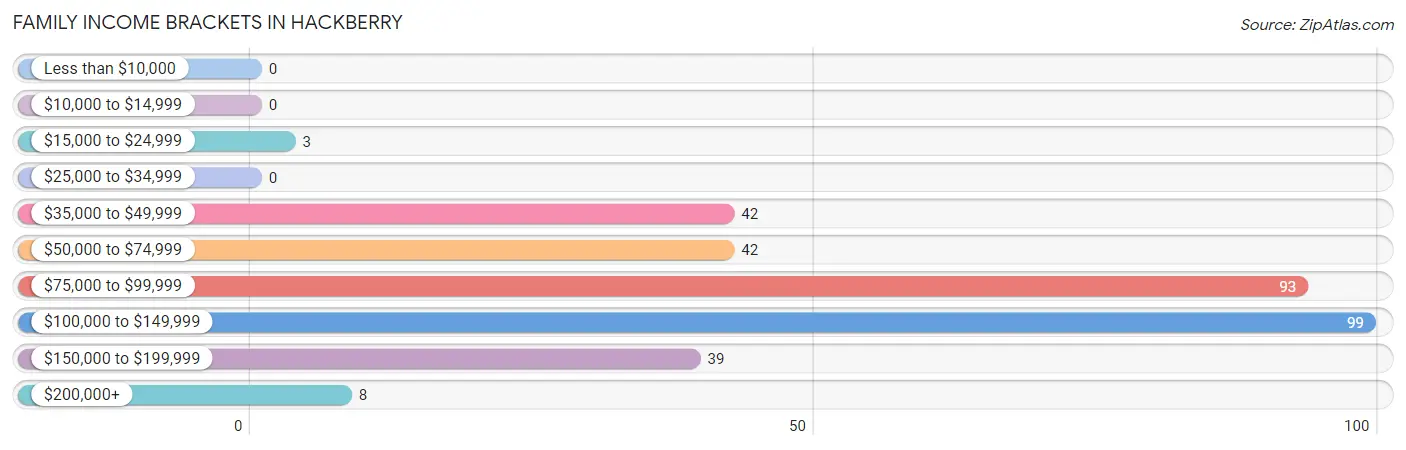
Family Income Brackets in Hackberry
According to the Hackberry family income data, there are 99 families falling into the $100,000 to $149,999 income range, which is the most common income bracket and makes up 30.4% of all families.
| Income Bracket | # Families | % Families |
| Less than $10,000 | 0 | 0.0% |
| $10,000 to $14,999 | 0 | 0.0% |
| $15,000 to $24,999 | 3 | 0.9% |
| $25,000 to $34,999 | 0 | 0.0% |
| $35,000 to $49,999 | 42 | 12.9% |
| $50,000 to $74,999 | 42 | 12.9% |
| $75,000 to $99,999 | 93 | 28.5% |
| $100,000 to $149,999 | 99 | 30.4% |
| $150,000 to $199,999 | 39 | 12.0% |
| $200,000+ | 8 | 2.5% |
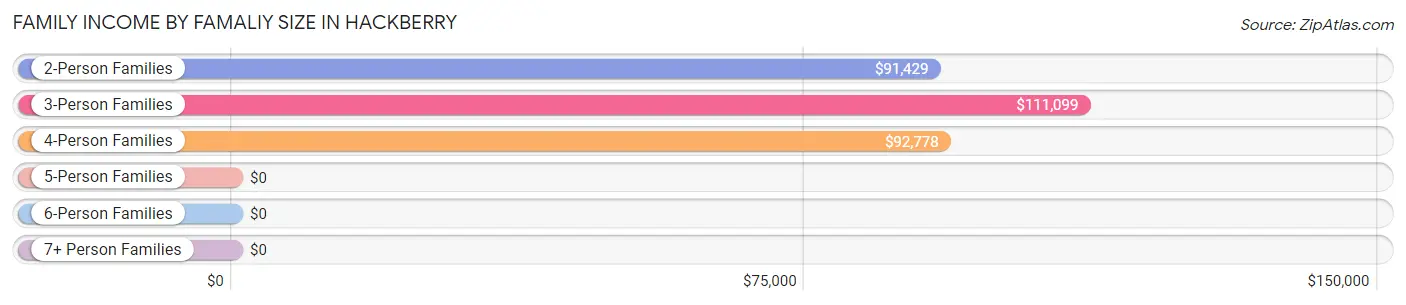
Family Income by Famaliy Size in Hackberry
3-person families (69 | 21.2%) account for the highest median family income in Hackberry with $111,099 per family, while 2-person families (144 | 44.2%) have the highest median income of $45,714 per family member.
| Income Bracket | # Families | Median Income |
| 2-Person Families | 144 (44.2%) | $91,429 |
| 3-Person Families | 69 (21.2%) | $111,099 |
| 4-Person Families | 50 (15.3%) | $92,778 |
| 5-Person Families | 52 (16.0%) | $0 |
| 6-Person Families | 0 (0.0%) | $0 |
| 7+ Person Families | 11 (3.4%) | $0 |
| Total | 326 (100.0%) | $98,426 |
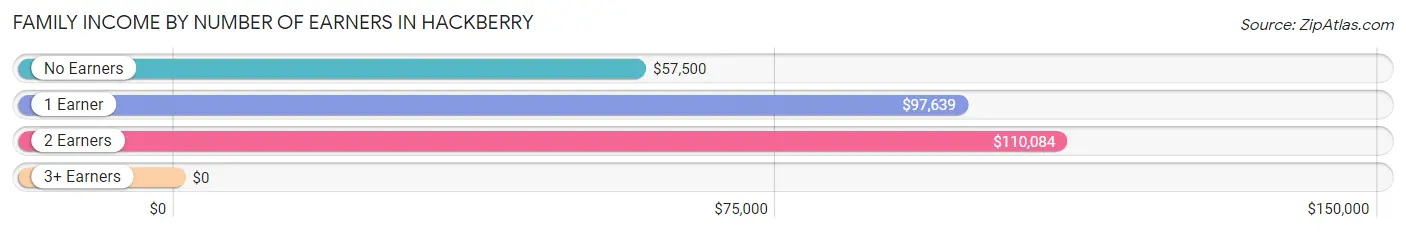
Family Income by Number of Earners in Hackberry
| Number of Earners | # Families | Median Income |
| No Earners | 18 (5.5%) | $57,500 |
| 1 Earner | 99 (30.4%) | $97,639 |
| 2 Earners | 185 (56.8%) | $110,084 |
| 3+ Earners | 24 (7.4%) | $0 |
| Total | 326 (100.0%) | $98,426 |
Household Income in Hackberry
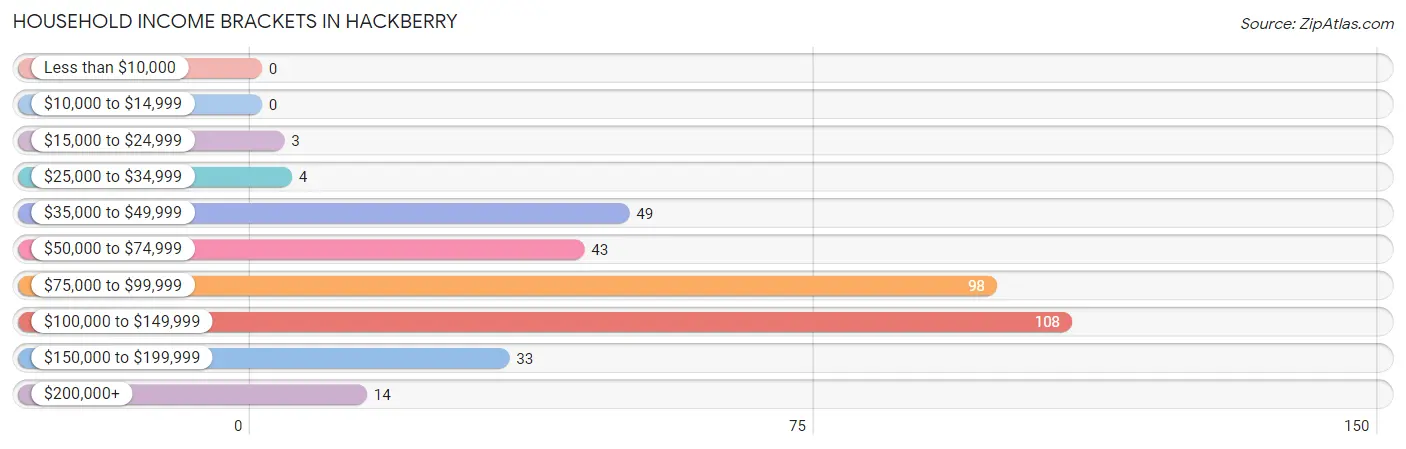
Household Income Brackets in Hackberry
With 108 households falling in the category, the $100,000 to $149,999 income range is the most frequent in Hackberry, accounting for 30.7% of all households.
| Income Bracket | # Households | % Households |
| Less than $10,000 | 0 | 0.0% |
| $10,000 to $14,999 | 0 | 0.0% |
| $15,000 to $24,999 | 3 | 0.9% |
| $25,000 to $34,999 | 4 | 1.1% |
| $35,000 to $49,999 | 49 | 13.9% |
| $50,000 to $74,999 | 43 | 12.2% |
| $75,000 to $99,999 | 98 | 27.8% |
| $100,000 to $149,999 | 108 | 30.7% |
| $150,000 to $199,999 | 33 | 9.4% |
| $200,000+ | 14 | 4.0% |
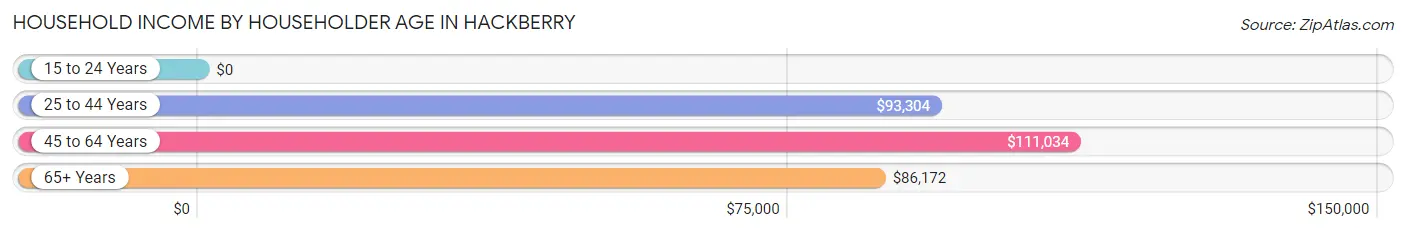
Household Income by Householder Age in Hackberry
The median household income in Hackberry is $98,056, with the highest median household income of $111,034 found in the 45 to 64 years age bracket for the primary householder. A total of 180 households (51.1%) fall into this category.
| Income Bracket | # Households | Median Income |
| 15 to 24 Years | 0 (0.0%) | $0 |
| 25 to 44 Years | 85 (24.1%) | $93,304 |
| 45 to 64 Years | 180 (51.1%) | $111,034 |
| 65+ Years | 87 (24.7%) | $86,172 |
| Total | 352 (100.0%) | $98,056 |
Poverty in Hackberry
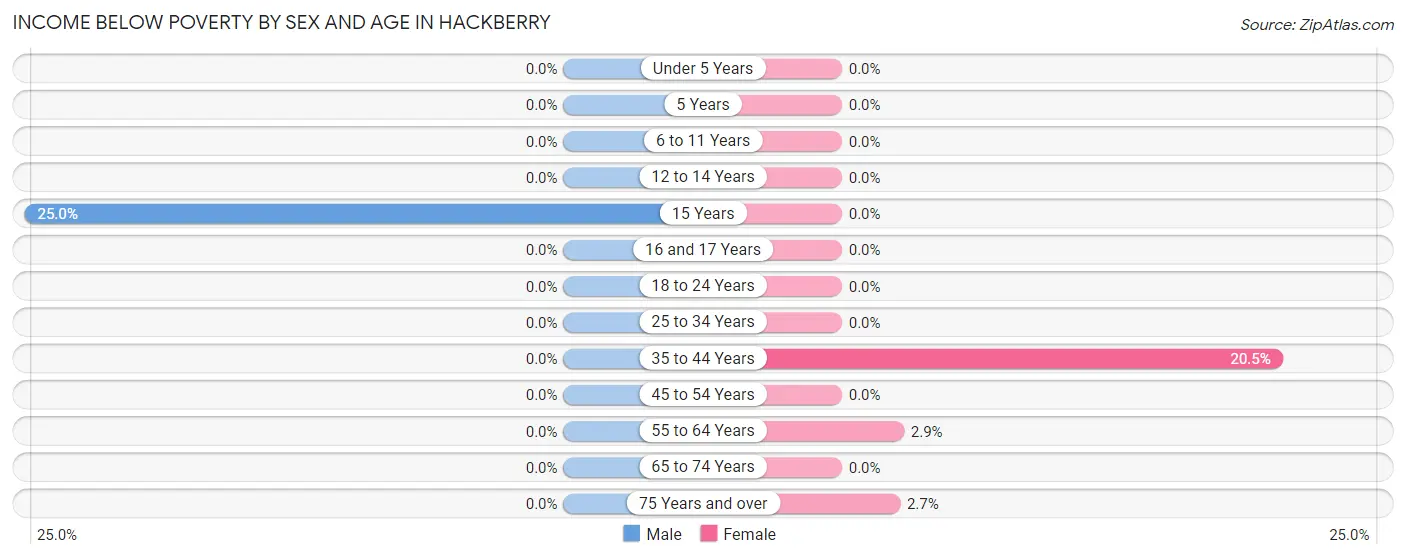
Income Below Poverty by Sex and Age in Hackberry
With 0.2% poverty level for males and 2.9% for females among the residents of Hackberry, 15 year old males and 35 to 44 year old females are the most vulnerable to poverty, with 1 males (25.0%) and 9 females (20.4%) in their respective age groups living below the poverty level.
| Age Bracket | Male | Female |
| Under 5 Years | 0 (0.0%) | 0 (0.0%) |
| 5 Years | 0 (0.0%) | 0 (0.0%) |
| 6 to 11 Years | 0 (0.0%) | 0 (0.0%) |
| 12 to 14 Years | 0 (0.0%) | 0 (0.0%) |
| 15 Years | 1 (25.0%) | 0 (0.0%) |
| 16 and 17 Years | 0 (0.0%) | 0 (0.0%) |
| 18 to 24 Years | 0 (0.0%) | 0 (0.0%) |
| 25 to 34 Years | 0 (0.0%) | 0 (0.0%) |
| 35 to 44 Years | 0 (0.0%) | 9 (20.4%) |
| 45 to 54 Years | 0 (0.0%) | 0 (0.0%) |
| 55 to 64 Years | 0 (0.0%) | 3 (2.9%) |
| 65 to 74 Years | 0 (0.0%) | 0 (0.0%) |
| 75 Years and over | 0 (0.0%) | 1 (2.7%) |
| Total | 1 (0.2%) | 13 (2.9%) |
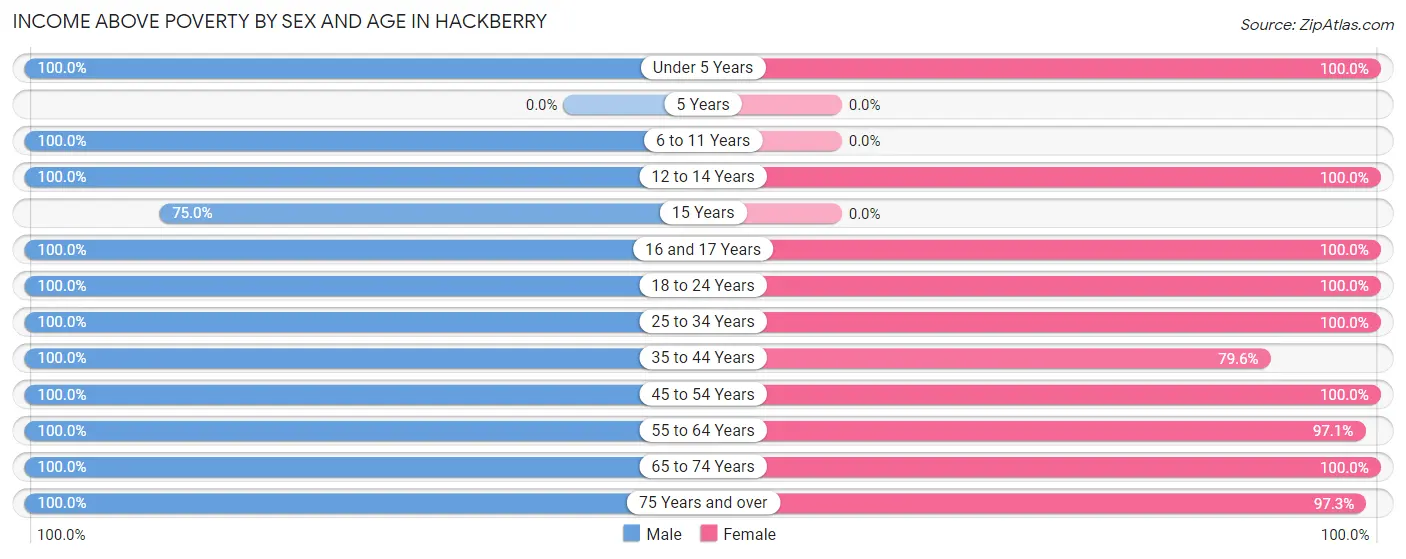
Income Above Poverty by Sex and Age in Hackberry
According to the poverty statistics in Hackberry, males aged under 5 years and females aged under 5 years are the age groups that are most secure financially, with 100.0% of males and 100.0% of females in these age groups living above the poverty line.
| Age Bracket | Male | Female |
| Under 5 Years | 45 (100.0%) | 41 (100.0%) |
| 5 Years | 0 (0.0%) | 0 (0.0%) |
| 6 to 11 Years | 51 (100.0%) | 0 (0.0%) |
| 12 to 14 Years | 18 (100.0%) | 40 (100.0%) |
| 15 Years | 3 (75.0%) | 0 (0.0%) |
| 16 and 17 Years | 7 (100.0%) | 2 (100.0%) |
| 18 to 24 Years | 26 (100.0%) | 18 (100.0%) |
| 25 to 34 Years | 1 (100.0%) | 33 (100.0%) |
| 35 to 44 Years | 98 (100.0%) | 35 (79.5%) |
| 45 to 54 Years | 55 (100.0%) | 46 (100.0%) |
| 55 to 64 Years | 163 (100.0%) | 101 (97.1%) |
| 65 to 74 Years | 43 (100.0%) | 78 (100.0%) |
| 75 Years and over | 20 (100.0%) | 36 (97.3%) |
| Total | 530 (99.8%) | 430 (97.1%) |
Income Below Poverty Among Married-Couple Families in Hackberry
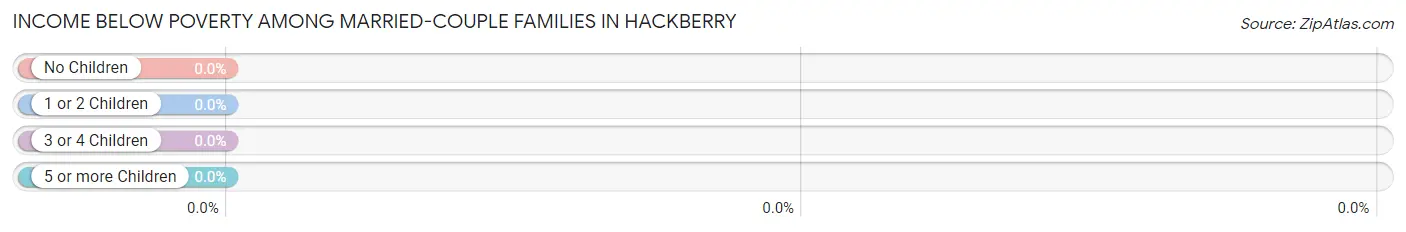
| Children | Above Poverty | Below Poverty |
| No Children | 192 (100.0%) | 0 (0.0%) |
| 1 or 2 Children | 62 (100.0%) | 0 (0.0%) |
| 3 or 4 Children | 50 (100.0%) | 0 (0.0%) |
| 5 or more Children | 0 (0.0%) | 0 (0.0%) |
| Total | 304 (100.0%) | 0 (0.0%) |
Income Below Poverty Among Single-Parent Households in Hackberry
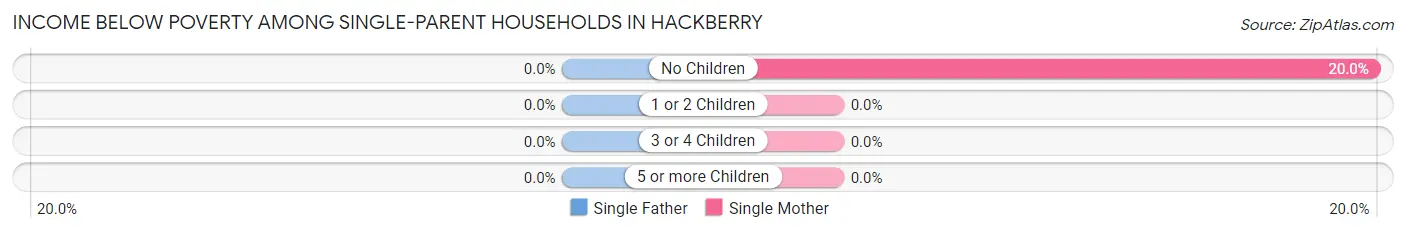
| Children | Single Father | Single Mother |
| No Children | 0 (0.0%) | 3 (20.0%) |
| 1 or 2 Children | 0 (0.0%) | 0 (0.0%) |
| 3 or 4 Children | 0 (0.0%) | 0 (0.0%) |
| 5 or more Children | 0 (0.0%) | 0 (0.0%) |
| Total | 0 (0.0%) | 3 (20.0%) |
Income Below Poverty Among Married-Couple vs Single-Parent Households in Hackberry
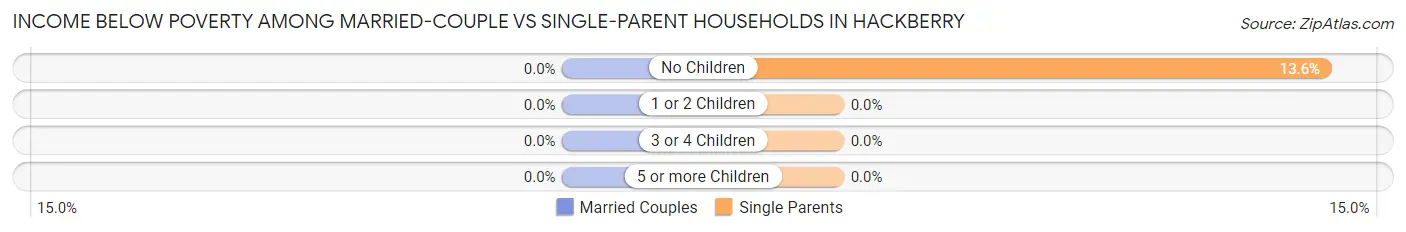
| Children | Married-Couple Families | Single-Parent Households |
| No Children | 0 (0.0%) | 3 (13.6%) |
| 1 or 2 Children | 0 (0.0%) | 0 (0.0%) |
| 3 or 4 Children | 0 (0.0%) | 0 (0.0%) |
| 5 or more Children | 0 (0.0%) | 0 (0.0%) |
| Total | 0 (0.0%) | 3 (13.6%) |
Race in Hackberry
The most populous races in Hackberry are , and White / Caucasian (988 | 100.0%).
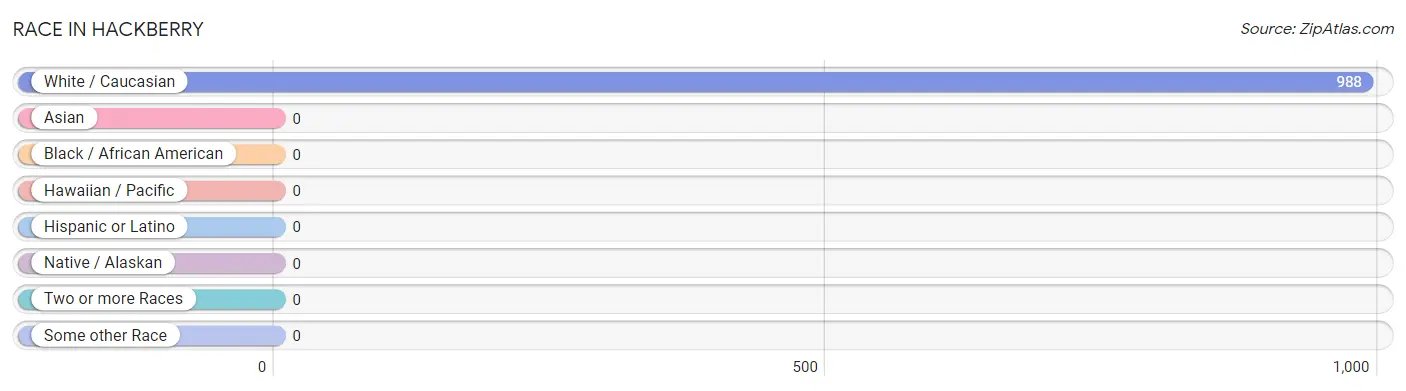
| Race | # Population | % Population |
| Asian | 0 | 0.0% |
| Black / African American | 0 | 0.0% |
| Hawaiian / Pacific | 0 | 0.0% |
| Hispanic or Latino | 0 | 0.0% |
| Native / Alaskan | 0 | 0.0% |
| White / Caucasian | 988 | 100.0% |
| Two or more Races | 0 | 0.0% |
| Some other Race | 0 | 0.0% |
| Total | 988 | 100.0% |
Ancestry in Hackberry
The most populous ancestries reported in Hackberry are German (174 | 17.6%), French Canadian (106 | 10.7%), American (98 | 9.9%), French (75 | 7.6%), and English (69 | 7.0%), together accounting for 52.8% of all Hackberry residents.
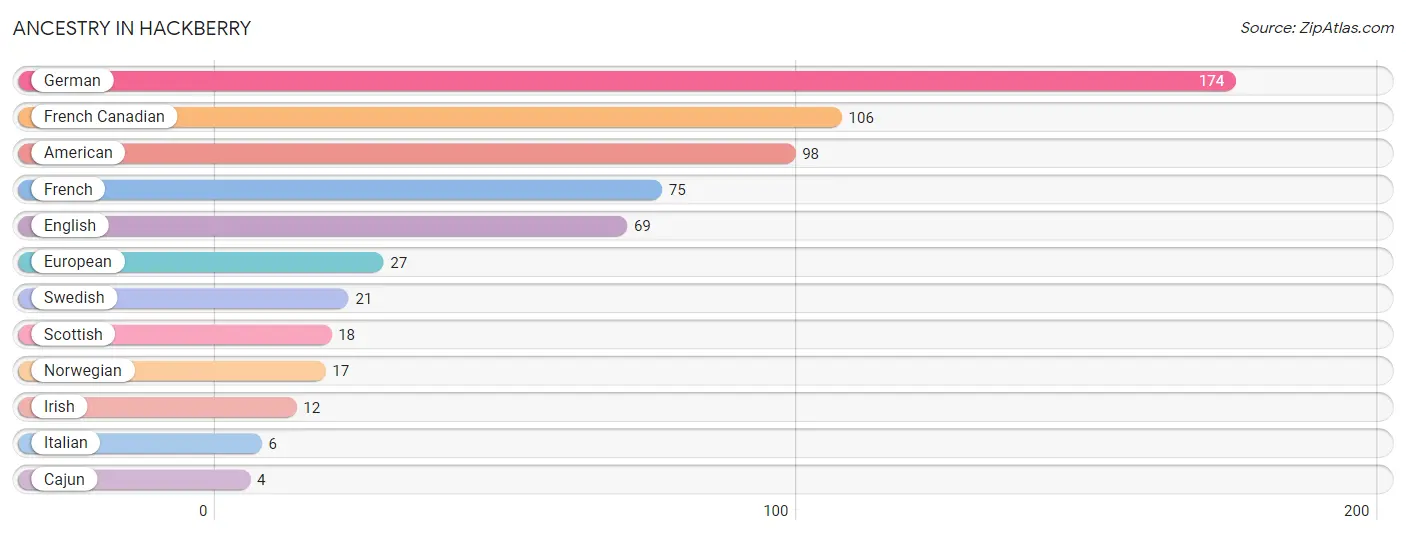
| Ancestry | # Population | % Population |
| American | 98 | 9.9% |
| Cajun | 4 | 0.4% |
| English | 69 | 7.0% |
| European | 27 | 2.7% |
| French | 75 | 7.6% |
| French Canadian | 106 | 10.7% |
| German | 174 | 17.6% |
| Irish | 12 | 1.2% |
| Italian | 6 | 0.6% |
| Norwegian | 17 | 1.7% |
| Scottish | 18 | 1.8% |
| Swedish | 21 | 2.1% | View All 12 Rows |
Immigrants in Hackberry
The most numerous immigrant groups reported in Hackberry came from , and Canada (9 | 0.9%), together accounting for 0.9% of all Hackberry residents.

| Immigration Origin | # Population | % Population |
| Canada | 9 | 0.9% | View All 1 Rows |
Sex and Age in Hackberry
Sex and Age in Hackberry
The most populous age groups in Hackberry are 60 to 64 Years (128 | 23.5%) for men and 65 to 69 Years (77 | 17.4%) for women.
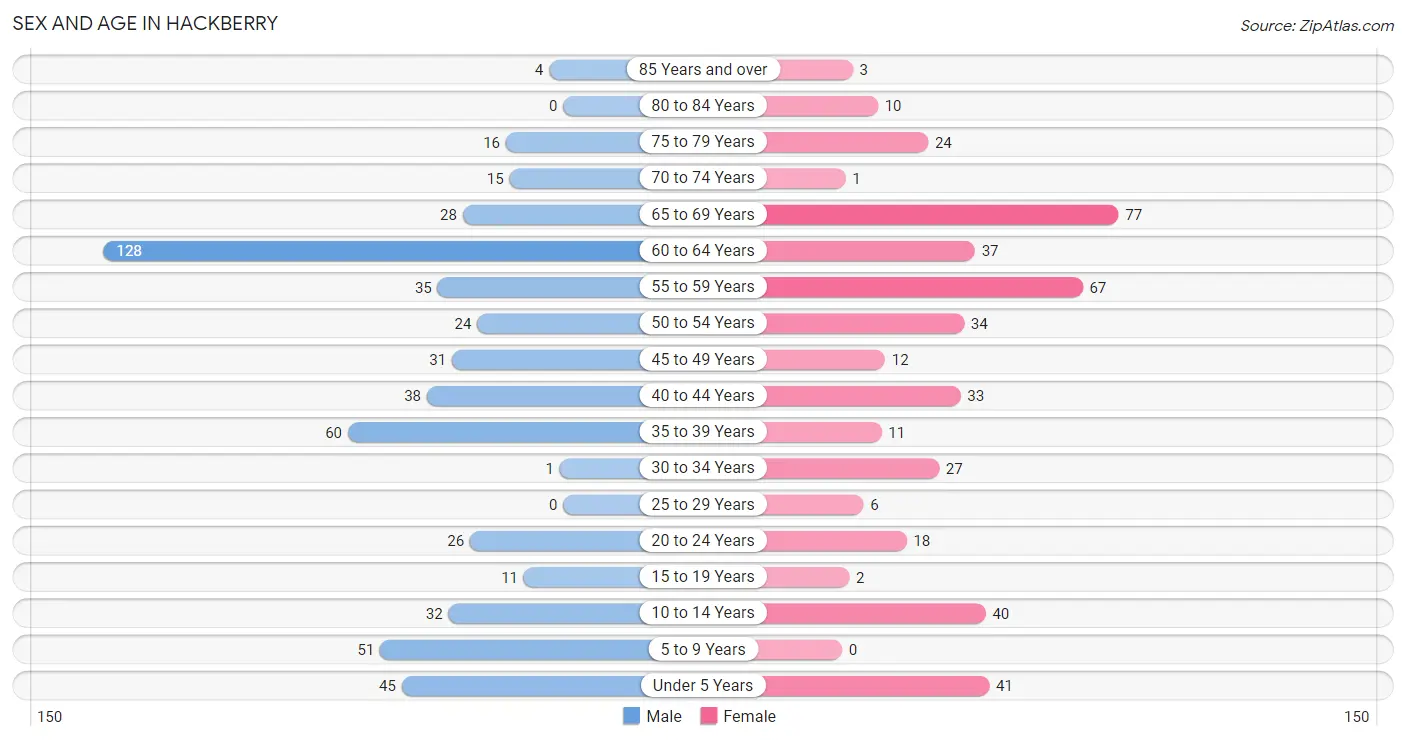
| Age Bracket | Male | Female |
| Under 5 Years | 45 (8.3%) | 41 (9.3%) |
| 5 to 9 Years | 51 (9.4%) | 0 (0.0%) |
| 10 to 14 Years | 32 (5.9%) | 40 (9.0%) |
| 15 to 19 Years | 11 (2.0%) | 2 (0.4%) |
| 20 to 24 Years | 26 (4.8%) | 18 (4.1%) |
| 25 to 29 Years | 0 (0.0%) | 6 (1.3%) |
| 30 to 34 Years | 1 (0.2%) | 27 (6.1%) |
| 35 to 39 Years | 60 (11.0%) | 11 (2.5%) |
| 40 to 44 Years | 38 (7.0%) | 33 (7.4%) |
| 45 to 49 Years | 31 (5.7%) | 12 (2.7%) |
| 50 to 54 Years | 24 (4.4%) | 34 (7.7%) |
| 55 to 59 Years | 35 (6.4%) | 67 (15.1%) |
| 60 to 64 Years | 128 (23.5%) | 37 (8.4%) |
| 65 to 69 Years | 28 (5.1%) | 77 (17.4%) |
| 70 to 74 Years | 15 (2.8%) | 1 (0.2%) |
| 75 to 79 Years | 16 (2.9%) | 24 (5.4%) |
| 80 to 84 Years | 0 (0.0%) | 10 (2.3%) |
| 85 Years and over | 4 (0.7%) | 3 (0.7%) |
| Total | 545 (100.0%) | 443 (100.0%) |
Families and Households in Hackberry
Median Family Size in Hackberry
The median family size in Hackberry is 2.83 persons per family, with married-couple families (304 | 93.2%) accounting for the largest median family size of 2.93 persons per family. On the other hand, single female/mother families (15 | 4.6%) represent the smallest median family size with 1.33 persons per family.
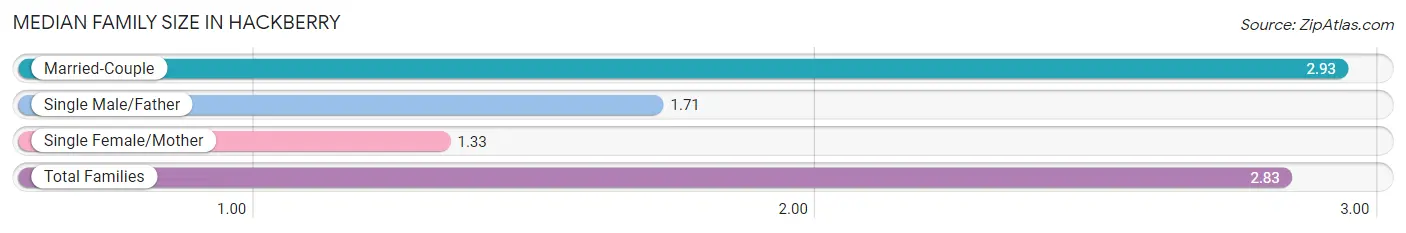
| Family Type | # Families | Family Size |
| Married-Couple | 304 (93.2%) | 2.93 |
| Single Male/Father | 7 (2.1%) | 1.71 |
| Single Female/Mother | 15 (4.6%) | 1.33 |
| Total Families | 326 (100.0%) | 2.83 |
Median Household Size in Hackberry
The median household size in Hackberry is 2.81 persons per household, with married-couple households (304 | 86.4%) accounting for the largest median household size of 2.95 persons per household. non-family households (26 | 7.4%) represent the smallest median household size with 1.54 persons per household.
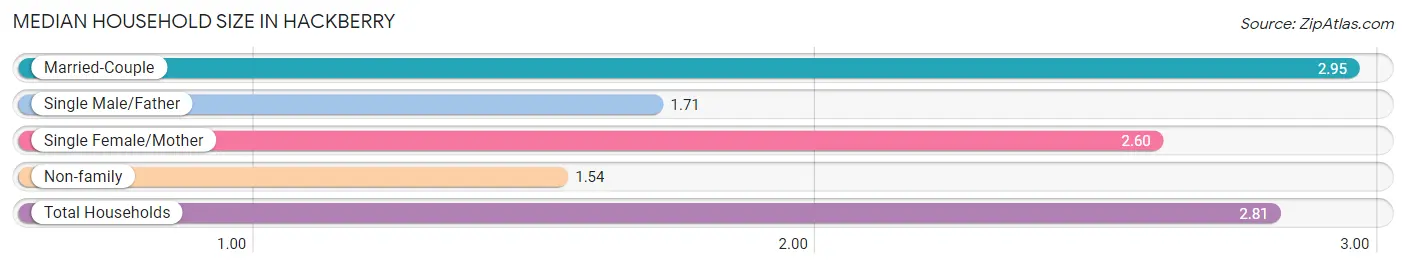
| Household Type | # Households | Household Size |
| Married-Couple | 304 (86.4%) | 2.95 |
| Single Male/Father | 7 (2.0%) | 1.71 |
| Single Female/Mother | 15 (4.3%) | 2.60 |
| Non-family | 26 (7.4%) | 1.54 |
| Total Households | 352 (100.0%) | 2.81 |
Household Size by Marriage Status in Hackberry
Out of a total of 352 households in Hackberry, 326 (92.6%) are family households, while 26 (7.4%) are nonfamily households. The most numerous type of family households are 2-person households, comprising 126, and the most common type of nonfamily households are 1-person households, comprising 20.
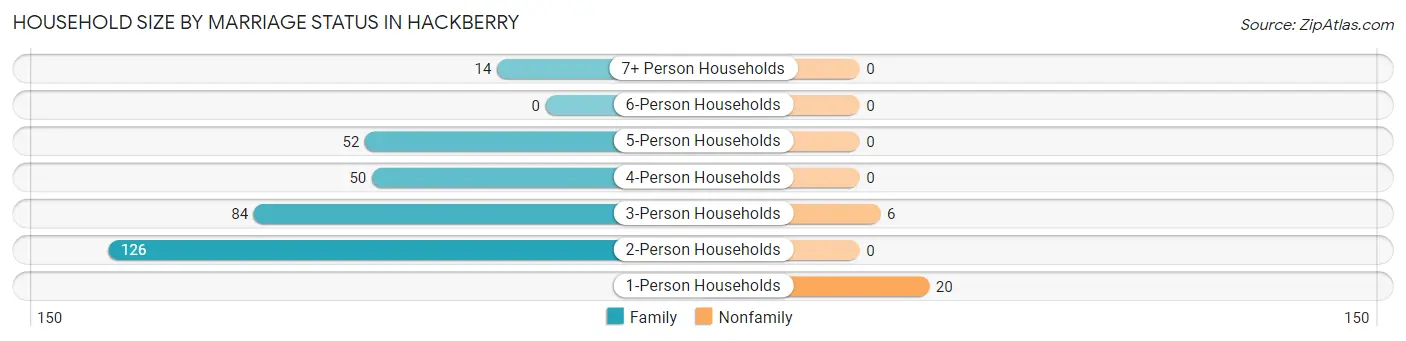
| Household Size | Family Households | Nonfamily Households |
| 1-Person Households | - | 20 (5.7%) |
| 2-Person Households | 126 (35.8%) | 0 (0.0%) |
| 3-Person Households | 84 (23.9%) | 6 (1.7%) |
| 4-Person Households | 50 (14.2%) | 0 (0.0%) |
| 5-Person Households | 52 (14.8%) | 0 (0.0%) |
| 6-Person Households | 0 (0.0%) | 0 (0.0%) |
| 7+ Person Households | 14 (4.0%) | 0 (0.0%) |
| Total | 326 (92.6%) | 26 (7.4%) |
Female Fertility in Hackberry
Fertility by Age in Hackberry
Average fertility rate in Hackberry is 294.0 births per 1,000 women. Women in the age bracket of 20 to 34 years have the highest fertility rate with 608.0 births per 1,000 women. Women in the age bracket of 20 to 34 years acount for 96.9% of all women with births.
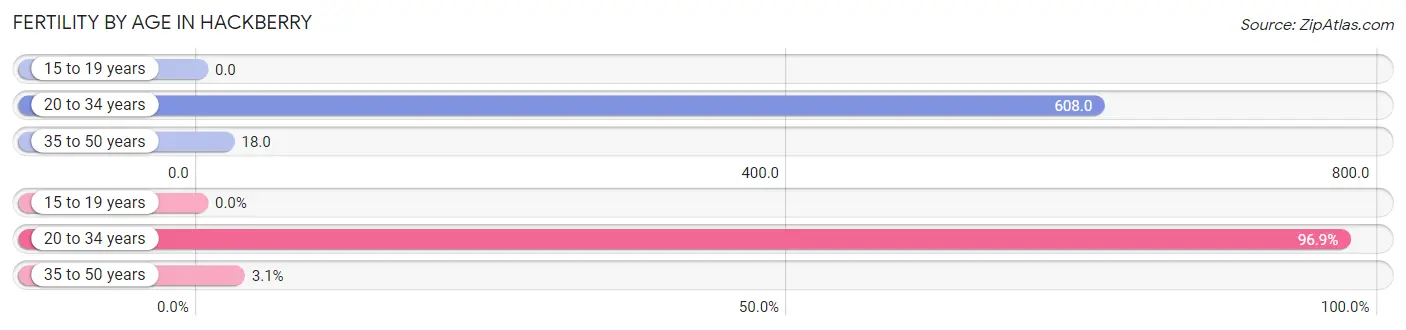
| Age Bracket | Women with Births | Births / 1,000 Women |
| 15 to 19 years | 0 (0.0%) | 0.0 |
| 20 to 34 years | 31 (96.9%) | 608.0 |
| 35 to 50 years | 1 (3.1%) | 18.0 |
| Total | 32 (100.0%) | 294.0 |
Fertility by Age by Marriage Status in Hackberry
78.1% of women with births (32) in Hackberry are married. The highest percentage of unmarried women with births falls into 35 to 50 years age bracket with 100.0% of them unmarried at the time of birth, while the lowest percentage of unmarried women with births belong to 20 to 34 years age bracket with 19.4% of them unmarried.
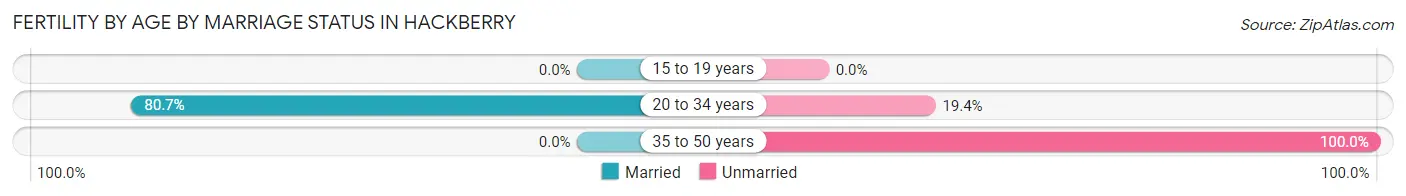
| Age Bracket | Married | Unmarried |
| 15 to 19 years | 0 (0.0%) | 0 (0.0%) |
| 20 to 34 years | 25 (80.6%) | 6 (19.4%) |
| 35 to 50 years | 0 (0.0%) | 1 (100.0%) |
| Total | 25 (78.1%) | 7 (21.9%) |
Fertility by Education in Hackberry
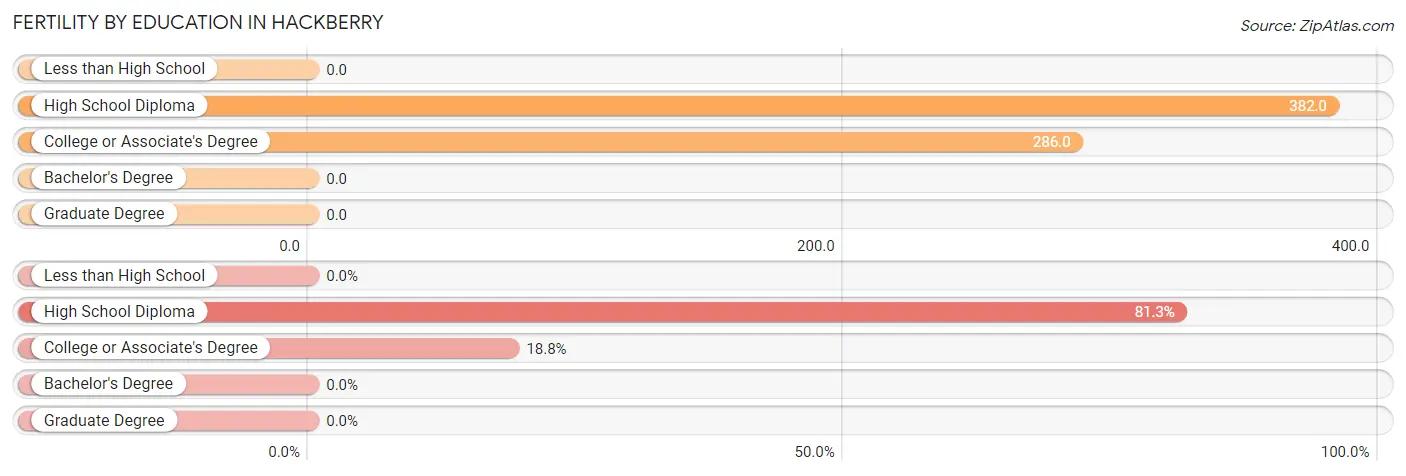
| Educational Attainment | Women with Births | Births / 1,000 Women |
| Less than High School | 0 (0.0%) | 0.0 |
| High School Diploma | 26 (81.2%) | 382.0 |
| College or Associate's Degree | 6 (18.8%) | 286.0 |
| Bachelor's Degree | 0 (0.0%) | 0.0 |
| Graduate Degree | 0 (0.0%) | 0.0 |
| Total | 32 (100.0%) | 294.0 |
Fertility by Education by Marriage Status in Hackberry
21.9% of women with births in Hackberry are unmarried. Women with the educational attainment of high school diploma are most likely to be married with 96.2% of them married at childbirth, while women with the educational attainment of college or associate's degree are least likely to be married with 100.0% of them unmarried at childbirth.
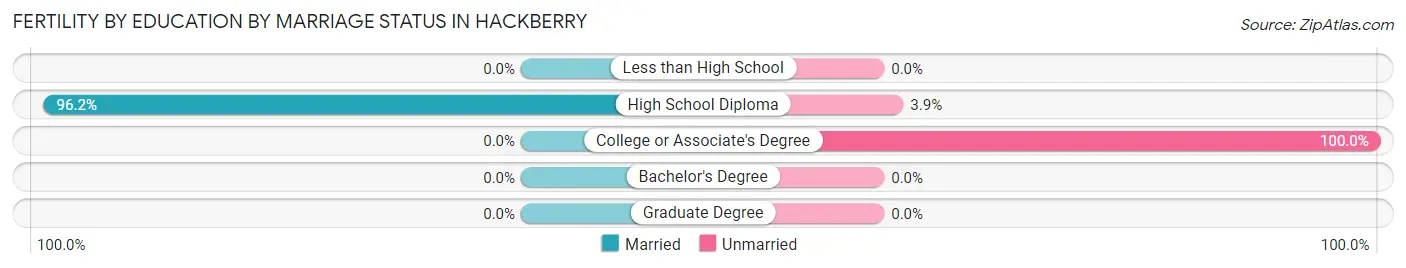
| Educational Attainment | Married | Unmarried |
| Less than High School | 0 (0.0%) | 0 (0.0%) |
| High School Diploma | 25 (96.2%) | 1 (3.8%) |
| College or Associate's Degree | 0 (0.0%) | 6 (100.0%) |
| Bachelor's Degree | 0 (0.0%) | 0 (0.0%) |
| Graduate Degree | 0 (0.0%) | 0 (0.0%) |
| Total | 25 (78.1%) | 7 (21.9%) |
Employment Characteristics in Hackberry
Employment by Class of Employer in Hackberry
Among the 524 employed individuals in Hackberry, private company employees (399 | 76.1%), self-employed (incorporated) (38 | 7.2%), and local government employees (35 | 6.7%) make up the most common classes of employment.
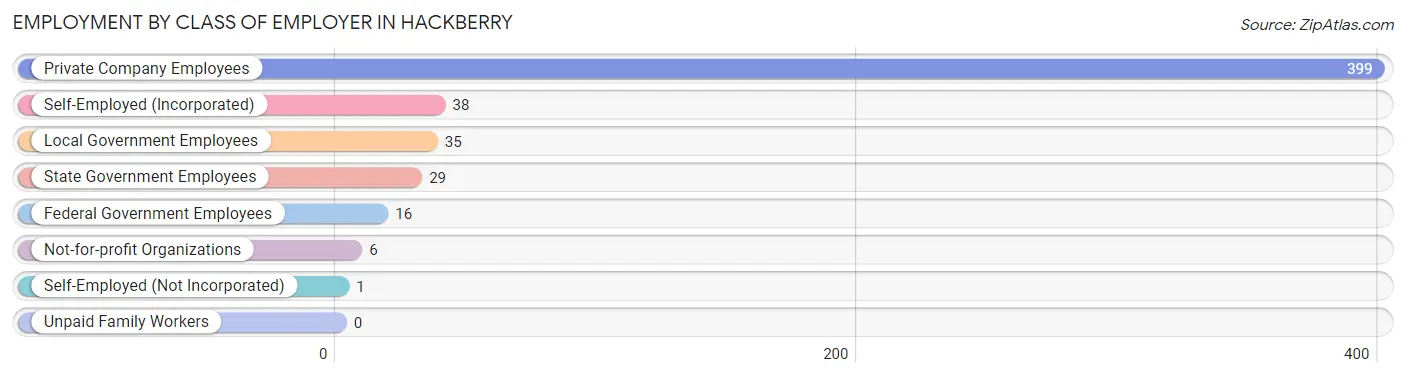
| Employer Class | # Employees | % Employees |
| Private Company Employees | 399 | 76.1% |
| Self-Employed (Incorporated) | 38 | 7.2% |
| Self-Employed (Not Incorporated) | 1 | 0.2% |
| Not-for-profit Organizations | 6 | 1.1% |
| Local Government Employees | 35 | 6.7% |
| State Government Employees | 29 | 5.5% |
| Federal Government Employees | 16 | 3.0% |
| Unpaid Family Workers | 0 | 0.0% |
| Total | 524 | 100.0% |
Employment Status by Age in Hackberry
According to the labor force statistics for Hackberry, out of the total population over 16 years of age (775), 68.6% or 532 individuals are in the labor force, with 1.5% or 8 of them unemployed. The age group with the highest labor force participation rate is 25 to 29 years, with 100.0% or 6 individuals in the labor force. Within the labor force, the 20 to 24 years age range has the highest percentage of unemployed individuals, with 20.0% or 8 of them being unemployed.
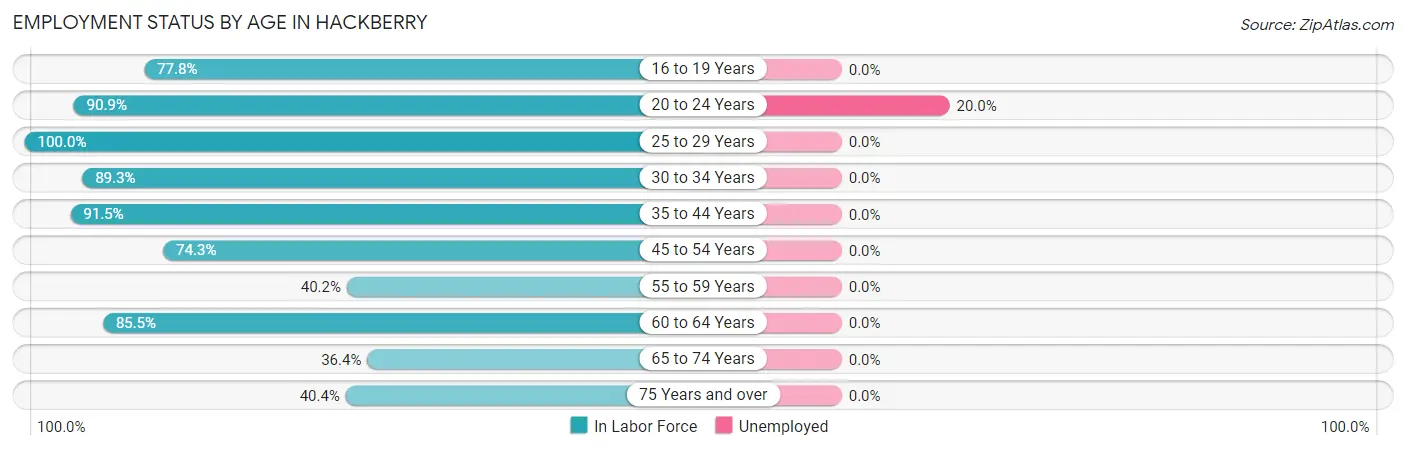
| Age Bracket | In Labor Force | Unemployed |
| 16 to 19 Years | 7 (77.8%) | 0 (0.0%) |
| 20 to 24 Years | 40 (90.9%) | 8 (20.0%) |
| 25 to 29 Years | 6 (100.0%) | 0 (0.0%) |
| 30 to 34 Years | 25 (89.3%) | 0 (0.0%) |
| 35 to 44 Years | 130 (91.5%) | 0 (0.0%) |
| 45 to 54 Years | 75 (74.3%) | 0 (0.0%) |
| 55 to 59 Years | 41 (40.2%) | 0 (0.0%) |
| 60 to 64 Years | 141 (85.5%) | 0 (0.0%) |
| 65 to 74 Years | 44 (36.4%) | 0 (0.0%) |
| 75 Years and over | 23 (40.4%) | 0 (0.0%) |
| Total | 532 (68.6%) | 8 (1.5%) |
Employment Status by Educational Attainment in Hackberry
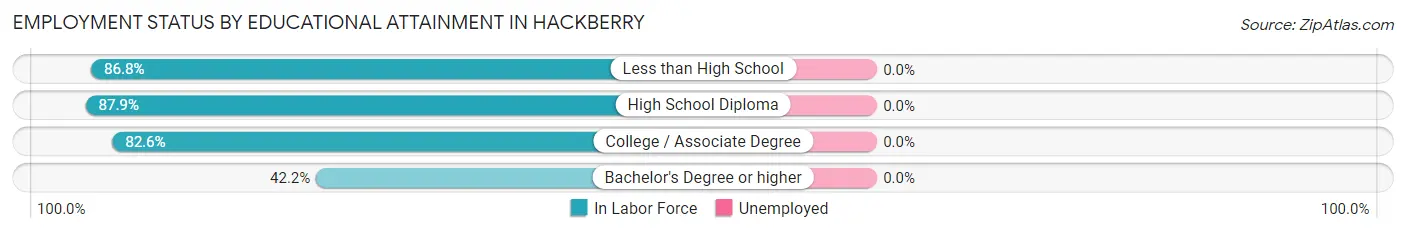
| Educational Attainment | In Labor Force | Unemployed |
| Less than High School | 33 (86.8%) | 0 (0.0%) |
| High School Diploma | 138 (87.9%) | 0 (0.0%) |
| College / Associate Degree | 204 (82.6%) | 0 (0.0%) |
| Bachelor's Degree or higher | 43 (42.2%) | 0 (0.0%) |
| Total | 418 (76.8%) | 0 (0.0%) |
Employment Occupations by Sex in Hackberry
Management, Business, Science and Arts Occupations
The most common Management, Business, Science and Arts occupations in Hackberry are Management (27 | 5.1%), Computers, Engineering & Science (21 | 4.0%), Community & Social Service (19 | 3.6%), Education Instruction & Library (19 | 3.6%), and Business & Financial (13 | 2.5%).
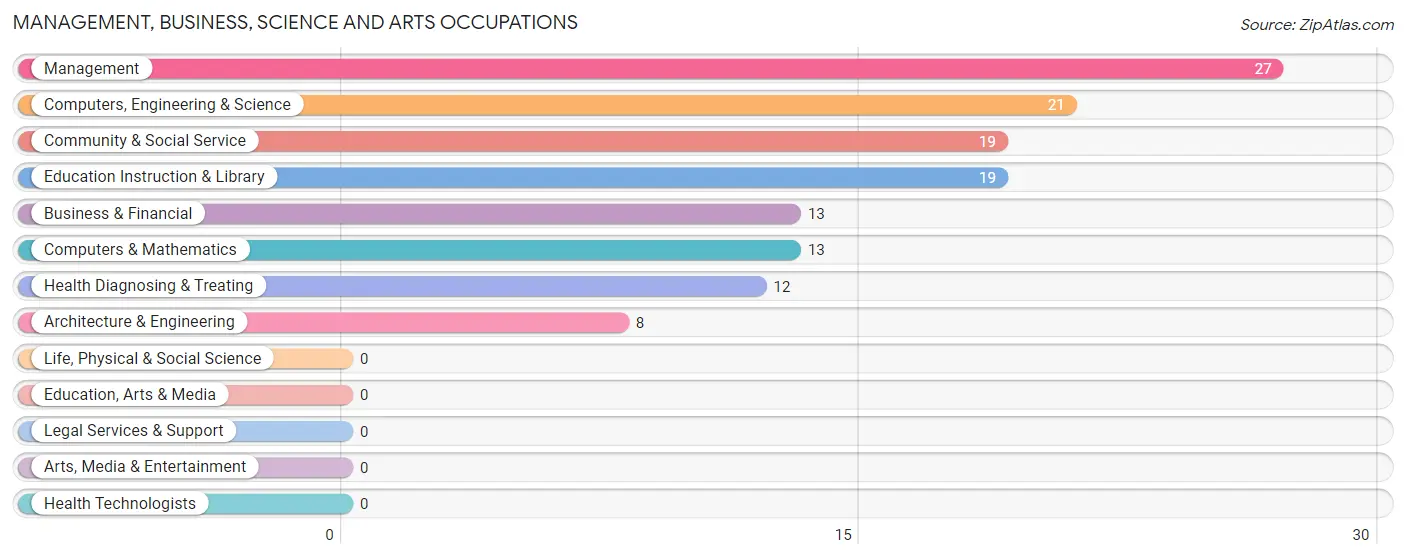
Management, Business, Science and Arts Occupations by Sex
Within the Management, Business, Science and Arts occupations in Hackberry, the most male-oriented occupations are Management (100.0%), Computers, Engineering & Science (100.0%), and Computers & Mathematics (100.0%), while the most female-oriented occupations are Business & Financial (100.0%), Community & Social Service (100.0%), and Education Instruction & Library (100.0%).
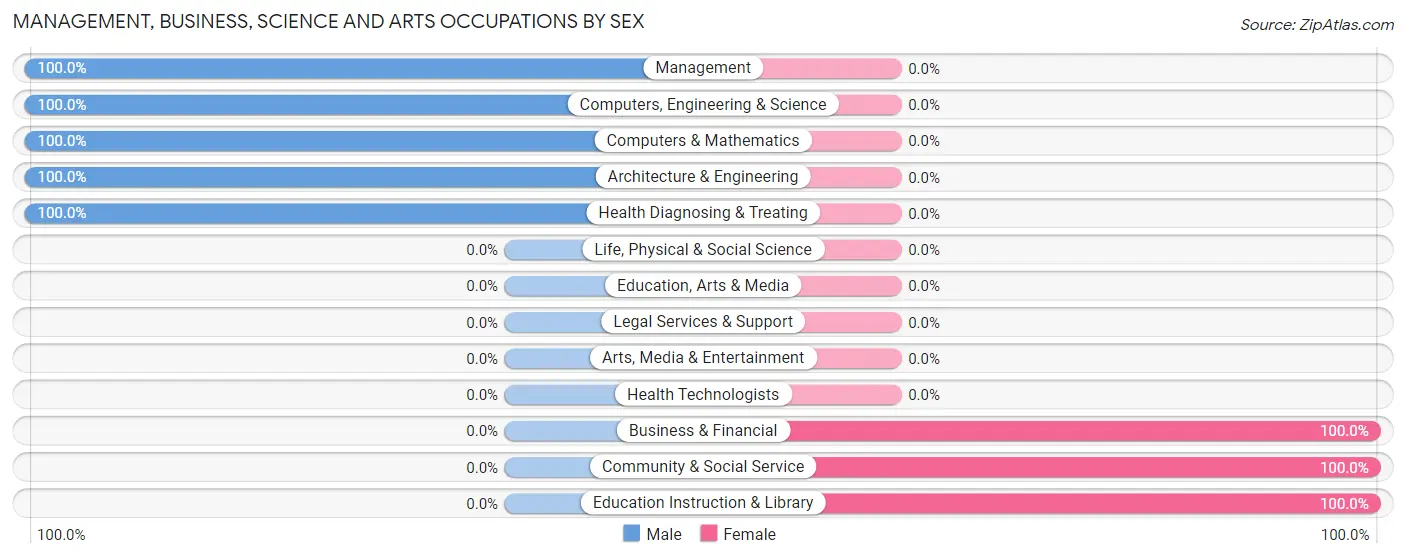
| Occupation | Male | Female |
| Management | 27 (100.0%) | 0 (0.0%) |
| Business & Financial | 0 (0.0%) | 13 (100.0%) |
| Computers, Engineering & Science | 21 (100.0%) | 0 (0.0%) |
| Computers & Mathematics | 13 (100.0%) | 0 (0.0%) |
| Architecture & Engineering | 8 (100.0%) | 0 (0.0%) |
| Life, Physical & Social Science | 0 (0.0%) | 0 (0.0%) |
| Community & Social Service | 0 (0.0%) | 19 (100.0%) |
| Education, Arts & Media | 0 (0.0%) | 0 (0.0%) |
| Legal Services & Support | 0 (0.0%) | 0 (0.0%) |
| Education Instruction & Library | 0 (0.0%) | 19 (100.0%) |
| Arts, Media & Entertainment | 0 (0.0%) | 0 (0.0%) |
| Health Diagnosing & Treating | 12 (100.0%) | 0 (0.0%) |
| Health Technologists | 0 (0.0%) | 0 (0.0%) |
| Total (Category) | 60 (65.2%) | 32 (34.8%) |
| Total (Overall) | 376 (71.8%) | 148 (28.2%) |
Services Occupations
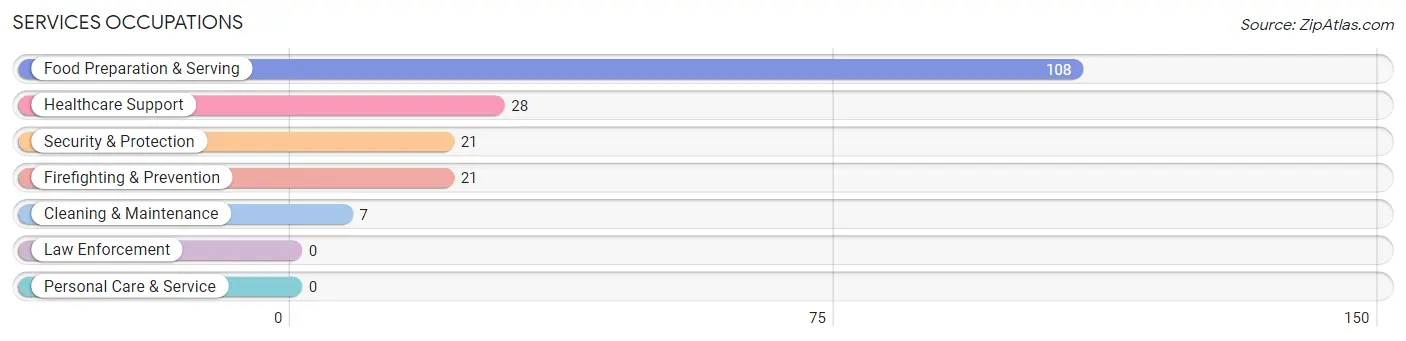
The most common Services occupations in Hackberry are Food Preparation & Serving (108 | 20.6%), Healthcare Support (28 | 5.3%), Security & Protection (21 | 4.0%), Firefighting & Prevention (21 | 4.0%), and Cleaning & Maintenance (7 | 1.3%).
Services Occupations by Sex
Within the Services occupations in Hackberry, the most male-oriented occupations are Security & Protection (100.0%), Firefighting & Prevention (100.0%), and Food Preparation & Serving (89.8%), while the most female-oriented occupations are Healthcare Support (100.0%), Cleaning & Maintenance (85.7%), and Food Preparation & Serving (10.2%).
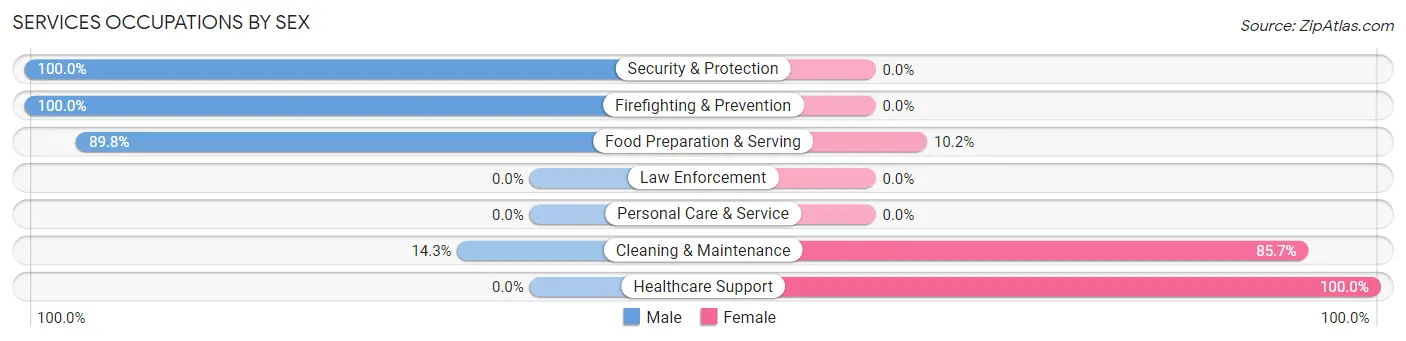
| Occupation | Male | Female |
| Healthcare Support | 0 (0.0%) | 28 (100.0%) |
| Security & Protection | 21 (100.0%) | 0 (0.0%) |
| Firefighting & Prevention | 21 (100.0%) | 0 (0.0%) |
| Law Enforcement | 0 (0.0%) | 0 (0.0%) |
| Food Preparation & Serving | 97 (89.8%) | 11 (10.2%) |
| Cleaning & Maintenance | 1 (14.3%) | 6 (85.7%) |
| Personal Care & Service | 0 (0.0%) | 0 (0.0%) |
| Total (Category) | 119 (72.6%) | 45 (27.4%) |
| Total (Overall) | 376 (71.8%) | 148 (28.2%) |
Sales and Office Occupations
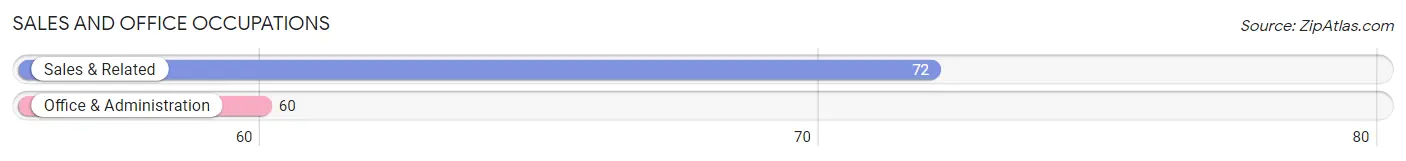
The most common Sales and Office occupations in Hackberry are Sales & Related (72 | 13.7%), and Office & Administration (60 | 11.5%).
Sales and Office Occupations by Sex
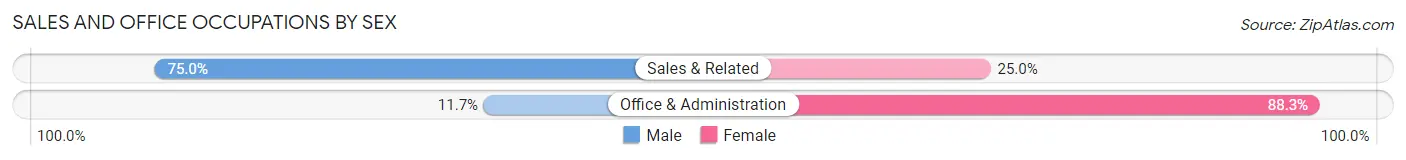
| Occupation | Male | Female |
| Sales & Related | 54 (75.0%) | 18 (25.0%) |
| Office & Administration | 7 (11.7%) | 53 (88.3%) |
| Total (Category) | 61 (46.2%) | 71 (53.8%) |
| Total (Overall) | 376 (71.8%) | 148 (28.2%) |
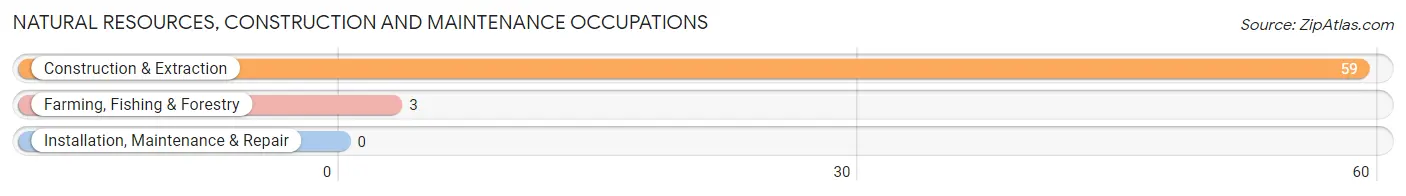
Natural Resources, Construction and Maintenance Occupations
The most common Natural Resources, Construction and Maintenance occupations in Hackberry are Construction & Extraction (59 | 11.3%), and Farming, Fishing & Forestry (3 | 0.6%).
Natural Resources, Construction and Maintenance Occupations by Sex
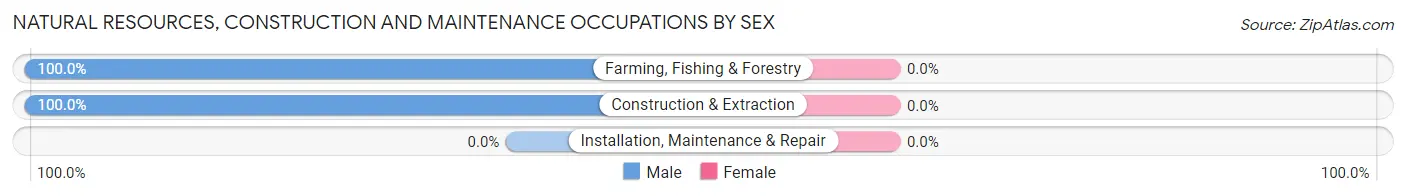
| Occupation | Male | Female |
| Farming, Fishing & Forestry | 3 (100.0%) | 0 (0.0%) |
| Construction & Extraction | 59 (100.0%) | 0 (0.0%) |
| Installation, Maintenance & Repair | 0 (0.0%) | 0 (0.0%) |
| Total (Category) | 62 (100.0%) | 0 (0.0%) |
| Total (Overall) | 376 (71.8%) | 148 (28.2%) |
Production, Transportation and Moving Occupations
The most common Production, Transportation and Moving occupations in Hackberry are Production (62 | 11.8%), Material Moving (7 | 1.3%), and Transportation (5 | 0.9%).
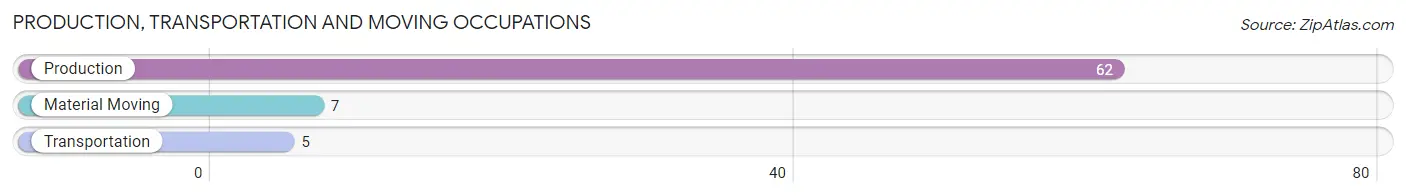
Production, Transportation and Moving Occupations by Sex
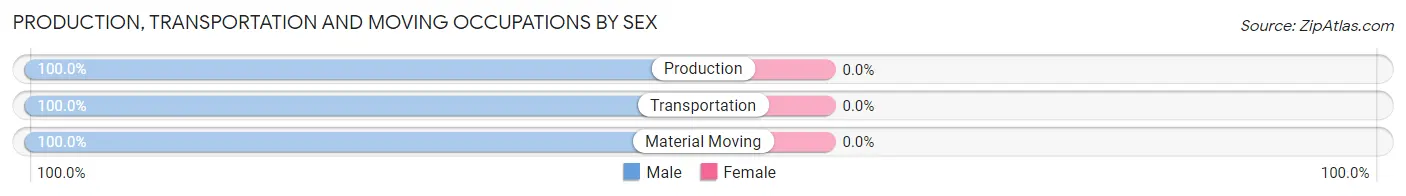
| Occupation | Male | Female |
| Production | 62 (100.0%) | 0 (0.0%) |
| Transportation | 5 (100.0%) | 0 (0.0%) |
| Material Moving | 7 (100.0%) | 0 (0.0%) |
| Total (Category) | 74 (100.0%) | 0 (0.0%) |
| Total (Overall) | 376 (71.8%) | 148 (28.2%) |
Employment Industries by Sex in Hackberry
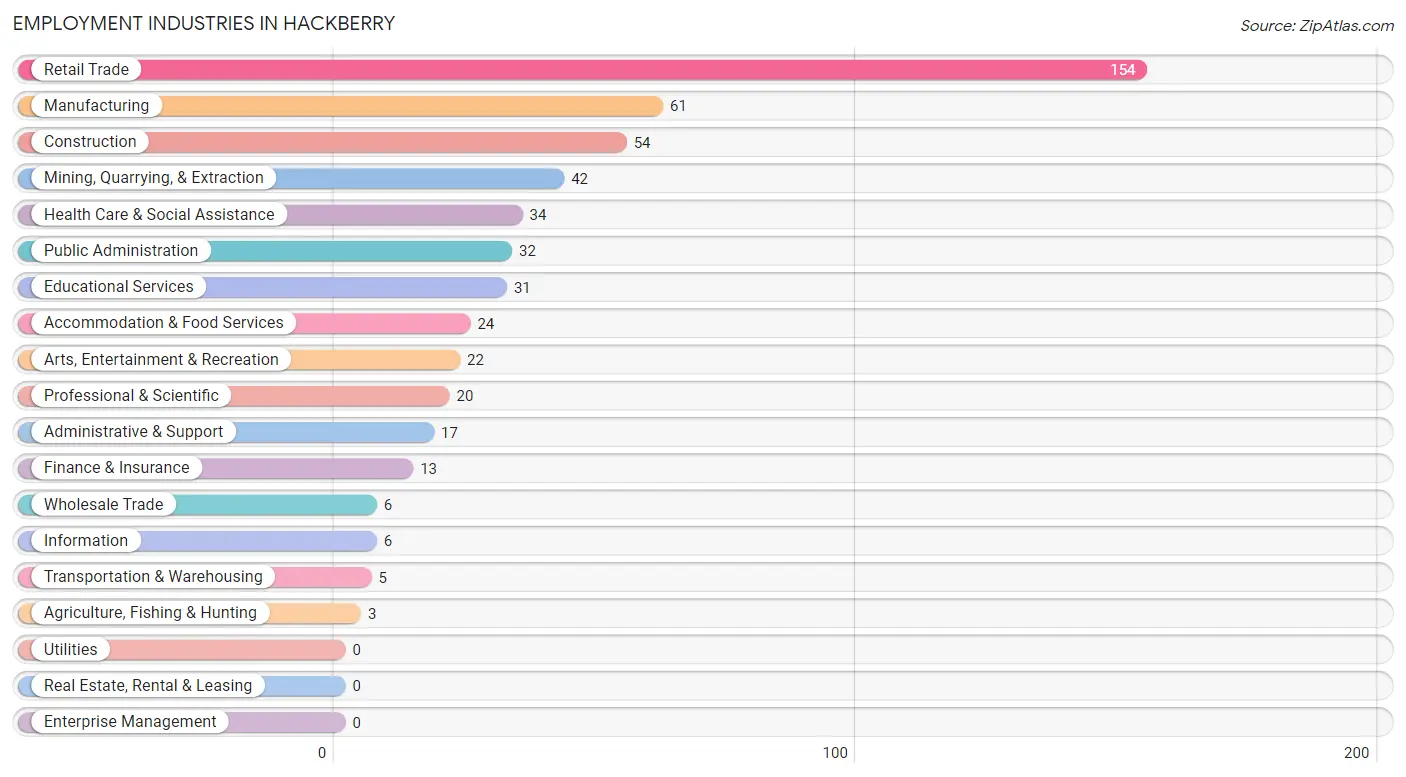
Employment Industries in Hackberry
The major employment industries in Hackberry include Retail Trade (154 | 29.4%), Manufacturing (61 | 11.6%), Construction (54 | 10.3%), Mining, Quarrying, & Extraction (42 | 8.0%), and Health Care & Social Assistance (34 | 6.5%).
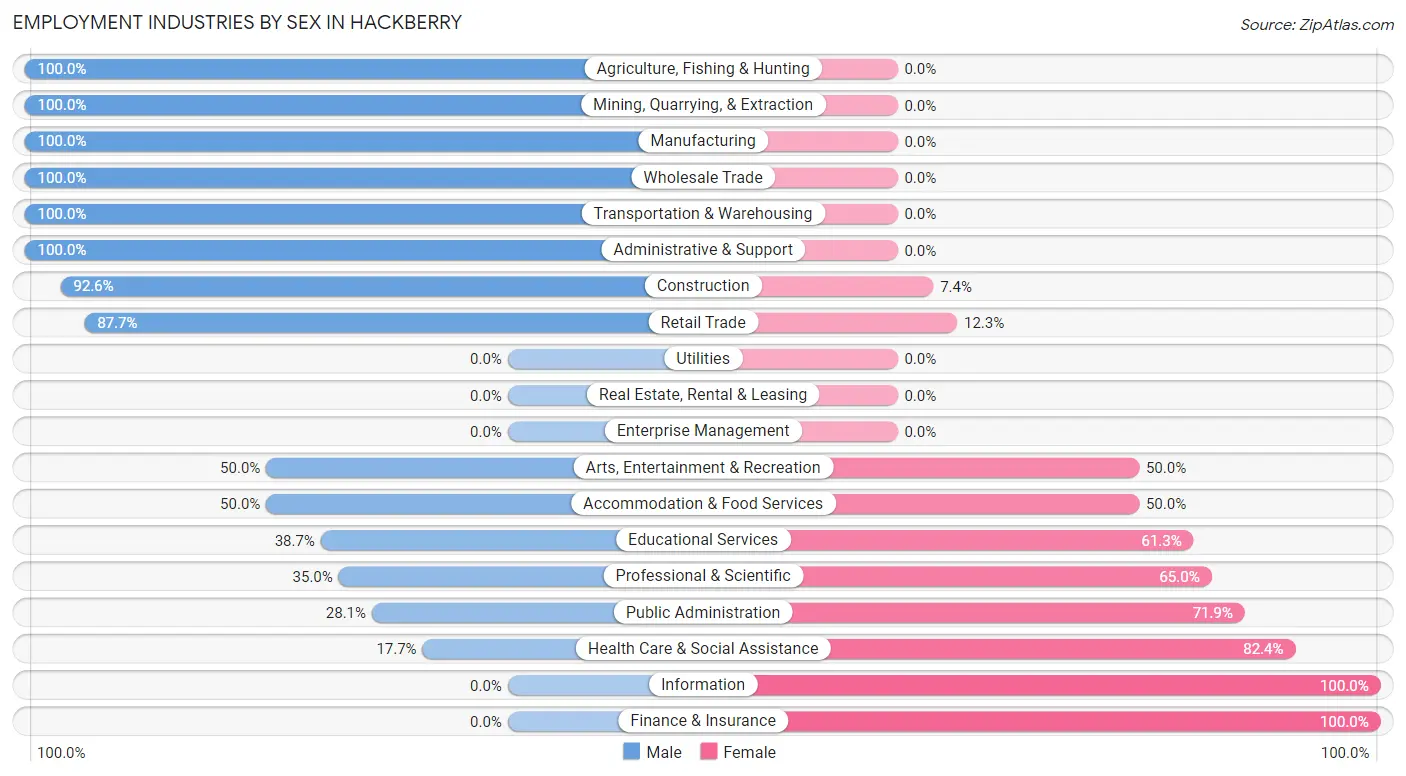
Employment Industries by Sex in Hackberry
The Hackberry industries that see more men than women are Agriculture, Fishing & Hunting (100.0%), Mining, Quarrying, & Extraction (100.0%), and Manufacturing (100.0%), whereas the industries that tend to have a higher number of women are Information (100.0%), Finance & Insurance (100.0%), and Health Care & Social Assistance (82.4%).
| Industry | Male | Female |
| Agriculture, Fishing & Hunting | 3 (100.0%) | 0 (0.0%) |
| Mining, Quarrying, & Extraction | 42 (100.0%) | 0 (0.0%) |
| Construction | 50 (92.6%) | 4 (7.4%) |
| Manufacturing | 61 (100.0%) | 0 (0.0%) |
| Wholesale Trade | 6 (100.0%) | 0 (0.0%) |
| Retail Trade | 135 (87.7%) | 19 (12.3%) |
| Transportation & Warehousing | 5 (100.0%) | 0 (0.0%) |
| Utilities | 0 (0.0%) | 0 (0.0%) |
| Information | 0 (0.0%) | 6 (100.0%) |
| Finance & Insurance | 0 (0.0%) | 13 (100.0%) |
| Real Estate, Rental & Leasing | 0 (0.0%) | 0 (0.0%) |
| Professional & Scientific | 7 (35.0%) | 13 (65.0%) |
| Enterprise Management | 0 (0.0%) | 0 (0.0%) |
| Administrative & Support | 17 (100.0%) | 0 (0.0%) |
| Educational Services | 12 (38.7%) | 19 (61.3%) |
| Health Care & Social Assistance | 6 (17.6%) | 28 (82.4%) |
| Arts, Entertainment & Recreation | 11 (50.0%) | 11 (50.0%) |
| Accommodation & Food Services | 12 (50.0%) | 12 (50.0%) |
| Public Administration | 9 (28.1%) | 23 (71.9%) |
| Total | 376 (71.8%) | 148 (28.2%) |
Education in Hackberry
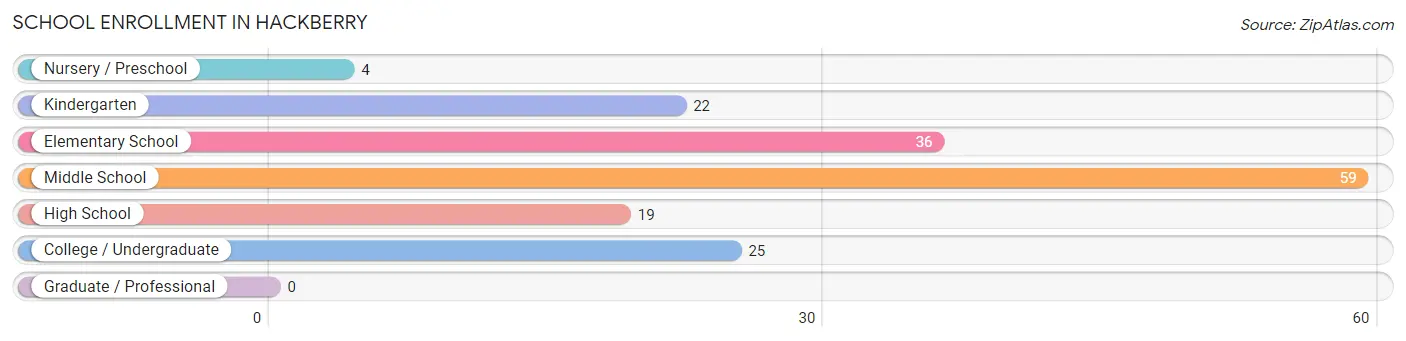
School Enrollment in Hackberry
The most common levels of schooling among the 165 students in Hackberry are middle school (59 | 35.8%), elementary school (36 | 21.8%), and college / undergraduate (25 | 15.1%).
| School Level | # Students | % Students |
| Nursery / Preschool | 4 | 2.4% |
| Kindergarten | 22 | 13.3% |
| Elementary School | 36 | 21.8% |
| Middle School | 59 | 35.8% |
| High School | 19 | 11.5% |
| College / Undergraduate | 25 | 15.1% |
| Graduate / Professional | 0 | 0.0% |
| Total | 165 | 100.0% |
School Enrollment by Age by Funding Source in Hackberry
Out of a total of 165 students who are enrolled in schools in Hackberry, 5 (3.0%) attend a private institution, while the remaining 160 (97.0%) are enrolled in public schools. The age group of 5 to 9 year old has the highest likelihood of being enrolled in private schools, with 5 (9.8% in the age bracket) enrolled. Conversely, the age group of 3 to 4 year olds has the lowest likelihood of being enrolled in a private school, with 4 (100.0% in the age bracket) attending a public institution.
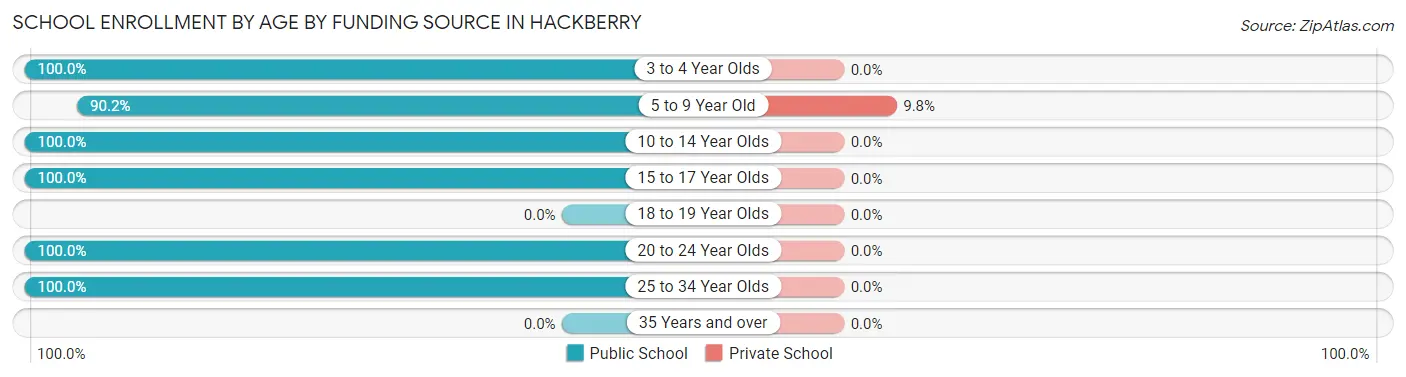
| Age Bracket | Public School | Private School |
| 3 to 4 Year Olds | 4 (100.0%) | 0 (0.0%) |
| 5 to 9 Year Old | 46 (90.2%) | 5 (9.8%) |
| 10 to 14 Year Olds | 72 (100.0%) | 0 (0.0%) |
| 15 to 17 Year Olds | 13 (100.0%) | 0 (0.0%) |
| 18 to 19 Year Olds | 0 (0.0%) | 0 (0.0%) |
| 20 to 24 Year Olds | 19 (100.0%) | 0 (0.0%) |
| 25 to 34 Year Olds | 6 (100.0%) | 0 (0.0%) |
| 35 Years and over | 0 (0.0%) | 0 (0.0%) |
| Total | 160 (97.0%) | 5 (3.0%) |
Educational Attainment by Field of Study in Hackberry
Arts & humanities (59 | 50.9%), liberal arts & history (13 | 11.2%), engineering (11 | 9.5%), science & technology (11 | 9.5%), and business (11 | 9.5%) are the most common fields of study among 116 individuals in Hackberry who have obtained a bachelor's degree or higher.
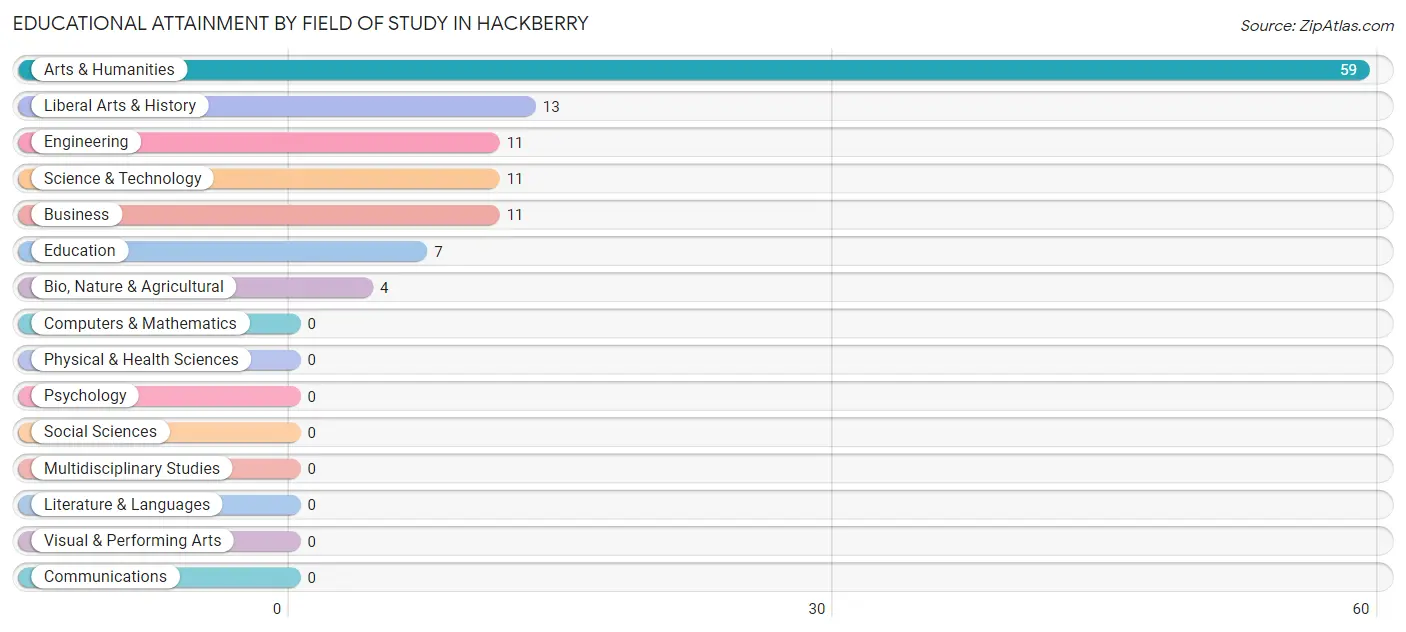
| Field of Study | # Graduates | % Graduates |
| Computers & Mathematics | 0 | 0.0% |
| Bio, Nature & Agricultural | 4 | 3.5% |
| Physical & Health Sciences | 0 | 0.0% |
| Psychology | 0 | 0.0% |
| Social Sciences | 0 | 0.0% |
| Engineering | 11 | 9.5% |
| Multidisciplinary Studies | 0 | 0.0% |
| Science & Technology | 11 | 9.5% |
| Business | 11 | 9.5% |
| Education | 7 | 6.0% |
| Literature & Languages | 0 | 0.0% |
| Liberal Arts & History | 13 | 11.2% |
| Visual & Performing Arts | 0 | 0.0% |
| Communications | 0 | 0.0% |
| Arts & Humanities | 59 | 50.9% |
| Total | 116 | 100.0% |
Transportation & Commute in Hackberry
Vehicle Availability by Sex in Hackberry
The most prevalent vehicle ownership categories in Hackberry are males with 5 or more vehicles (114, accounting for 30.3%) and females with 5 or more vehicles (17, making up 77.0%).
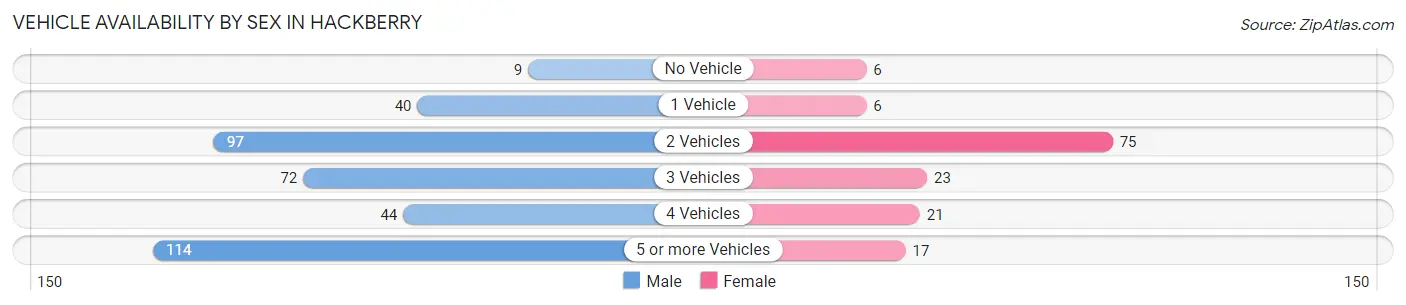
| Vehicles Available | Male | Female |
| No Vehicle | 9 (2.4%) | 6 (4.1%) |
| 1 Vehicle | 40 (10.6%) | 6 (4.1%) |
| 2 Vehicles | 97 (25.8%) | 75 (50.7%) |
| 3 Vehicles | 72 (19.2%) | 23 (15.5%) |
| 4 Vehicles | 44 (11.7%) | 21 (14.2%) |
| 5 or more Vehicles | 114 (30.3%) | 17 (11.5%) |
| Total | 376 (100.0%) | 148 (100.0%) |
Commute Time in Hackberry
The most frequently occuring commute durations in Hackberry are less than 5 minutes (166 commuters, 31.9%), 30 to 34 minutes (79 commuters, 15.2%), and 5 to 9 minutes (59 commuters, 11.4%).
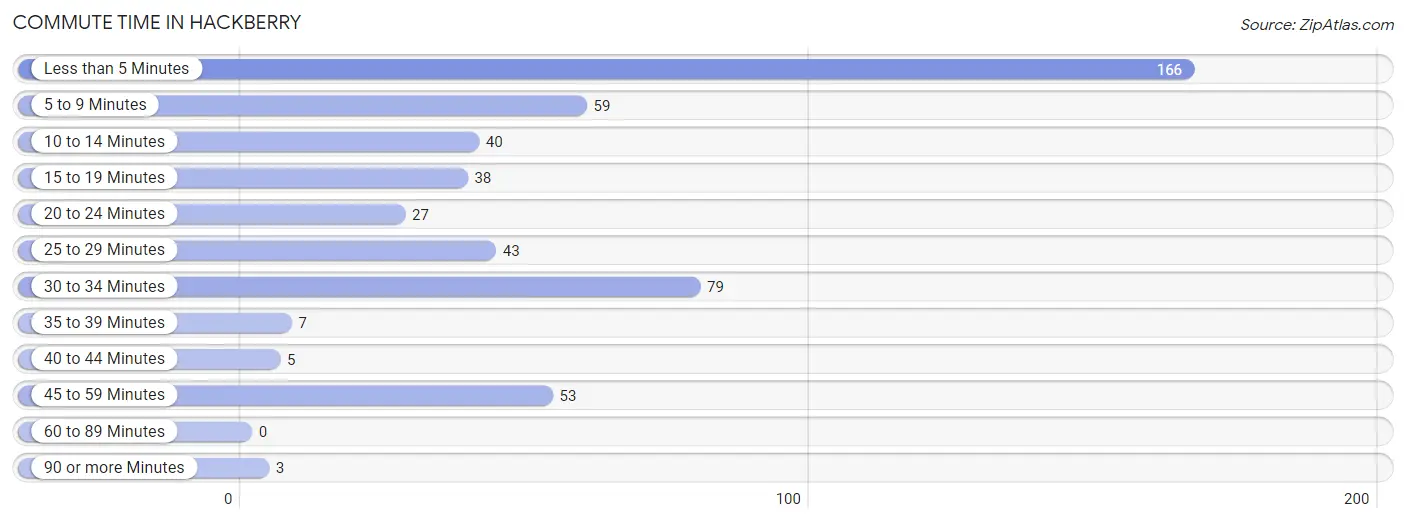
| Commute Time | # Commuters | % Commuters |
| Less than 5 Minutes | 166 | 31.9% |
| 5 to 9 Minutes | 59 | 11.4% |
| 10 to 14 Minutes | 40 | 7.7% |
| 15 to 19 Minutes | 38 | 7.3% |
| 20 to 24 Minutes | 27 | 5.2% |
| 25 to 29 Minutes | 43 | 8.3% |
| 30 to 34 Minutes | 79 | 15.2% |
| 35 to 39 Minutes | 7 | 1.3% |
| 40 to 44 Minutes | 5 | 1.0% |
| 45 to 59 Minutes | 53 | 10.2% |
| 60 to 89 Minutes | 0 | 0.0% |
| 90 or more Minutes | 3 | 0.6% |
Commute Time by Sex in Hackberry
The most common commute times in Hackberry are less than 5 minutes (166 commuters, 44.3%) for males and 10 to 14 minutes (40 commuters, 27.6%) for females.
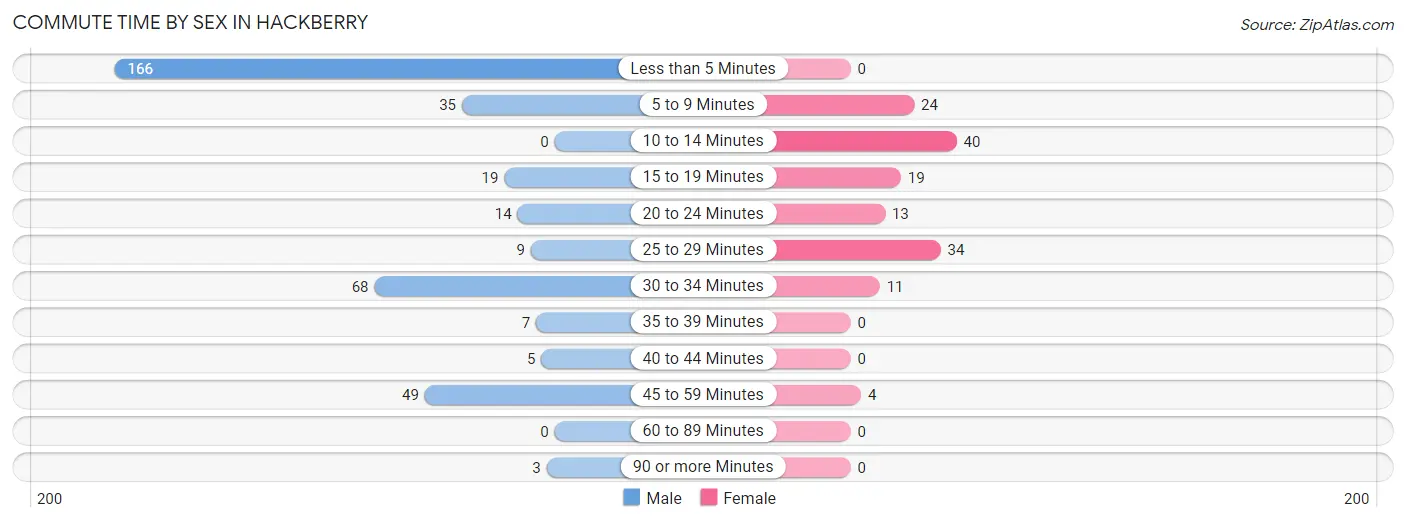
| Commute Time | Male | Female |
| Less than 5 Minutes | 166 (44.3%) | 0 (0.0%) |
| 5 to 9 Minutes | 35 (9.3%) | 24 (16.6%) |
| 10 to 14 Minutes | 0 (0.0%) | 40 (27.6%) |
| 15 to 19 Minutes | 19 (5.1%) | 19 (13.1%) |
| 20 to 24 Minutes | 14 (3.7%) | 13 (9.0%) |
| 25 to 29 Minutes | 9 (2.4%) | 34 (23.4%) |
| 30 to 34 Minutes | 68 (18.1%) | 11 (7.6%) |
| 35 to 39 Minutes | 7 (1.9%) | 0 (0.0%) |
| 40 to 44 Minutes | 5 (1.3%) | 0 (0.0%) |
| 45 to 59 Minutes | 49 (13.1%) | 4 (2.8%) |
| 60 to 89 Minutes | 0 (0.0%) | 0 (0.0%) |
| 90 or more Minutes | 3 (0.8%) | 0 (0.0%) |
Time of Departure to Work by Sex in Hackberry
The most frequent times of departure to work in Hackberry are 12:00 AM to 4:59 AM (139, 37.1%) for males and 7:30 AM to 7:59 AM (54, 37.2%) for females.
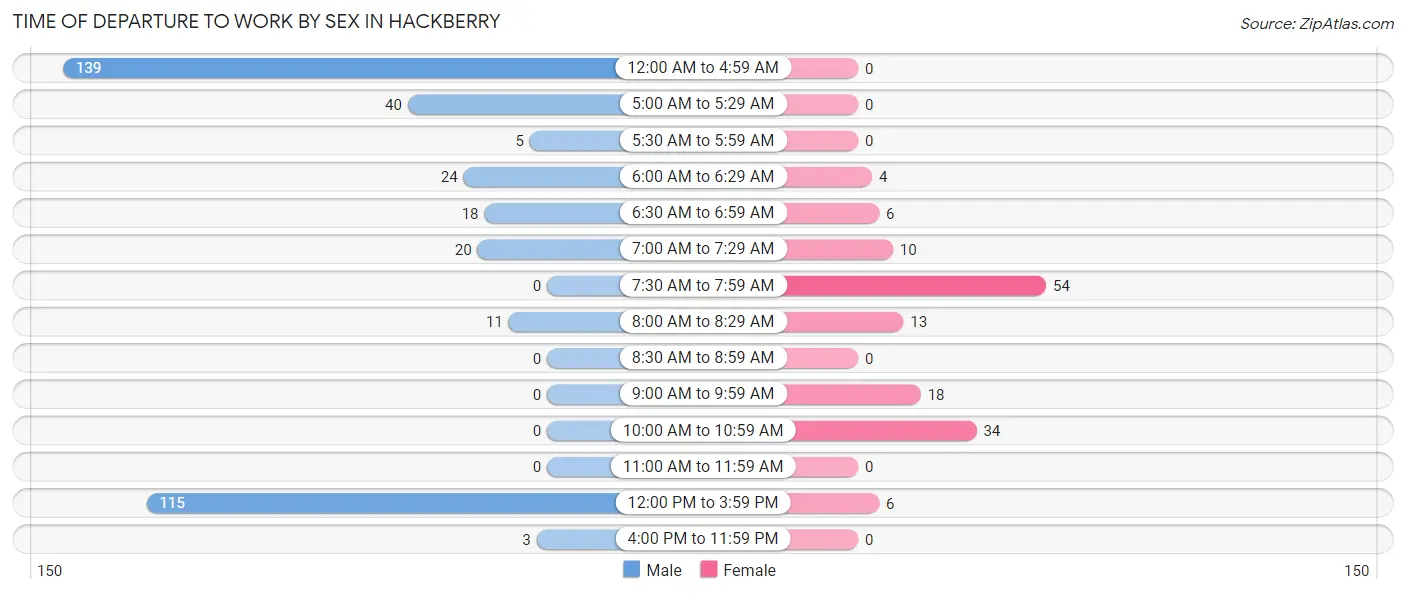
| Time of Departure | Male | Female |
| 12:00 AM to 4:59 AM | 139 (37.1%) | 0 (0.0%) |
| 5:00 AM to 5:29 AM | 40 (10.7%) | 0 (0.0%) |
| 5:30 AM to 5:59 AM | 5 (1.3%) | 0 (0.0%) |
| 6:00 AM to 6:29 AM | 24 (6.4%) | 4 (2.8%) |
| 6:30 AM to 6:59 AM | 18 (4.8%) | 6 (4.1%) |
| 7:00 AM to 7:29 AM | 20 (5.3%) | 10 (6.9%) |
| 7:30 AM to 7:59 AM | 0 (0.0%) | 54 (37.2%) |
| 8:00 AM to 8:29 AM | 11 (2.9%) | 13 (9.0%) |
| 8:30 AM to 8:59 AM | 0 (0.0%) | 0 (0.0%) |
| 9:00 AM to 9:59 AM | 0 (0.0%) | 18 (12.4%) |
| 10:00 AM to 10:59 AM | 0 (0.0%) | 34 (23.4%) |
| 11:00 AM to 11:59 AM | 0 (0.0%) | 0 (0.0%) |
| 12:00 PM to 3:59 PM | 115 (30.7%) | 6 (4.1%) |
| 4:00 PM to 11:59 PM | 3 (0.8%) | 0 (0.0%) |
| Total | 375 (100.0%) | 145 (100.0%) |
Housing Occupancy in Hackberry
Occupancy by Ownership in Hackberry
Of the total 352 dwellings in Hackberry, owner-occupied units account for 305 (86.7%), while renter-occupied units make up 47 (13.4%).
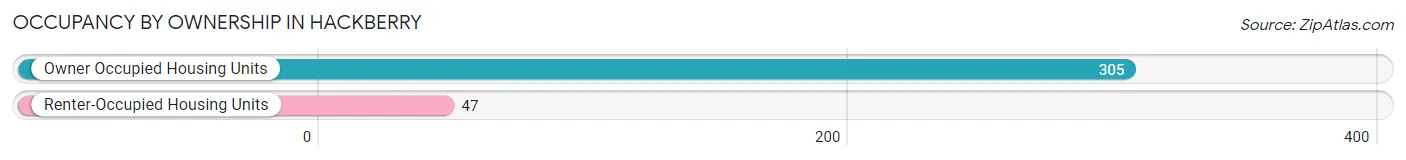
| Occupancy | # Housing Units | % Housing Units |
| Owner Occupied Housing Units | 305 | 86.7% |
| Renter-Occupied Housing Units | 47 | 13.4% |
| Total Occupied Housing Units | 352 | 100.0% |
Occupancy by Household Size in Hackberry
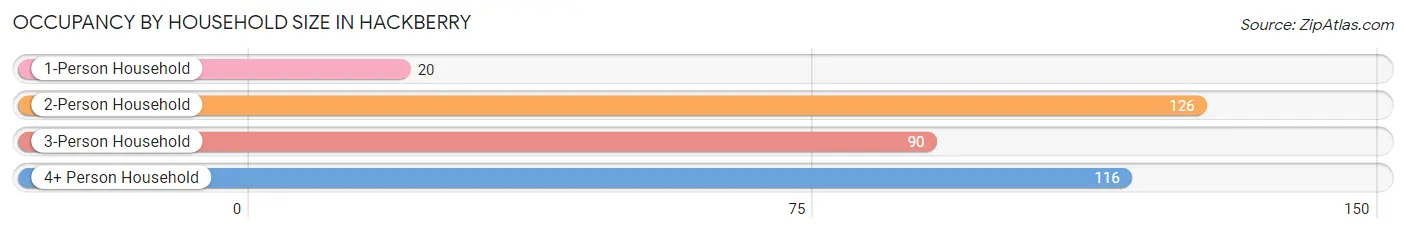
| Household Size | # Housing Units | % Housing Units |
| 1-Person Household | 20 | 5.7% |
| 2-Person Household | 126 | 35.8% |
| 3-Person Household | 90 | 25.6% |
| 4+ Person Household | 116 | 33.0% |
| Total Housing Units | 352 | 100.0% |
Occupancy by Ownership by Household Size in Hackberry
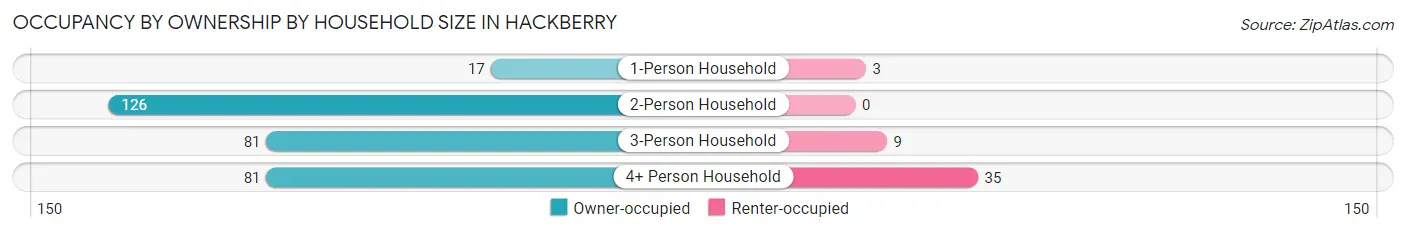
| Household Size | Owner-occupied | Renter-occupied |
| 1-Person Household | 17 (85.0%) | 3 (15.0%) |
| 2-Person Household | 126 (100.0%) | 0 (0.0%) |
| 3-Person Household | 81 (90.0%) | 9 (10.0%) |
| 4+ Person Household | 81 (69.8%) | 35 (30.2%) |
| Total Housing Units | 305 (86.7%) | 47 (13.4%) |
Occupancy by Educational Attainment in Hackberry
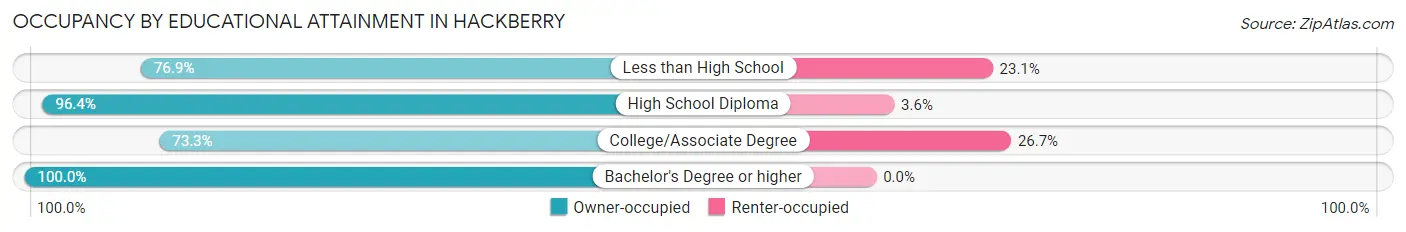
| Household Size | Owner-occupied | Renter-occupied |
| Less than High School | 30 (76.9%) | 9 (23.1%) |
| High School Diploma | 81 (96.4%) | 3 (3.6%) |
| College/Associate Degree | 96 (73.3%) | 35 (26.7%) |
| Bachelor's Degree or higher | 98 (100.0%) | 0 (0.0%) |
Occupancy by Age of Householder in Hackberry
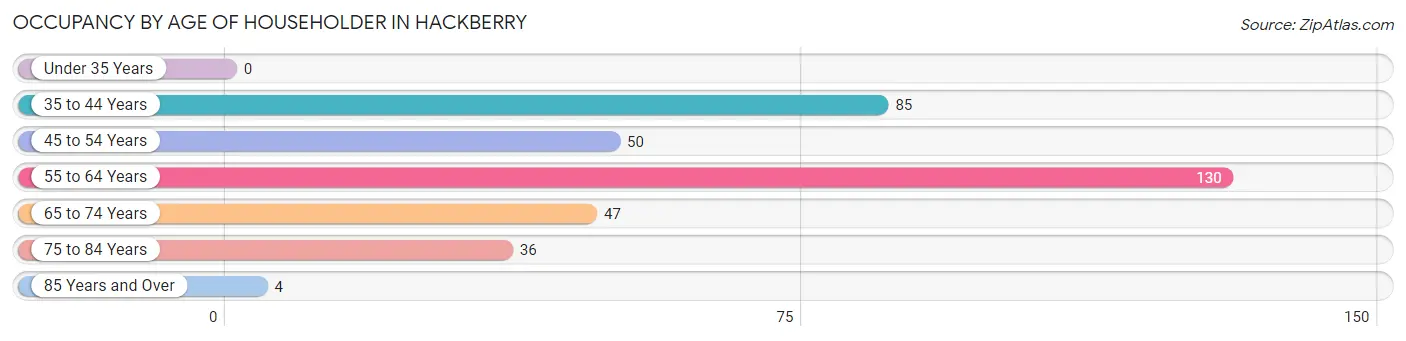
| Age Bracket | # Households | % Households |
| Under 35 Years | 0 | 0.0% |
| 35 to 44 Years | 85 | 24.1% |
| 45 to 54 Years | 50 | 14.2% |
| 55 to 64 Years | 130 | 36.9% |
| 65 to 74 Years | 47 | 13.4% |
| 75 to 84 Years | 36 | 10.2% |
| 85 Years and Over | 4 | 1.1% |
| Total | 352 | 100.0% |
Housing Finances in Hackberry
Median Income by Occupancy in Hackberry
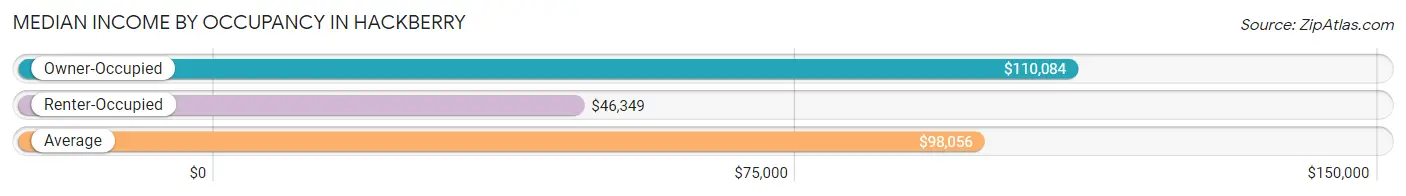
| Occupancy Type | # Households | Median Income |
| Owner-Occupied | 305 (86.7%) | $110,084 |
| Renter-Occupied | 47 (13.4%) | $46,349 |
| Average | 352 (100.0%) | $98,056 |
Occupancy by Householder Income Bracket in Hackberry
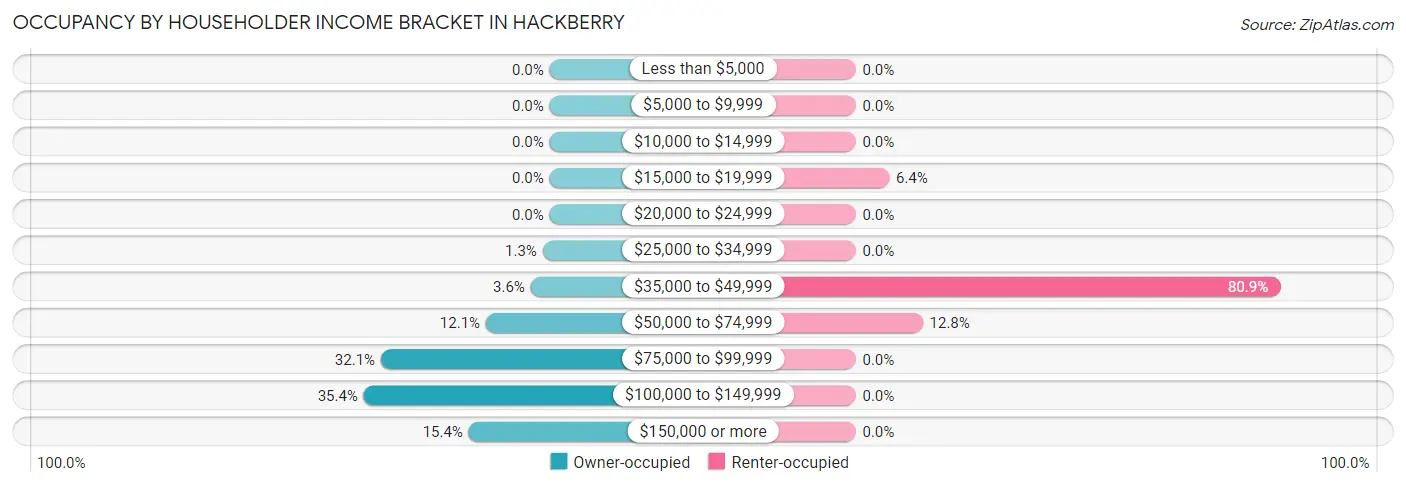
| Income Bracket | Owner-occupied | Renter-occupied |
| Less than $5,000 | 0 (0.0%) | 0 (0.0%) |
| $5,000 to $9,999 | 0 (0.0%) | 0 (0.0%) |
| $10,000 to $14,999 | 0 (0.0%) | 0 (0.0%) |
| $15,000 to $19,999 | 0 (0.0%) | 3 (6.4%) |
| $20,000 to $24,999 | 0 (0.0%) | 0 (0.0%) |
| $25,000 to $34,999 | 4 (1.3%) | 0 (0.0%) |
| $35,000 to $49,999 | 11 (3.6%) | 38 (80.8%) |
| $50,000 to $74,999 | 37 (12.1%) | 6 (12.8%) |
| $75,000 to $99,999 | 98 (32.1%) | 0 (0.0%) |
| $100,000 to $149,999 | 108 (35.4%) | 0 (0.0%) |
| $150,000 or more | 47 (15.4%) | 0 (0.0%) |
| Total | 305 (100.0%) | 47 (100.0%) |
Monthly Housing Cost Tiers in Hackberry
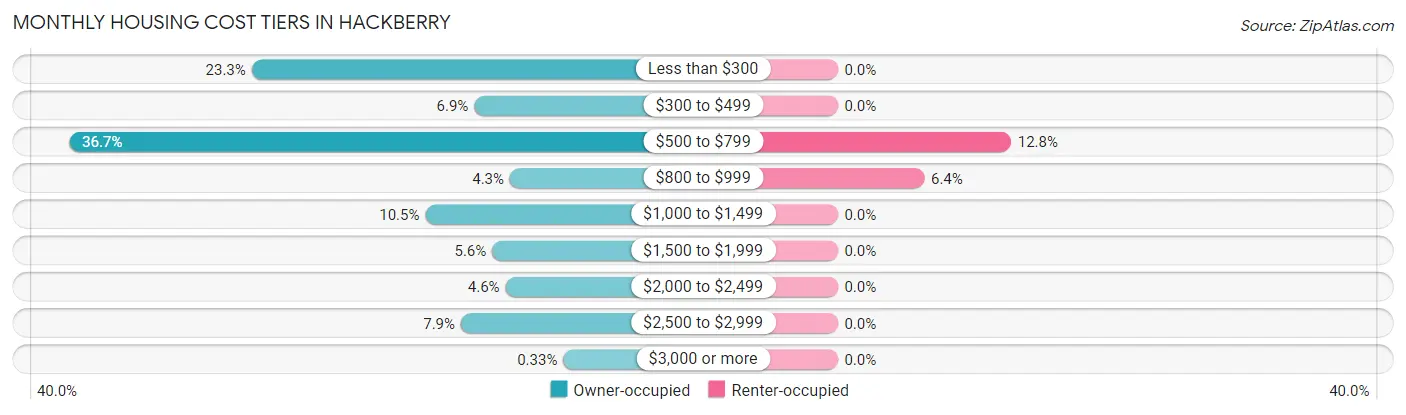
| Monthly Cost | Owner-occupied | Renter-occupied |
| Less than $300 | 71 (23.3%) | 0 (0.0%) |
| $300 to $499 | 21 (6.9%) | 0 (0.0%) |
| $500 to $799 | 112 (36.7%) | 6 (12.8%) |
| $800 to $999 | 13 (4.3%) | 3 (6.4%) |
| $1,000 to $1,499 | 32 (10.5%) | 0 (0.0%) |
| $1,500 to $1,999 | 17 (5.6%) | 0 (0.0%) |
| $2,000 to $2,499 | 14 (4.6%) | 0 (0.0%) |
| $2,500 to $2,999 | 24 (7.9%) | 0 (0.0%) |
| $3,000 or more | 1 (0.3%) | 0 (0.0%) |
| Total | 305 (100.0%) | 47 (100.0%) |
Physical Housing Characteristics in Hackberry
Housing Structures in Hackberry
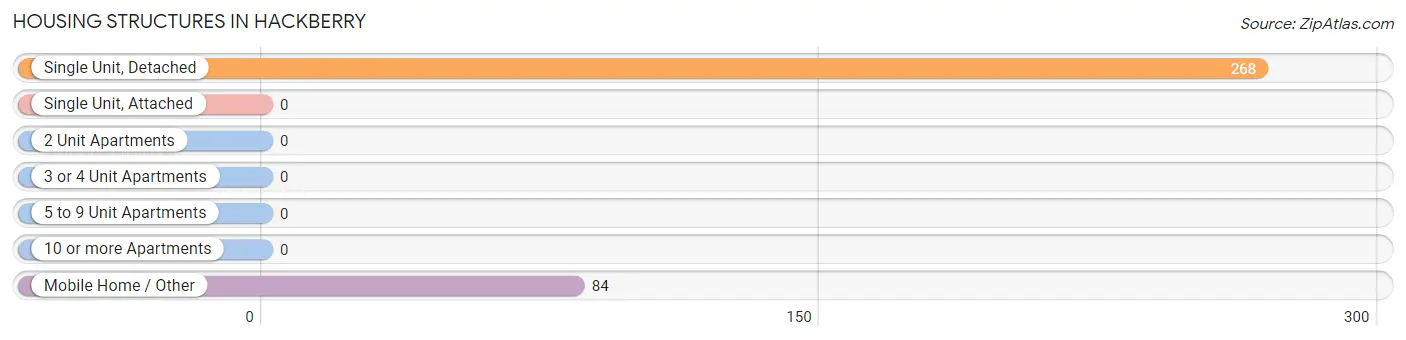
| Structure Type | # Housing Units | % Housing Units |
| Single Unit, Detached | 268 | 76.1% |
| Single Unit, Attached | 0 | 0.0% |
| 2 Unit Apartments | 0 | 0.0% |
| 3 or 4 Unit Apartments | 0 | 0.0% |
| 5 to 9 Unit Apartments | 0 | 0.0% |
| 10 or more Apartments | 0 | 0.0% |
| Mobile Home / Other | 84 | 23.9% |
| Total | 352 | 100.0% |
Housing Structures by Occupancy in Hackberry
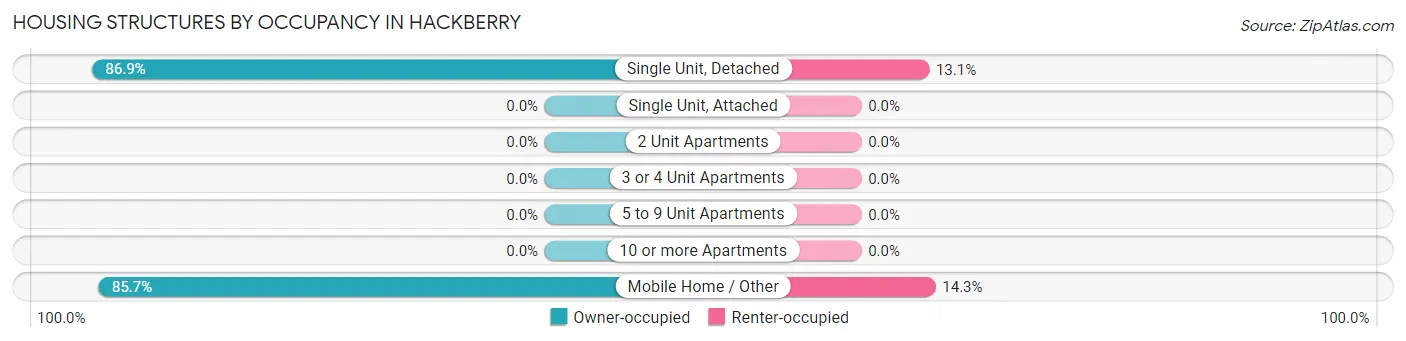
| Structure Type | Owner-occupied | Renter-occupied |
| Single Unit, Detached | 233 (86.9%) | 35 (13.1%) |
| Single Unit, Attached | 0 (0.0%) | 0 (0.0%) |
| 2 Unit Apartments | 0 (0.0%) | 0 (0.0%) |
| 3 or 4 Unit Apartments | 0 (0.0%) | 0 (0.0%) |
| 5 to 9 Unit Apartments | 0 (0.0%) | 0 (0.0%) |
| 10 or more Apartments | 0 (0.0%) | 0 (0.0%) |
| Mobile Home / Other | 72 (85.7%) | 12 (14.3%) |
| Total | 305 (86.7%) | 47 (13.4%) |
Housing Structures by Number of Rooms in Hackberry
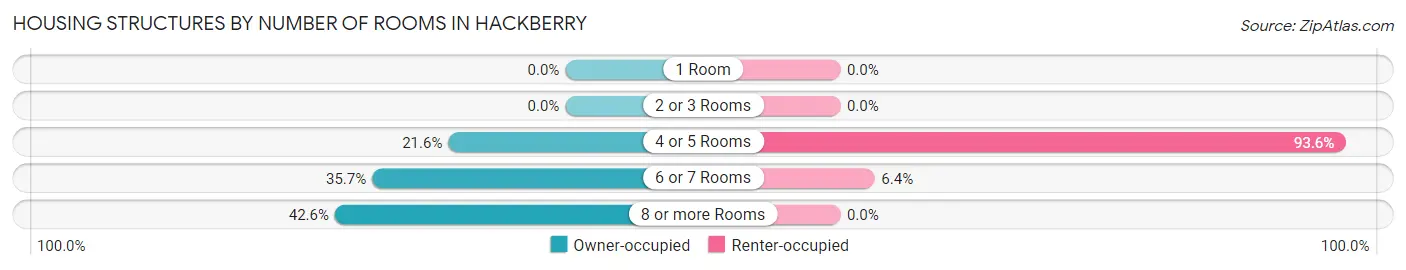
| Number of Rooms | Owner-occupied | Renter-occupied |
| 1 Room | 0 (0.0%) | 0 (0.0%) |
| 2 or 3 Rooms | 0 (0.0%) | 0 (0.0%) |
| 4 or 5 Rooms | 66 (21.6%) | 44 (93.6%) |
| 6 or 7 Rooms | 109 (35.7%) | 3 (6.4%) |
| 8 or more Rooms | 130 (42.6%) | 0 (0.0%) |
| Total | 305 (100.0%) | 47 (100.0%) |
Housing Structure by Heating Type in Hackberry
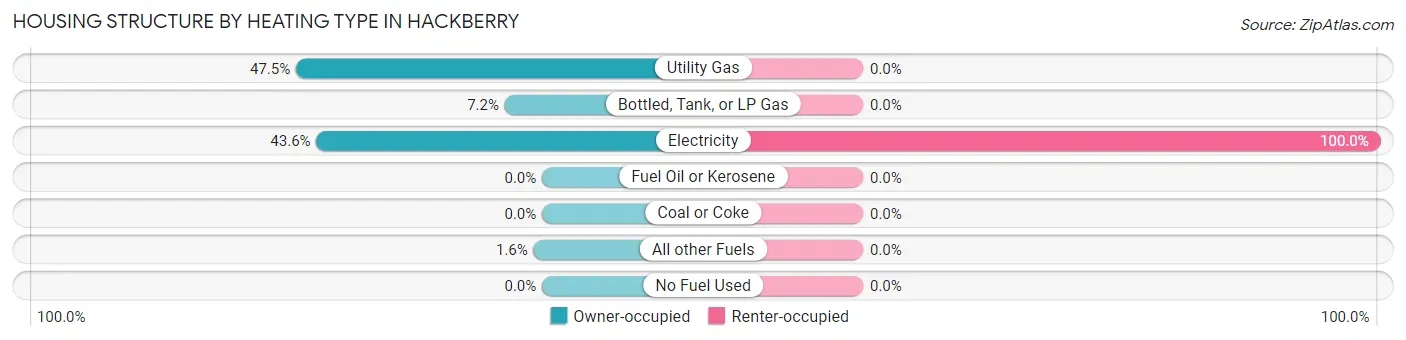
| Heating Type | Owner-occupied | Renter-occupied |
| Utility Gas | 145 (47.5%) | 0 (0.0%) |
| Bottled, Tank, or LP Gas | 22 (7.2%) | 0 (0.0%) |
| Electricity | 133 (43.6%) | 47 (100.0%) |
| Fuel Oil or Kerosene | 0 (0.0%) | 0 (0.0%) |
| Coal or Coke | 0 (0.0%) | 0 (0.0%) |
| All other Fuels | 5 (1.6%) | 0 (0.0%) |
| No Fuel Used | 0 (0.0%) | 0 (0.0%) |
| Total | 305 (100.0%) | 47 (100.0%) |
Household Vehicle Usage in Hackberry
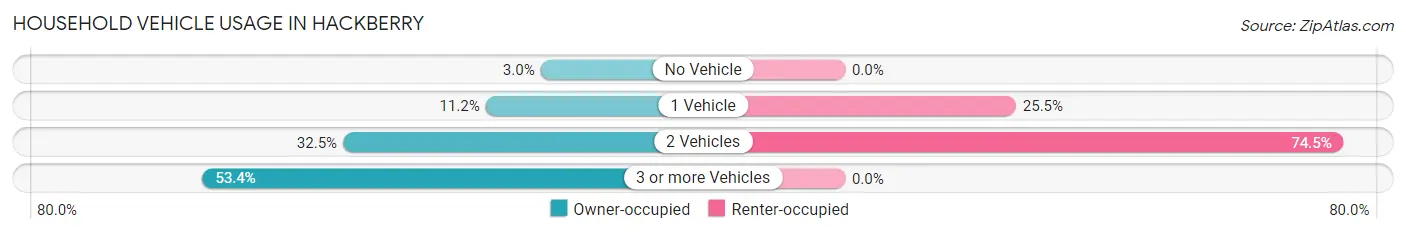
| Vehicles per Household | Owner-occupied | Renter-occupied |
| No Vehicle | 9 (2.9%) | 0 (0.0%) |
| 1 Vehicle | 34 (11.2%) | 12 (25.5%) |
| 2 Vehicles | 99 (32.5%) | 35 (74.5%) |
| 3 or more Vehicles | 163 (53.4%) | 0 (0.0%) |
| Total | 305 (100.0%) | 47 (100.0%) |
Real Estate & Mortgages in Hackberry
Real Estate and Mortgage Overview in Hackberry
| Characteristic | Without Mortgage | With Mortgage |
| Housing Units | 215 | 90 |
| Median Property Value | $231,500 | $250,000 |
| Median Household Income | $98,967 | $28 |
| Monthly Housing Costs | $523 | $1 |
| Real Estate Taxes | - | - |
Property Value by Mortgage Status in Hackberry
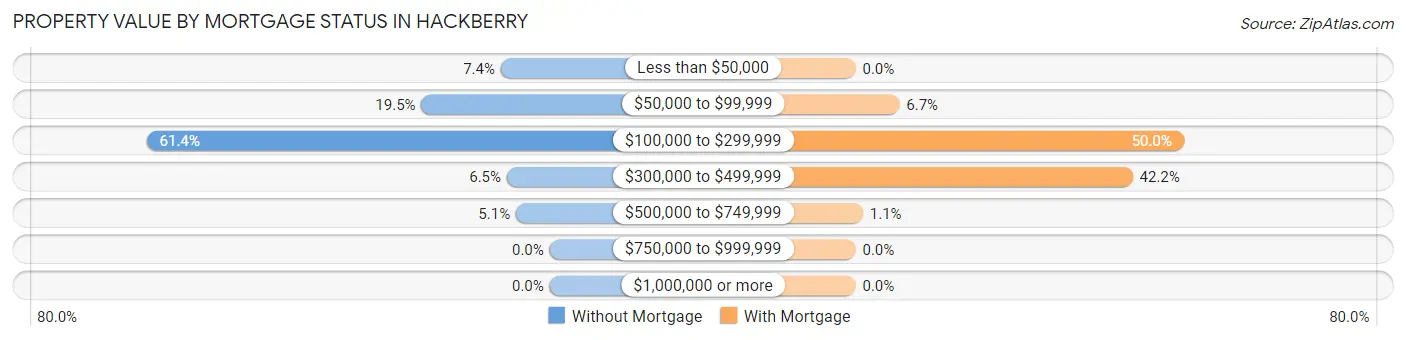
| Property Value | Without Mortgage | With Mortgage |
| Less than $50,000 | 16 (7.4%) | 0 (0.0%) |
| $50,000 to $99,999 | 42 (19.5%) | 6 (6.7%) |
| $100,000 to $299,999 | 132 (61.4%) | 45 (50.0%) |
| $300,000 to $499,999 | 14 (6.5%) | 38 (42.2%) |
| $500,000 to $749,999 | 11 (5.1%) | 1 (1.1%) |
| $750,000 to $999,999 | 0 (0.0%) | 0 (0.0%) |
| $1,000,000 or more | 0 (0.0%) | 0 (0.0%) |
| Total | 215 (100.0%) | 90 (100.0%) |
Household Income by Mortgage Status in Hackberry
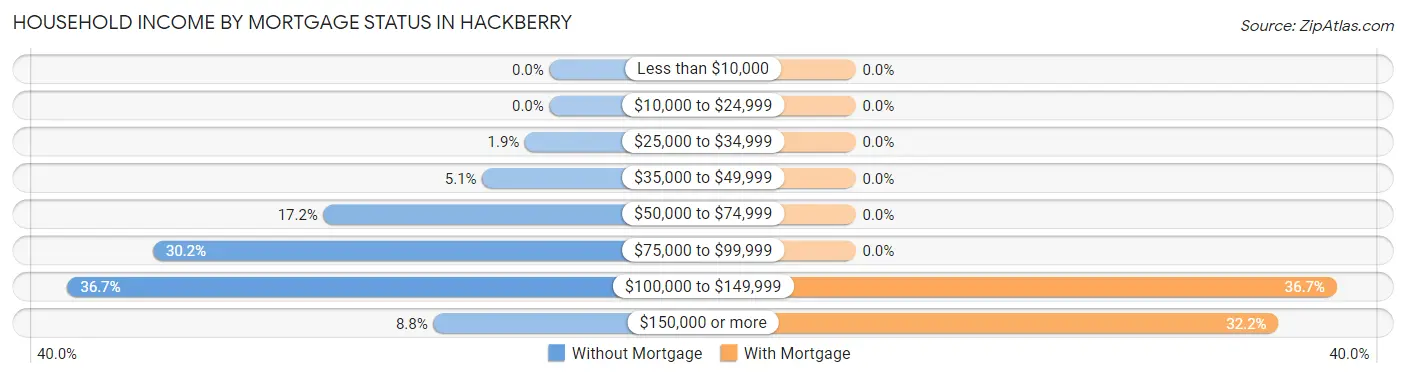
| Household Income | Without Mortgage | With Mortgage |
| Less than $10,000 | 0 (0.0%) | 0 (0.0%) |
| $10,000 to $24,999 | 0 (0.0%) | 0 (0.0%) |
| $25,000 to $34,999 | 4 (1.9%) | 0 (0.0%) |
| $35,000 to $49,999 | 11 (5.1%) | 0 (0.0%) |
| $50,000 to $74,999 | 37 (17.2%) | 0 (0.0%) |
| $75,000 to $99,999 | 65 (30.2%) | 0 (0.0%) |
| $100,000 to $149,999 | 79 (36.7%) | 33 (36.7%) |
| $150,000 or more | 19 (8.8%) | 29 (32.2%) |
| Total | 215 (100.0%) | 90 (100.0%) |
Property Value to Household Income Ratio in Hackberry
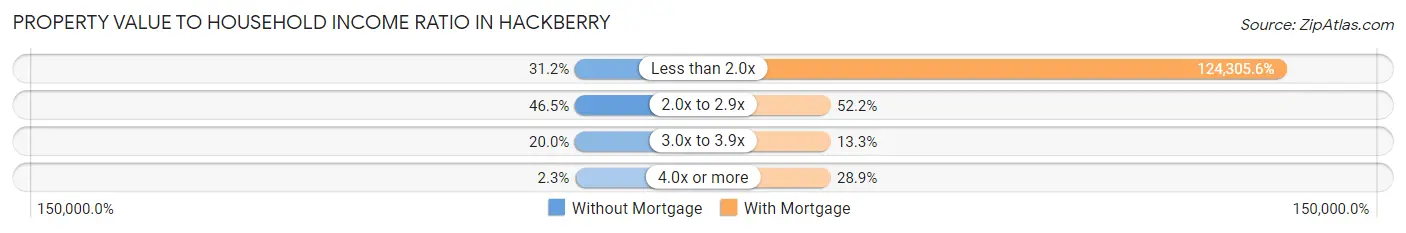
| Value-to-Income Ratio | Without Mortgage | With Mortgage |
| Less than 2.0x | 67 (31.2%) | 111,875 (124,305.6%) |
| 2.0x to 2.9x | 100 (46.5%) | 47 (52.2%) |
| 3.0x to 3.9x | 43 (20.0%) | 12 (13.3%) |
| 4.0x or more | 5 (2.3%) | 26 (28.9%) |
| Total | 215 (100.0%) | 90 (100.0%) |
Real Estate Taxes by Mortgage Status in Hackberry
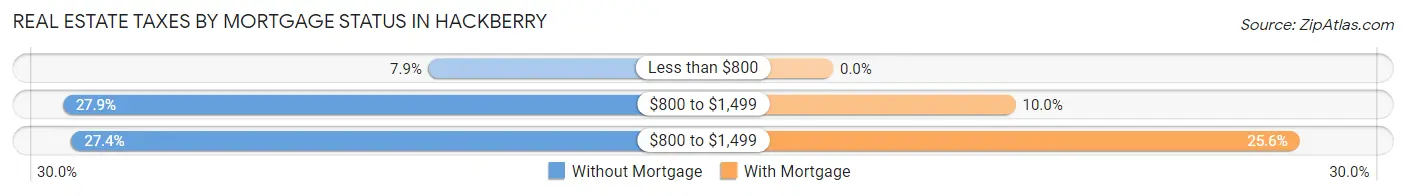
| Property Taxes | Without Mortgage | With Mortgage |
| Less than $800 | 17 (7.9%) | 0 (0.0%) |
| $800 to $1,499 | 60 (27.9%) | 9 (10.0%) |
| $800 to $1,499 | 59 (27.4%) | 23 (25.6%) |
| Total | 215 (100.0%) | 90 (100.0%) |
Health & Disability in Hackberry
Health Insurance Coverage by Age in Hackberry
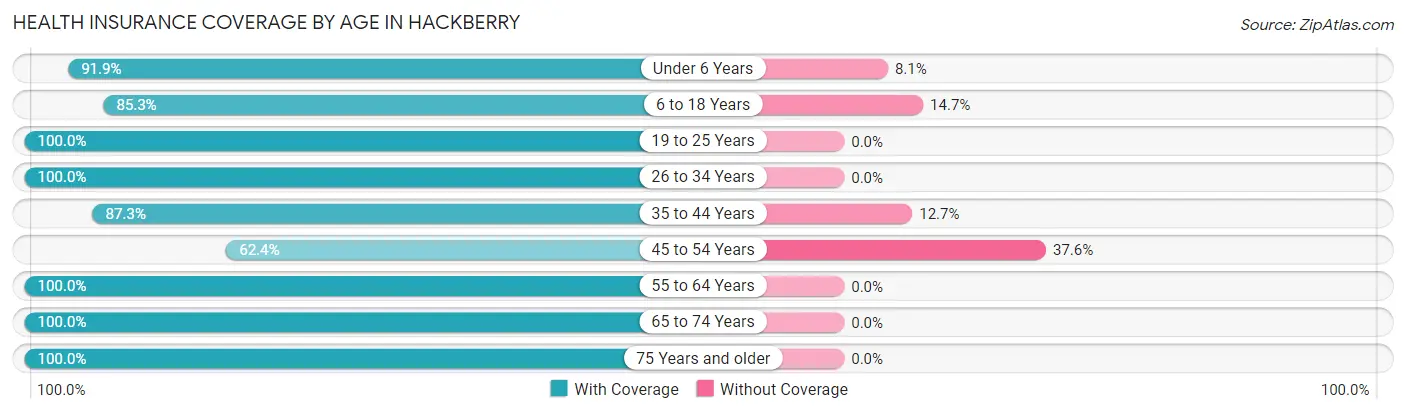
| Age Bracket | With Coverage | Without Coverage |
| Under 6 Years | 79 (91.9%) | 7 (8.1%) |
| 6 to 18 Years | 116 (85.3%) | 20 (14.7%) |
| 19 to 25 Years | 44 (100.0%) | 0 (0.0%) |
| 26 to 34 Years | 34 (100.0%) | 0 (0.0%) |
| 35 to 44 Years | 124 (87.3%) | 18 (12.7%) |
| 45 to 54 Years | 63 (62.4%) | 38 (37.6%) |
| 55 to 64 Years | 267 (100.0%) | 0 (0.0%) |
| 65 to 74 Years | 121 (100.0%) | 0 (0.0%) |
| 75 Years and older | 57 (100.0%) | 0 (0.0%) |
| Total | 905 (91.6%) | 83 (8.4%) |
Health Insurance Coverage by Citizenship Status in Hackberry
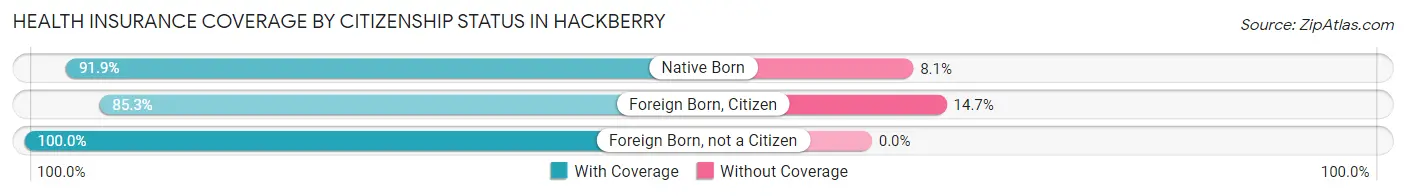
| Citizenship Status | With Coverage | Without Coverage |
| Native Born | 79 (91.9%) | 7 (8.1%) |
| Foreign Born, Citizen | 116 (85.3%) | 20 (14.7%) |
| Foreign Born, not a Citizen | 44 (100.0%) | 0 (0.0%) |
Health Insurance Coverage by Household Income in Hackberry
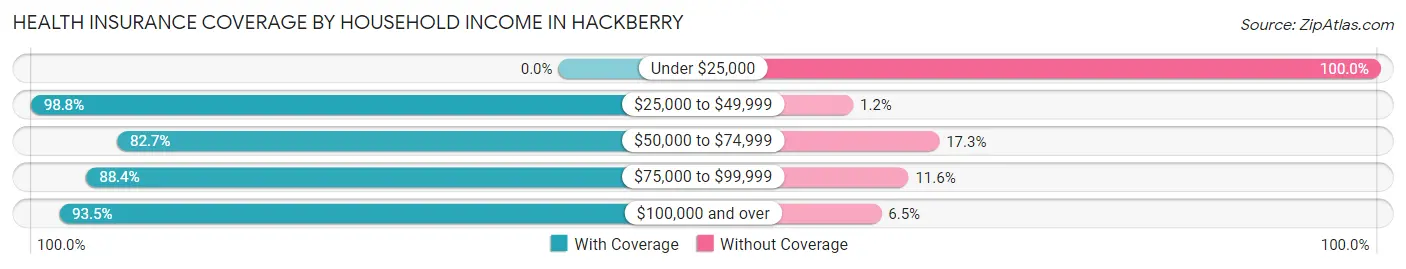
| Household Income | With Coverage | Without Coverage |
| Under $25,000 | 0 (0.0%) | 3 (100.0%) |
| $25,000 to $49,999 | 168 (98.8%) | 2 (1.2%) |
| $50,000 to $74,999 | 105 (82.7%) | 22 (17.3%) |
| $75,000 to $99,999 | 199 (88.4%) | 26 (11.6%) |
| $100,000 and over | 433 (93.5%) | 30 (6.5%) |
Public vs Private Health Insurance Coverage by Age in Hackberry
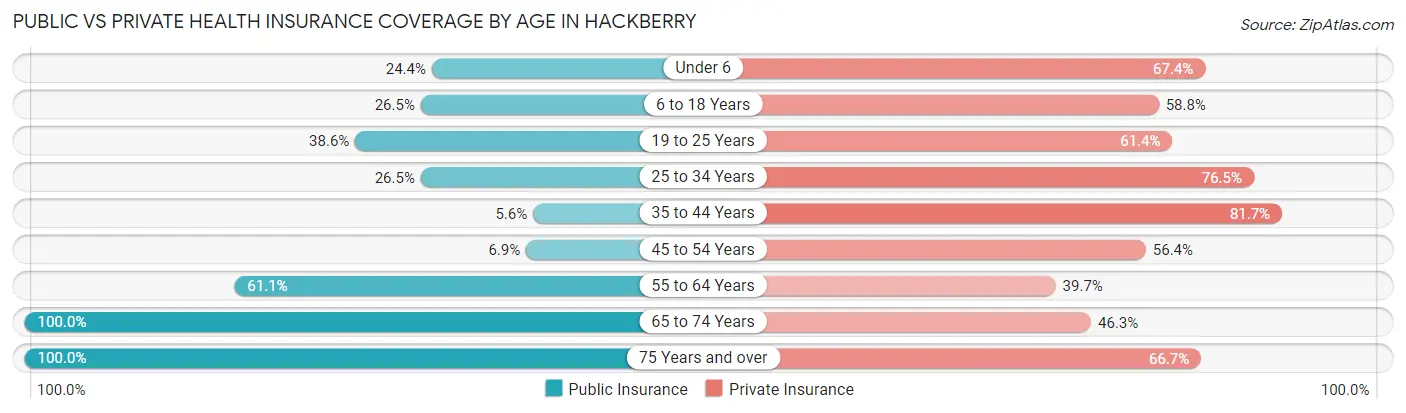
| Age Bracket | Public Insurance | Private Insurance |
| Under 6 | 21 (24.4%) | 58 (67.4%) |
| 6 to 18 Years | 36 (26.5%) | 80 (58.8%) |
| 19 to 25 Years | 17 (38.6%) | 27 (61.4%) |
| 25 to 34 Years | 9 (26.5%) | 26 (76.5%) |
| 35 to 44 Years | 8 (5.6%) | 116 (81.7%) |
| 45 to 54 Years | 7 (6.9%) | 57 (56.4%) |
| 55 to 64 Years | 163 (61.1%) | 106 (39.7%) |
| 65 to 74 Years | 121 (100.0%) | 56 (46.3%) |
| 75 Years and over | 57 (100.0%) | 38 (66.7%) |
| Total | 439 (44.4%) | 564 (57.1%) |
Disability Status by Sex by Age in Hackberry
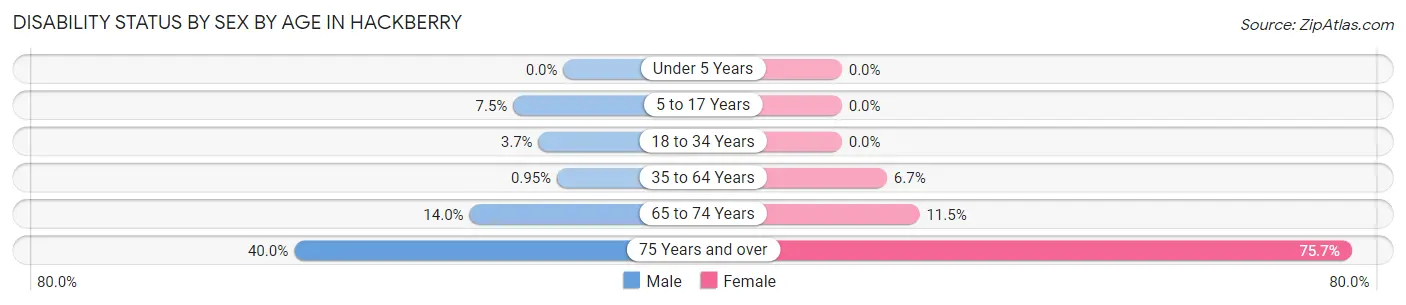
| Age Bracket | Male | Female |
| Under 5 Years | 0 (0.0%) | 0 (0.0%) |
| 5 to 17 Years | 7 (7.4%) | 0 (0.0%) |
| 18 to 34 Years | 1 (3.7%) | 0 (0.0%) |
| 35 to 64 Years | 3 (0.9%) | 13 (6.7%) |
| 65 to 74 Years | 6 (14.0%) | 9 (11.5%) |
| 75 Years and over | 8 (40.0%) | 28 (75.7%) |
Disability Class by Sex by Age in Hackberry
Disability Class: Hearing Difficulty
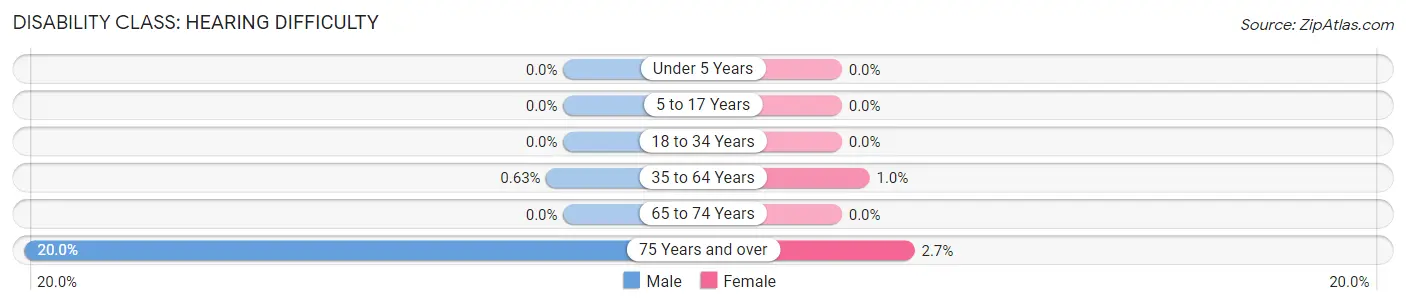
| Age Bracket | Male | Female |
| Under 5 Years | 0 (0.0%) | 0 (0.0%) |
| 5 to 17 Years | 0 (0.0%) | 0 (0.0%) |
| 18 to 34 Years | 0 (0.0%) | 0 (0.0%) |
| 35 to 64 Years | 2 (0.6%) | 2 (1.0%) |
| 65 to 74 Years | 0 (0.0%) | 0 (0.0%) |
| 75 Years and over | 4 (20.0%) | 1 (2.7%) |
Disability Class: Vision Difficulty
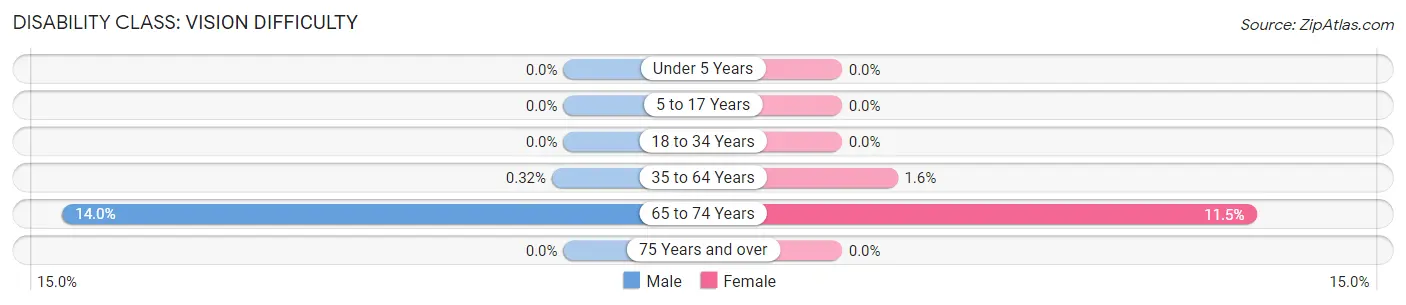
| Age Bracket | Male | Female |
| Under 5 Years | 0 (0.0%) | 0 (0.0%) |
| 5 to 17 Years | 0 (0.0%) | 0 (0.0%) |
| 18 to 34 Years | 0 (0.0%) | 0 (0.0%) |
| 35 to 64 Years | 1 (0.3%) | 3 (1.5%) |
| 65 to 74 Years | 6 (14.0%) | 9 (11.5%) |
| 75 Years and over | 0 (0.0%) | 0 (0.0%) |
Disability Class: Cognitive Difficulty
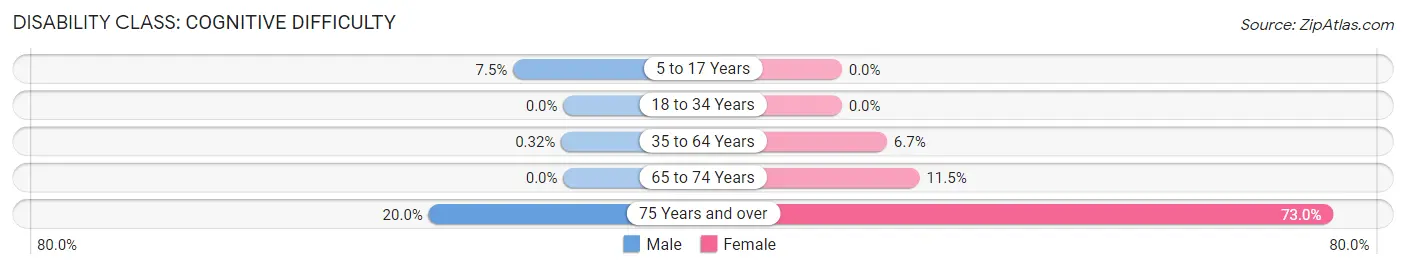
| Age Bracket | Male | Female |
| 5 to 17 Years | 7 (7.4%) | 0 (0.0%) |
| 18 to 34 Years | 0 (0.0%) | 0 (0.0%) |
| 35 to 64 Years | 1 (0.3%) | 13 (6.7%) |
| 65 to 74 Years | 0 (0.0%) | 9 (11.5%) |
| 75 Years and over | 4 (20.0%) | 27 (73.0%) |
Disability Class: Ambulatory Difficulty
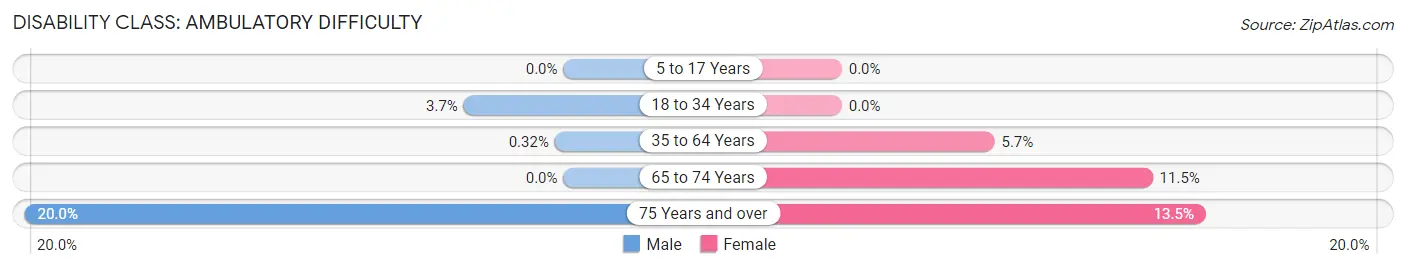
| Age Bracket | Male | Female |
| 5 to 17 Years | 0 (0.0%) | 0 (0.0%) |
| 18 to 34 Years | 1 (3.7%) | 0 (0.0%) |
| 35 to 64 Years | 1 (0.3%) | 11 (5.7%) |
| 65 to 74 Years | 0 (0.0%) | 9 (11.5%) |
| 75 Years and over | 4 (20.0%) | 5 (13.5%) |
Disability Class: Self-Care Difficulty
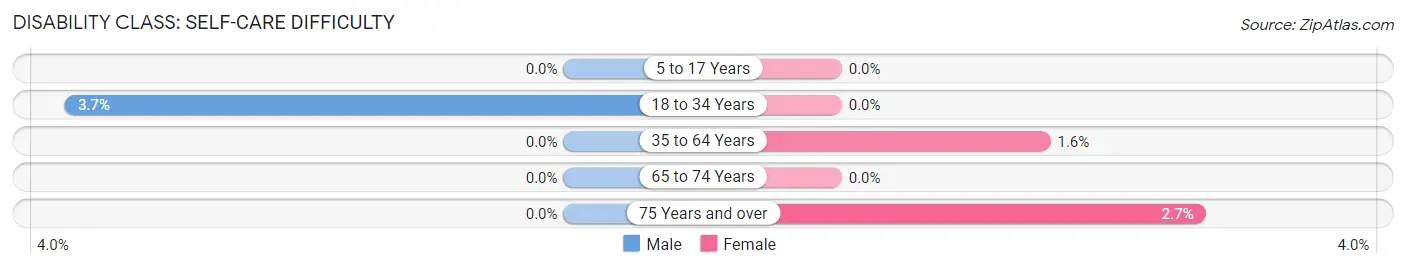
| Age Bracket | Male | Female |
| 5 to 17 Years | 0 (0.0%) | 0 (0.0%) |
| 18 to 34 Years | 1 (3.7%) | 0 (0.0%) |
| 35 to 64 Years | 0 (0.0%) | 3 (1.5%) |
| 65 to 74 Years | 0 (0.0%) | 0 (0.0%) |
| 75 Years and over | 0 (0.0%) | 1 (2.7%) |
Technology Access in Hackberry
Computing Device Access in Hackberry
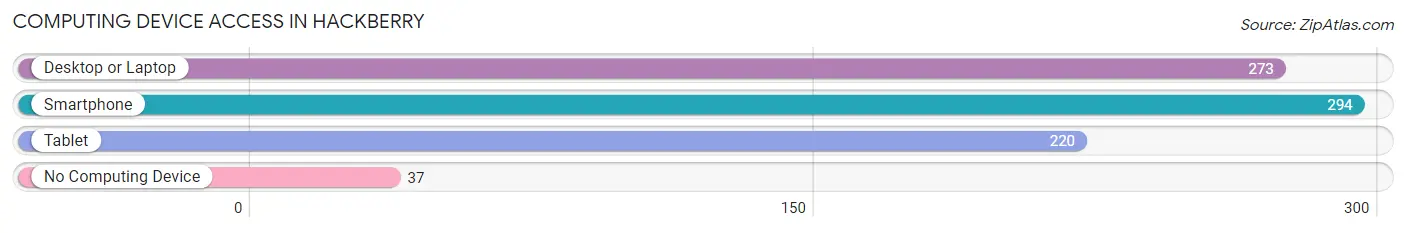
| Device Type | # Households | % Households |
| Desktop or Laptop | 273 | 77.6% |
| Smartphone | 294 | 83.5% |
| Tablet | 220 | 62.5% |
| No Computing Device | 37 | 10.5% |
| Total | 352 | 100.0% |
Internet Access in Hackberry
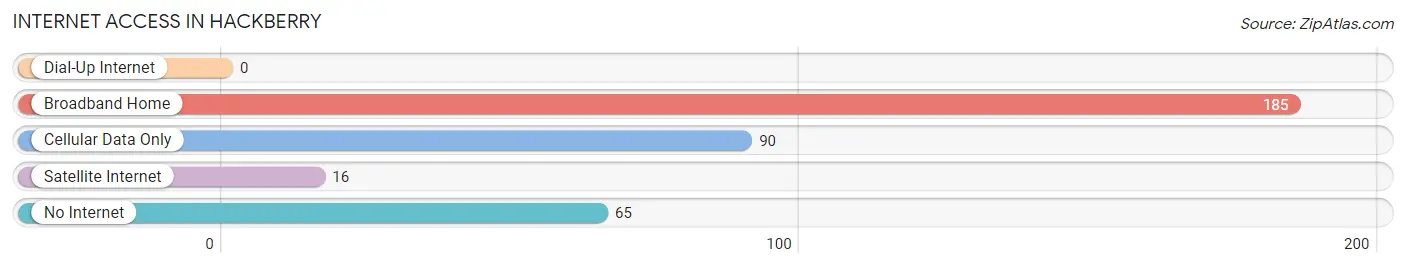
| Internet Type | # Households | % Households |
| Dial-Up Internet | 0 | 0.0% |
| Broadband Home | 185 | 52.6% |
| Cellular Data Only | 90 | 25.6% |
| Satellite Internet | 16 | 4.5% |
| No Internet | 65 | 18.5% |
| Total | 352 | 100.0% |
Hackberry Summary
History
The small town of Hackberry, Louisiana is located in the southwestern corner of the state, in Cameron Parish. It is situated on the banks of the Calcasieu River, and is surrounded by marshland and wetlands. The area was first inhabited by the Attakapas Indians, who were later displaced by the Spanish and French settlers. The first European settlers arrived in the area in the late 1700s, and the town was officially founded in 1845.
The town was named after the hackberry trees that grew in abundance in the area. It was originally a small fishing village, and the main industry was shrimping. In the early 1900s, the town began to grow as the oil and gas industry moved into the area. The town was incorporated in 1912, and the population grew to over 1,000 by the 1930s.
The town was devastated by Hurricane Audrey in 1957, which killed over 500 people and destroyed much of the town. The town was rebuilt, and the population grew to over 2,000 by the 1970s.
Geography
Hackberry is located in the southwestern corner of Louisiana, in Cameron Parish. It is situated on the banks of the Calcasieu River, and is surrounded by marshland and wetlands. The town is located about 25 miles from the Gulf of Mexico, and is about 30 miles from the Texas border. The town is located in a humid subtropical climate zone, and experiences hot, humid summers and mild winters.
The town is located on the edge of the Sabine National Wildlife Refuge, which is home to a variety of wildlife, including alligators, turtles, and migratory birds. The town is also located near the Creole Nature Trail, a 180-mile scenic byway that winds through the marshlands and wetlands of the area.
Economy
The economy of Hackberry is largely based on the oil and gas industry. The town is home to several oil and gas companies, and the industry is the main source of employment in the area. The town is also home to several seafood processing plants, which process shrimp, oysters, and other seafood.
The town is also home to several small businesses, including restaurants, shops, and other services. Tourism is also an important part of the local economy, as the town is located near the Creole Nature Trail and the Sabine National Wildlife Refuge.
Demographics
As of the 2010 census, the population of Hackberry was 2,161. The population is largely white (90.2%), with a small African American population (7.2%) and a small Hispanic population (2.6%). The median household income is $45,000, and the median home value is $125,000.
The town is served by the Cameron Parish School District, which includes two elementary schools, one middle school, and one high school. The town is also home to a branch of the Cameron Parish Library.
Conclusion
Hackberry, Louisiana is a small town located in the southwestern corner of the state. It is situated on the banks of the Calcasieu River, and is surrounded by marshland and wetlands. The town was founded in 1845, and the economy is largely based on the oil and gas industry. The population is largely white, with a small African American and Hispanic population. The town is served by the Cameron Parish School District, and is home to a branch of the Cameron Parish Library. Tourism is also an important part of the local economy, as the town is located near the Creole Nature Trail and the Sabine National Wildlife Refuge.
Common Questions
What is Per Capita Income in Hackberry?
Per Capita income in Hackberry is $31,696.
What is the Median Family Income in Hackberry?
Median Family Income in Hackberry is $98,426.
What is the Median Household income in Hackberry?
Median Household Income in Hackberry is $98,056.
What is Income or Wage Gap in Hackberry?
Income or Wage Gap in Hackberry is 63.4%.
Women in Hackberry earn 36.6 cents for every dollar earned by a man.
What is Inequality or Gini Index in Hackberry?
Inequality or Gini Index in Hackberry is 0.26.
What is the Total Population of Hackberry?
Total Population of Hackberry is 988.
What is the Total Male Population of Hackberry?
Total Male Population of Hackberry is 545.
What is the Total Female Population of Hackberry?
Total Female Population of Hackberry is 443.
What is the Ratio of Males per 100 Females in Hackberry?
There are 123.02 Males per 100 Females in Hackberry.
What is the Ratio of Females per 100 Males in Hackberry?
There are 81.28 Females per 100 Males in Hackberry.
What is the Median Population Age in Hackberry?
Median Population Age in Hackberry is 52.2 Years.
What is the Average Family Size in Hackberry
Average Family Size in Hackberry is 2.8 People.
What is the Average Household Size in Hackberry
Average Household Size in Hackberry is 2.8 People.
How Large is the Labor Force in Hackberry?
There are 532 People in the Labor Forcein in Hackberry.
What is the Percentage of People in the Labor Force in Hackberry?
68.6% of People are in the Labor Force in Hackberry.
What is the Unemployment Rate in Hackberry?
Unemployment Rate in Hackberry is 1.5%.