Harrisburg, SD Map & Demographics
Harrisburg Map
Harrisburg Overview
$37,475
PER CAPITA INCOME
$102,054
AVG FAMILY INCOME
$89,966
AVG HOUSEHOLD INCOME
36.2%
WAGE / INCOME GAP [ % ]
63.8¢/ $1
WAGE / INCOME GAP [ $ ]
0.28
INEQUALITY / GINI INDEX
7,157
TOTAL POPULATION
3,623
MALE POPULATION
3,534
FEMALE POPULATION
102.52
MALES / 100 FEMALES
97.54
FEMALES / 100 MALES
30.8
MEDIAN AGE
3.0
AVG FAMILY SIZE
2.7
AVG HOUSEHOLD SIZE
4,320
LABOR FORCE [ PEOPLE ]
88.5%
PERCENT IN LABOR FORCE
0.8%
UNEMPLOYMENT RATE
Harrisburg Zip Codes
Harrisburg Area Codes
Income in Harrisburg
Income Overview in Harrisburg
Per Capita Income in Harrisburg is $37,475, while median incomes of families and households are $102,054 and $89,966 respectively.
| Characteristic | Number | Measure |
| Per Capita Income | 7,157 | $37,475 |
| Median Family Income | 2,163 | $102,054 |
| Mean Family Income | 2,163 | $111,402 |
| Median Household Income | 2,642 | $89,966 |
| Mean Household Income | 2,642 | $104,568 |
| Income Deficit | 2,163 | $0 |
| Wage / Income Gap (%) | 7,157 | 36.23% |
| Wage / Income Gap ($) | 7,157 | 63.77¢ per $1 |
| Gini / Inequality Index | 7,157 | 0.28 |
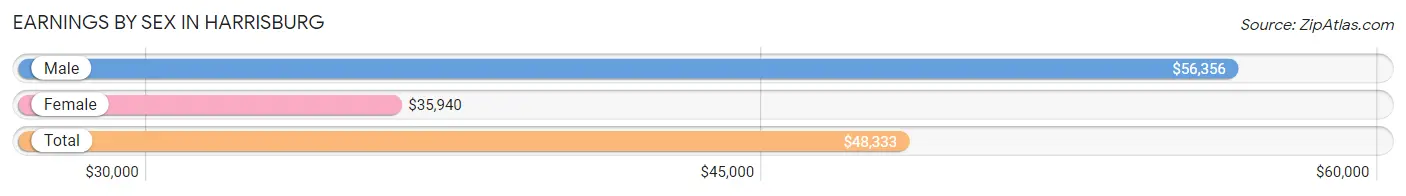
Earnings by Sex in Harrisburg
Average Earnings in Harrisburg are $48,333, $56,356 for men and $35,940 for women, a difference of 36.2%.
| Sex | Number | Average Earnings |
| Male | 2,230 (48.8%) | $56,356 |
| Female | 2,336 (51.2%) | $35,940 |
| Total | 4,566 (100.0%) | $48,333 |
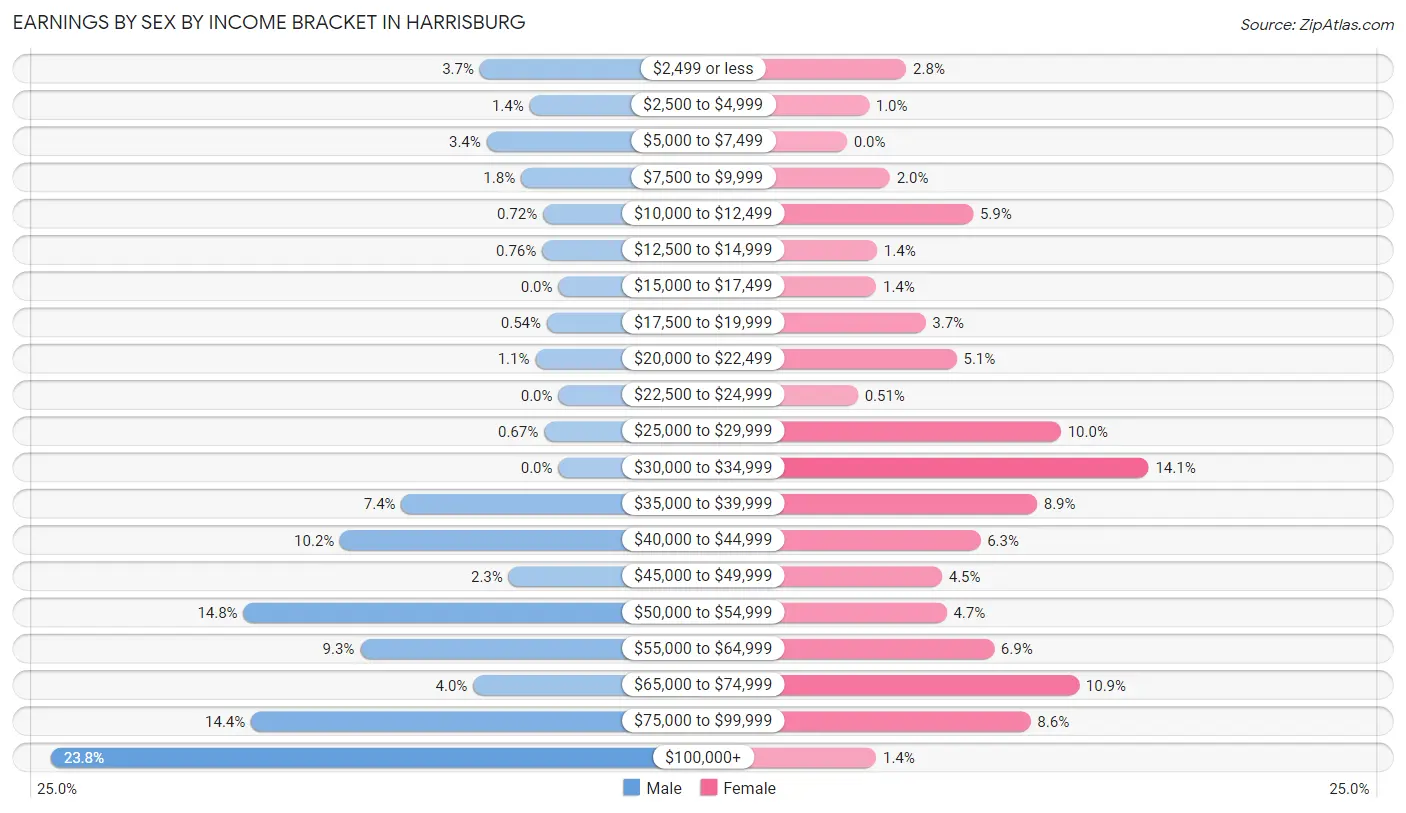
Earnings by Sex by Income Bracket in Harrisburg
The most common earnings brackets in Harrisburg are $100,000+ for men (530 | 23.8%) and $30,000 to $34,999 for women (330 | 14.1%).
| Income | Male | Female |
| $2,499 or less | 82 (3.7%) | 65 (2.8%) |
| $2,500 to $4,999 | 30 (1.3%) | 24 (1.0%) |
| $5,000 to $7,499 | 75 (3.4%) | 0 (0.0%) |
| $7,500 to $9,999 | 39 (1.8%) | 47 (2.0%) |
| $10,000 to $12,499 | 16 (0.7%) | 138 (5.9%) |
| $12,500 to $14,999 | 17 (0.8%) | 33 (1.4%) |
| $15,000 to $17,499 | 0 (0.0%) | 32 (1.4%) |
| $17,500 to $19,999 | 12 (0.5%) | 86 (3.7%) |
| $20,000 to $22,499 | 24 (1.1%) | 120 (5.1%) |
| $22,500 to $24,999 | 0 (0.0%) | 12 (0.5%) |
| $25,000 to $29,999 | 15 (0.7%) | 234 (10.0%) |
| $30,000 to $34,999 | 0 (0.0%) | 330 (14.1%) |
| $35,000 to $39,999 | 164 (7.3%) | 208 (8.9%) |
| $40,000 to $44,999 | 228 (10.2%) | 146 (6.2%) |
| $45,000 to $49,999 | 52 (2.3%) | 104 (4.4%) |
| $50,000 to $54,999 | 329 (14.7%) | 109 (4.7%) |
| $55,000 to $64,999 | 207 (9.3%) | 161 (6.9%) |
| $65,000 to $74,999 | 89 (4.0%) | 254 (10.9%) |
| $75,000 to $99,999 | 321 (14.4%) | 201 (8.6%) |
| $100,000+ | 530 (23.8%) | 32 (1.4%) |
| Total | 2,230 (100.0%) | 2,336 (100.0%) |
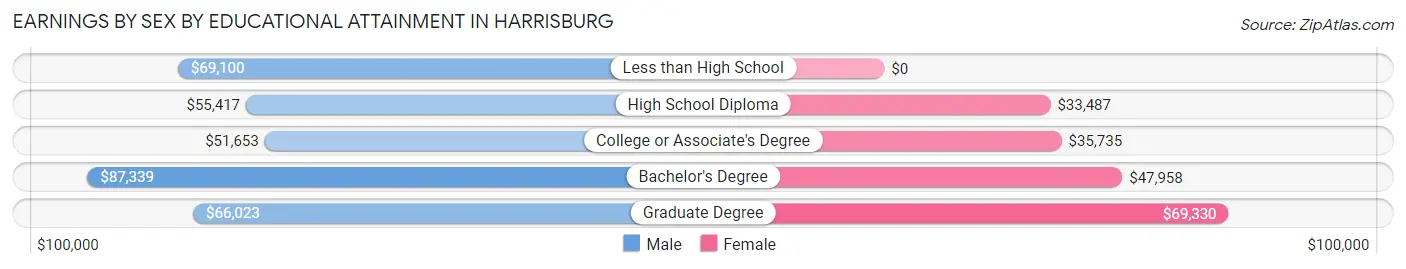
Earnings by Sex by Educational Attainment in Harrisburg
Average earnings in Harrisburg are $60,750 for men and $37,385 for women, a difference of 38.5%. Men with an educational attainment of bachelor's degree enjoy the highest average annual earnings of $87,339, while those with college or associate's degree education earn the least with $51,653. Women with an educational attainment of graduate degree earn the most with the average annual earnings of $69,330, while those with high school diploma education have the smallest earnings of $33,487.
| Educational Attainment | Male Income | Female Income |
| Less than High School | $69,100 | $0 |
| High School Diploma | $55,417 | $33,487 |
| College or Associate's Degree | $51,653 | $35,735 |
| Bachelor's Degree | $87,339 | $47,958 |
| Graduate Degree | $66,023 | $69,330 |
| Total | $60,750 | $37,385 |
Family Income in Harrisburg
Family Income Brackets in Harrisburg
According to the Harrisburg family income data, there are 554 families falling into the $150,000 to $199,999 income range, which is the most common income bracket and makes up 25.6% of all families.
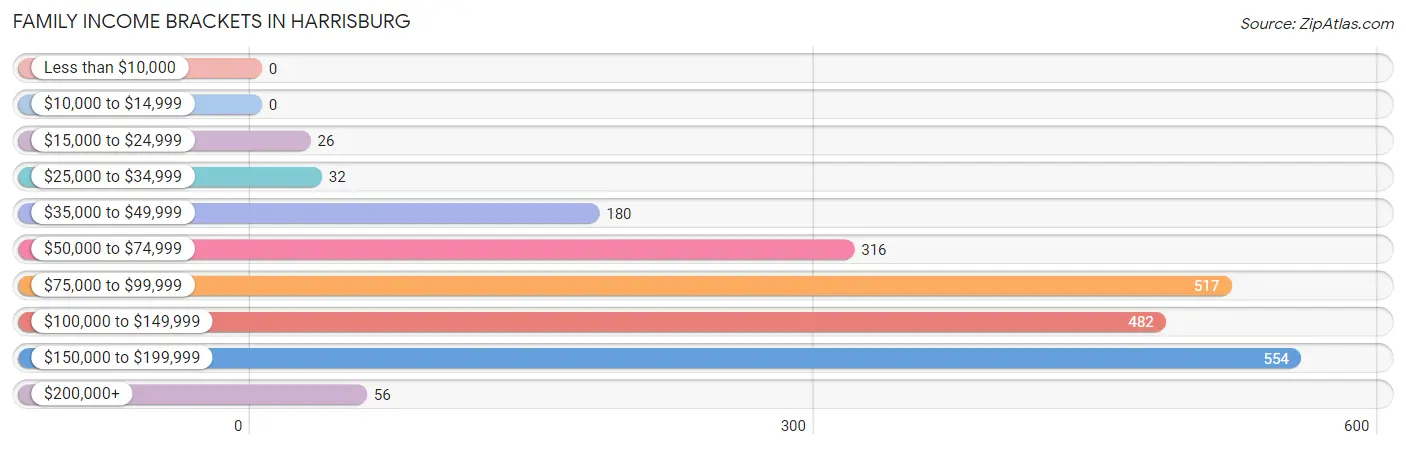
| Income Bracket | # Families | % Families |
| Less than $10,000 | 0 | 0.0% |
| $10,000 to $14,999 | 0 | 0.0% |
| $15,000 to $24,999 | 26 | 1.2% |
| $25,000 to $34,999 | 32 | 1.5% |
| $35,000 to $49,999 | 180 | 8.3% |
| $50,000 to $74,999 | 316 | 14.6% |
| $75,000 to $99,999 | 517 | 23.9% |
| $100,000 to $149,999 | 482 | 22.3% |
| $150,000 to $199,999 | 554 | 25.6% |
| $200,000+ | 56 | 2.6% |
Family Income by Famaliy Size in Harrisburg
5-person families (152 | 7.0%) account for the highest median family income in Harrisburg with $175,069 per family, while 2-person families (913 | 42.2%) have the highest median income of $43,590 per family member.
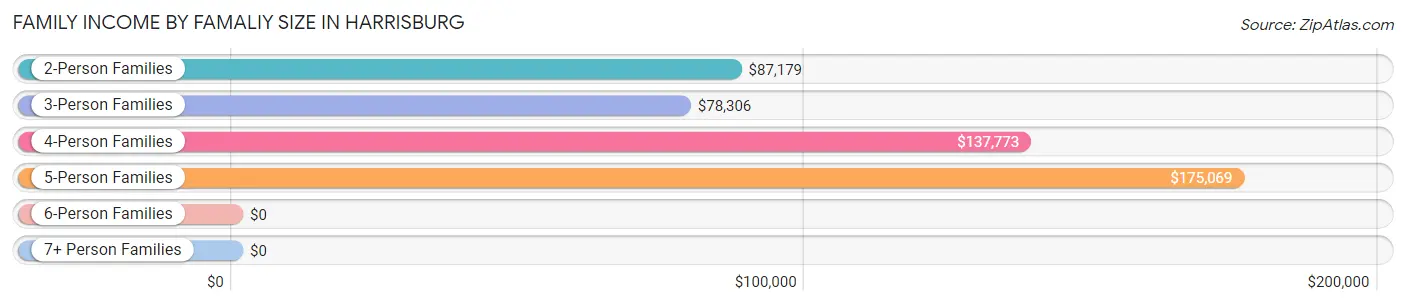
| Income Bracket | # Families | Median Income |
| 2-Person Families | 913 (42.2%) | $87,179 |
| 3-Person Families | 444 (20.5%) | $78,306 |
| 4-Person Families | 493 (22.8%) | $137,773 |
| 5-Person Families | 152 (7.0%) | $175,069 |
| 6-Person Families | 161 (7.4%) | $0 |
| 7+ Person Families | 0 (0.0%) | $0 |
| Total | 2,163 (100.0%) | $102,054 |
Family Income by Number of Earners in Harrisburg
The median family income in Harrisburg is $102,054, with families comprising 2 earners (1,534) having the highest median family income of $123,966, while families with no earners (82) have the lowest median family income of $46,111, accounting for 70.9% and 3.8% of families, respectively.
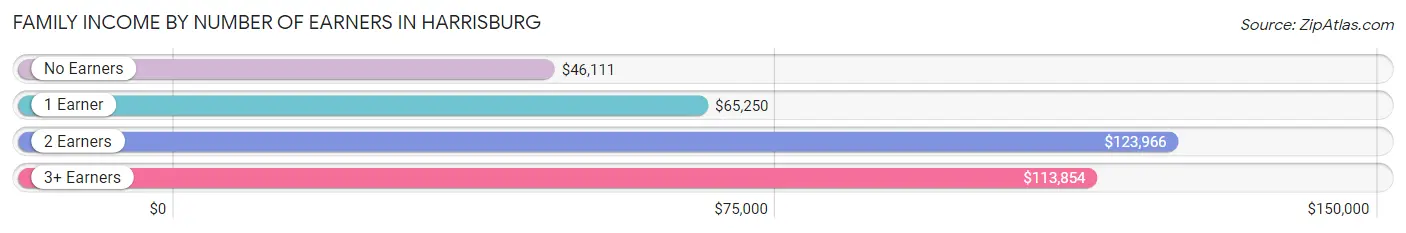
| Number of Earners | # Families | Median Income |
| No Earners | 82 (3.8%) | $46,111 |
| 1 Earner | 328 (15.2%) | $65,250 |
| 2 Earners | 1,534 (70.9%) | $123,966 |
| 3+ Earners | 219 (10.1%) | $113,854 |
| Total | 2,163 (100.0%) | $102,054 |
Household Income in Harrisburg
Household Income Brackets in Harrisburg
With 602 households falling in the category, the $150,000 to $199,999 income range is the most frequent in Harrisburg, accounting for 22.8% of all households.
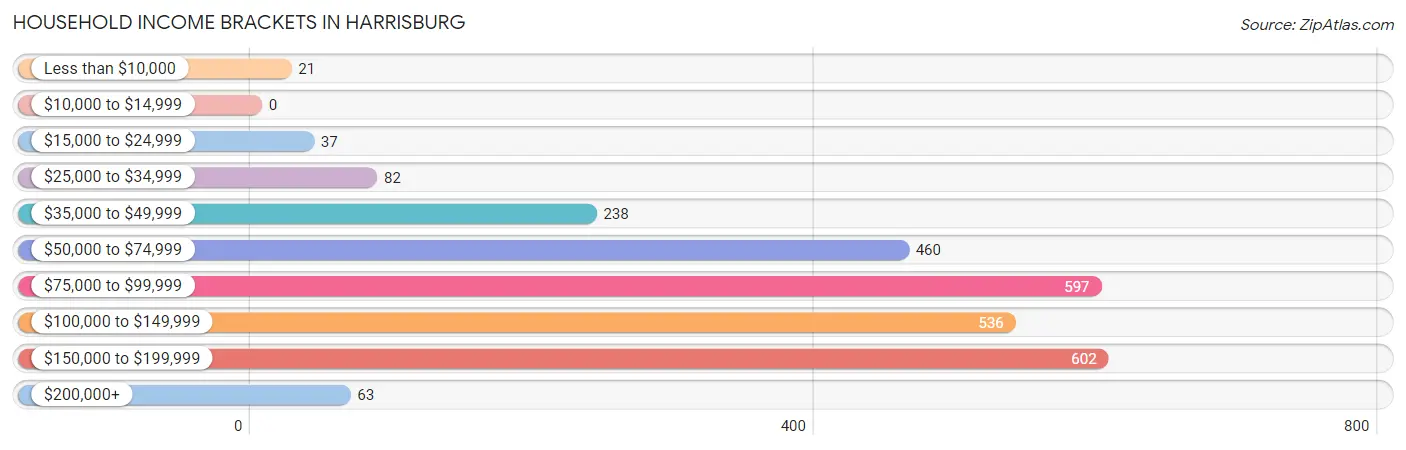
| Income Bracket | # Households | % Households |
| Less than $10,000 | 21 | 0.8% |
| $10,000 to $14,999 | 0 | 0.0% |
| $15,000 to $24,999 | 37 | 1.4% |
| $25,000 to $34,999 | 82 | 3.1% |
| $35,000 to $49,999 | 238 | 9.0% |
| $50,000 to $74,999 | 460 | 17.4% |
| $75,000 to $99,999 | 597 | 22.6% |
| $100,000 to $149,999 | 536 | 20.3% |
| $150,000 to $199,999 | 602 | 22.8% |
| $200,000+ | 63 | 2.4% |
Household Income by Householder Age in Harrisburg
The median household income in Harrisburg is $89,966, with the highest median household income of $111,905 found in the 45 to 64 years age bracket for the primary householder. A total of 850 households (32.2%) fall into this category. Meanwhile, the 15 to 24 years age bracket for the primary householder has the lowest median household income of $0, with 221 households (8.4%) in this group.
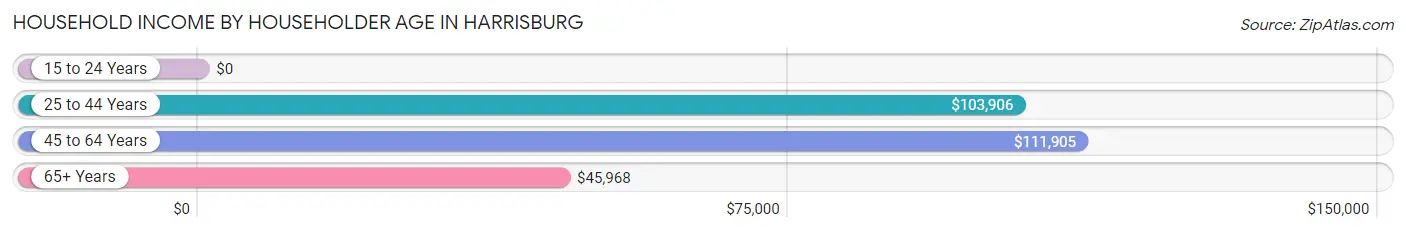
| Income Bracket | # Households | Median Income |
| 15 to 24 Years | 221 (8.4%) | $0 |
| 25 to 44 Years | 1,395 (52.8%) | $103,906 |
| 45 to 64 Years | 850 (32.2%) | $111,905 |
| 65+ Years | 176 (6.7%) | $45,968 |
| Total | 2,642 (100.0%) | $89,966 |
Poverty in Harrisburg
Income Below Poverty by Sex and Age in Harrisburg
With 2.3% poverty level for males and 2.3% for females among the residents of Harrisburg, 5 year old males and 45 to 54 year old females are the most vulnerable to poverty, with 15 males (22.4%) and 38 females (11.7%) in their respective age groups living below the poverty level.
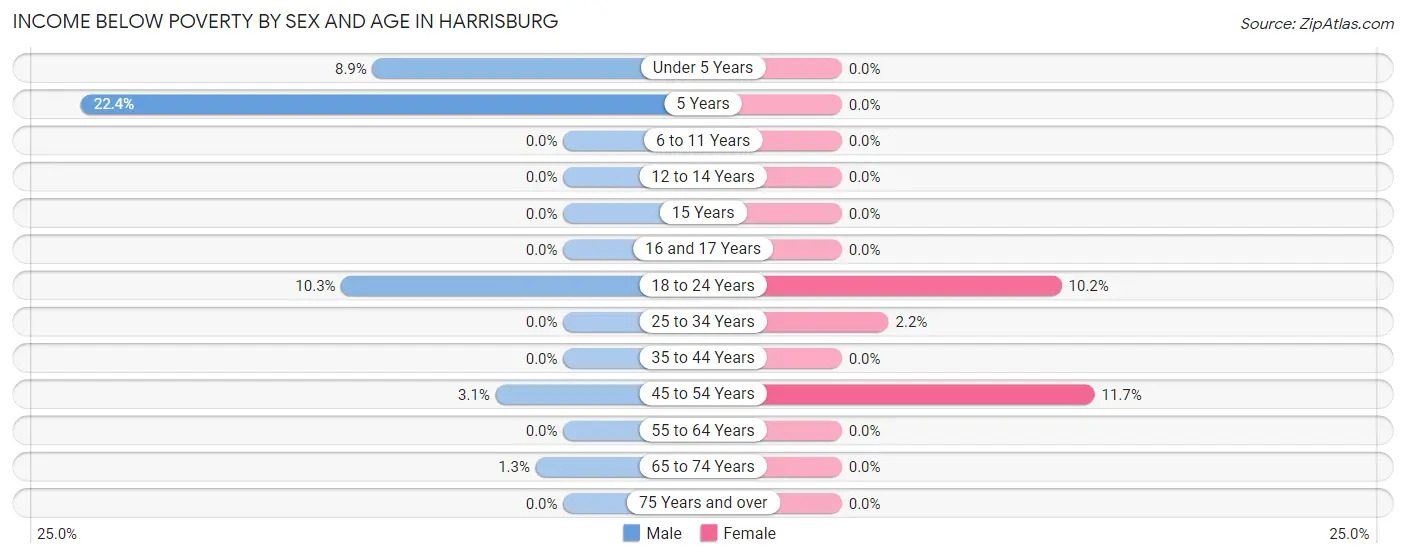
| Age Bracket | Male | Female |
| Under 5 Years | 33 (8.8%) | 0 (0.0%) |
| 5 Years | 15 (22.4%) | 0 (0.0%) |
| 6 to 11 Years | 0 (0.0%) | 0 (0.0%) |
| 12 to 14 Years | 0 (0.0%) | 0 (0.0%) |
| 15 Years | 0 (0.0%) | 0 (0.0%) |
| 16 and 17 Years | 0 (0.0%) | 0 (0.0%) |
| 18 to 24 Years | 17 (10.3%) | 25 (10.2%) |
| 25 to 34 Years | 0 (0.0%) | 17 (2.2%) |
| 35 to 44 Years | 0 (0.0%) | 0 (0.0%) |
| 45 to 54 Years | 16 (3.1%) | 38 (11.7%) |
| 55 to 64 Years | 0 (0.0%) | 0 (0.0%) |
| 65 to 74 Years | 1 (1.3%) | 0 (0.0%) |
| 75 Years and over | 0 (0.0%) | 0 (0.0%) |
| Total | 82 (2.3%) | 80 (2.3%) |
Income Above Poverty by Sex and Age in Harrisburg
According to the poverty statistics in Harrisburg, males aged 6 to 11 years and females aged under 5 years are the age groups that are most secure financially, with 100.0% of males and 100.0% of females in these age groups living above the poverty line.
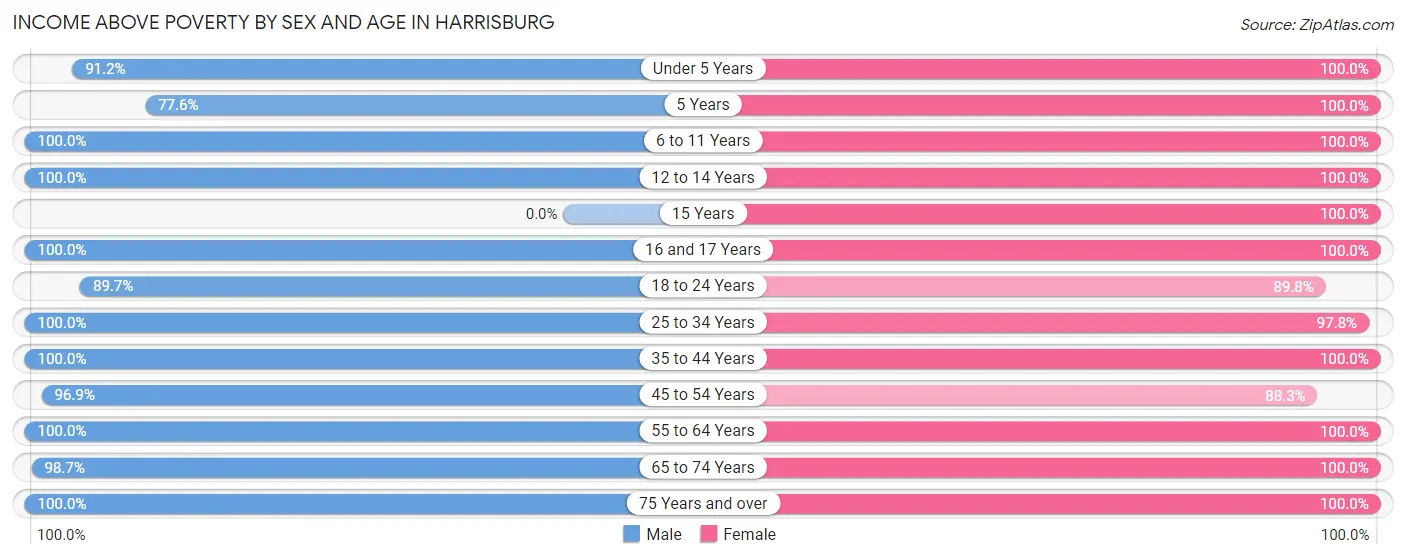
| Age Bracket | Male | Female |
| Under 5 Years | 340 (91.1%) | 214 (100.0%) |
| 5 Years | 52 (77.6%) | 38 (100.0%) |
| 6 to 11 Years | 539 (100.0%) | 398 (100.0%) |
| 12 to 14 Years | 175 (100.0%) | 386 (100.0%) |
| 15 Years | 0 (0.0%) | 86 (100.0%) |
| 16 and 17 Years | 87 (100.0%) | 16 (100.0%) |
| 18 to 24 Years | 148 (89.7%) | 220 (89.8%) |
| 25 to 34 Years | 677 (100.0%) | 767 (97.8%) |
| 35 to 44 Years | 726 (100.0%) | 590 (100.0%) |
| 45 to 54 Years | 494 (96.9%) | 286 (88.3%) |
| 55 to 64 Years | 172 (100.0%) | 320 (100.0%) |
| 65 to 74 Years | 77 (98.7%) | 108 (100.0%) |
| 75 Years and over | 54 (100.0%) | 25 (100.0%) |
| Total | 3,541 (97.7%) | 3,454 (97.7%) |
Income Below Poverty Among Married-Couple Families in Harrisburg
The poverty statistics for married-couple families in Harrisburg show that 0.9% or 16 of the total 1,773 families live below the poverty line. Families with 3 or 4 children have the highest poverty rate of 5.3%, comprising of 16 families. On the other hand, families with no children have the lowest poverty rate of 0.0%, which includes 0 families.
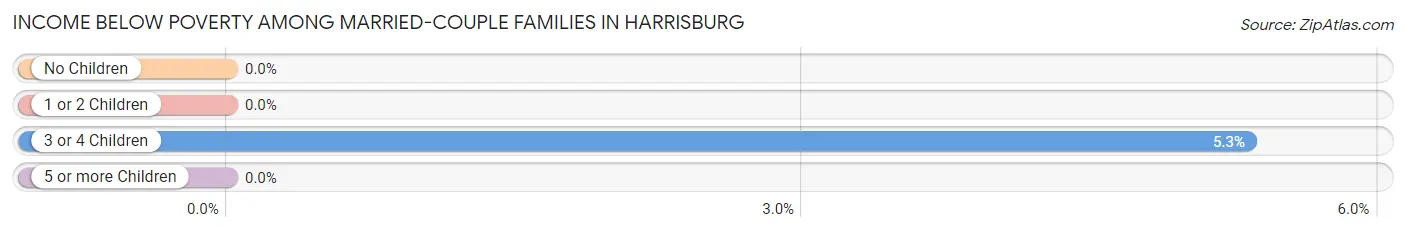
| Children | Above Poverty | Below Poverty |
| No Children | 720 (100.0%) | 0 (0.0%) |
| 1 or 2 Children | 752 (100.0%) | 0 (0.0%) |
| 3 or 4 Children | 285 (94.7%) | 16 (5.3%) |
| 5 or more Children | 0 (0.0%) | 0 (0.0%) |
| Total | 1,757 (99.1%) | 16 (0.9%) |
Income Below Poverty Among Single-Parent Households in Harrisburg
| Children | Single Father | Single Mother |
| No Children | 0 (0.0%) | 0 (0.0%) |
| 1 or 2 Children | 0 (0.0%) | 0 (0.0%) |
| 3 or 4 Children | 0 (0.0%) | 0 (0.0%) |
| 5 or more Children | 0 (0.0%) | 0 (0.0%) |
| Total | 0 (0.0%) | 0 (0.0%) |
Income Below Poverty Among Married-Couple vs Single-Parent Households in Harrisburg
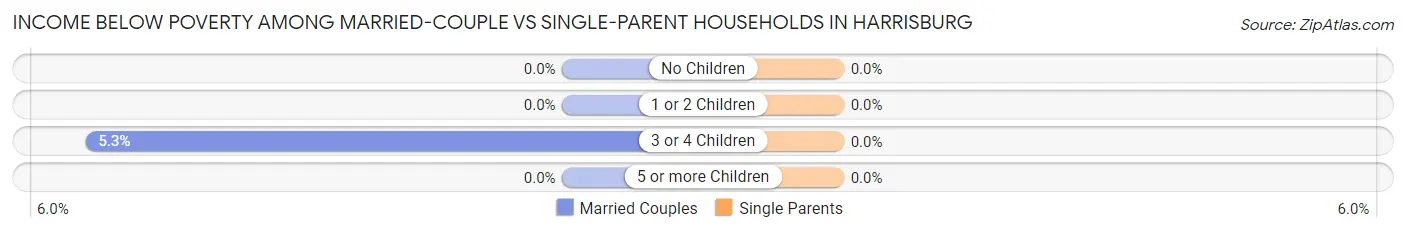
| Children | Married-Couple Families | Single-Parent Households |
| No Children | 0 (0.0%) | 0 (0.0%) |
| 1 or 2 Children | 0 (0.0%) | 0 (0.0%) |
| 3 or 4 Children | 16 (5.3%) | 0 (0.0%) |
| 5 or more Children | 0 (0.0%) | 0 (0.0%) |
| Total | 16 (0.9%) | 0 (0.0%) |
Race in Harrisburg
The most populous races in Harrisburg are White / Caucasian (6,699 | 93.6%), Two or more Races (344 | 4.8%), and Hispanic or Latino (197 | 2.8%).
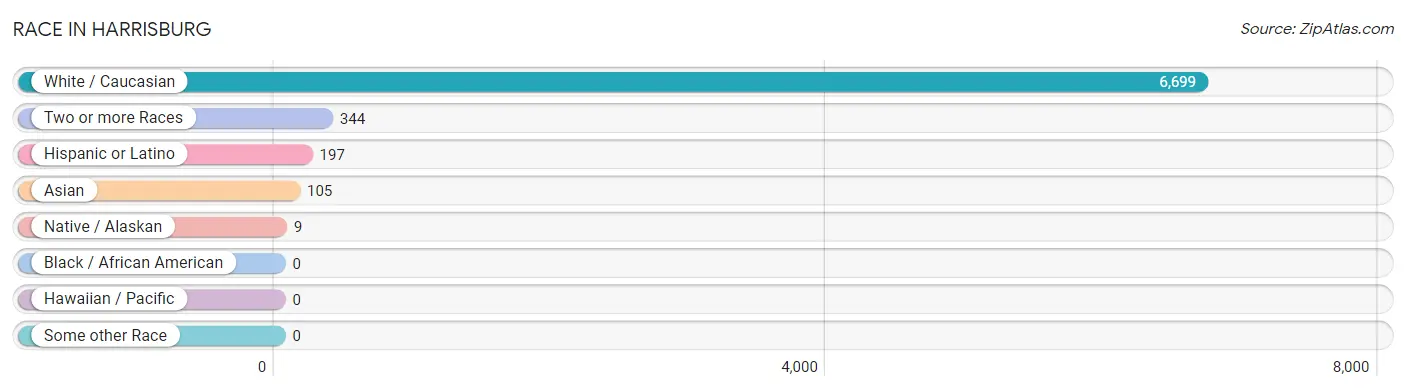
| Race | # Population | % Population |
| Asian | 105 | 1.5% |
| Black / African American | 0 | 0.0% |
| Hawaiian / Pacific | 0 | 0.0% |
| Hispanic or Latino | 197 | 2.8% |
| Native / Alaskan | 9 | 0.1% |
| White / Caucasian | 6,699 | 93.6% |
| Two or more Races | 344 | 4.8% |
| Some other Race | 0 | 0.0% |
| Total | 7,157 | 100.0% |
Ancestry in Harrisburg
The most populous ancestries reported in Harrisburg are German (2,348 | 32.8%), Norwegian (688 | 9.6%), English (677 | 9.5%), Dutch (667 | 9.3%), and Irish (667 | 9.3%), together accounting for 70.5% of all Harrisburg residents.
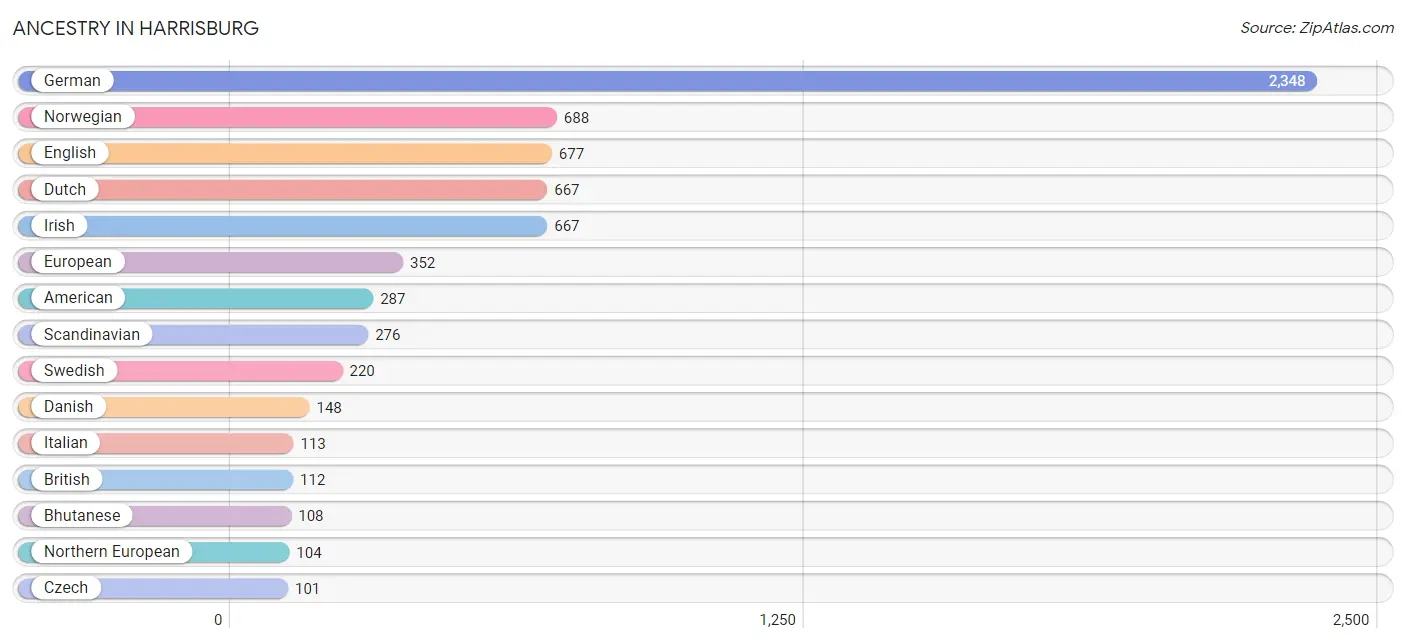
| Ancestry | # Population | % Population |
| American | 287 | 4.0% |
| Belgian | 39 | 0.5% |
| Bhutanese | 108 | 1.5% |
| British | 112 | 1.6% |
| Chilean | 73 | 1.0% |
| Cuban | 30 | 0.4% |
| Czech | 101 | 1.4% |
| Danish | 148 | 2.1% |
| Dutch | 667 | 9.3% |
| English | 677 | 9.5% |
| European | 352 | 4.9% |
| Finnish | 97 | 1.4% |
| French | 101 | 1.4% |
| German | 2,348 | 32.8% |
| Indian (Asian) | 19 | 0.3% |
| Irish | 667 | 9.3% |
| Italian | 113 | 1.6% |
| Mexican | 18 | 0.3% |
| Native Hawaiian | 66 | 0.9% |
| Northern European | 104 | 1.5% |
| Norwegian | 688 | 9.6% |
| Polish | 14 | 0.2% |
| Romanian | 18 | 0.3% |
| Russian | 44 | 0.6% |
| Scandinavian | 276 | 3.9% |
| Scotch-Irish | 25 | 0.4% |
| Sioux | 51 | 0.7% |
| South American | 73 | 1.0% |
| Sri Lankan | 12 | 0.2% |
| Swedish | 220 | 3.1% |
| Welsh | 14 | 0.2% |
| Yugoslavian | 17 | 0.2% | View All 32 Rows |
Immigrants in Harrisburg
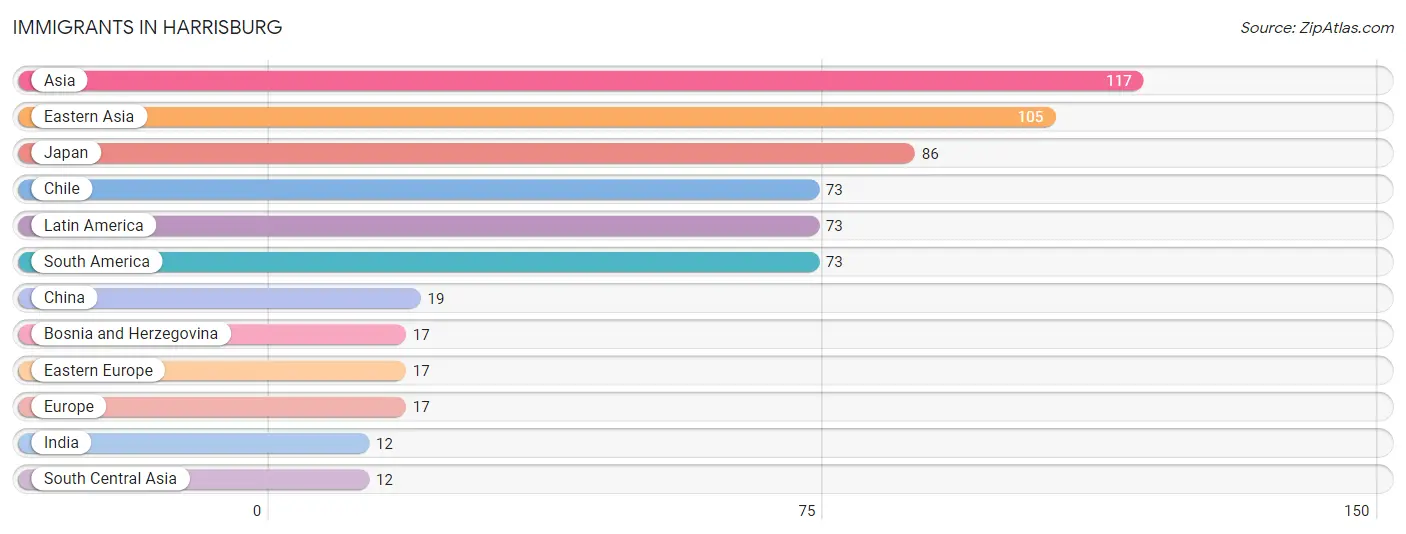
The most numerous immigrant groups reported in Harrisburg came from Asia (117 | 1.6%), Eastern Asia (105 | 1.5%), Japan (86 | 1.2%), Chile (73 | 1.0%), and Latin America (73 | 1.0%), together accounting for 6.3% of all Harrisburg residents.
| Immigration Origin | # Population | % Population |
| Asia | 117 | 1.6% |
| Bosnia and Herzegovina | 17 | 0.2% |
| Chile | 73 | 1.0% |
| China | 19 | 0.3% |
| Eastern Asia | 105 | 1.5% |
| Eastern Europe | 17 | 0.2% |
| Europe | 17 | 0.2% |
| India | 12 | 0.2% |
| Japan | 86 | 1.2% |
| Latin America | 73 | 1.0% |
| South America | 73 | 1.0% |
| South Central Asia | 12 | 0.2% | View All 12 Rows |
Sex and Age in Harrisburg
Sex and Age in Harrisburg
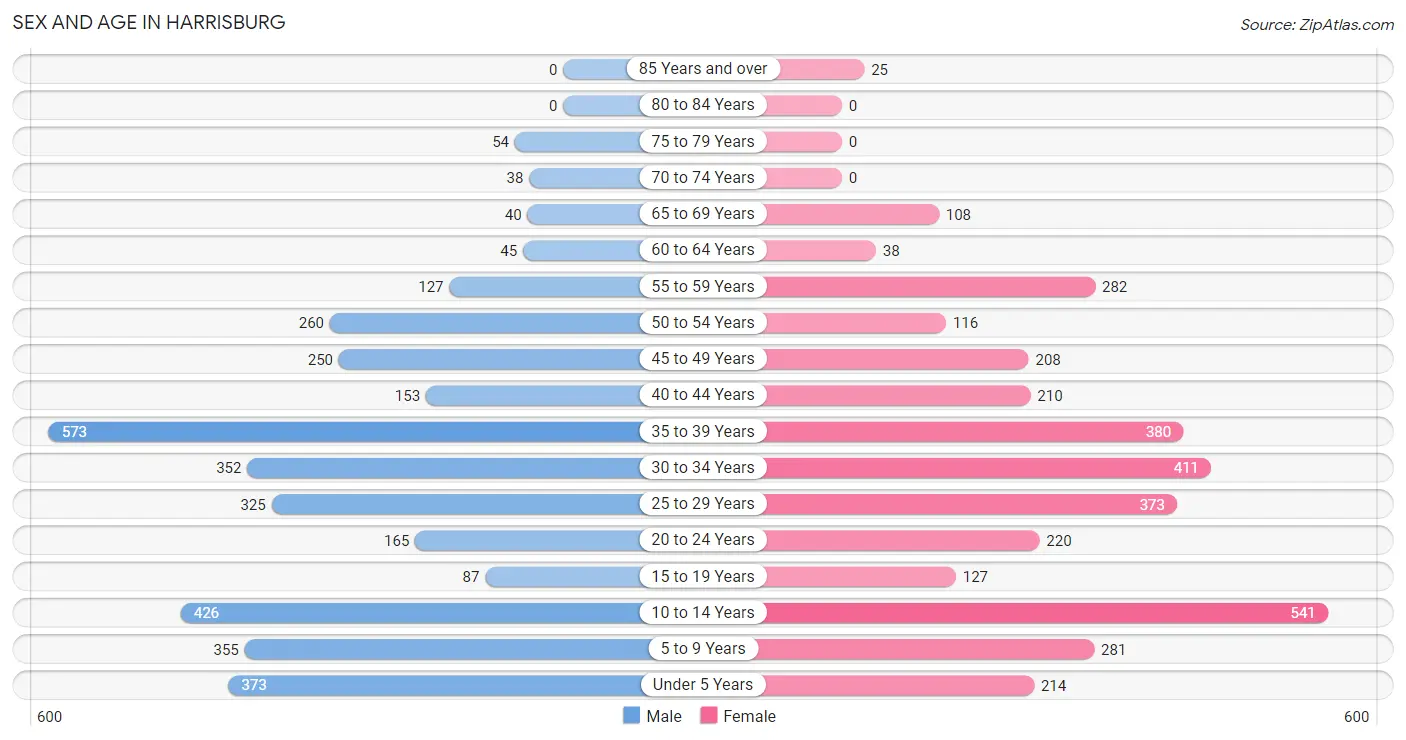
The most populous age groups in Harrisburg are 35 to 39 Years (573 | 15.8%) for men and 10 to 14 Years (541 | 15.3%) for women.
| Age Bracket | Male | Female |
| Under 5 Years | 373 (10.3%) | 214 (6.1%) |
| 5 to 9 Years | 355 (9.8%) | 281 (8.0%) |
| 10 to 14 Years | 426 (11.8%) | 541 (15.3%) |
| 15 to 19 Years | 87 (2.4%) | 127 (3.6%) |
| 20 to 24 Years | 165 (4.5%) | 220 (6.2%) |
| 25 to 29 Years | 325 (9.0%) | 373 (10.5%) |
| 30 to 34 Years | 352 (9.7%) | 411 (11.6%) |
| 35 to 39 Years | 573 (15.8%) | 380 (10.7%) |
| 40 to 44 Years | 153 (4.2%) | 210 (5.9%) |
| 45 to 49 Years | 250 (6.9%) | 208 (5.9%) |
| 50 to 54 Years | 260 (7.2%) | 116 (3.3%) |
| 55 to 59 Years | 127 (3.5%) | 282 (8.0%) |
| 60 to 64 Years | 45 (1.2%) | 38 (1.1%) |
| 65 to 69 Years | 40 (1.1%) | 108 (3.1%) |
| 70 to 74 Years | 38 (1.1%) | 0 (0.0%) |
| 75 to 79 Years | 54 (1.5%) | 0 (0.0%) |
| 80 to 84 Years | 0 (0.0%) | 0 (0.0%) |
| 85 Years and over | 0 (0.0%) | 25 (0.7%) |
| Total | 3,623 (100.0%) | 3,534 (100.0%) |
Families and Households in Harrisburg
Median Family Size in Harrisburg
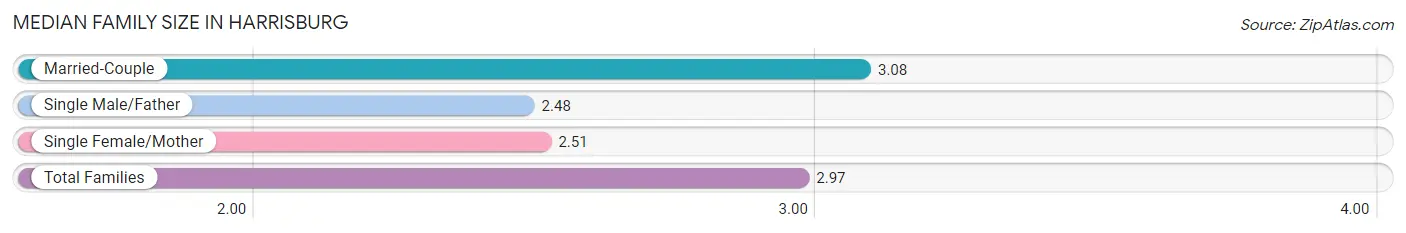
The median family size in Harrisburg is 2.97 persons per family, with married-couple families (1,773 | 82.0%) accounting for the largest median family size of 3.08 persons per family. On the other hand, single male/father families (115 | 5.3%) represent the smallest median family size with 2.48 persons per family.
| Family Type | # Families | Family Size |
| Married-Couple | 1,773 (82.0%) | 3.08 |
| Single Male/Father | 115 (5.3%) | 2.48 |
| Single Female/Mother | 275 (12.7%) | 2.51 |
| Total Families | 2,163 (100.0%) | 2.97 |
Median Household Size in Harrisburg
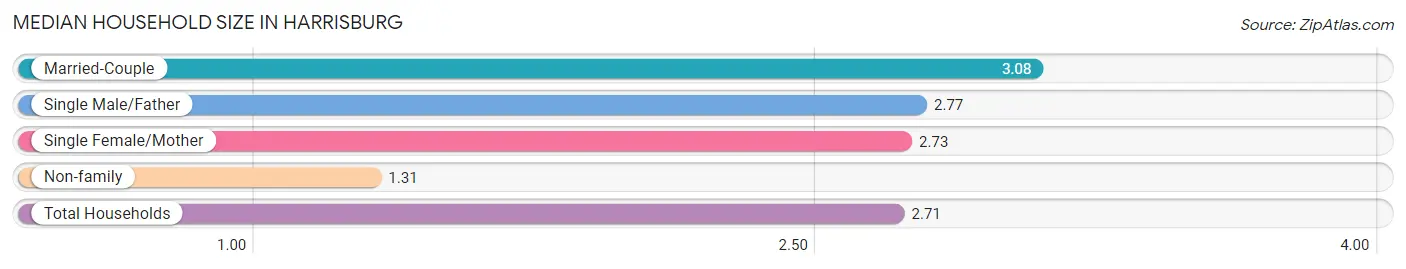
The median household size in Harrisburg is 2.71 persons per household, with married-couple households (1,773 | 67.1%) accounting for the largest median household size of 3.08 persons per household. non-family households (479 | 18.1%) represent the smallest median household size with 1.31 persons per household.
| Household Type | # Households | Household Size |
| Married-Couple | 1,773 (67.1%) | 3.08 |
| Single Male/Father | 115 (4.3%) | 2.77 |
| Single Female/Mother | 275 (10.4%) | 2.73 |
| Non-family | 479 (18.1%) | 1.31 |
| Total Households | 2,642 (100.0%) | 2.71 |
Household Size by Marriage Status in Harrisburg
Out of a total of 2,642 households in Harrisburg, 2,163 (81.9%) are family households, while 479 (18.1%) are nonfamily households. The most numerous type of family households are 2-person households, comprising 868, and the most common type of nonfamily households are 1-person households, comprising 370.
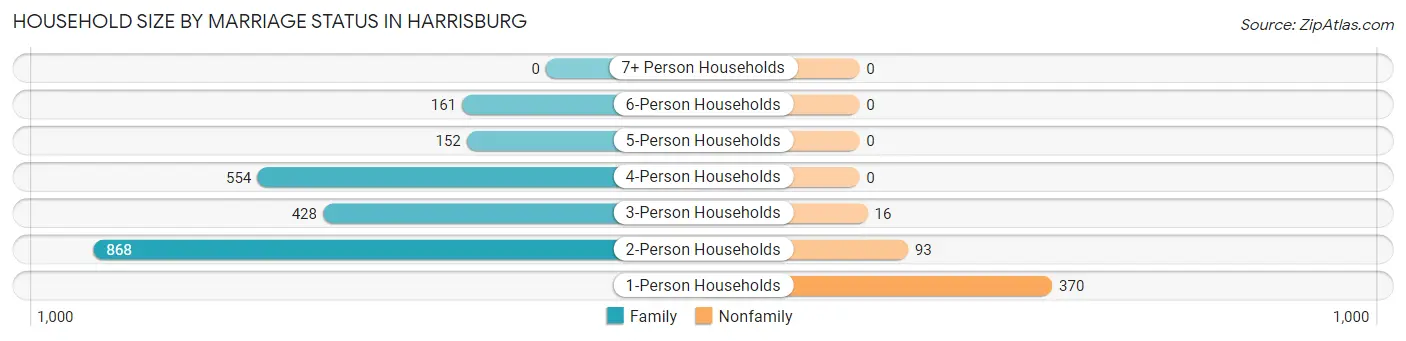
| Household Size | Family Households | Nonfamily Households |
| 1-Person Households | - | 370 (14.0%) |
| 2-Person Households | 868 (32.9%) | 93 (3.5%) |
| 3-Person Households | 428 (16.2%) | 16 (0.6%) |
| 4-Person Households | 554 (21.0%) | 0 (0.0%) |
| 5-Person Households | 152 (5.8%) | 0 (0.0%) |
| 6-Person Households | 161 (6.1%) | 0 (0.0%) |
| 7+ Person Households | 0 (0.0%) | 0 (0.0%) |
| Total | 2,163 (81.9%) | 479 (18.1%) |
Female Fertility in Harrisburg
Fertility by Age in Harrisburg
Average fertility rate in Harrisburg is 123.0 births per 1,000 women. Women in the age bracket of 20 to 34 years have the highest fertility rate with 209.0 births per 1,000 women. Women in the age bracket of 20 to 34 years acount for 87.9% of all women with births.
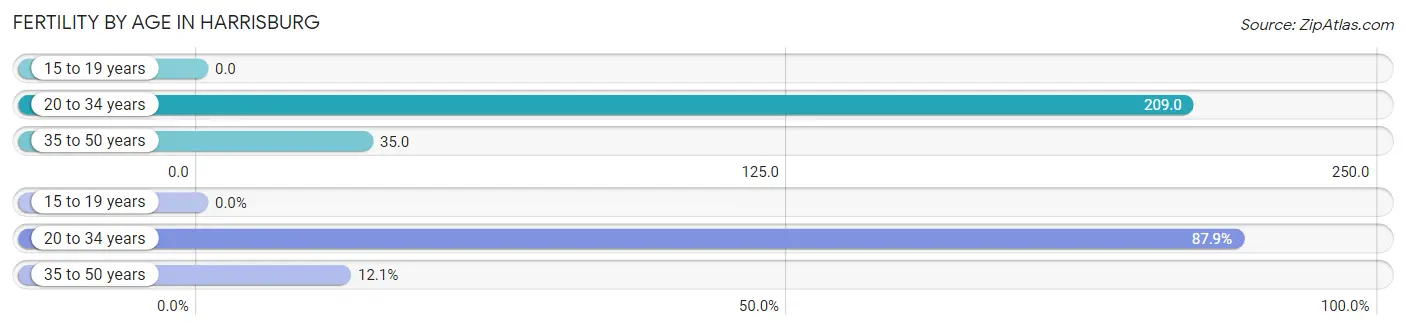
| Age Bracket | Women with Births | Births / 1,000 Women |
| 15 to 19 years | 0 (0.0%) | 0.0 |
| 20 to 34 years | 210 (87.9%) | 209.0 |
| 35 to 50 years | 29 (12.1%) | 35.0 |
| Total | 239 (100.0%) | 123.0 |
Fertility by Age by Marriage Status in Harrisburg
67.8% of women with births (239) in Harrisburg are married. The highest percentage of unmarried women with births falls into 20 to 34 years age bracket with 36.7% of them unmarried at the time of birth, while the lowest percentage of unmarried women with births belong to 35 to 50 years age bracket with 0.0% of them unmarried.
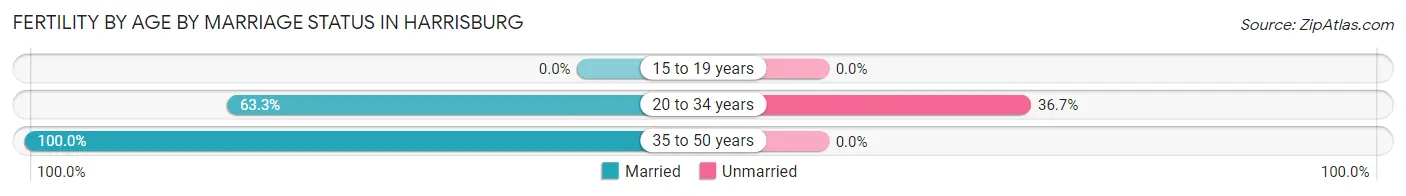
| Age Bracket | Married | Unmarried |
| 15 to 19 years | 0 (0.0%) | 0 (0.0%) |
| 20 to 34 years | 133 (63.3%) | 77 (36.7%) |
| 35 to 50 years | 29 (100.0%) | 0 (0.0%) |
| Total | 162 (67.8%) | 77 (32.2%) |
Fertility by Education in Harrisburg
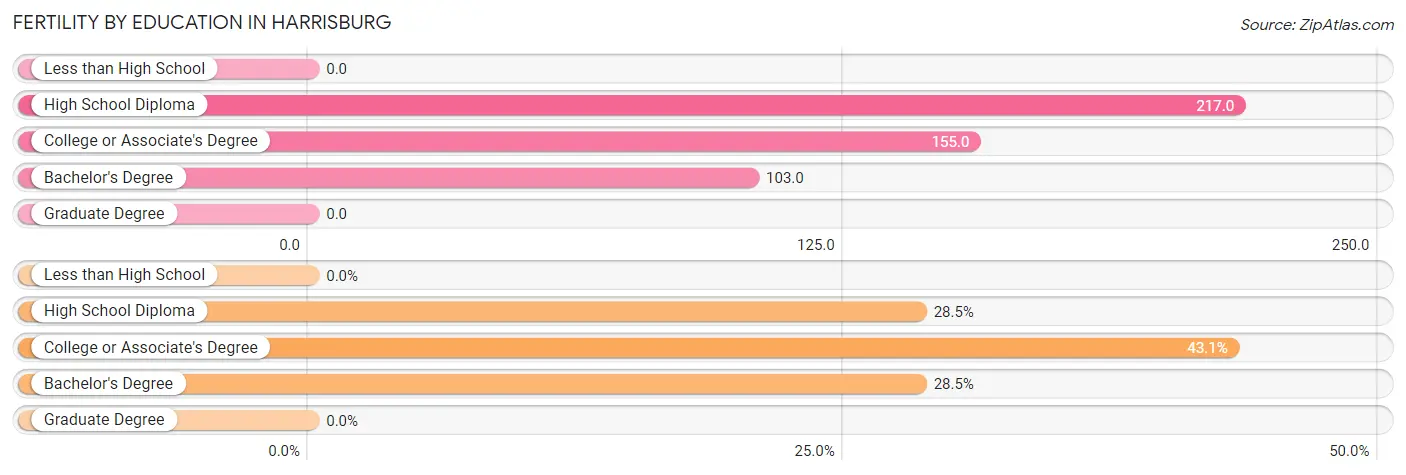
| Educational Attainment | Women with Births | Births / 1,000 Women |
| Less than High School | 0 (0.0%) | 0.0 |
| High School Diploma | 68 (28.4%) | 217.0 |
| College or Associate's Degree | 103 (43.1%) | 155.0 |
| Bachelor's Degree | 68 (28.4%) | 103.0 |
| Graduate Degree | 0 (0.0%) | 0.0 |
| Total | 239 (100.0%) | 123.0 |
Fertility by Education by Marriage Status in Harrisburg
32.2% of women with births in Harrisburg are unmarried. Women with the educational attainment of college or associate's degree are most likely to be married with 79.6% of them married at childbirth, while women with the educational attainment of high school diploma are least likely to be married with 57.4% of them unmarried at childbirth.
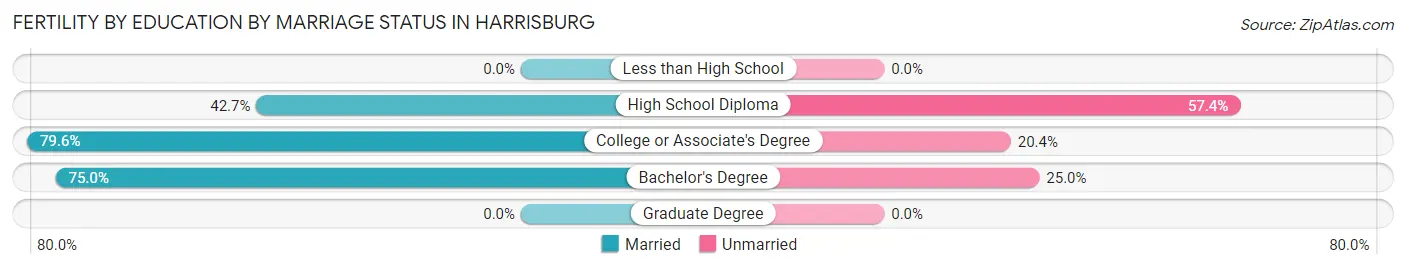
| Educational Attainment | Married | Unmarried |
| Less than High School | 0 (0.0%) | 0 (0.0%) |
| High School Diploma | 29 (42.6%) | 39 (57.4%) |
| College or Associate's Degree | 82 (79.6%) | 21 (20.4%) |
| Bachelor's Degree | 51 (75.0%) | 17 (25.0%) |
| Graduate Degree | 0 (0.0%) | 0 (0.0%) |
| Total | 162 (67.8%) | 77 (32.2%) |
Employment Characteristics in Harrisburg
Employment by Class of Employer in Harrisburg
Among the 4,179 employed individuals in Harrisburg, private company employees (2,611 | 62.5%), not-for-profit organizations (637 | 15.2%), and self-employed (incorporated) (342 | 8.2%) make up the most common classes of employment.
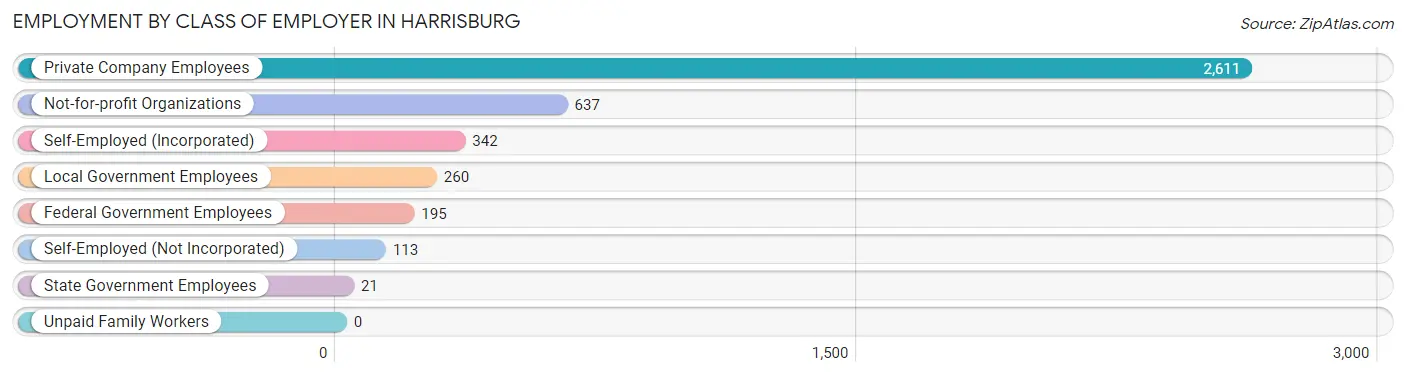
| Employer Class | # Employees | % Employees |
| Private Company Employees | 2,611 | 62.5% |
| Self-Employed (Incorporated) | 342 | 8.2% |
| Self-Employed (Not Incorporated) | 113 | 2.7% |
| Not-for-profit Organizations | 637 | 15.2% |
| Local Government Employees | 260 | 6.2% |
| State Government Employees | 21 | 0.5% |
| Federal Government Employees | 195 | 4.7% |
| Unpaid Family Workers | 0 | 0.0% |
| Total | 4,179 | 100.0% |
Employment Status by Age in Harrisburg
According to the labor force statistics for Harrisburg, out of the total population over 16 years of age (4,881), 88.5% or 4,320 individuals are in the labor force, with 0.8% or 35 of them unemployed. The age group with the highest labor force participation rate is 20 to 24 years, with 100.0% or 385 individuals in the labor force. Within the labor force, the 55 to 59 years age range has the highest percentage of unemployed individuals, with 6.5% or 26 of them being unemployed.
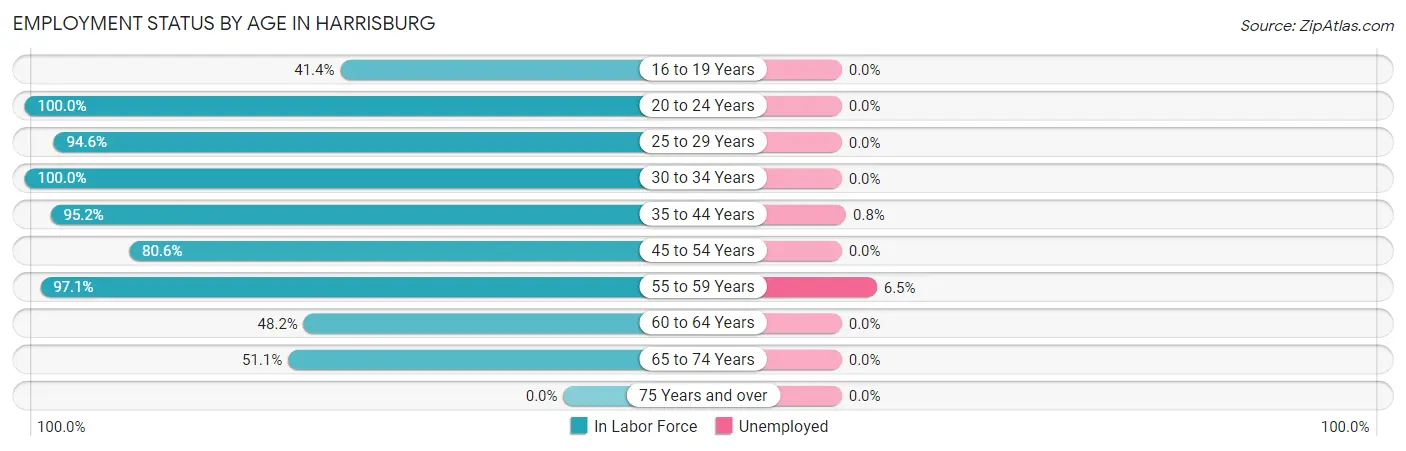
| Age Bracket | In Labor Force | Unemployed |
| 16 to 19 Years | 53 (41.4%) | 0 (0.0%) |
| 20 to 24 Years | 385 (100.0%) | 0 (0.0%) |
| 25 to 29 Years | 660 (94.6%) | 0 (0.0%) |
| 30 to 34 Years | 763 (100.0%) | 0 (0.0%) |
| 35 to 44 Years | 1,253 (95.2%) | 10 (0.8%) |
| 45 to 54 Years | 672 (80.6%) | 0 (0.0%) |
| 55 to 59 Years | 397 (97.1%) | 26 (6.5%) |
| 60 to 64 Years | 40 (48.2%) | 0 (0.0%) |
| 65 to 74 Years | 95 (51.1%) | 0 (0.0%) |
| 75 Years and over | 0 (0.0%) | 0 (0.0%) |
| Total | 4,320 (88.5%) | 35 (0.8%) |
Employment Status by Educational Attainment in Harrisburg
According to labor force statistics for Harrisburg, 92.2% of individuals (3,783) out of the total population between 25 and 64 years of age (4,103) are in the labor force, with 1.0% or 38 of them being unemployed. The group with the highest labor force participation rate are those with the educational attainment of less than high school, with 100.0% or 93 individuals in the labor force. Within the labor force, individuals with college / associate degree education have the highest percentage of unemployment, with 2.1% or 26 of them being unemployed.
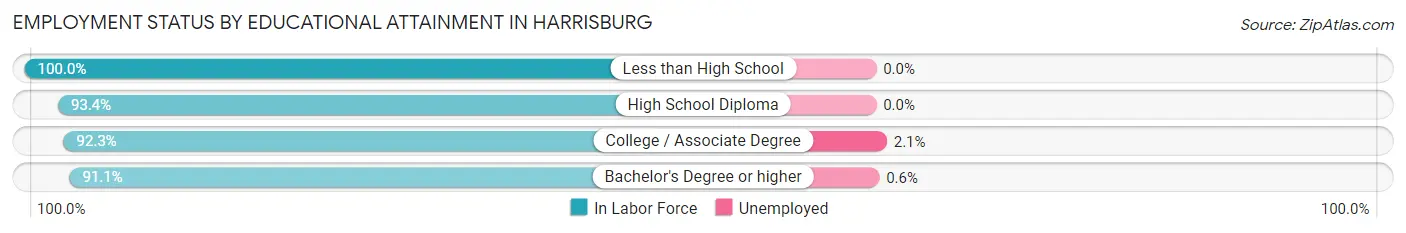
| Educational Attainment | In Labor Force | Unemployed |
| Less than High School | 93 (100.0%) | 0 (0.0%) |
| High School Diploma | 882 (93.4%) | 0 (0.0%) |
| College / Associate Degree | 1,257 (92.3%) | 29 (2.1%) |
| Bachelor's Degree or higher | 1,552 (91.1%) | 10 (0.6%) |
| Total | 3,783 (92.2%) | 41 (1.0%) |
Employment Occupations by Sex in Harrisburg
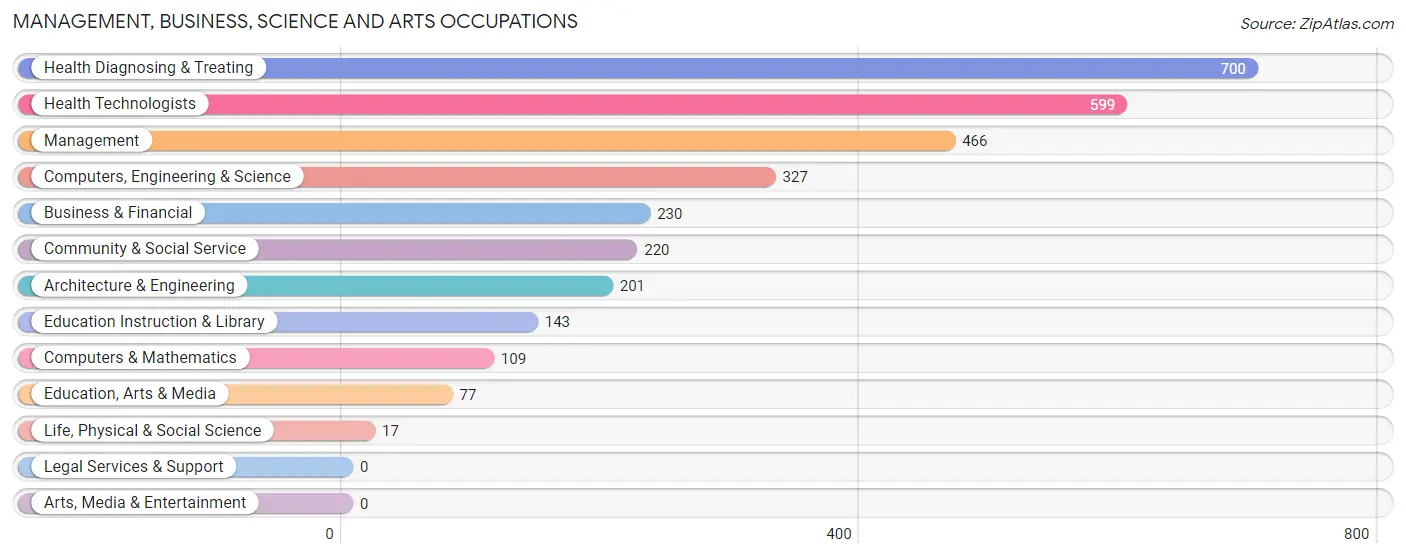
Management, Business, Science and Arts Occupations
The most common Management, Business, Science and Arts occupations in Harrisburg are Health Diagnosing & Treating (700 | 16.4%), Health Technologists (599 | 14.0%), Management (466 | 10.9%), Computers, Engineering & Science (327 | 7.6%), and Business & Financial (230 | 5.4%).
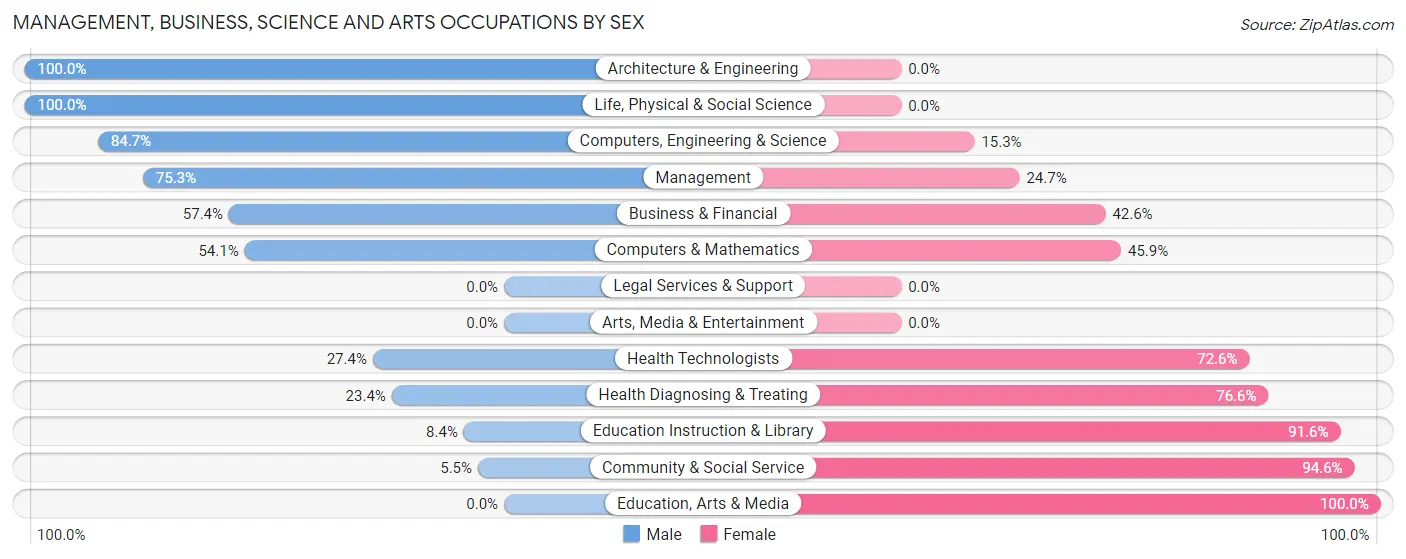
Management, Business, Science and Arts Occupations by Sex
Within the Management, Business, Science and Arts occupations in Harrisburg, the most male-oriented occupations are Architecture & Engineering (100.0%), Life, Physical & Social Science (100.0%), and Computers, Engineering & Science (84.7%), while the most female-oriented occupations are Education, Arts & Media (100.0%), Community & Social Service (94.6%), and Education Instruction & Library (91.6%).
| Occupation | Male | Female |
| Management | 351 (75.3%) | 115 (24.7%) |
| Business & Financial | 132 (57.4%) | 98 (42.6%) |
| Computers, Engineering & Science | 277 (84.7%) | 50 (15.3%) |
| Computers & Mathematics | 59 (54.1%) | 50 (45.9%) |
| Architecture & Engineering | 201 (100.0%) | 0 (0.0%) |
| Life, Physical & Social Science | 17 (100.0%) | 0 (0.0%) |
| Community & Social Service | 12 (5.4%) | 208 (94.6%) |
| Education, Arts & Media | 0 (0.0%) | 77 (100.0%) |
| Legal Services & Support | 0 (0.0%) | 0 (0.0%) |
| Education Instruction & Library | 12 (8.4%) | 131 (91.6%) |
| Arts, Media & Entertainment | 0 (0.0%) | 0 (0.0%) |
| Health Diagnosing & Treating | 164 (23.4%) | 536 (76.6%) |
| Health Technologists | 164 (27.4%) | 435 (72.6%) |
| Total (Category) | 936 (48.2%) | 1,007 (51.8%) |
| Total (Overall) | 2,022 (47.2%) | 2,260 (52.8%) |
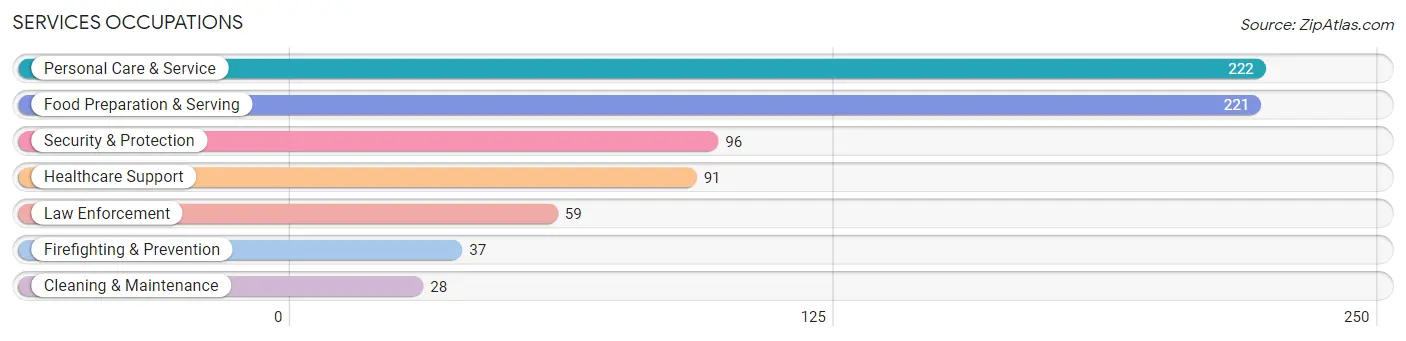
Services Occupations
The most common Services occupations in Harrisburg are Personal Care & Service (222 | 5.2%), Food Preparation & Serving (221 | 5.2%), Security & Protection (96 | 2.2%), Healthcare Support (91 | 2.1%), and Law Enforcement (59 | 1.4%).
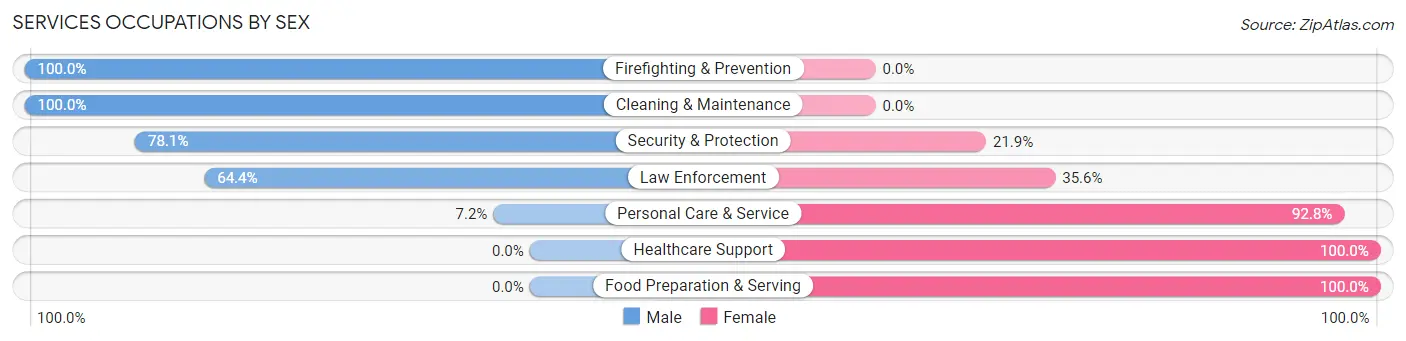
Services Occupations by Sex
Within the Services occupations in Harrisburg, the most male-oriented occupations are Firefighting & Prevention (100.0%), Cleaning & Maintenance (100.0%), and Security & Protection (78.1%), while the most female-oriented occupations are Healthcare Support (100.0%), Food Preparation & Serving (100.0%), and Personal Care & Service (92.8%).
| Occupation | Male | Female |
| Healthcare Support | 0 (0.0%) | 91 (100.0%) |
| Security & Protection | 75 (78.1%) | 21 (21.9%) |
| Firefighting & Prevention | 37 (100.0%) | 0 (0.0%) |
| Law Enforcement | 38 (64.4%) | 21 (35.6%) |
| Food Preparation & Serving | 0 (0.0%) | 221 (100.0%) |
| Cleaning & Maintenance | 28 (100.0%) | 0 (0.0%) |
| Personal Care & Service | 16 (7.2%) | 206 (92.8%) |
| Total (Category) | 119 (18.1%) | 539 (81.9%) |
| Total (Overall) | 2,022 (47.2%) | 2,260 (52.8%) |
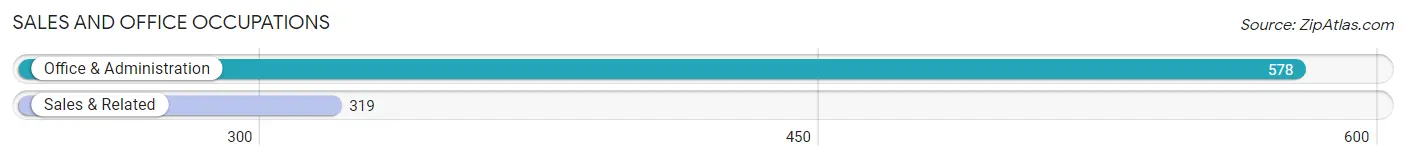
Sales and Office Occupations
The most common Sales and Office occupations in Harrisburg are Office & Administration (578 | 13.5%), and Sales & Related (319 | 7.4%).
Sales and Office Occupations by Sex
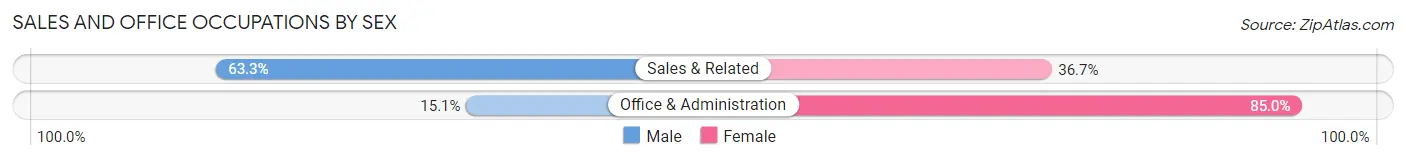
| Occupation | Male | Female |
| Sales & Related | 202 (63.3%) | 117 (36.7%) |
| Office & Administration | 87 (15.0%) | 491 (85.0%) |
| Total (Category) | 289 (32.2%) | 608 (67.8%) |
| Total (Overall) | 2,022 (47.2%) | 2,260 (52.8%) |
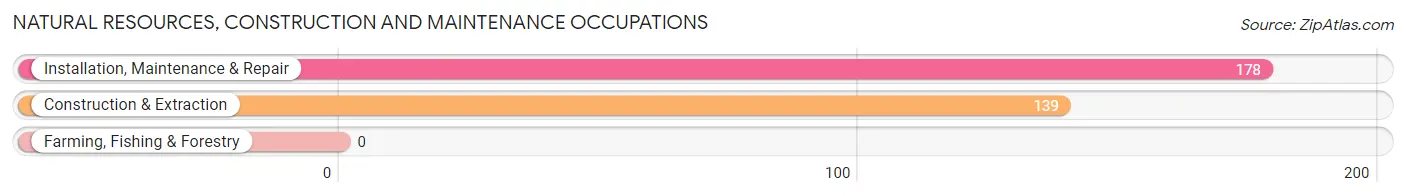
Natural Resources, Construction and Maintenance Occupations
The most common Natural Resources, Construction and Maintenance occupations in Harrisburg are Installation, Maintenance & Repair (178 | 4.2%), and Construction & Extraction (139 | 3.3%).
Natural Resources, Construction and Maintenance Occupations by Sex
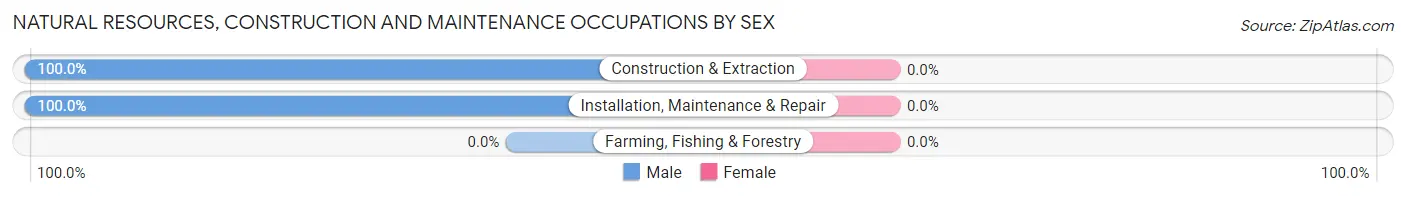
| Occupation | Male | Female |
| Farming, Fishing & Forestry | 0 (0.0%) | 0 (0.0%) |
| Construction & Extraction | 139 (100.0%) | 0 (0.0%) |
| Installation, Maintenance & Repair | 178 (100.0%) | 0 (0.0%) |
| Total (Category) | 317 (100.0%) | 0 (0.0%) |
| Total (Overall) | 2,022 (47.2%) | 2,260 (52.8%) |
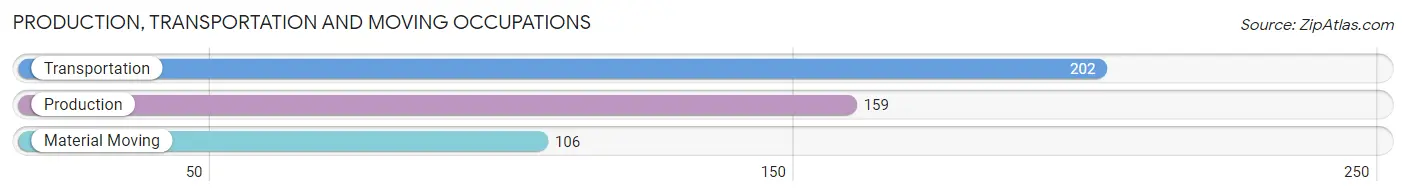
Production, Transportation and Moving Occupations
The most common Production, Transportation and Moving occupations in Harrisburg are Transportation (202 | 4.7%), Production (159 | 3.7%), and Material Moving (106 | 2.5%).
Production, Transportation and Moving Occupations by Sex
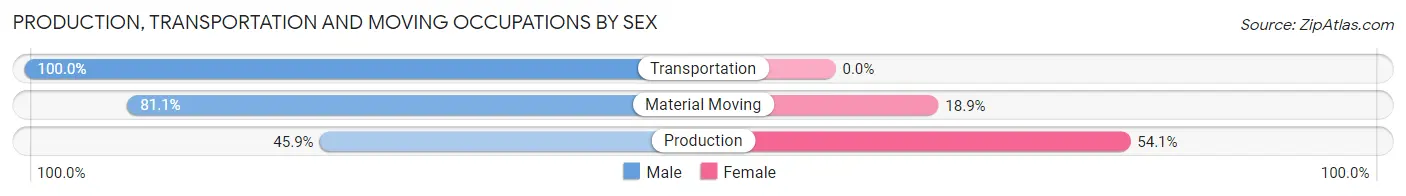
| Occupation | Male | Female |
| Production | 73 (45.9%) | 86 (54.1%) |
| Transportation | 202 (100.0%) | 0 (0.0%) |
| Material Moving | 86 (81.1%) | 20 (18.9%) |
| Total (Category) | 361 (77.3%) | 106 (22.7%) |
| Total (Overall) | 2,022 (47.2%) | 2,260 (52.8%) |
Employment Industries by Sex in Harrisburg
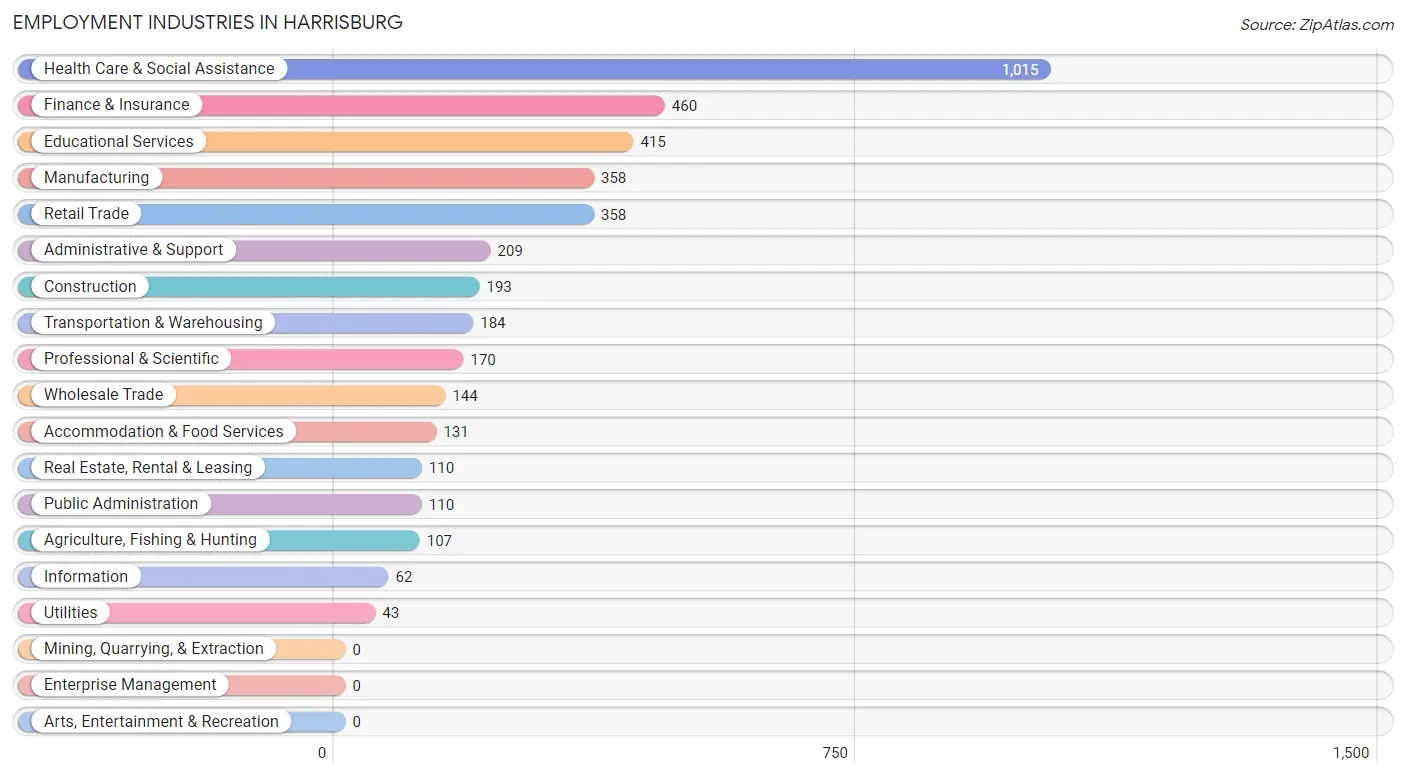
Employment Industries in Harrisburg
The major employment industries in Harrisburg include Health Care & Social Assistance (1,015 | 23.7%), Finance & Insurance (460 | 10.7%), Educational Services (415 | 9.7%), Manufacturing (358 | 8.4%), and Retail Trade (358 | 8.4%).
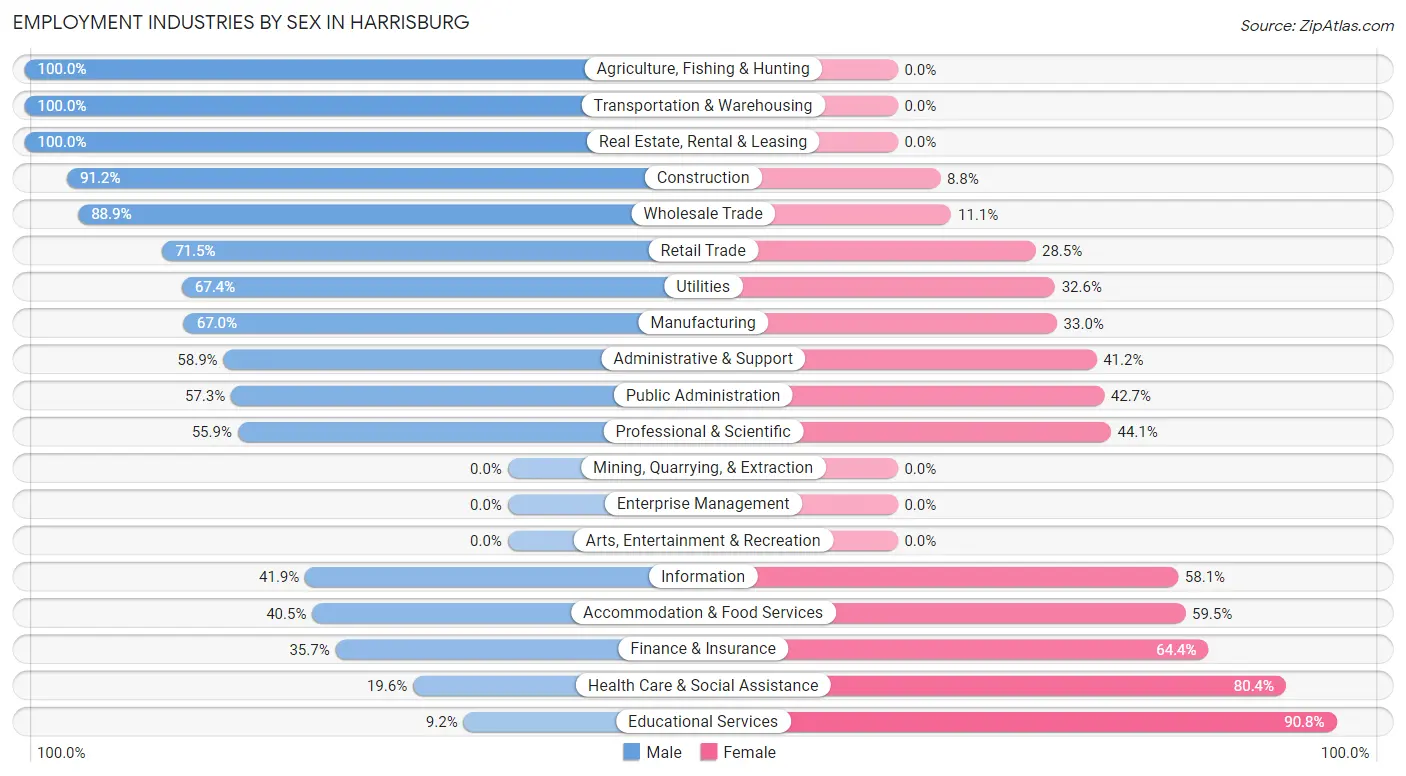
Employment Industries by Sex in Harrisburg
The Harrisburg industries that see more men than women are Agriculture, Fishing & Hunting (100.0%), Transportation & Warehousing (100.0%), and Real Estate, Rental & Leasing (100.0%), whereas the industries that tend to have a higher number of women are Educational Services (90.8%), Health Care & Social Assistance (80.4%), and Finance & Insurance (64.3%).
| Industry | Male | Female |
| Agriculture, Fishing & Hunting | 107 (100.0%) | 0 (0.0%) |
| Mining, Quarrying, & Extraction | 0 (0.0%) | 0 (0.0%) |
| Construction | 176 (91.2%) | 17 (8.8%) |
| Manufacturing | 240 (67.0%) | 118 (33.0%) |
| Wholesale Trade | 128 (88.9%) | 16 (11.1%) |
| Retail Trade | 256 (71.5%) | 102 (28.5%) |
| Transportation & Warehousing | 184 (100.0%) | 0 (0.0%) |
| Utilities | 29 (67.4%) | 14 (32.6%) |
| Information | 26 (41.9%) | 36 (58.1%) |
| Finance & Insurance | 164 (35.6%) | 296 (64.3%) |
| Real Estate, Rental & Leasing | 110 (100.0%) | 0 (0.0%) |
| Professional & Scientific | 95 (55.9%) | 75 (44.1%) |
| Enterprise Management | 0 (0.0%) | 0 (0.0%) |
| Administrative & Support | 123 (58.9%) | 86 (41.1%) |
| Educational Services | 38 (9.2%) | 377 (90.8%) |
| Health Care & Social Assistance | 199 (19.6%) | 816 (80.4%) |
| Arts, Entertainment & Recreation | 0 (0.0%) | 0 (0.0%) |
| Accommodation & Food Services | 53 (40.5%) | 78 (59.5%) |
| Public Administration | 63 (57.3%) | 47 (42.7%) |
| Total | 2,022 (47.2%) | 2,260 (52.8%) |
Education in Harrisburg
School Enrollment in Harrisburg
The most common levels of schooling among the 1,987 students in Harrisburg are middle school (765 | 38.5%), elementary school (525 | 26.4%), and high school (222 | 11.2%).
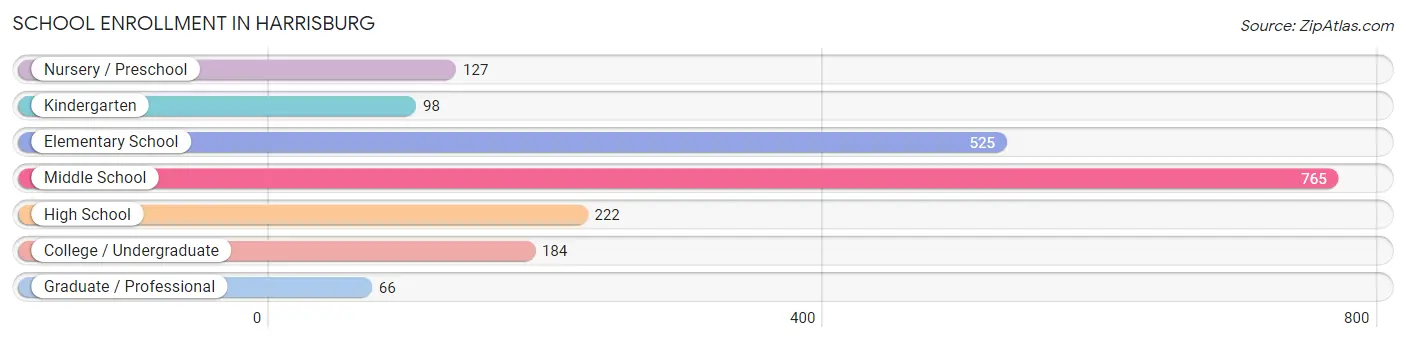
| School Level | # Students | % Students |
| Nursery / Preschool | 127 | 6.4% |
| Kindergarten | 98 | 4.9% |
| Elementary School | 525 | 26.4% |
| Middle School | 765 | 38.5% |
| High School | 222 | 11.2% |
| College / Undergraduate | 184 | 9.3% |
| Graduate / Professional | 66 | 3.3% |
| Total | 1,987 | 100.0% |
School Enrollment by Age by Funding Source in Harrisburg
Out of a total of 1,987 students who are enrolled in schools in Harrisburg, 230 (11.6%) attend a private institution, while the remaining 1,757 (88.4%) are enrolled in public schools. The age group of 3 to 4 year olds has the highest likelihood of being enrolled in private schools, with 101 (100.0% in the age bracket) enrolled. Conversely, the age group of 15 to 17 year olds has the lowest likelihood of being enrolled in a private school, with 177 (100.0% in the age bracket) attending a public institution.
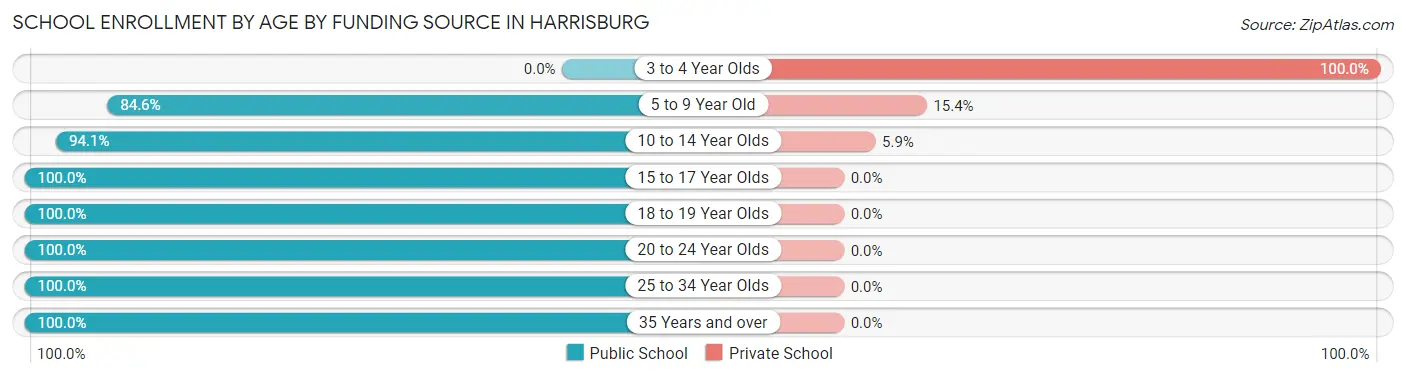
| Age Bracket | Public School | Private School |
| 3 to 4 Year Olds | 0 (0.0%) | 101 (100.0%) |
| 5 to 9 Year Old | 417 (84.6%) | 76 (15.4%) |
| 10 to 14 Year Olds | 867 (94.1%) | 54 (5.9%) |
| 15 to 17 Year Olds | 177 (100.0%) | 0 (0.0%) |
| 18 to 19 Year Olds | 25 (100.0%) | 0 (0.0%) |
| 20 to 24 Year Olds | 132 (100.0%) | 0 (0.0%) |
| 25 to 34 Year Olds | 111 (100.0%) | 0 (0.0%) |
| 35 Years and over | 27 (100.0%) | 0 (0.0%) |
| Total | 1,757 (88.4%) | 230 (11.6%) |
Educational Attainment by Field of Study in Harrisburg
Science & technology (519 | 27.3%), business (497 | 26.2%), education (173 | 9.1%), arts & humanities (156 | 8.2%), and engineering (138 | 7.3%) are the most common fields of study among 1,898 individuals in Harrisburg who have obtained a bachelor's degree or higher.
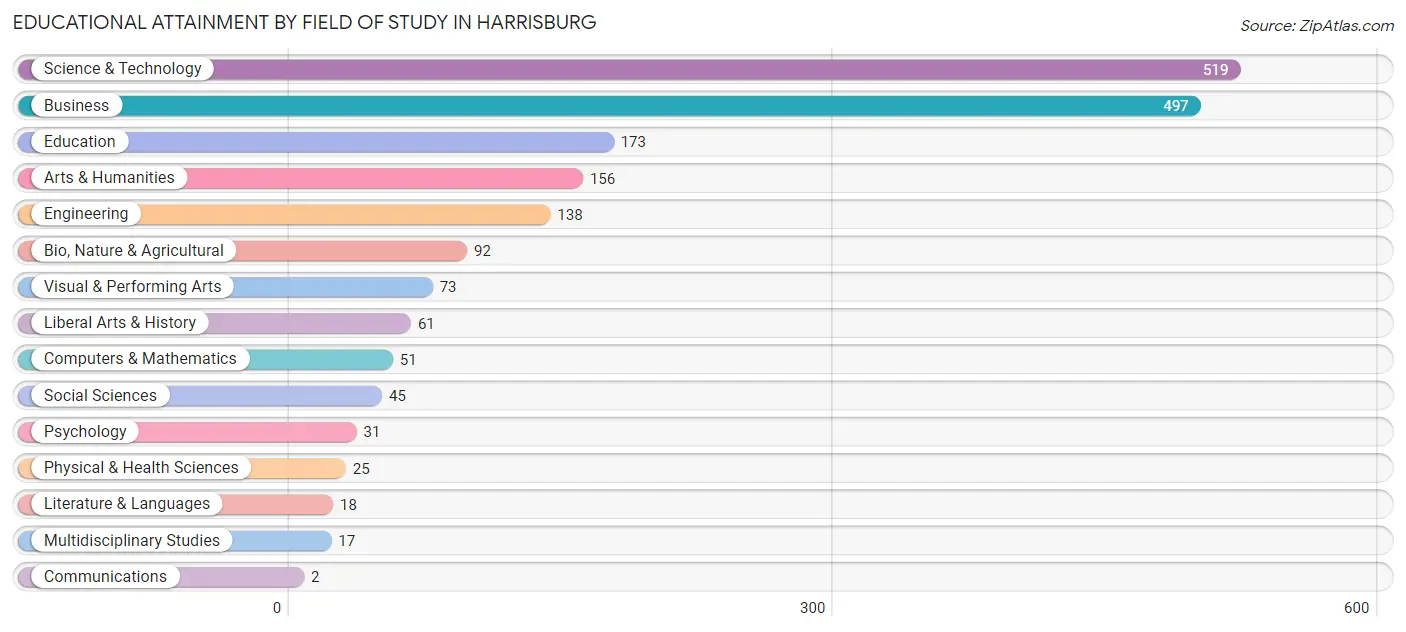
| Field of Study | # Graduates | % Graduates |
| Computers & Mathematics | 51 | 2.7% |
| Bio, Nature & Agricultural | 92 | 4.9% |
| Physical & Health Sciences | 25 | 1.3% |
| Psychology | 31 | 1.6% |
| Social Sciences | 45 | 2.4% |
| Engineering | 138 | 7.3% |
| Multidisciplinary Studies | 17 | 0.9% |
| Science & Technology | 519 | 27.3% |
| Business | 497 | 26.2% |
| Education | 173 | 9.1% |
| Literature & Languages | 18 | 0.9% |
| Liberal Arts & History | 61 | 3.2% |
| Visual & Performing Arts | 73 | 3.8% |
| Communications | 2 | 0.1% |
| Arts & Humanities | 156 | 8.2% |
| Total | 1,898 | 100.0% |
Transportation & Commute in Harrisburg
Vehicle Availability by Sex in Harrisburg
The most prevalent vehicle ownership categories in Harrisburg are males with 2 vehicles (1,016, accounting for 52.1%) and females with 2 vehicles (1,059, making up 45.6%).
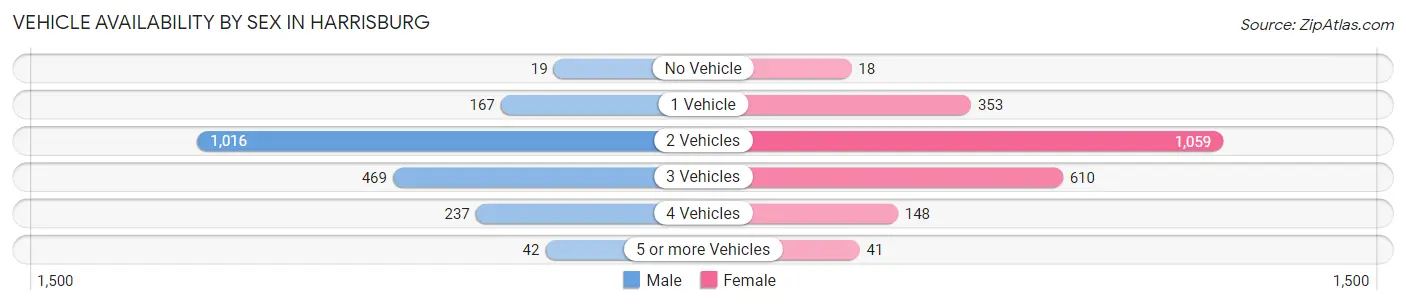
| Vehicles Available | Male | Female |
| No Vehicle | 19 (1.0%) | 18 (0.8%) |
| 1 Vehicle | 167 (8.6%) | 353 (15.8%) |
| 2 Vehicles | 1,016 (52.1%) | 1,059 (47.5%) |
| 3 Vehicles | 469 (24.0%) | 610 (27.4%) |
| 4 Vehicles | 237 (12.1%) | 148 (6.6%) |
| 5 or more Vehicles | 42 (2.1%) | 41 (1.8%) |
| Total | 1,950 (100.0%) | 2,229 (100.0%) |
Commute Time in Harrisburg
The most frequently occuring commute durations in Harrisburg are 20 to 24 minutes (981 commuters, 25.5%), 15 to 19 minutes (829 commuters, 21.6%), and 10 to 14 minutes (664 commuters, 17.3%).
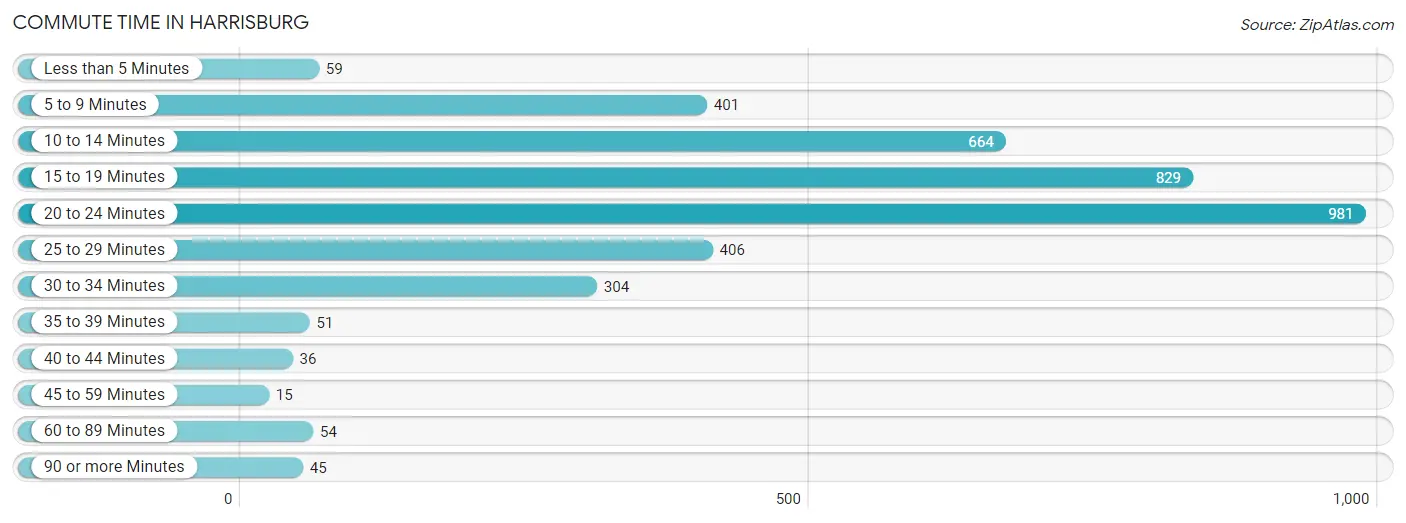
| Commute Time | # Commuters | % Commuters |
| Less than 5 Minutes | 59 | 1.5% |
| 5 to 9 Minutes | 401 | 10.4% |
| 10 to 14 Minutes | 664 | 17.3% |
| 15 to 19 Minutes | 829 | 21.6% |
| 20 to 24 Minutes | 981 | 25.5% |
| 25 to 29 Minutes | 406 | 10.6% |
| 30 to 34 Minutes | 304 | 7.9% |
| 35 to 39 Minutes | 51 | 1.3% |
| 40 to 44 Minutes | 36 | 0.9% |
| 45 to 59 Minutes | 15 | 0.4% |
| 60 to 89 Minutes | 54 | 1.4% |
| 90 or more Minutes | 45 | 1.2% |
Commute Time by Sex in Harrisburg
The most common commute times in Harrisburg are 15 to 19 minutes (470 commuters, 26.9%) for males and 20 to 24 minutes (532 commuters, 25.4%) for females.
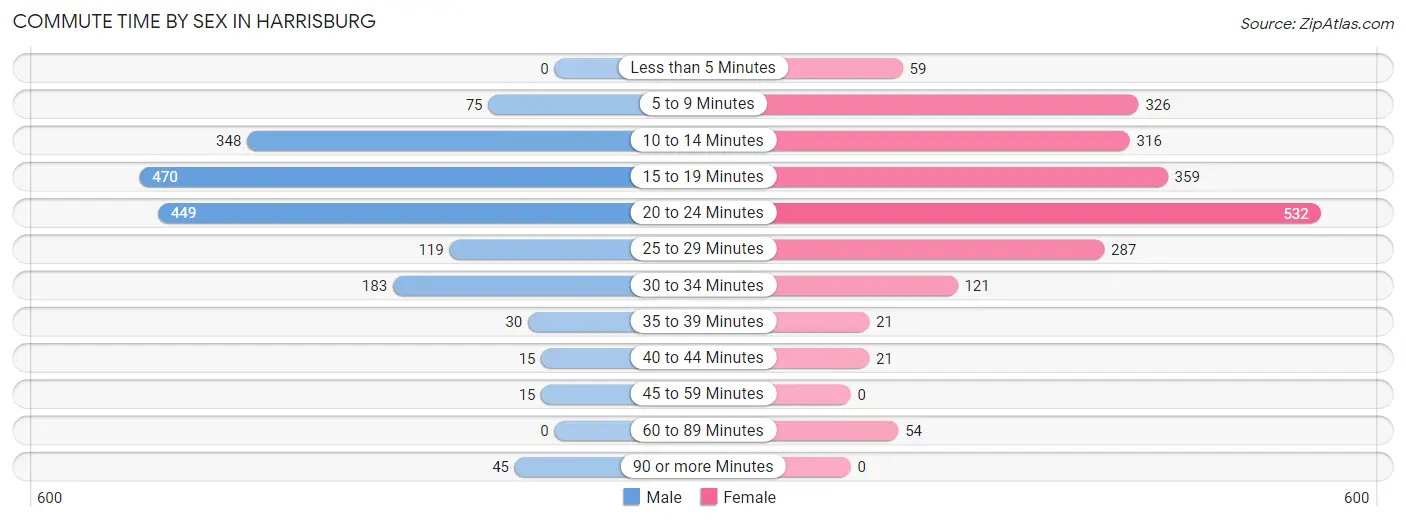
| Commute Time | Male | Female |
| Less than 5 Minutes | 0 (0.0%) | 59 (2.8%) |
| 5 to 9 Minutes | 75 (4.3%) | 326 (15.5%) |
| 10 to 14 Minutes | 348 (19.9%) | 316 (15.1%) |
| 15 to 19 Minutes | 470 (26.9%) | 359 (17.1%) |
| 20 to 24 Minutes | 449 (25.7%) | 532 (25.4%) |
| 25 to 29 Minutes | 119 (6.8%) | 287 (13.7%) |
| 30 to 34 Minutes | 183 (10.5%) | 121 (5.8%) |
| 35 to 39 Minutes | 30 (1.7%) | 21 (1.0%) |
| 40 to 44 Minutes | 15 (0.9%) | 21 (1.0%) |
| 45 to 59 Minutes | 15 (0.9%) | 0 (0.0%) |
| 60 to 89 Minutes | 0 (0.0%) | 54 (2.6%) |
| 90 or more Minutes | 45 (2.6%) | 0 (0.0%) |
Time of Departure to Work by Sex in Harrisburg
The most frequent times of departure to work in Harrisburg are 6:30 AM to 6:59 AM (482, 27.6%) for males and 7:00 AM to 7:29 AM (427, 20.4%) for females.
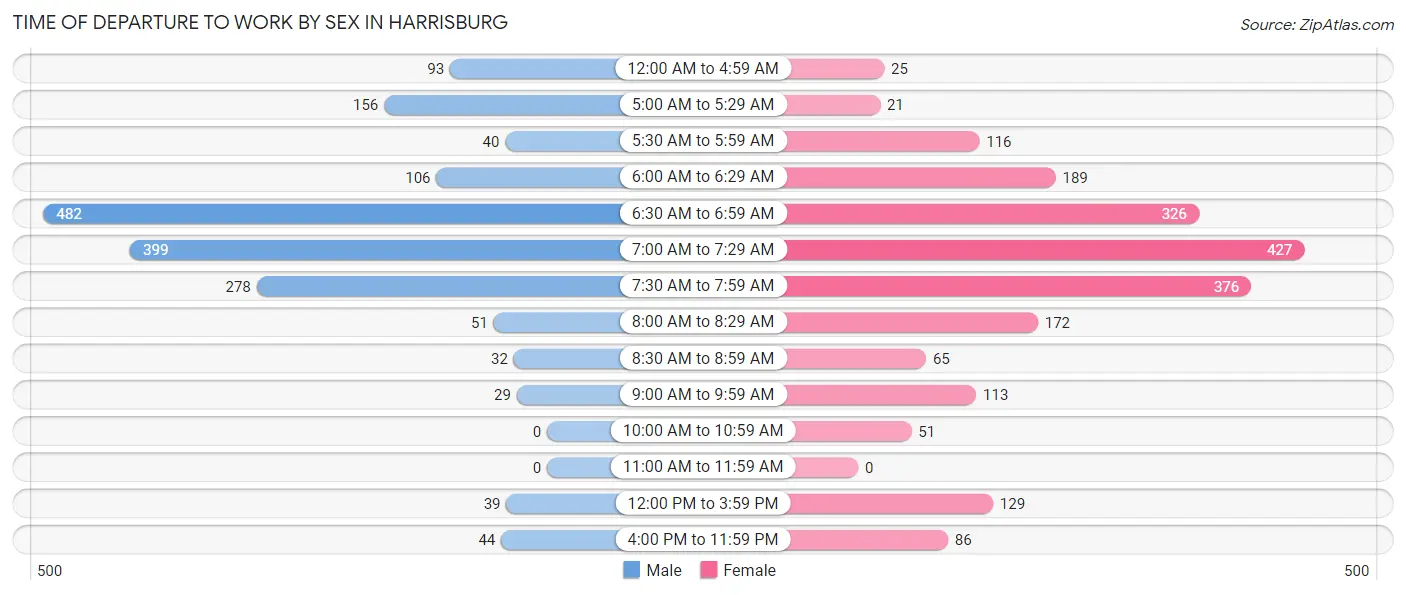
| Time of Departure | Male | Female |
| 12:00 AM to 4:59 AM | 93 (5.3%) | 25 (1.2%) |
| 5:00 AM to 5:29 AM | 156 (8.9%) | 21 (1.0%) |
| 5:30 AM to 5:59 AM | 40 (2.3%) | 116 (5.5%) |
| 6:00 AM to 6:29 AM | 106 (6.1%) | 189 (9.0%) |
| 6:30 AM to 6:59 AM | 482 (27.6%) | 326 (15.5%) |
| 7:00 AM to 7:29 AM | 399 (22.8%) | 427 (20.4%) |
| 7:30 AM to 7:59 AM | 278 (15.9%) | 376 (17.9%) |
| 8:00 AM to 8:29 AM | 51 (2.9%) | 172 (8.2%) |
| 8:30 AM to 8:59 AM | 32 (1.8%) | 65 (3.1%) |
| 9:00 AM to 9:59 AM | 29 (1.7%) | 113 (5.4%) |
| 10:00 AM to 10:59 AM | 0 (0.0%) | 51 (2.4%) |
| 11:00 AM to 11:59 AM | 0 (0.0%) | 0 (0.0%) |
| 12:00 PM to 3:59 PM | 39 (2.2%) | 129 (6.1%) |
| 4:00 PM to 11:59 PM | 44 (2.5%) | 86 (4.1%) |
| Total | 1,749 (100.0%) | 2,096 (100.0%) |
Housing Occupancy in Harrisburg
Occupancy by Ownership in Harrisburg
Of the total 2,642 dwellings in Harrisburg, owner-occupied units account for 2,249 (85.1%), while renter-occupied units make up 393 (14.9%).
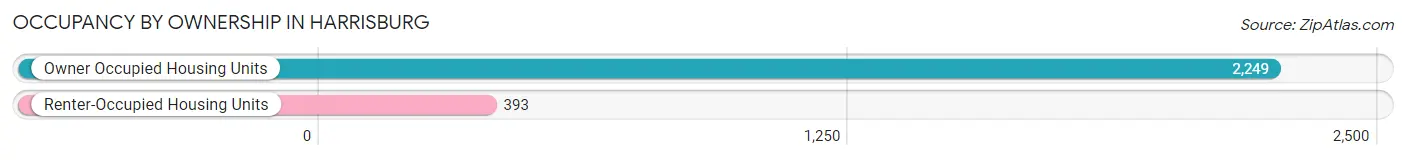
| Occupancy | # Housing Units | % Housing Units |
| Owner Occupied Housing Units | 2,249 | 85.1% |
| Renter-Occupied Housing Units | 393 | 14.9% |
| Total Occupied Housing Units | 2,642 | 100.0% |
Occupancy by Household Size in Harrisburg
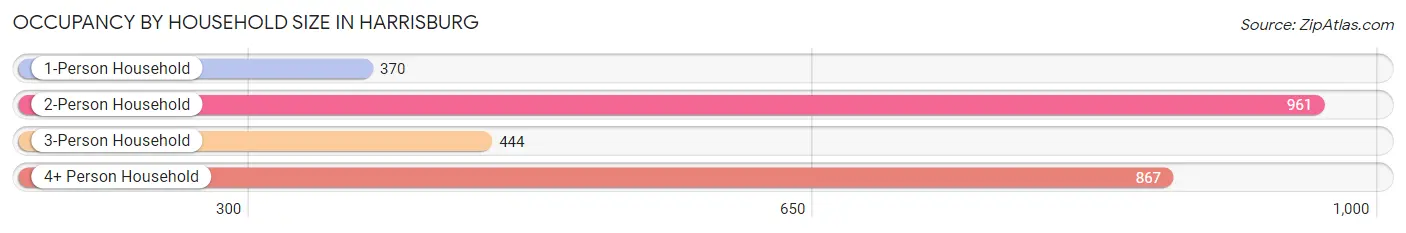
| Household Size | # Housing Units | % Housing Units |
| 1-Person Household | 370 | 14.0% |
| 2-Person Household | 961 | 36.4% |
| 3-Person Household | 444 | 16.8% |
| 4+ Person Household | 867 | 32.8% |
| Total Housing Units | 2,642 | 100.0% |
Occupancy by Ownership by Household Size in Harrisburg
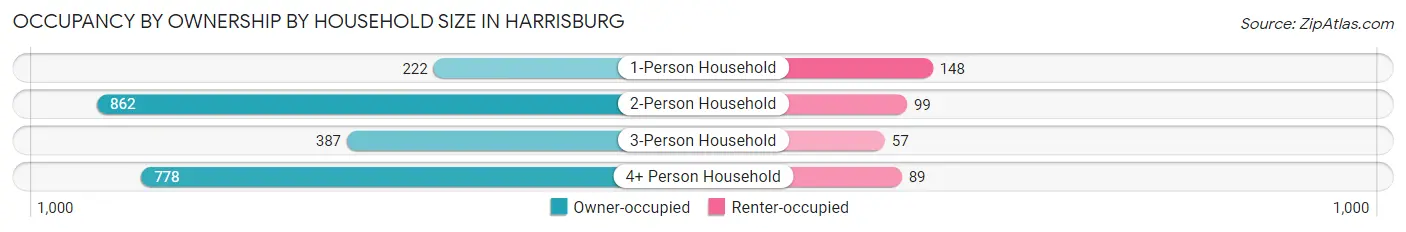
| Household Size | Owner-occupied | Renter-occupied |
| 1-Person Household | 222 (60.0%) | 148 (40.0%) |
| 2-Person Household | 862 (89.7%) | 99 (10.3%) |
| 3-Person Household | 387 (87.2%) | 57 (12.8%) |
| 4+ Person Household | 778 (89.7%) | 89 (10.3%) |
| Total Housing Units | 2,249 (85.1%) | 393 (14.9%) |
Occupancy by Educational Attainment in Harrisburg
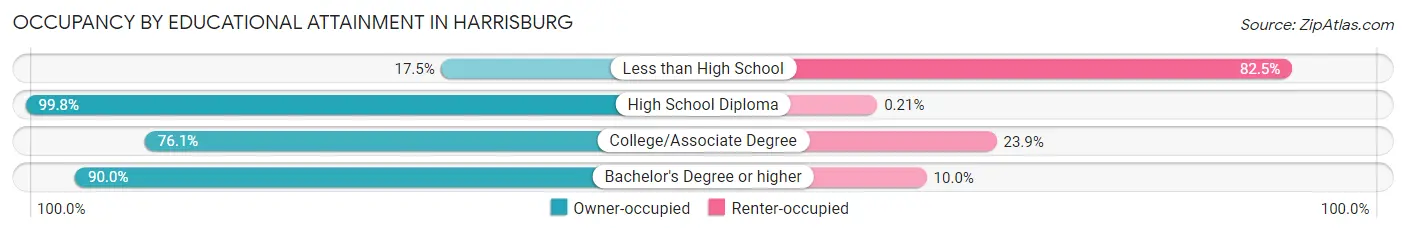
| Household Size | Owner-occupied | Renter-occupied |
| Less than High School | 10 (17.5%) | 47 (82.5%) |
| High School Diploma | 471 (99.8%) | 1 (0.2%) |
| College/Associate Degree | 734 (76.1%) | 230 (23.9%) |
| Bachelor's Degree or higher | 1,034 (90.0%) | 115 (10.0%) |
Occupancy by Age of Householder in Harrisburg
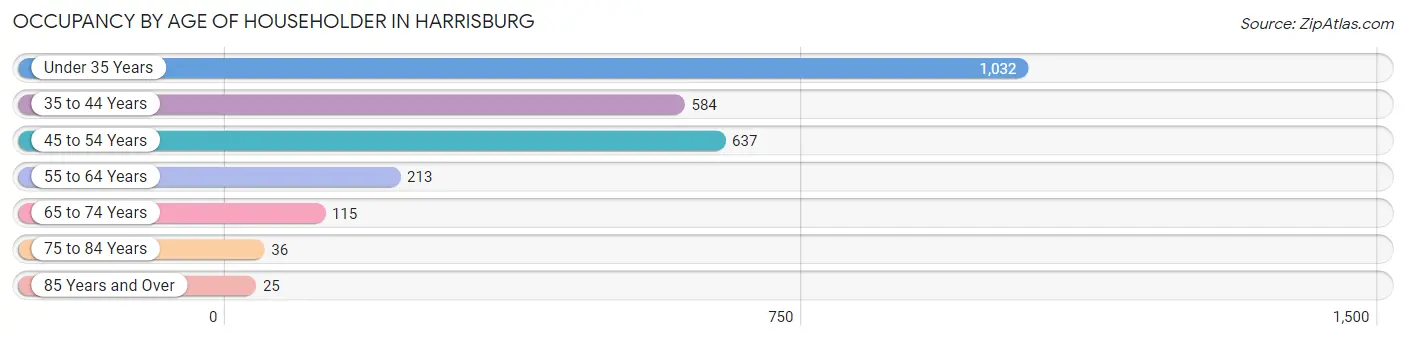
| Age Bracket | # Households | % Households |
| Under 35 Years | 1,032 | 39.1% |
| 35 to 44 Years | 584 | 22.1% |
| 45 to 54 Years | 637 | 24.1% |
| 55 to 64 Years | 213 | 8.1% |
| 65 to 74 Years | 115 | 4.3% |
| 75 to 84 Years | 36 | 1.4% |
| 85 Years and Over | 25 | 0.9% |
| Total | 2,642 | 100.0% |
Housing Finances in Harrisburg
Median Income by Occupancy in Harrisburg
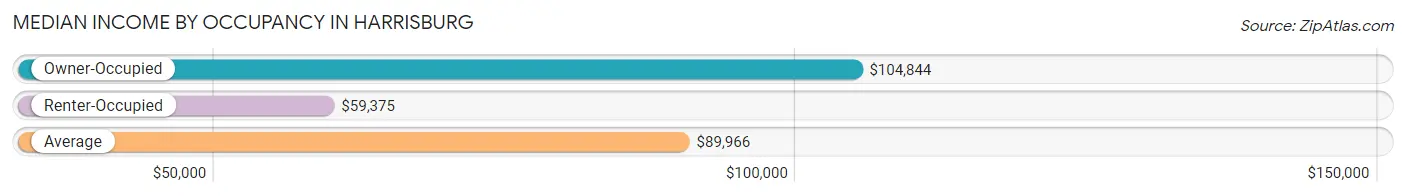
| Occupancy Type | # Households | Median Income |
| Owner-Occupied | 2,249 (85.1%) | $104,844 |
| Renter-Occupied | 393 (14.9%) | $59,375 |
| Average | 2,642 (100.0%) | $89,966 |
Occupancy by Householder Income Bracket in Harrisburg
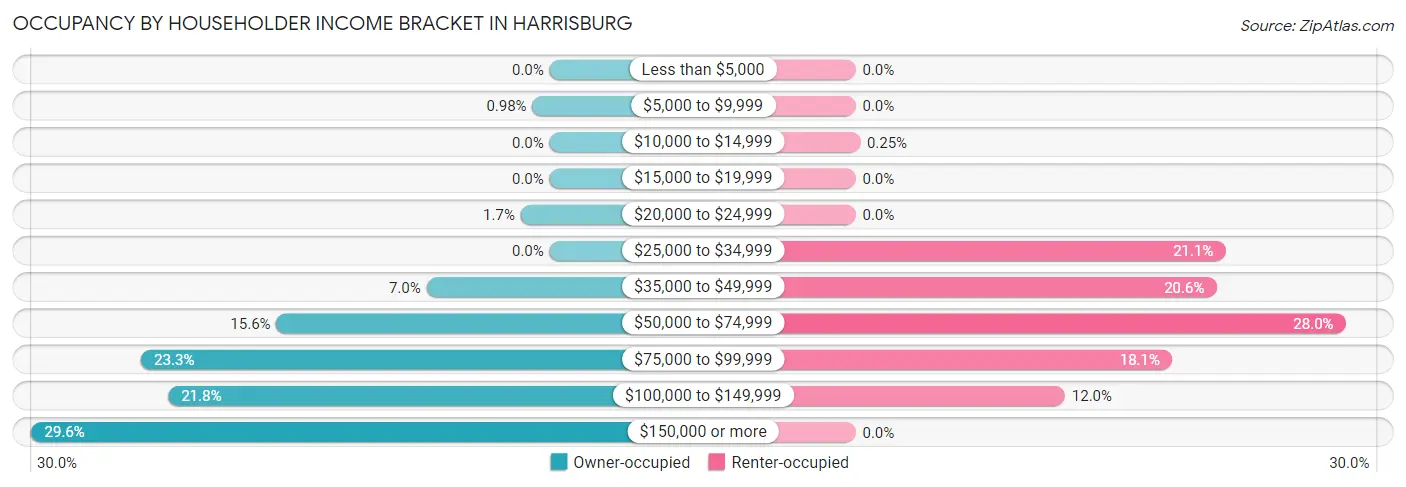
| Income Bracket | Owner-occupied | Renter-occupied |
| Less than $5,000 | 0 (0.0%) | 0 (0.0%) |
| $5,000 to $9,999 | 22 (1.0%) | 0 (0.0%) |
| $10,000 to $14,999 | 0 (0.0%) | 1 (0.3%) |
| $15,000 to $19,999 | 0 (0.0%) | 0 (0.0%) |
| $20,000 to $24,999 | 37 (1.7%) | 0 (0.0%) |
| $25,000 to $34,999 | 0 (0.0%) | 83 (21.1%) |
| $35,000 to $49,999 | 158 (7.0%) | 81 (20.6%) |
| $50,000 to $74,999 | 351 (15.6%) | 110 (28.0%) |
| $75,000 to $99,999 | 525 (23.3%) | 71 (18.1%) |
| $100,000 to $149,999 | 490 (21.8%) | 47 (12.0%) |
| $150,000 or more | 666 (29.6%) | 0 (0.0%) |
| Total | 2,249 (100.0%) | 393 (100.0%) |
Monthly Housing Cost Tiers in Harrisburg

| Monthly Cost | Owner-occupied | Renter-occupied |
| Less than $300 | 5 (0.2%) | 0 (0.0%) |
| $300 to $499 | 220 (9.8%) | 0 (0.0%) |
| $500 to $799 | 221 (9.8%) | 63 (16.0%) |
| $800 to $999 | 29 (1.3%) | 25 (6.4%) |
| $1,000 to $1,499 | 558 (24.8%) | 184 (46.8%) |
| $1,500 to $1,999 | 895 (39.8%) | 50 (12.7%) |
| $2,000 to $2,499 | 212 (9.4%) | 71 (18.1%) |
| $2,500 to $2,999 | 109 (4.9%) | 0 (0.0%) |
| $3,000 or more | 0 (0.0%) | 0 (0.0%) |
| Total | 2,249 (100.0%) | 393 (100.0%) |
Physical Housing Characteristics in Harrisburg
Housing Structures in Harrisburg
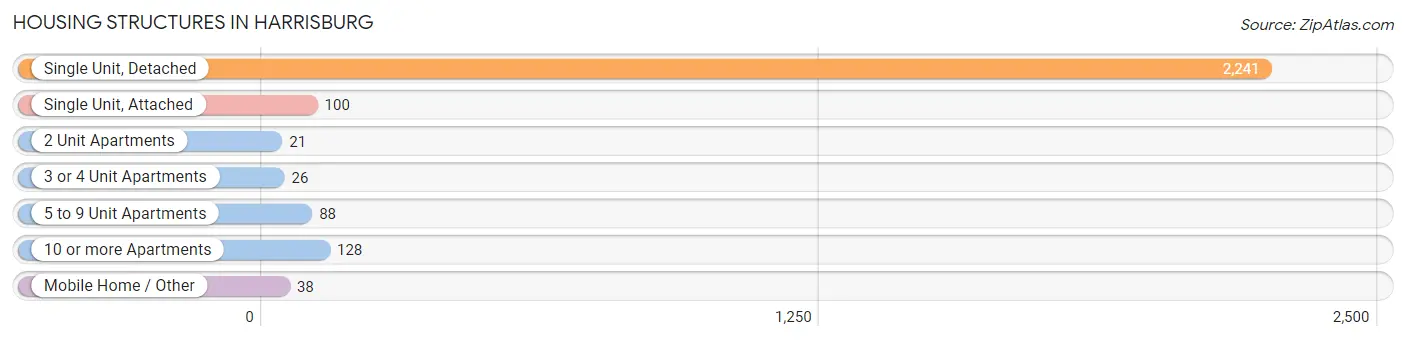
| Structure Type | # Housing Units | % Housing Units |
| Single Unit, Detached | 2,241 | 84.8% |
| Single Unit, Attached | 100 | 3.8% |
| 2 Unit Apartments | 21 | 0.8% |
| 3 or 4 Unit Apartments | 26 | 1.0% |
| 5 to 9 Unit Apartments | 88 | 3.3% |
| 10 or more Apartments | 128 | 4.8% |
| Mobile Home / Other | 38 | 1.4% |
| Total | 2,642 | 100.0% |
Housing Structures by Occupancy in Harrisburg
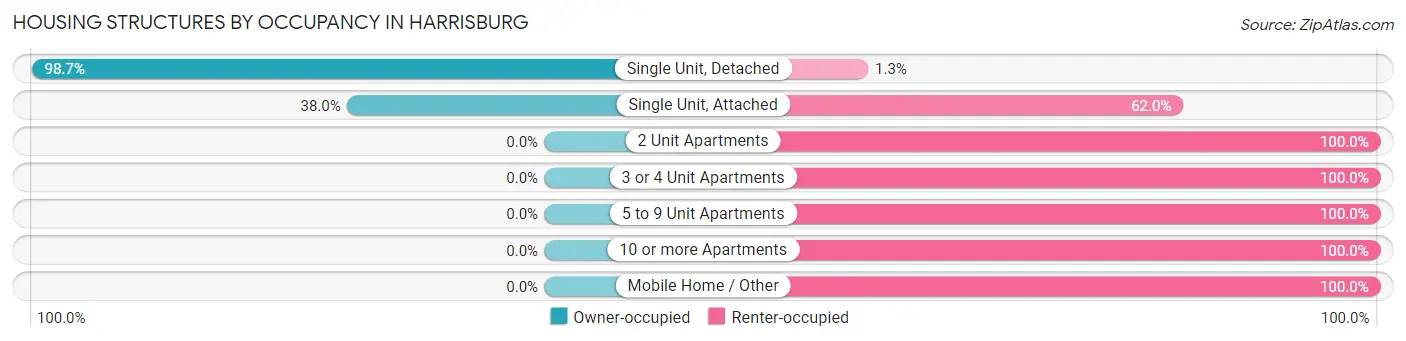
| Structure Type | Owner-occupied | Renter-occupied |
| Single Unit, Detached | 2,211 (98.7%) | 30 (1.3%) |
| Single Unit, Attached | 38 (38.0%) | 62 (62.0%) |
| 2 Unit Apartments | 0 (0.0%) | 21 (100.0%) |
| 3 or 4 Unit Apartments | 0 (0.0%) | 26 (100.0%) |
| 5 to 9 Unit Apartments | 0 (0.0%) | 88 (100.0%) |
| 10 or more Apartments | 0 (0.0%) | 128 (100.0%) |
| Mobile Home / Other | 0 (0.0%) | 38 (100.0%) |
| Total | 2,249 (85.1%) | 393 (14.9%) |
Housing Structures by Number of Rooms in Harrisburg
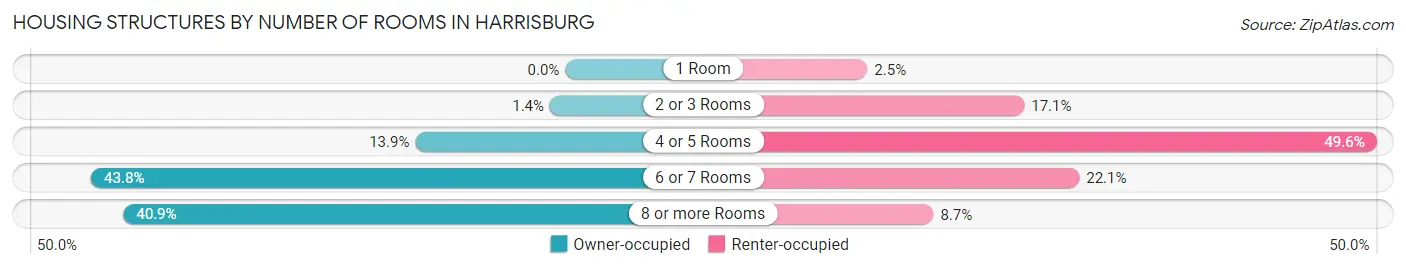
| Number of Rooms | Owner-occupied | Renter-occupied |
| 1 Room | 0 (0.0%) | 10 (2.5%) |
| 2 or 3 Rooms | 32 (1.4%) | 67 (17.1%) |
| 4 or 5 Rooms | 312 (13.9%) | 195 (49.6%) |
| 6 or 7 Rooms | 986 (43.8%) | 87 (22.1%) |
| 8 or more Rooms | 919 (40.9%) | 34 (8.6%) |
| Total | 2,249 (100.0%) | 393 (100.0%) |
Housing Structure by Heating Type in Harrisburg
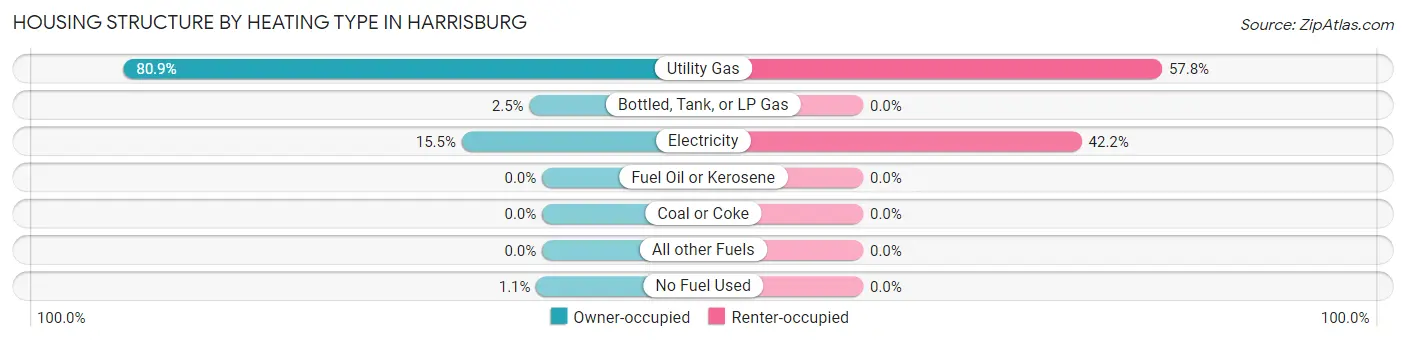
| Heating Type | Owner-occupied | Renter-occupied |
| Utility Gas | 1,820 (80.9%) | 227 (57.8%) |
| Bottled, Tank, or LP Gas | 55 (2.5%) | 0 (0.0%) |
| Electricity | 349 (15.5%) | 166 (42.2%) |
| Fuel Oil or Kerosene | 0 (0.0%) | 0 (0.0%) |
| Coal or Coke | 0 (0.0%) | 0 (0.0%) |
| All other Fuels | 0 (0.0%) | 0 (0.0%) |
| No Fuel Used | 25 (1.1%) | 0 (0.0%) |
| Total | 2,249 (100.0%) | 393 (100.0%) |
Household Vehicle Usage in Harrisburg
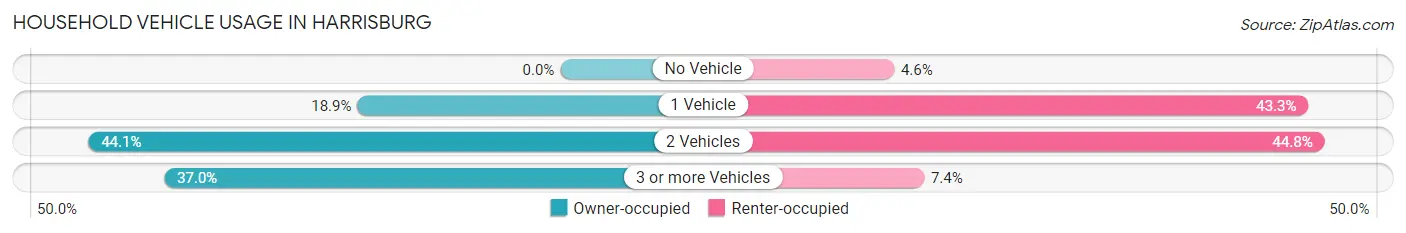
| Vehicles per Household | Owner-occupied | Renter-occupied |
| No Vehicle | 0 (0.0%) | 18 (4.6%) |
| 1 Vehicle | 426 (18.9%) | 170 (43.3%) |
| 2 Vehicles | 991 (44.1%) | 176 (44.8%) |
| 3 or more Vehicles | 832 (37.0%) | 29 (7.4%) |
| Total | 2,249 (100.0%) | 393 (100.0%) |
Real Estate & Mortgages in Harrisburg
Real Estate and Mortgage Overview in Harrisburg
| Characteristic | Without Mortgage | With Mortgage |
| Housing Units | 465 | 1,784 |
| Median Property Value | $213,500 | $260,400 |
| Median Household Income | $89,588 | $634 |
| Monthly Housing Costs | $526 | $0 |
| Real Estate Taxes | $2,228 | $29 |
Property Value by Mortgage Status in Harrisburg
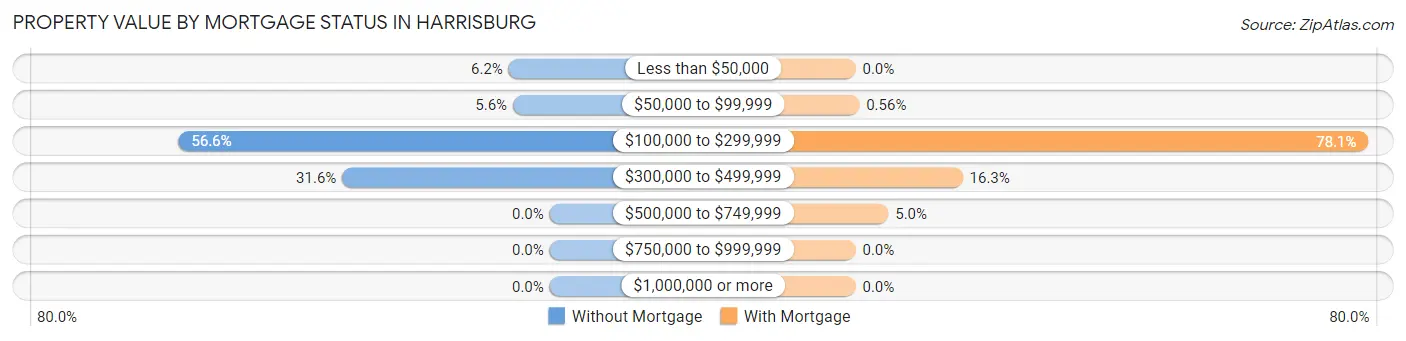
| Property Value | Without Mortgage | With Mortgage |
| Less than $50,000 | 29 (6.2%) | 0 (0.0%) |
| $50,000 to $99,999 | 26 (5.6%) | 10 (0.6%) |
| $100,000 to $299,999 | 263 (56.6%) | 1,394 (78.1%) |
| $300,000 to $499,999 | 147 (31.6%) | 291 (16.3%) |
| $500,000 to $749,999 | 0 (0.0%) | 89 (5.0%) |
| $750,000 to $999,999 | 0 (0.0%) | 0 (0.0%) |
| $1,000,000 or more | 0 (0.0%) | 0 (0.0%) |
| Total | 465 (100.0%) | 1,784 (100.0%) |
Household Income by Mortgage Status in Harrisburg
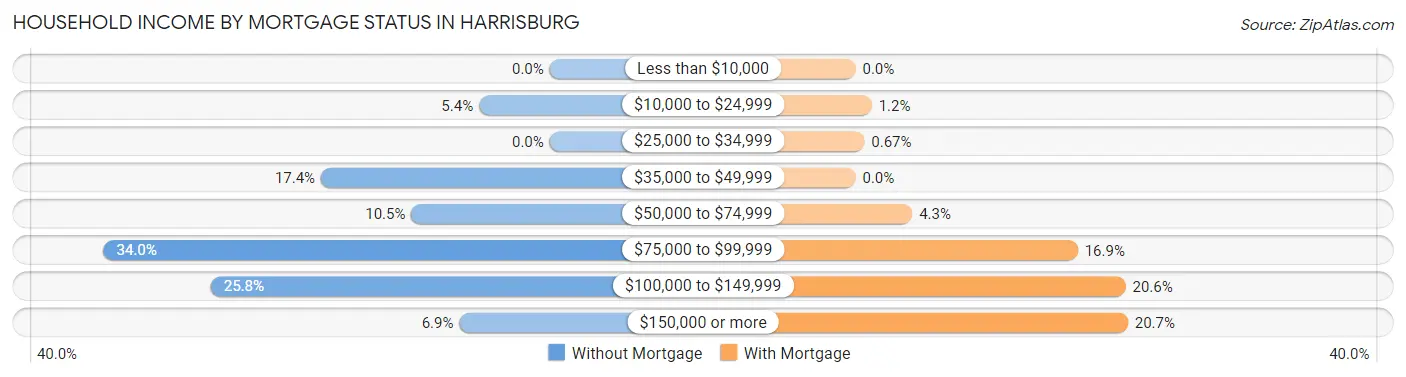
| Household Income | Without Mortgage | With Mortgage |
| Less than $10,000 | 0 (0.0%) | 0 (0.0%) |
| $10,000 to $24,999 | 25 (5.4%) | 22 (1.2%) |
| $25,000 to $34,999 | 0 (0.0%) | 12 (0.7%) |
| $35,000 to $49,999 | 81 (17.4%) | 0 (0.0%) |
| $50,000 to $74,999 | 49 (10.5%) | 77 (4.3%) |
| $75,000 to $99,999 | 158 (34.0%) | 302 (16.9%) |
| $100,000 to $149,999 | 120 (25.8%) | 367 (20.6%) |
| $150,000 or more | 32 (6.9%) | 370 (20.7%) |
| Total | 465 (100.0%) | 1,784 (100.0%) |
Property Value to Household Income Ratio in Harrisburg
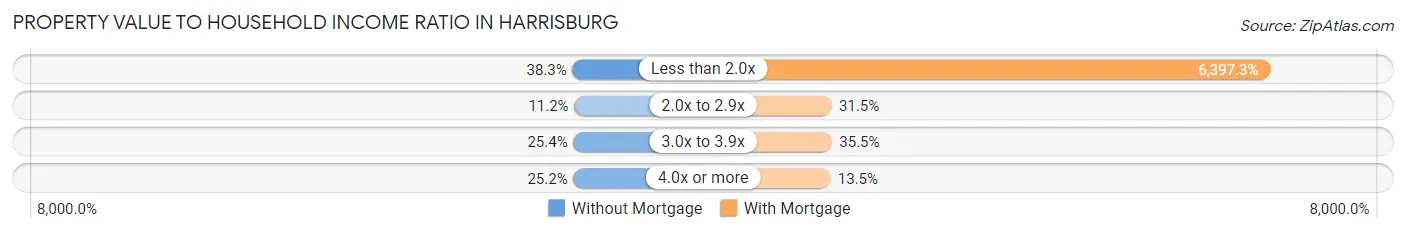
| Value-to-Income Ratio | Without Mortgage | With Mortgage |
| Less than 2.0x | 178 (38.3%) | 114,128 (6,397.3%) |
| 2.0x to 2.9x | 52 (11.2%) | 562 (31.5%) |
| 3.0x to 3.9x | 118 (25.4%) | 634 (35.5%) |
| 4.0x or more | 117 (25.2%) | 240 (13.5%) |
| Total | 465 (100.0%) | 1,784 (100.0%) |
Real Estate Taxes by Mortgage Status in Harrisburg
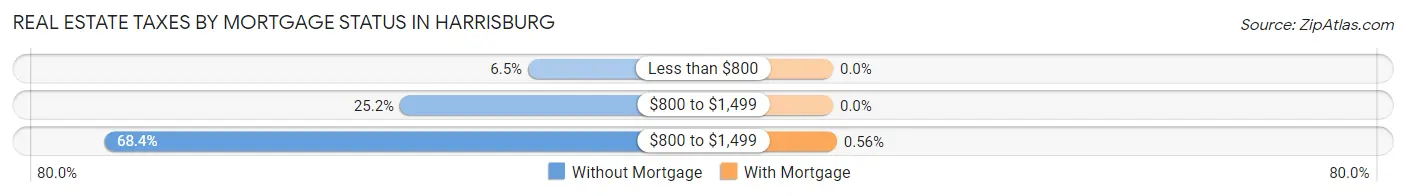
| Property Taxes | Without Mortgage | With Mortgage |
| Less than $800 | 30 (6.5%) | 0 (0.0%) |
| $800 to $1,499 | 117 (25.2%) | 0 (0.0%) |
| $800 to $1,499 | 318 (68.4%) | 10 (0.6%) |
| Total | 465 (100.0%) | 1,784 (100.0%) |
Health & Disability in Harrisburg
Health Insurance Coverage by Age in Harrisburg
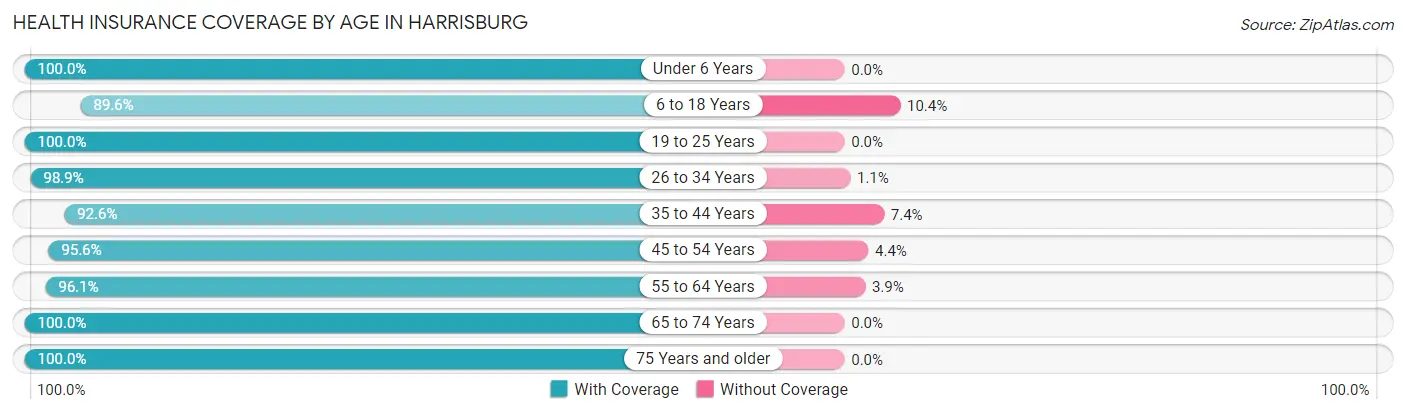
| Age Bracket | With Coverage | Without Coverage |
| Under 6 Years | 692 (100.0%) | 0 (0.0%) |
| 6 to 18 Years | 1,534 (89.6%) | 178 (10.4%) |
| 19 to 25 Years | 449 (100.0%) | 0 (0.0%) |
| 26 to 34 Years | 1,382 (98.9%) | 15 (1.1%) |
| 35 to 44 Years | 1,219 (92.6%) | 97 (7.4%) |
| 45 to 54 Years | 797 (95.6%) | 37 (4.4%) |
| 55 to 64 Years | 473 (96.1%) | 19 (3.9%) |
| 65 to 74 Years | 186 (100.0%) | 0 (0.0%) |
| 75 Years and older | 79 (100.0%) | 0 (0.0%) |
| Total | 6,811 (95.2%) | 346 (4.8%) |
Health Insurance Coverage by Citizenship Status in Harrisburg
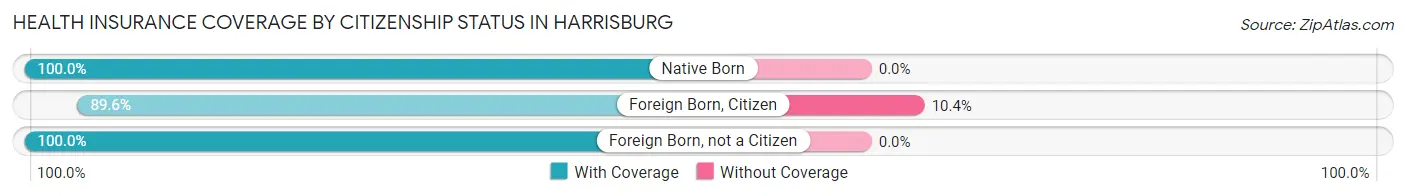
| Citizenship Status | With Coverage | Without Coverage |
| Native Born | 692 (100.0%) | 0 (0.0%) |
| Foreign Born, Citizen | 1,534 (89.6%) | 178 (10.4%) |
| Foreign Born, not a Citizen | 449 (100.0%) | 0 (0.0%) |
Health Insurance Coverage by Household Income in Harrisburg
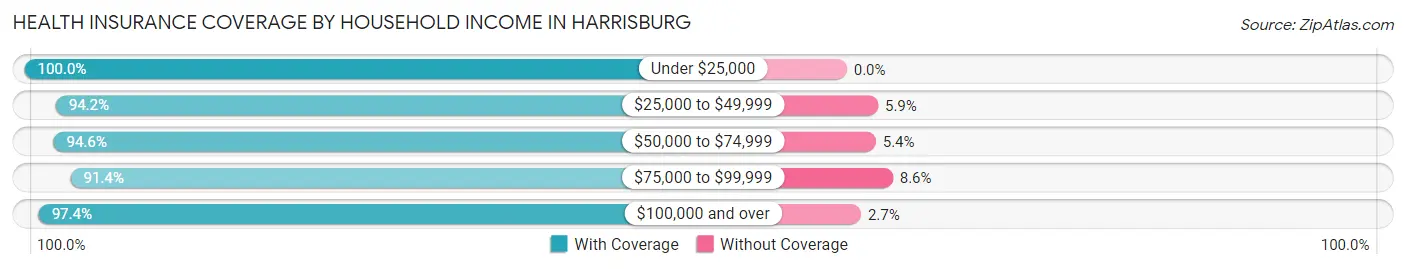
| Household Income | With Coverage | Without Coverage |
| Under $25,000 | 89 (100.0%) | 0 (0.0%) |
| $25,000 to $49,999 | 563 (94.2%) | 35 (5.9%) |
| $50,000 to $74,999 | 836 (94.6%) | 48 (5.4%) |
| $75,000 to $99,999 | 1,760 (91.4%) | 166 (8.6%) |
| $100,000 and over | 3,563 (97.4%) | 97 (2.6%) |
Public vs Private Health Insurance Coverage by Age in Harrisburg
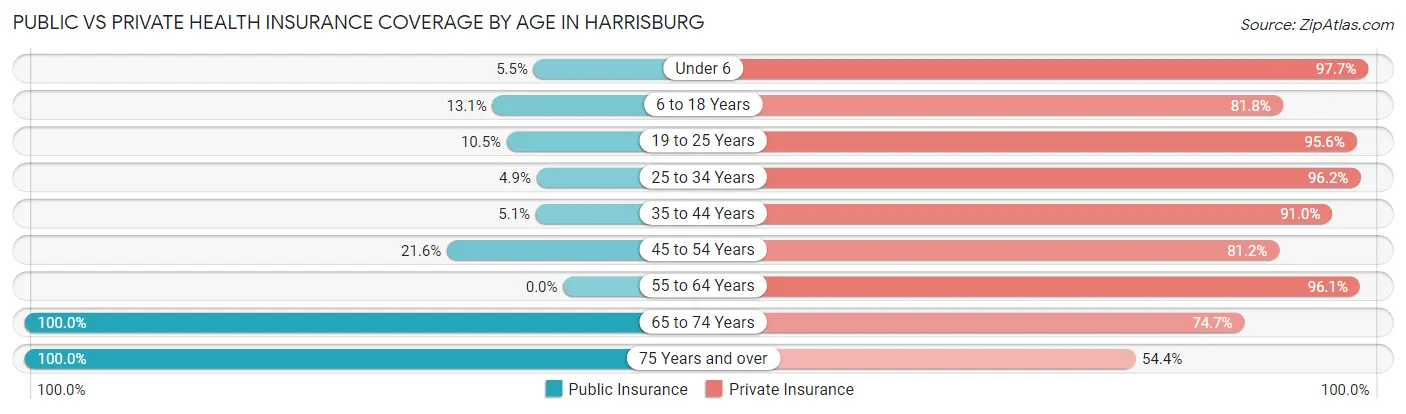
| Age Bracket | Public Insurance | Private Insurance |
| Under 6 | 38 (5.5%) | 676 (97.7%) |
| 6 to 18 Years | 225 (13.1%) | 1,401 (81.8%) |
| 19 to 25 Years | 47 (10.5%) | 429 (95.6%) |
| 25 to 34 Years | 69 (4.9%) | 1,344 (96.2%) |
| 35 to 44 Years | 67 (5.1%) | 1,198 (91.0%) |
| 45 to 54 Years | 180 (21.6%) | 677 (81.2%) |
| 55 to 64 Years | 0 (0.0%) | 473 (96.1%) |
| 65 to 74 Years | 186 (100.0%) | 139 (74.7%) |
| 75 Years and over | 79 (100.0%) | 43 (54.4%) |
| Total | 891 (12.4%) | 6,380 (89.1%) |
Disability Status by Sex by Age in Harrisburg
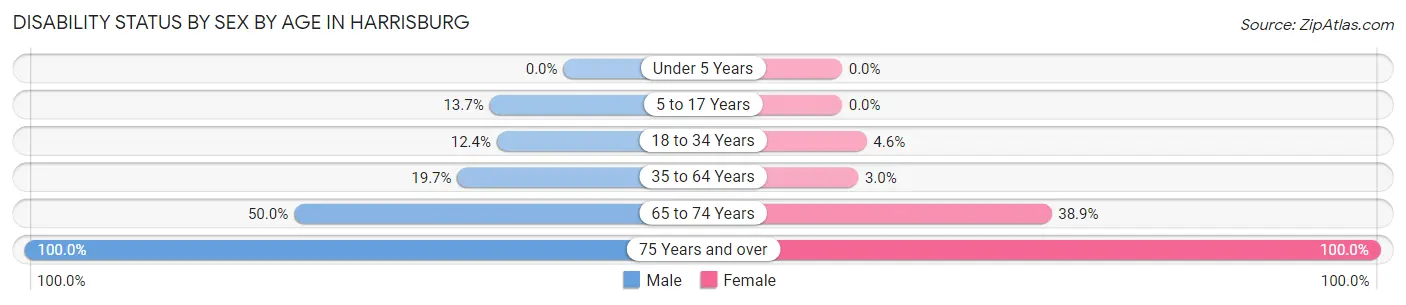
| Age Bracket | Male | Female |
| Under 5 Years | 0 (0.0%) | 0 (0.0%) |
| 5 to 17 Years | 119 (13.7%) | 0 (0.0%) |
| 18 to 34 Years | 104 (12.3%) | 47 (4.6%) |
| 35 to 64 Years | 277 (19.7%) | 37 (3.0%) |
| 65 to 74 Years | 39 (50.0%) | 42 (38.9%) |
| 75 Years and over | 54 (100.0%) | 25 (100.0%) |
Disability Class by Sex by Age in Harrisburg
Disability Class: Hearing Difficulty
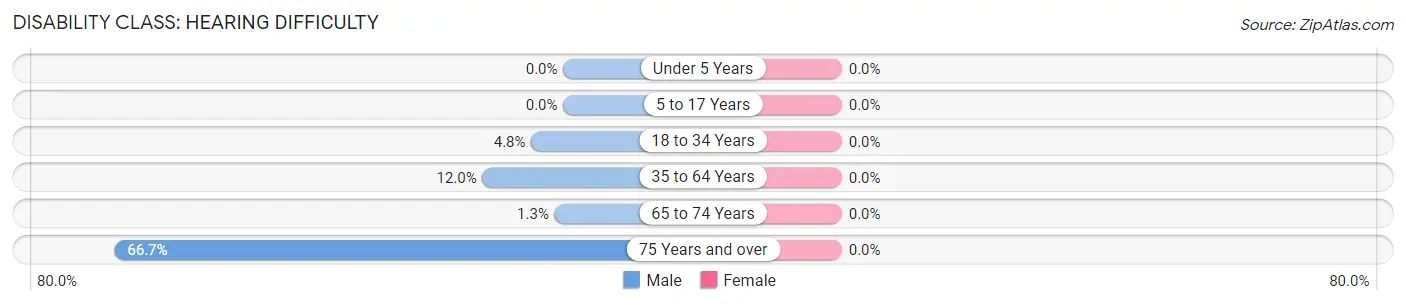
| Age Bracket | Male | Female |
| Under 5 Years | 0 (0.0%) | 0 (0.0%) |
| 5 to 17 Years | 0 (0.0%) | 0 (0.0%) |
| 18 to 34 Years | 40 (4.8%) | 0 (0.0%) |
| 35 to 64 Years | 169 (12.0%) | 0 (0.0%) |
| 65 to 74 Years | 1 (1.3%) | 0 (0.0%) |
| 75 Years and over | 36 (66.7%) | 0 (0.0%) |
Disability Class: Vision Difficulty
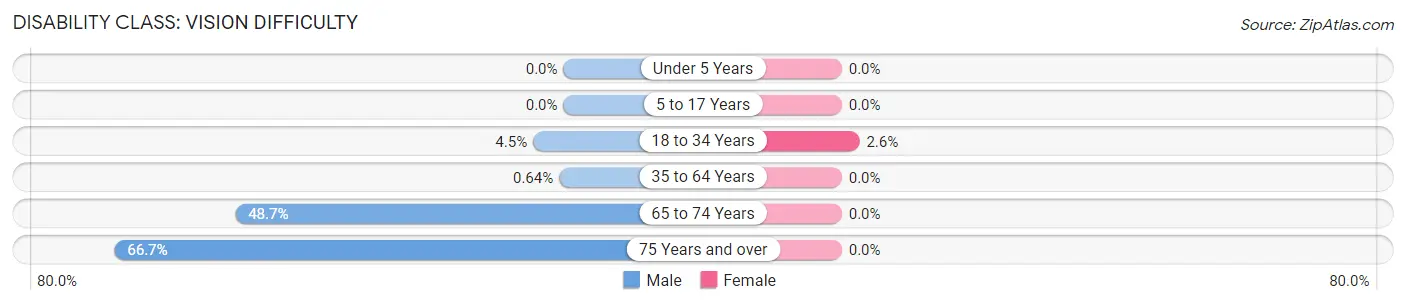
| Age Bracket | Male | Female |
| Under 5 Years | 0 (0.0%) | 0 (0.0%) |
| 5 to 17 Years | 0 (0.0%) | 0 (0.0%) |
| 18 to 34 Years | 38 (4.5%) | 27 (2.6%) |
| 35 to 64 Years | 9 (0.6%) | 0 (0.0%) |
| 65 to 74 Years | 38 (48.7%) | 0 (0.0%) |
| 75 Years and over | 36 (66.7%) | 0 (0.0%) |
Disability Class: Cognitive Difficulty
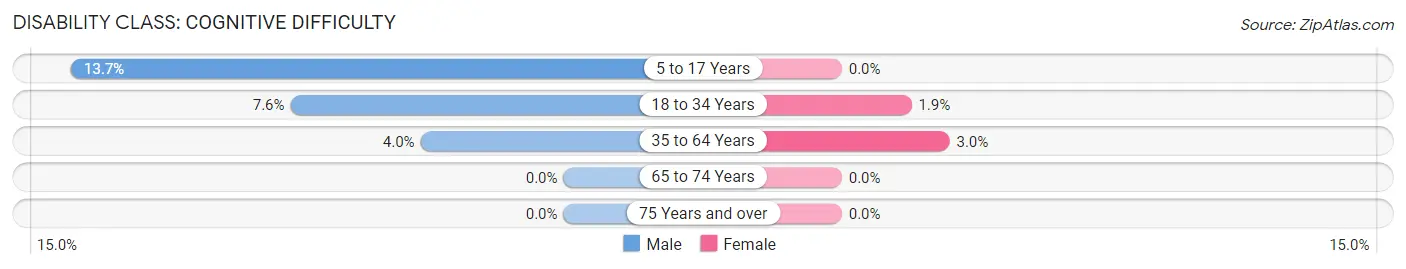
| Age Bracket | Male | Female |
| 5 to 17 Years | 119 (13.7%) | 0 (0.0%) |
| 18 to 34 Years | 64 (7.6%) | 20 (1.9%) |
| 35 to 64 Years | 56 (4.0%) | 37 (3.0%) |
| 65 to 74 Years | 0 (0.0%) | 0 (0.0%) |
| 75 Years and over | 0 (0.0%) | 0 (0.0%) |
Disability Class: Ambulatory Difficulty
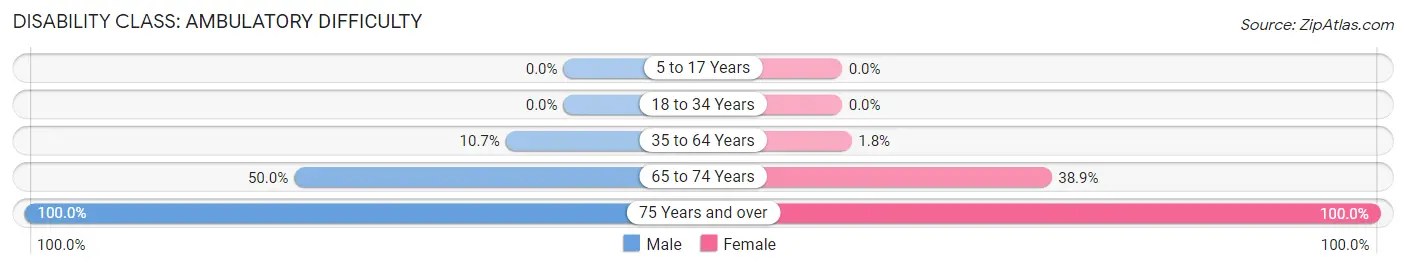
| Age Bracket | Male | Female |
| 5 to 17 Years | 0 (0.0%) | 0 (0.0%) |
| 18 to 34 Years | 0 (0.0%) | 0 (0.0%) |
| 35 to 64 Years | 151 (10.7%) | 22 (1.8%) |
| 65 to 74 Years | 39 (50.0%) | 42 (38.9%) |
| 75 Years and over | 54 (100.0%) | 25 (100.0%) |
Disability Class: Self-Care Difficulty
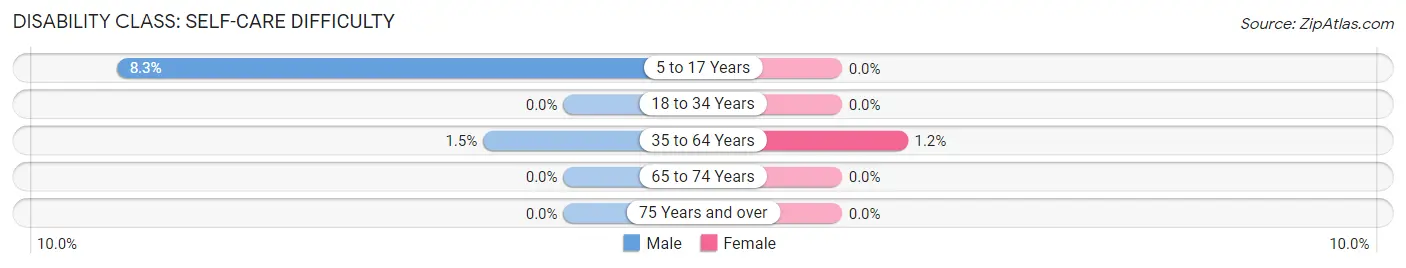
| Age Bracket | Male | Female |
| 5 to 17 Years | 72 (8.3%) | 0 (0.0%) |
| 18 to 34 Years | 0 (0.0%) | 0 (0.0%) |
| 35 to 64 Years | 21 (1.5%) | 15 (1.2%) |
| 65 to 74 Years | 0 (0.0%) | 0 (0.0%) |
| 75 Years and over | 0 (0.0%) | 0 (0.0%) |
Technology Access in Harrisburg
Computing Device Access in Harrisburg
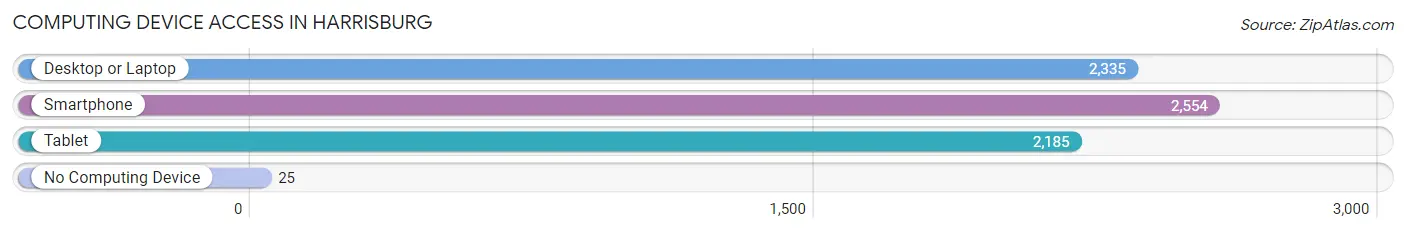
| Device Type | # Households | % Households |
| Desktop or Laptop | 2,335 | 88.4% |
| Smartphone | 2,554 | 96.7% |
| Tablet | 2,185 | 82.7% |
| No Computing Device | 25 | 0.9% |
| Total | 2,642 | 100.0% |
Internet Access in Harrisburg
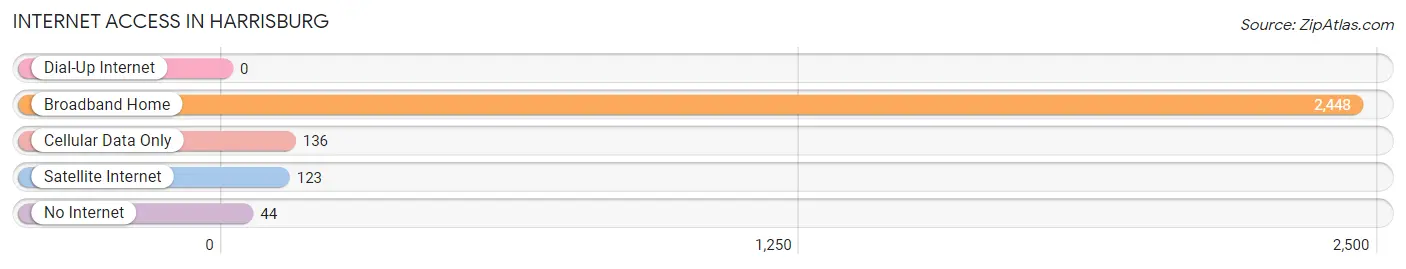
| Internet Type | # Households | % Households |
| Dial-Up Internet | 0 | 0.0% |
| Broadband Home | 2,448 | 92.7% |
| Cellular Data Only | 136 | 5.1% |
| Satellite Internet | 123 | 4.7% |
| No Internet | 44 | 1.7% |
| Total | 2,642 | 100.0% |
Harrisburg Summary
Harrisburg, South Dakota is a small city located in Lincoln County, just south of Sioux Falls. The city was founded in 1883 and has a population of approximately 4,000 people. The city is known for its small-town charm and is a popular destination for visitors looking to explore the area’s history and culture.
History
The area that is now Harrisburg was first settled in 1883 by a group of settlers from Wisconsin. The city was named after Harrisburg, Pennsylvania, and was incorporated in 1885. The city was originally a farming community, but it soon developed into a small industrial center. The city was home to several factories, including a flour mill, a creamery, and a brickyard.
In the early 1900s, Harrisburg experienced a period of growth and prosperity. The city was home to several businesses, including a bank, a hotel, and a movie theater. The city also had a thriving agricultural industry, with several farms located in the area.
In the 1950s, Harrisburg began to experience a decline in population and economic activity. The city’s factories began to close, and many of the businesses in the city shut down. The city’s population decreased from 4,000 in 1950 to 2,500 in 2000.
Geography
Harrisburg is located in the southeastern corner of South Dakota, just south of Sioux Falls. The city is situated on the Big Sioux River, which flows through the city. The city is surrounded by rolling hills and farmland. The city is located in the Central Plains region of the United States, and the climate is characterized by hot summers and cold winters.
Economy
Harrisburg’s economy is largely based on agriculture and manufacturing. The city is home to several farms, which produce corn, soybeans, and other crops. The city is also home to several manufacturing companies, which produce a variety of products, including furniture, clothing, and electronics.
The city is also home to several retail stores, restaurants, and other businesses. The city is home to several banks, which provide financial services to the local community.
Demographics
As of the 2010 census, the population of Harrisburg was 4,000. The city is predominantly white, with approximately 90% of the population identifying as white. The city is also home to a small Hispanic population, with approximately 5% of the population identifying as Hispanic. The city is also home to a small African American population, with approximately 2% of the population identifying as African American.
The median household income in Harrisburg is approximately $50,000, and the median home value is approximately $150,000. The city has a low unemployment rate, with approximately 4% of the population unemployed.
Harrisburg is a small city with a rich history and a vibrant economy. The city is home to several businesses, farms, and manufacturing companies, and it is a popular destination for visitors looking to explore the area’s history and culture. The city is also home to a diverse population, with a variety of ethnic and racial backgrounds.
Common Questions
What is Per Capita Income in Harrisburg?
Per Capita income in Harrisburg is $37,475.
What is the Median Family Income in Harrisburg?
Median Family Income in Harrisburg is $102,054.
What is the Median Household income in Harrisburg?
Median Household Income in Harrisburg is $89,966.
What is Income or Wage Gap in Harrisburg?
Income or Wage Gap in Harrisburg is 36.2%.
Women in Harrisburg earn 63.8 cents for every dollar earned by a man.
What is Inequality or Gini Index in Harrisburg?
Inequality or Gini Index in Harrisburg is 0.28.
What is the Total Population of Harrisburg?
Total Population of Harrisburg is 7,157.
What is the Total Male Population of Harrisburg?
Total Male Population of Harrisburg is 3,623.
What is the Total Female Population of Harrisburg?
Total Female Population of Harrisburg is 3,534.
What is the Ratio of Males per 100 Females in Harrisburg?
There are 102.52 Males per 100 Females in Harrisburg.
What is the Ratio of Females per 100 Males in Harrisburg?
There are 97.54 Females per 100 Males in Harrisburg.
What is the Median Population Age in Harrisburg?
Median Population Age in Harrisburg is 30.8 Years.
What is the Average Family Size in Harrisburg
Average Family Size in Harrisburg is 3.0 People.
What is the Average Household Size in Harrisburg
Average Household Size in Harrisburg is 2.7 People.
How Large is the Labor Force in Harrisburg?
There are 4,320 People in the Labor Forcein in Harrisburg.
What is the Percentage of People in the Labor Force in Harrisburg?
88.5% of People are in the Labor Force in Harrisburg.
What is the Unemployment Rate in Harrisburg?
Unemployment Rate in Harrisburg is 0.8%.