Suwanee, GA Map & Demographics
Suwanee Map
Suwanee Overview
$47,763
PER CAPITA INCOME
$115,713
AVG FAMILY INCOME
$100,780
AVG HOUSEHOLD INCOME
42.5%
WAGE / INCOME GAP [ % ]
57.5¢/ $1
WAGE / INCOME GAP [ $ ]
0.41
INEQUALITY / GINI INDEX
21,238
TOTAL POPULATION
10,032
MALE POPULATION
11,206
FEMALE POPULATION
89.52
MALES / 100 FEMALES
111.70
FEMALES / 100 MALES
37.9
MEDIAN AGE
3.4
AVG FAMILY SIZE
2.7
AVG HOUSEHOLD SIZE
13,090
LABOR FORCE [ PEOPLE ]
77.0%
PERCENT IN LABOR FORCE
5.0%
UNEMPLOYMENT RATE
Suwanee Zip Codes
Income in Suwanee
Income Overview in Suwanee
Per Capita Income in Suwanee is $47,763, while median incomes of families and households are $115,713 and $100,780 respectively.
| Characteristic | Number | Measure |
| Per Capita Income | 21,238 | $47,763 |
| Median Family Income | 5,383 | $115,713 |
| Mean Family Income | 5,383 | $139,942 |
| Median Household Income | 7,847 | $100,780 |
| Mean Household Income | 7,847 | $127,311 |
| Income Deficit | 5,383 | $0 |
| Wage / Income Gap (%) | 21,238 | 42.48% |
| Wage / Income Gap ($) | 21,238 | 57.52¢ per $1 |
| Gini / Inequality Index | 21,238 | 0.41 |
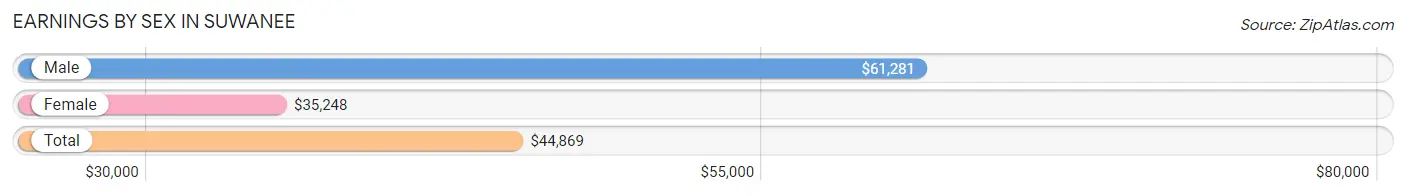
Earnings by Sex in Suwanee
Average Earnings in Suwanee are $44,869, $61,281 for men and $35,248 for women, a difference of 42.5%.
| Sex | Number | Average Earnings |
| Male | 6,781 (50.1%) | $61,281 |
| Female | 6,764 (49.9%) | $35,248 |
| Total | 13,545 (100.0%) | $44,869 |
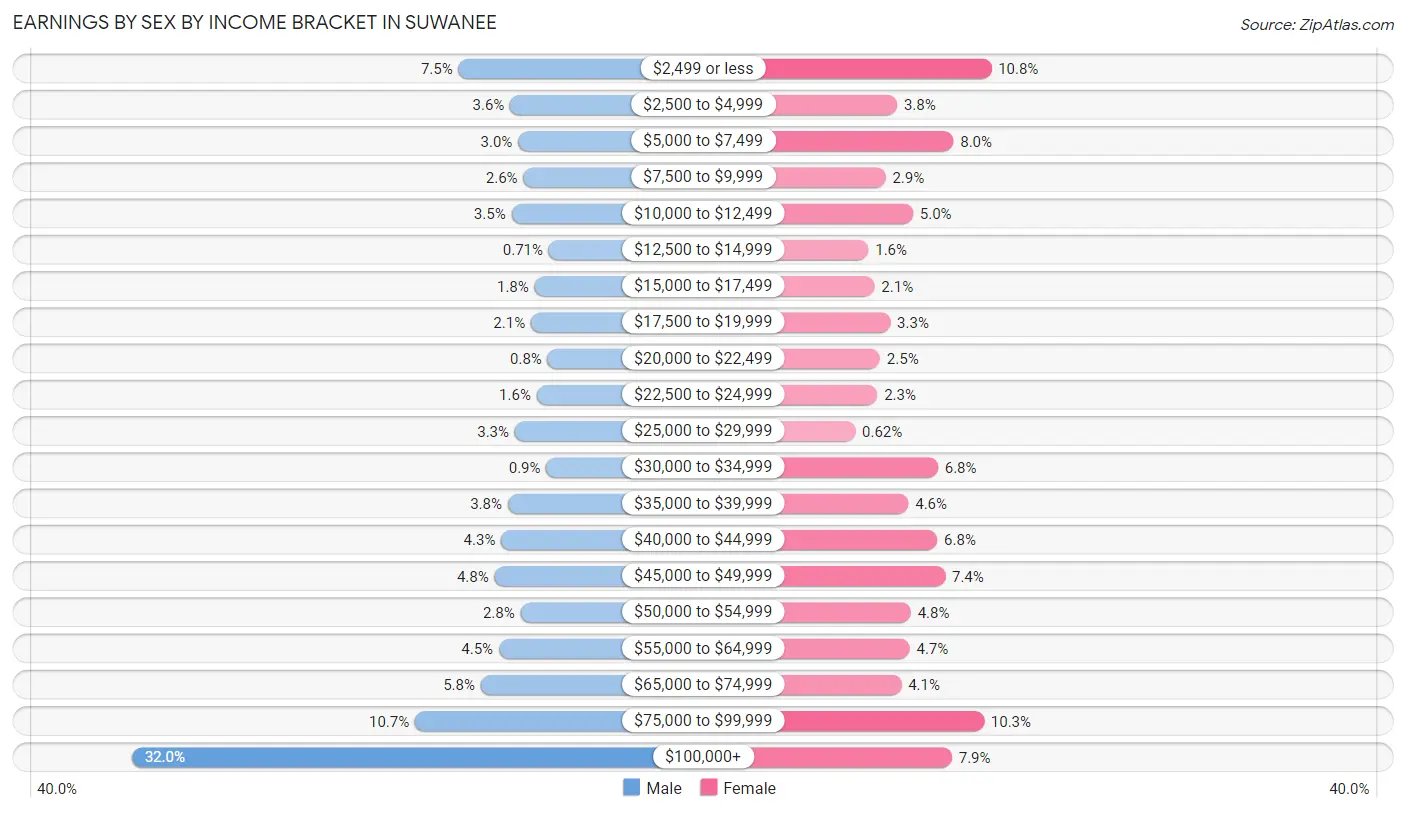
Earnings by Sex by Income Bracket in Suwanee
The most common earnings brackets in Suwanee are $100,000+ for men (2,168 | 32.0%) and $2,499 or less for women (732 | 10.8%).
| Income | Male | Female |
| $2,499 or less | 507 (7.5%) | 732 (10.8%) |
| $2,500 to $4,999 | 245 (3.6%) | 254 (3.8%) |
| $5,000 to $7,499 | 204 (3.0%) | 540 (8.0%) |
| $7,500 to $9,999 | 178 (2.6%) | 196 (2.9%) |
| $10,000 to $12,499 | 238 (3.5%) | 335 (5.0%) |
| $12,500 to $14,999 | 48 (0.7%) | 109 (1.6%) |
| $15,000 to $17,499 | 121 (1.8%) | 140 (2.1%) |
| $17,500 to $19,999 | 139 (2.1%) | 220 (3.3%) |
| $20,000 to $22,499 | 54 (0.8%) | 168 (2.5%) |
| $22,500 to $24,999 | 110 (1.6%) | 154 (2.3%) |
| $25,000 to $29,999 | 221 (3.3%) | 42 (0.6%) |
| $30,000 to $34,999 | 61 (0.9%) | 461 (6.8%) |
| $35,000 to $39,999 | 257 (3.8%) | 312 (4.6%) |
| $40,000 to $44,999 | 290 (4.3%) | 458 (6.8%) |
| $45,000 to $49,999 | 324 (4.8%) | 498 (7.4%) |
| $50,000 to $54,999 | 192 (2.8%) | 324 (4.8%) |
| $55,000 to $64,999 | 302 (4.4%) | 318 (4.7%) |
| $65,000 to $74,999 | 394 (5.8%) | 276 (4.1%) |
| $75,000 to $99,999 | 728 (10.7%) | 695 (10.3%) |
| $100,000+ | 2,168 (32.0%) | 532 (7.9%) |
| Total | 6,781 (100.0%) | 6,764 (100.0%) |
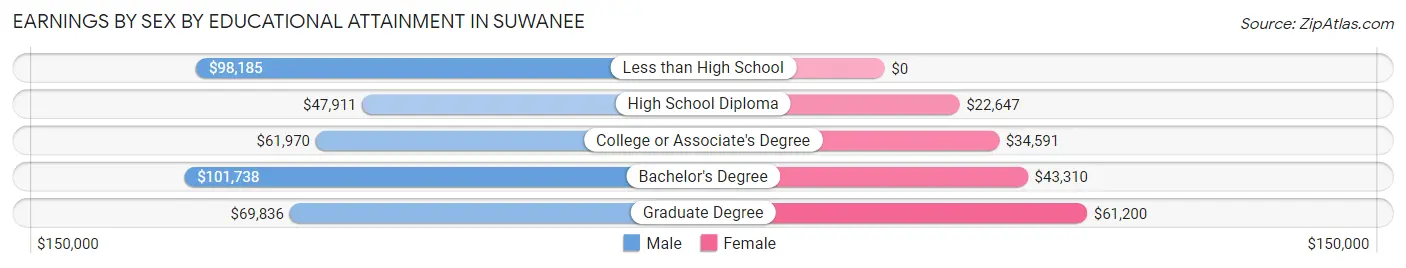
Earnings by Sex by Educational Attainment in Suwanee
Average earnings in Suwanee are $80,653 for men and $43,785 for women, a difference of 45.7%. Men with an educational attainment of bachelor's degree enjoy the highest average annual earnings of $101,738, while those with high school diploma education earn the least with $47,911. Women with an educational attainment of graduate degree earn the most with the average annual earnings of $61,200, while those with high school diploma education have the smallest earnings of $22,647.
| Educational Attainment | Male Income | Female Income |
| Less than High School | $98,185 | $0 |
| High School Diploma | $47,911 | $22,647 |
| College or Associate's Degree | $61,970 | $34,591 |
| Bachelor's Degree | $101,738 | $43,310 |
| Graduate Degree | $69,836 | $61,200 |
| Total | $80,653 | $43,785 |
Family Income in Suwanee
Family Income Brackets in Suwanee
According to the Suwanee family income data, there are 1,416 families falling into the $100,000 to $149,999 income range, which is the most common income bracket and makes up 26.3% of all families. Conversely, the $25,000 to $34,999 income bracket is the least frequent group with only 43 families (0.8%) belonging to this category.
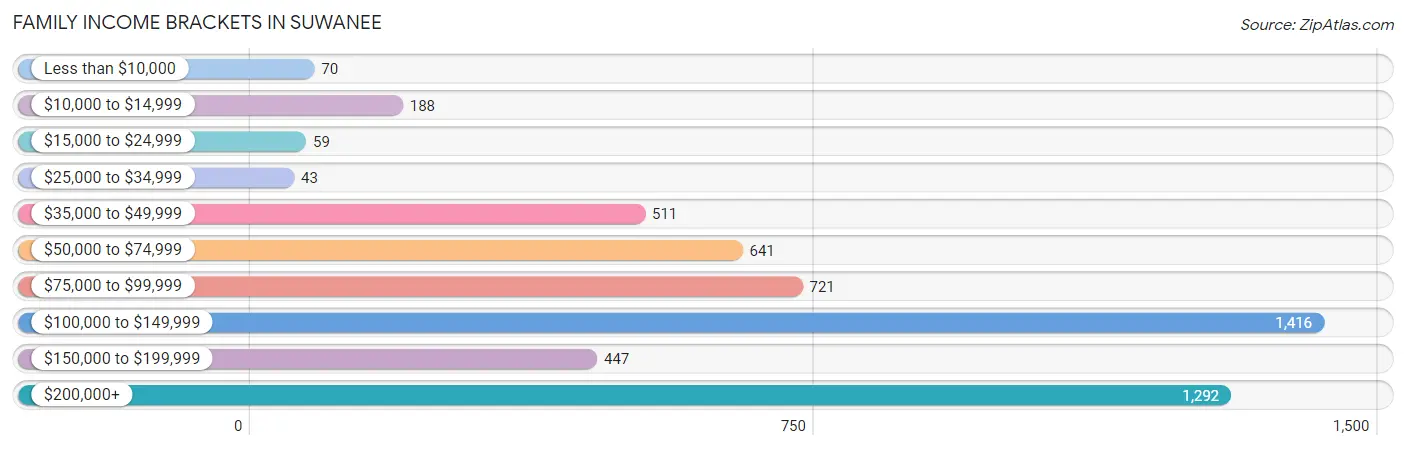
| Income Bracket | # Families | % Families |
| Less than $10,000 | 70 | 1.3% |
| $10,000 to $14,999 | 188 | 3.5% |
| $15,000 to $24,999 | 59 | 1.1% |
| $25,000 to $34,999 | 43 | 0.8% |
| $35,000 to $49,999 | 511 | 9.5% |
| $50,000 to $74,999 | 641 | 11.9% |
| $75,000 to $99,999 | 721 | 13.4% |
| $100,000 to $149,999 | 1,416 | 26.3% |
| $150,000 to $199,999 | 447 | 8.3% |
| $200,000+ | 1,292 | 24.0% |
Family Income by Famaliy Size in Suwanee
7+ person families (79 | 1.5%) account for the highest median family income in Suwanee with $250,001 per family, while 2-person families (1,763 | 32.8%) have the highest median income of $43,373 per family member.
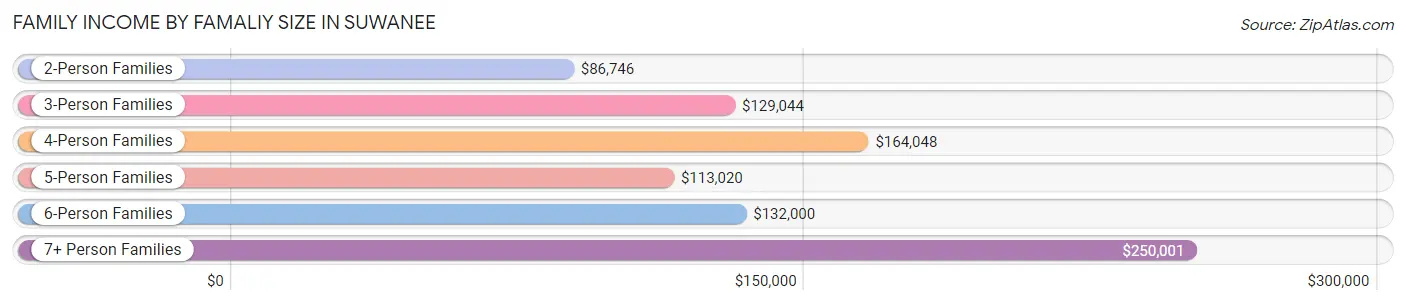
| Income Bracket | # Families | Median Income |
| 2-Person Families | 1,763 (32.8%) | $86,746 |
| 3-Person Families | 1,641 (30.5%) | $129,044 |
| 4-Person Families | 1,246 (23.2%) | $164,048 |
| 5-Person Families | 624 (11.6%) | $113,020 |
| 6-Person Families | 30 (0.6%) | $132,000 |
| 7+ Person Families | 79 (1.5%) | $250,001 |
| Total | 5,383 (100.0%) | $115,713 |
Family Income by Number of Earners in Suwanee
The median family income in Suwanee is $115,713, with families comprising 3+ earners (1,078) having the highest median family income of $173,667, while families with no earners (413) have the lowest median family income of $54,926, accounting for 20.0% and 7.7% of families, respectively.
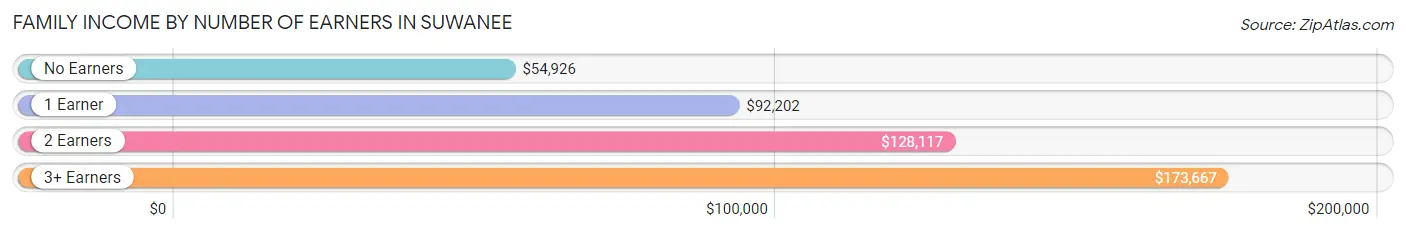
| Number of Earners | # Families | Median Income |
| No Earners | 413 (7.7%) | $54,926 |
| 1 Earner | 1,293 (24.0%) | $92,202 |
| 2 Earners | 2,599 (48.3%) | $128,117 |
| 3+ Earners | 1,078 (20.0%) | $173,667 |
| Total | 5,383 (100.0%) | $115,713 |
Household Income in Suwanee
Household Income Brackets in Suwanee
With 1,734 households falling in the category, the $200,000+ income range is the most frequent in Suwanee, accounting for 22.1% of all households. In contrast, only 133 households (1.7%) fall into the $25,000 to $34,999 income bracket, making it the least populous group.
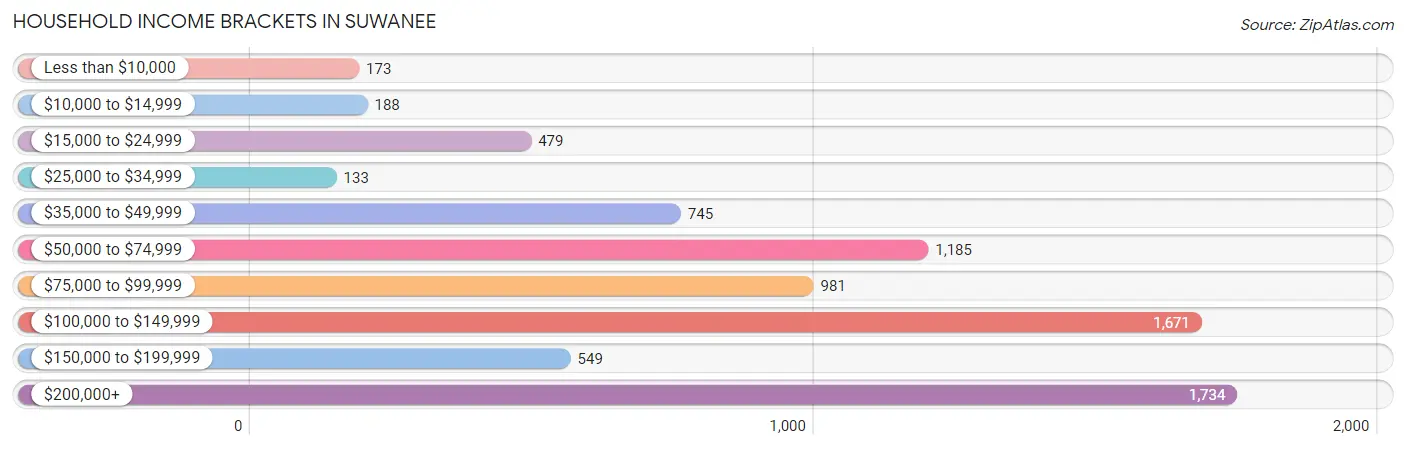
| Income Bracket | # Households | % Households |
| Less than $10,000 | 173 | 2.2% |
| $10,000 to $14,999 | 188 | 2.4% |
| $15,000 to $24,999 | 479 | 6.1% |
| $25,000 to $34,999 | 133 | 1.7% |
| $35,000 to $49,999 | 745 | 9.5% |
| $50,000 to $74,999 | 1,185 | 15.1% |
| $75,000 to $99,999 | 981 | 12.5% |
| $100,000 to $149,999 | 1,671 | 21.3% |
| $150,000 to $199,999 | 549 | 7.0% |
| $200,000+ | 1,734 | 22.1% |
Household Income by Householder Age in Suwanee
The median household income in Suwanee is $100,780, with the highest median household income of $125,861 found in the 45 to 64 years age bracket for the primary householder. A total of 3,867 households (49.3%) fall into this category. Meanwhile, the 15 to 24 years age bracket for the primary householder has the lowest median household income of $0, with 520 households (6.6%) in this group.
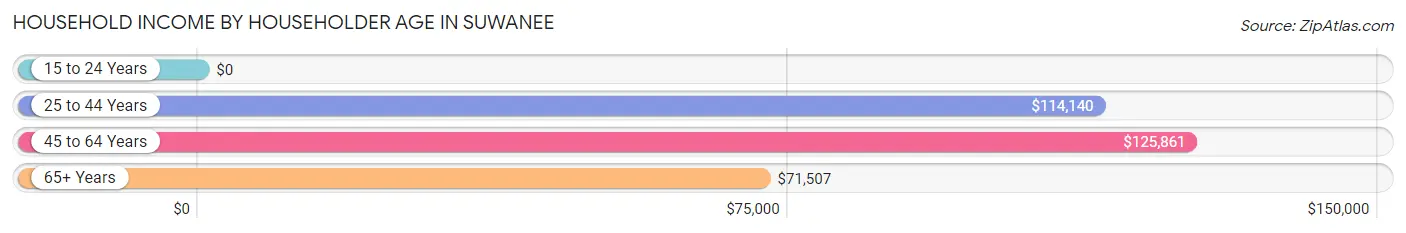
| Income Bracket | # Households | Median Income |
| 15 to 24 Years | 520 (6.6%) | $0 |
| 25 to 44 Years | 2,440 (31.1%) | $114,140 |
| 45 to 64 Years | 3,867 (49.3%) | $125,861 |
| 65+ Years | 1,020 (13.0%) | $71,507 |
| Total | 7,847 (100.0%) | $100,780 |
Poverty in Suwanee
Income Below Poverty by Sex and Age in Suwanee
With 10.3% poverty level for males and 8.7% for females among the residents of Suwanee, 6 to 11 year old males and 18 to 24 year old females are the most vulnerable to poverty, with 249 males (33.0%) and 386 females (29.2%) in their respective age groups living below the poverty level.
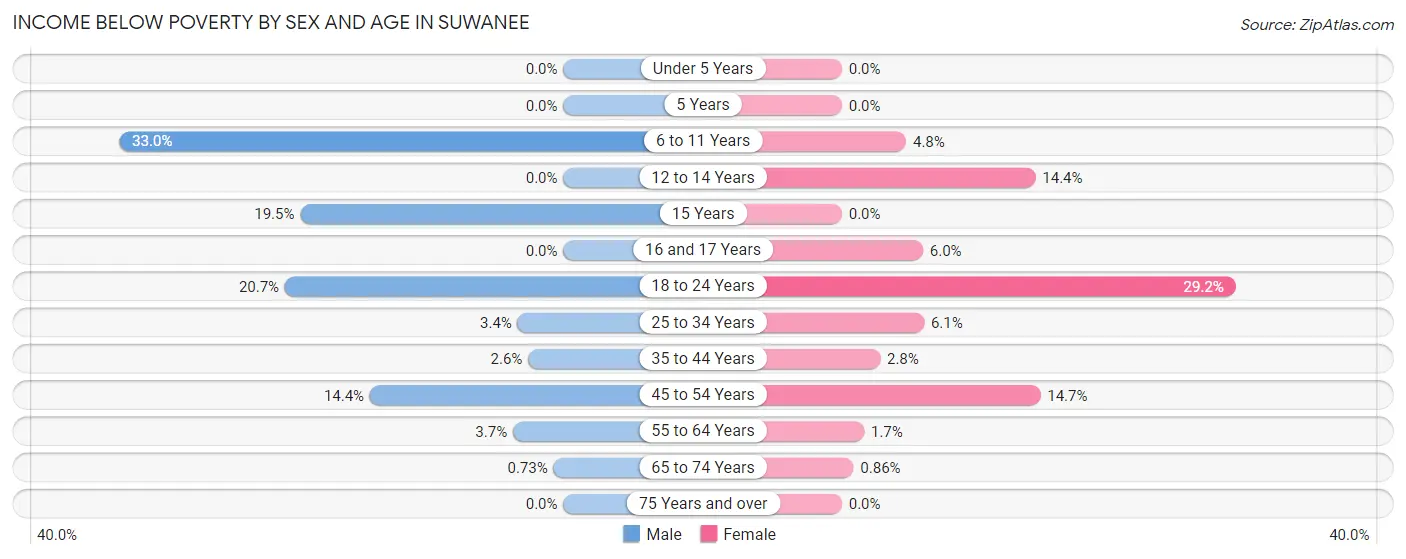
| Age Bracket | Male | Female |
| Under 5 Years | 0 (0.0%) | 0 (0.0%) |
| 5 Years | 0 (0.0%) | 0 (0.0%) |
| 6 to 11 Years | 249 (33.0%) | 56 (4.8%) |
| 12 to 14 Years | 0 (0.0%) | 95 (14.4%) |
| 15 Years | 25 (19.5%) | 0 (0.0%) |
| 16 and 17 Years | 0 (0.0%) | 21 (6.0%) |
| 18 to 24 Years | 323 (20.7%) | 386 (29.2%) |
| 25 to 34 Years | 32 (3.4%) | 79 (6.1%) |
| 35 to 44 Years | 30 (2.6%) | 46 (2.8%) |
| 45 to 54 Years | 318 (14.4%) | 263 (14.7%) |
| 55 to 64 Years | 50 (3.7%) | 23 (1.7%) |
| 65 to 74 Years | 4 (0.7%) | 5 (0.9%) |
| 75 Years and over | 0 (0.0%) | 0 (0.0%) |
| Total | 1,031 (10.3%) | 974 (8.7%) |
Income Above Poverty by Sex and Age in Suwanee
According to the poverty statistics in Suwanee, males aged under 5 years and females aged under 5 years are the age groups that are most secure financially, with 100.0% of males and 100.0% of females in these age groups living above the poverty line.
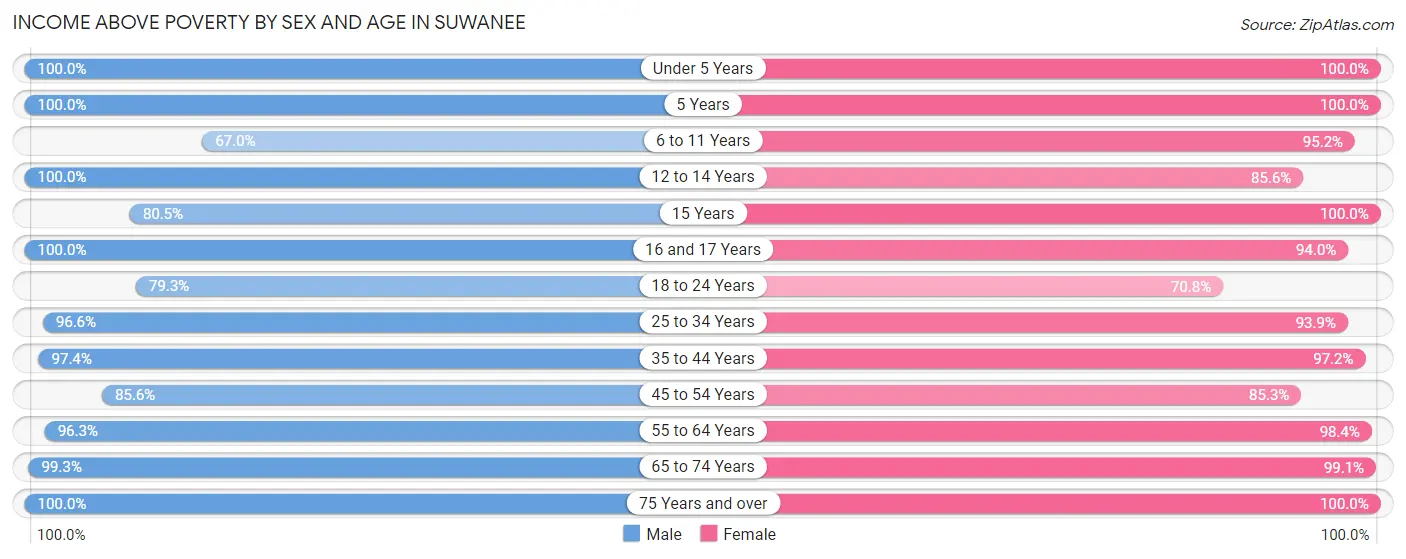
| Age Bracket | Male | Female |
| Under 5 Years | 575 (100.0%) | 390 (100.0%) |
| 5 Years | 94 (100.0%) | 177 (100.0%) |
| 6 to 11 Years | 506 (67.0%) | 1,117 (95.2%) |
| 12 to 14 Years | 162 (100.0%) | 566 (85.6%) |
| 15 Years | 103 (80.5%) | 123 (100.0%) |
| 16 and 17 Years | 287 (100.0%) | 328 (94.0%) |
| 18 to 24 Years | 1,240 (79.3%) | 934 (70.8%) |
| 25 to 34 Years | 911 (96.6%) | 1,216 (93.9%) |
| 35 to 44 Years | 1,118 (97.4%) | 1,576 (97.2%) |
| 45 to 54 Years | 1,896 (85.6%) | 1,521 (85.3%) |
| 55 to 64 Years | 1,287 (96.3%) | 1,371 (98.4%) |
| 65 to 74 Years | 543 (99.3%) | 577 (99.1%) |
| 75 Years and over | 271 (100.0%) | 320 (100.0%) |
| Total | 8,993 (89.7%) | 10,216 (91.3%) |
Income Below Poverty Among Married-Couple Families in Suwanee
The poverty statistics for married-couple families in Suwanee show that 6.9% or 289 of the total 4,218 families live below the poverty line. Families with 1 or 2 children have the highest poverty rate of 14.5%, comprising of 269 families. On the other hand, families with 3 or 4 children have the lowest poverty rate of 0.0%, which includes 0 families.
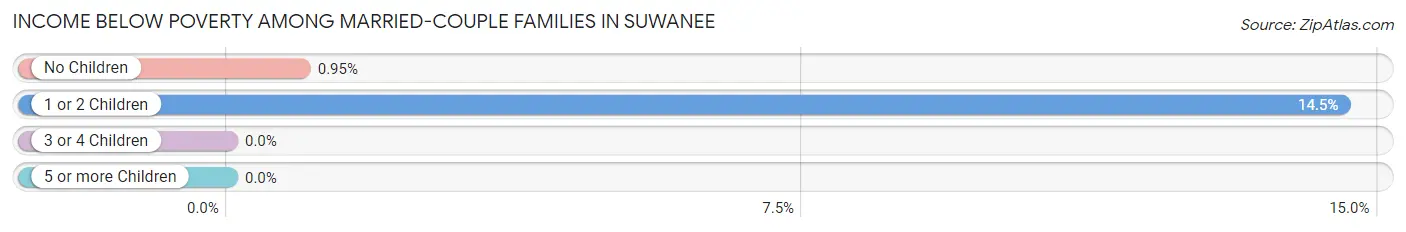
| Children | Above Poverty | Below Poverty |
| No Children | 2,079 (99.1%) | 20 (0.9%) |
| 1 or 2 Children | 1,584 (85.5%) | 269 (14.5%) |
| 3 or 4 Children | 266 (100.0%) | 0 (0.0%) |
| 5 or more Children | 0 (0.0%) | 0 (0.0%) |
| Total | 3,929 (93.1%) | 289 (6.9%) |
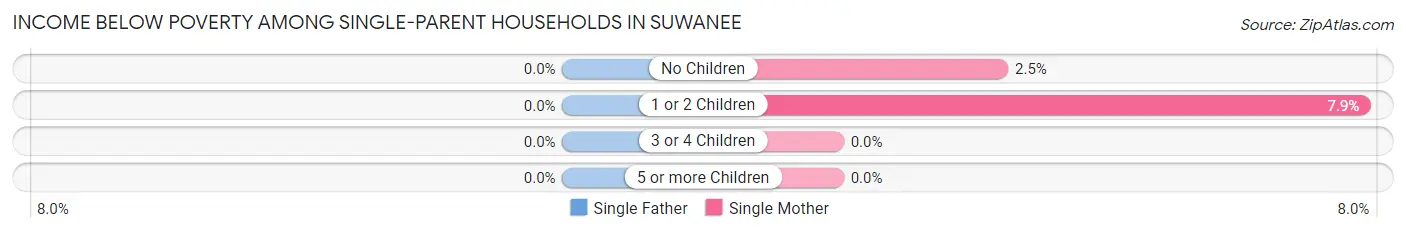
Income Below Poverty Among Single-Parent Households in Suwanee
| Children | Single Father | Single Mother |
| No Children | 0 (0.0%) | 7 (2.5%) |
| 1 or 2 Children | 0 (0.0%) | 39 (7.9%) |
| 3 or 4 Children | 0 (0.0%) | 0 (0.0%) |
| 5 or more Children | 0 (0.0%) | 0 (0.0%) |
| Total | 0 (0.0%) | 46 (5.9%) |
Income Below Poverty Among Married-Couple vs Single-Parent Households in Suwanee
The poverty data for Suwanee shows that 289 of the married-couple family households (6.9%) and 46 of the single-parent households (4.0%) are living below the poverty level. Within the married-couple family households, those with 1 or 2 children have the highest poverty rate, with 269 households (14.5%) falling below the poverty line. Among the single-parent households, those with 1 or 2 children have the highest poverty rate, with 39 household (7.0%) living below poverty.
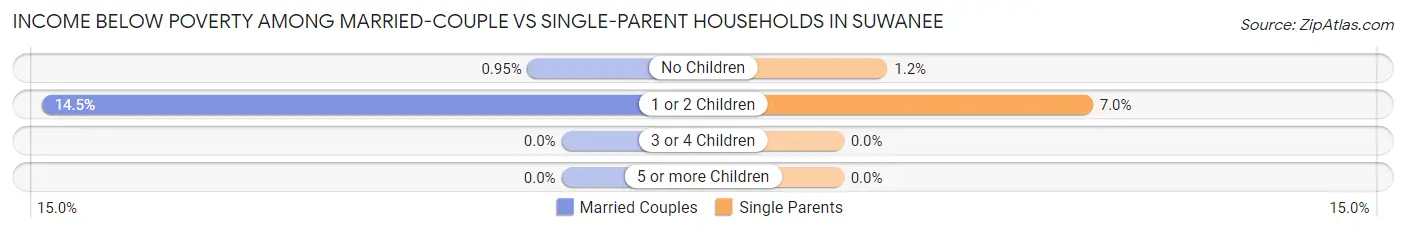
| Children | Married-Couple Families | Single-Parent Households |
| No Children | 20 (0.9%) | 7 (1.2%) |
| 1 or 2 Children | 269 (14.5%) | 39 (7.0%) |
| 3 or 4 Children | 0 (0.0%) | 0 (0.0%) |
| 5 or more Children | 0 (0.0%) | 0 (0.0%) |
| Total | 289 (6.9%) | 46 (4.0%) |
Race in Suwanee
The most populous races in Suwanee are White / Caucasian (11,891 | 56.0%), Asian (5,191 | 24.4%), and Black / African American (2,689 | 12.7%).
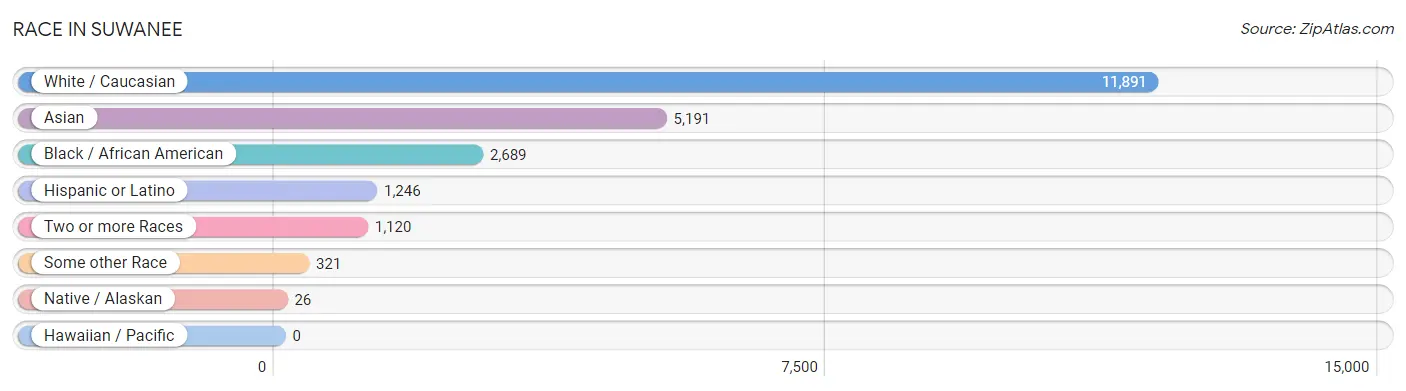
| Race | # Population | % Population |
| Asian | 5,191 | 24.4% |
| Black / African American | 2,689 | 12.7% |
| Hawaiian / Pacific | 0 | 0.0% |
| Hispanic or Latino | 1,246 | 5.9% |
| Native / Alaskan | 26 | 0.1% |
| White / Caucasian | 11,891 | 56.0% |
| Two or more Races | 1,120 | 5.3% |
| Some other Race | 321 | 1.5% |
| Total | 21,238 | 100.0% |
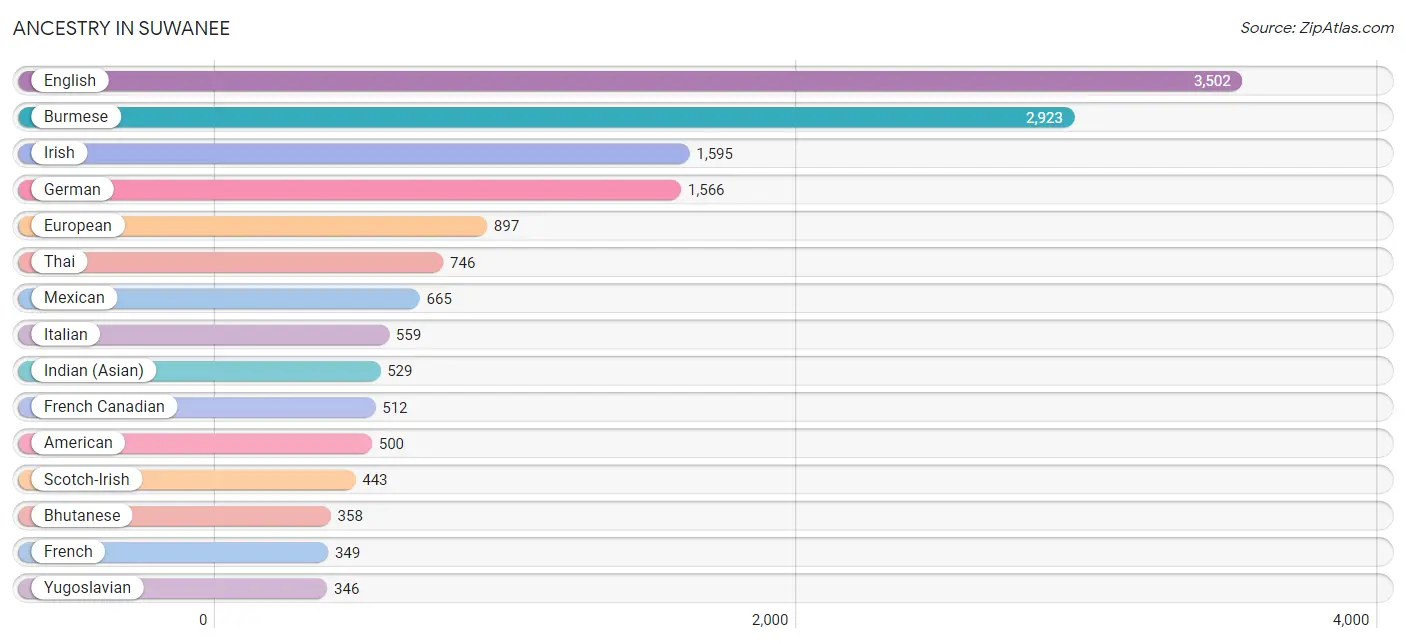
Ancestry in Suwanee
The most populous ancestries reported in Suwanee are English (3,502 | 16.5%), Burmese (2,923 | 13.8%), Irish (1,595 | 7.5%), German (1,566 | 7.4%), and European (897 | 4.2%), together accounting for 49.3% of all Suwanee residents.
| Ancestry | # Population | % Population |
| African | 284 | 1.3% |
| Albanian | 24 | 0.1% |
| American | 500 | 2.4% |
| Apache | 29 | 0.1% |
| Australian | 6 | 0.0% |
| Bahamian | 158 | 0.7% |
| Barbadian | 12 | 0.1% |
| Belgian | 48 | 0.2% |
| Bhutanese | 358 | 1.7% |
| British | 70 | 0.3% |
| Burmese | 2,923 | 13.8% |
| Canadian | 176 | 0.8% |
| Central American | 50 | 0.2% |
| Cherokee | 26 | 0.1% |
| Colombian | 88 | 0.4% |
| Costa Rican | 32 | 0.2% |
| Cuban | 50 | 0.2% |
| Czech | 14 | 0.1% |
| Czechoslovakian | 8 | 0.0% |
| Danish | 77 | 0.4% |
| Dominican | 31 | 0.2% |
| Dutch | 152 | 0.7% |
| Eastern European | 6 | 0.0% |
| English | 3,502 | 16.5% |
| European | 897 | 4.2% |
| Finnish | 39 | 0.2% |
| French | 349 | 1.6% |
| French Canadian | 512 | 2.4% |
| German | 1,566 | 7.4% |
| Haitian | 116 | 0.5% |
| Hungarian | 128 | 0.6% |
| Indian (Asian) | 529 | 2.5% |
| Iranian | 209 | 1.0% |
| Irish | 1,595 | 7.5% |
| Italian | 559 | 2.6% |
| Jamaican | 50 | 0.2% |
| Japanese | 126 | 0.6% |
| Korean | 18 | 0.1% |
| Laotian | 58 | 0.3% |
| Lithuanian | 104 | 0.5% |
| Mexican | 665 | 3.1% |
| Native Hawaiian | 44 | 0.2% |
| Northern European | 88 | 0.4% |
| Norwegian | 128 | 0.6% |
| Pakistani | 41 | 0.2% |
| Pennsylvania German | 23 | 0.1% |
| Peruvian | 13 | 0.1% |
| Polish | 302 | 1.4% |
| Portuguese | 10 | 0.1% |
| Puerto Rican | 235 | 1.1% |
| Romanian | 86 | 0.4% |
| Russian | 14 | 0.1% |
| Salvadoran | 18 | 0.1% |
| Scandinavian | 50 | 0.2% |
| Scotch-Irish | 443 | 2.1% |
| Scottish | 275 | 1.3% |
| South American | 161 | 0.8% |
| Spanish | 17 | 0.1% |
| Sri Lankan | 261 | 1.2% |
| Subsaharan African | 332 | 1.6% |
| Swedish | 104 | 0.5% |
| Thai | 746 | 3.5% |
| Trinidadian and Tobagonian | 120 | 0.6% |
| Turkish | 58 | 0.3% |
| Venezuelan | 60 | 0.3% |
| Vietnamese | 234 | 1.1% |
| Welsh | 70 | 0.3% |
| Yugoslavian | 346 | 1.6% | View All 68 Rows |
Immigrants in Suwanee
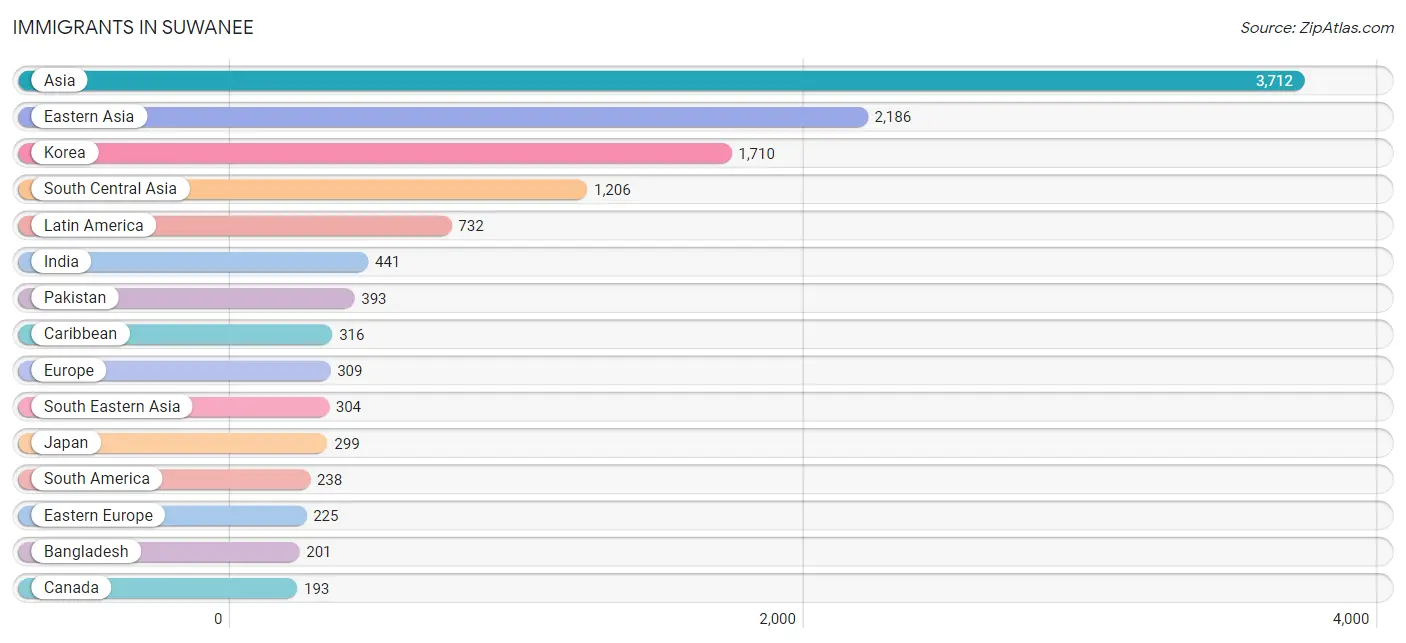
The most numerous immigrant groups reported in Suwanee came from Asia (3,712 | 17.5%), Eastern Asia (2,186 | 10.3%), Korea (1,710 | 8.1%), South Central Asia (1,206 | 5.7%), and Latin America (732 | 3.5%), together accounting for 45.0% of all Suwanee residents.
| Immigration Origin | # Population | % Population |
| Africa | 73 | 0.3% |
| Asia | 3,712 | 17.5% |
| Australia | 6 | 0.0% |
| Bahamas | 103 | 0.5% |
| Bangladesh | 201 | 0.9% |
| Barbados | 12 | 0.1% |
| Belgium | 15 | 0.1% |
| Bosnia and Herzegovina | 134 | 0.6% |
| Brazil | 27 | 0.1% |
| Cambodia | 60 | 0.3% |
| Canada | 193 | 0.9% |
| Caribbean | 316 | 1.5% |
| Central America | 178 | 0.8% |
| China | 177 | 0.8% |
| Colombia | 78 | 0.4% |
| Costa Rica | 16 | 0.1% |
| Dominican Republic | 31 | 0.2% |
| Eastern Africa | 73 | 0.3% |
| Eastern Asia | 2,186 | 10.3% |
| Eastern Europe | 225 | 1.1% |
| England | 31 | 0.2% |
| Europe | 309 | 1.5% |
| France | 22 | 0.1% |
| Guyana | 60 | 0.3% |
| Hong Kong | 35 | 0.2% |
| India | 441 | 2.1% |
| Indonesia | 31 | 0.2% |
| Iran | 171 | 0.8% |
| Ireland | 11 | 0.1% |
| Jamaica | 50 | 0.2% |
| Japan | 299 | 1.4% |
| Kenya | 73 | 0.3% |
| Korea | 1,710 | 8.1% |
| Latin America | 732 | 3.5% |
| Malaysia | 28 | 0.1% |
| Mexico | 162 | 0.8% |
| Northern Europe | 47 | 0.2% |
| Oceania | 6 | 0.0% |
| Pakistan | 393 | 1.8% |
| Peru | 13 | 0.1% |
| Philippines | 21 | 0.1% |
| Romania | 67 | 0.3% |
| Saudi Arabia | 16 | 0.1% |
| South America | 238 | 1.1% |
| South Central Asia | 1,206 | 5.7% |
| South Eastern Asia | 304 | 1.4% |
| Trinidad and Tobago | 120 | 0.6% |
| Venezuela | 60 | 0.3% |
| Vietnam | 164 | 0.8% |
| Western Asia | 16 | 0.1% |
| Western Europe | 37 | 0.2% | View All 51 Rows |
Sex and Age in Suwanee
Sex and Age in Suwanee
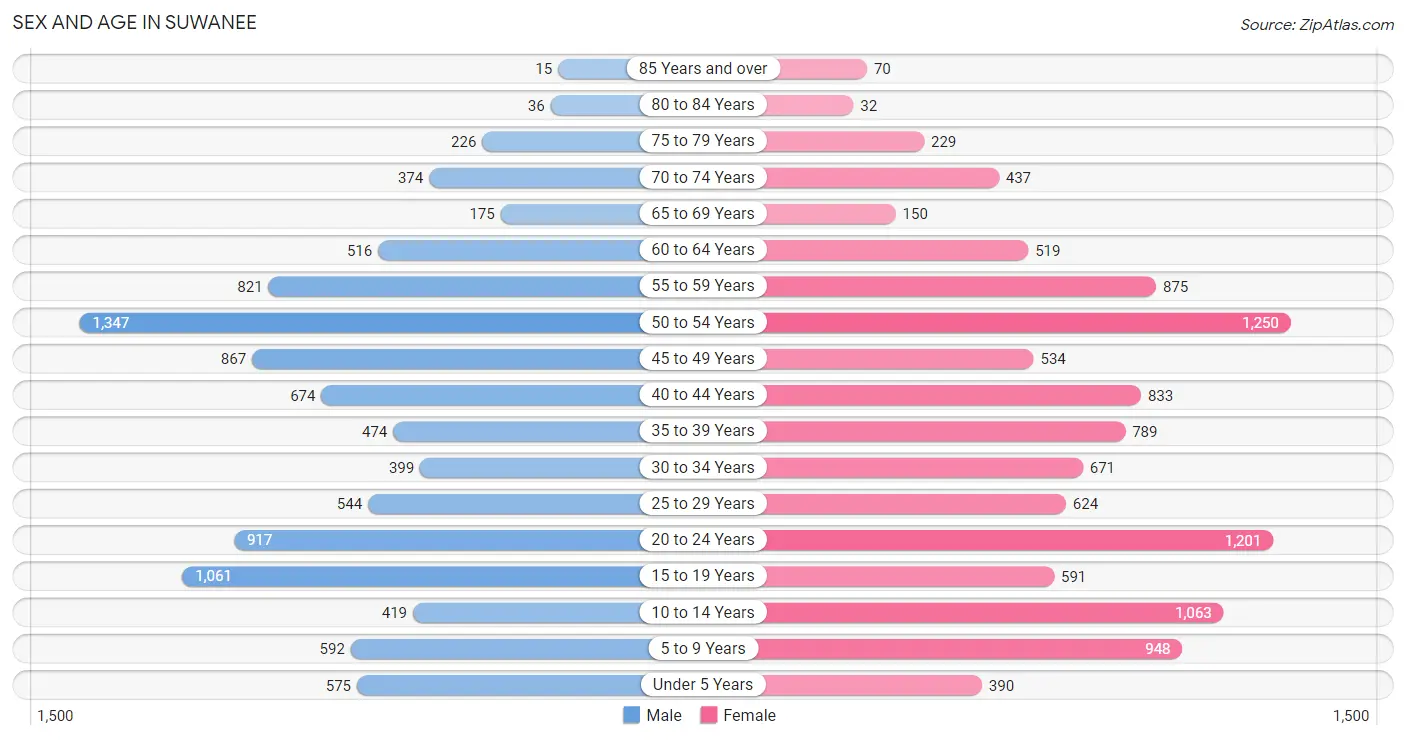
The most populous age groups in Suwanee are 50 to 54 Years (1,347 | 13.4%) for men and 50 to 54 Years (1,250 | 11.2%) for women.
| Age Bracket | Male | Female |
| Under 5 Years | 575 (5.7%) | 390 (3.5%) |
| 5 to 9 Years | 592 (5.9%) | 948 (8.5%) |
| 10 to 14 Years | 419 (4.2%) | 1,063 (9.5%) |
| 15 to 19 Years | 1,061 (10.6%) | 591 (5.3%) |
| 20 to 24 Years | 917 (9.1%) | 1,201 (10.7%) |
| 25 to 29 Years | 544 (5.4%) | 624 (5.6%) |
| 30 to 34 Years | 399 (4.0%) | 671 (6.0%) |
| 35 to 39 Years | 474 (4.7%) | 789 (7.0%) |
| 40 to 44 Years | 674 (6.7%) | 833 (7.4%) |
| 45 to 49 Years | 867 (8.6%) | 534 (4.8%) |
| 50 to 54 Years | 1,347 (13.4%) | 1,250 (11.2%) |
| 55 to 59 Years | 821 (8.2%) | 875 (7.8%) |
| 60 to 64 Years | 516 (5.1%) | 519 (4.6%) |
| 65 to 69 Years | 175 (1.7%) | 150 (1.3%) |
| 70 to 74 Years | 374 (3.7%) | 437 (3.9%) |
| 75 to 79 Years | 226 (2.2%) | 229 (2.0%) |
| 80 to 84 Years | 36 (0.4%) | 32 (0.3%) |
| 85 Years and over | 15 (0.2%) | 70 (0.6%) |
| Total | 10,032 (100.0%) | 11,206 (100.0%) |
Families and Households in Suwanee
Median Family Size in Suwanee
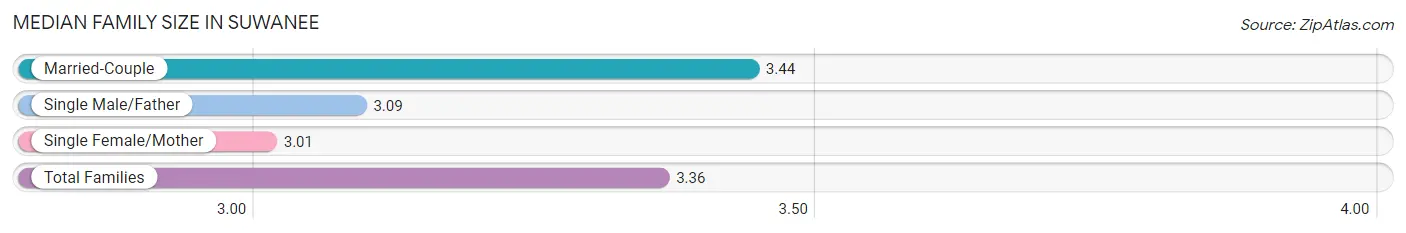
The median family size in Suwanee is 3.36 persons per family, with married-couple families (4,218 | 78.4%) accounting for the largest median family size of 3.44 persons per family. On the other hand, single female/mother families (782 | 14.5%) represent the smallest median family size with 3.01 persons per family.
| Family Type | # Families | Family Size |
| Married-Couple | 4,218 (78.4%) | 3.44 |
| Single Male/Father | 383 (7.1%) | 3.09 |
| Single Female/Mother | 782 (14.5%) | 3.01 |
| Total Families | 5,383 (100.0%) | 3.36 |
Median Household Size in Suwanee
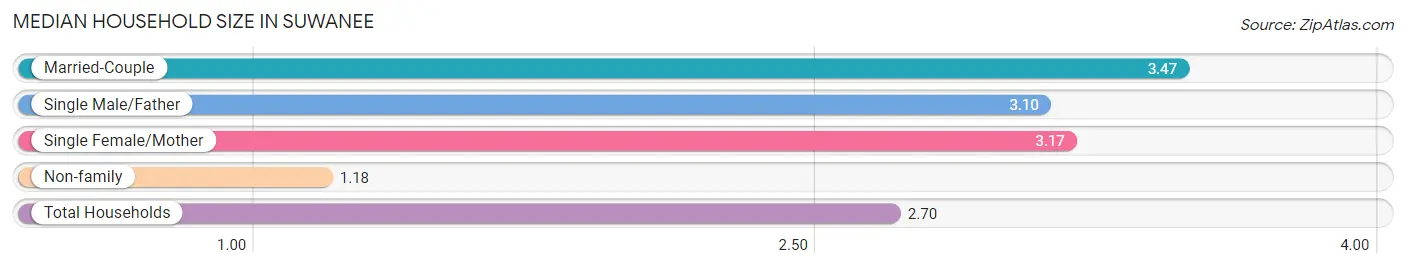
The median household size in Suwanee is 2.70 persons per household, with married-couple households (4,218 | 53.7%) accounting for the largest median household size of 3.47 persons per household. non-family households (2,464 | 31.4%) represent the smallest median household size with 1.18 persons per household.
| Household Type | # Households | Household Size |
| Married-Couple | 4,218 (53.7%) | 3.47 |
| Single Male/Father | 383 (4.9%) | 3.10 |
| Single Female/Mother | 782 (10.0%) | 3.17 |
| Non-family | 2,464 (31.4%) | 1.18 |
| Total Households | 7,847 (100.0%) | 2.70 |
Household Size by Marriage Status in Suwanee
Out of a total of 7,847 households in Suwanee, 5,383 (68.6%) are family households, while 2,464 (31.4%) are nonfamily households. The most numerous type of family households are 2-person households, comprising 1,733, and the most common type of nonfamily households are 1-person households, comprising 2,148.
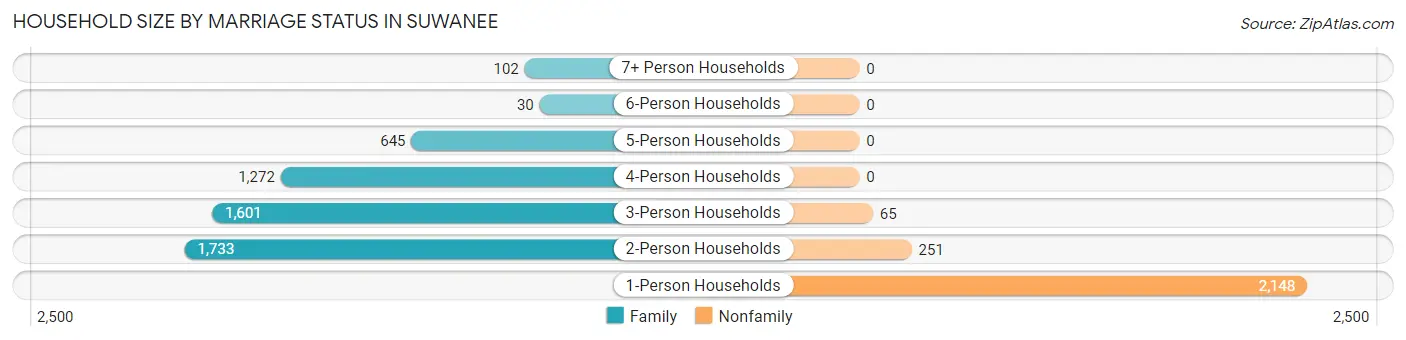
| Household Size | Family Households | Nonfamily Households |
| 1-Person Households | - | 2,148 (27.4%) |
| 2-Person Households | 1,733 (22.1%) | 251 (3.2%) |
| 3-Person Households | 1,601 (20.4%) | 65 (0.8%) |
| 4-Person Households | 1,272 (16.2%) | 0 (0.0%) |
| 5-Person Households | 645 (8.2%) | 0 (0.0%) |
| 6-Person Households | 30 (0.4%) | 0 (0.0%) |
| 7+ Person Households | 102 (1.3%) | 0 (0.0%) |
| Total | 5,383 (68.6%) | 2,464 (31.4%) |
Female Fertility in Suwanee
Fertility by Age in Suwanee
Average fertility rate in Suwanee is 27.0 births per 1,000 women. Women in the age bracket of 35 to 50 years have the highest fertility rate with 55.0 births per 1,000 women. Women in the age bracket of 35 to 50 years acount for 90.6% of all women with births.
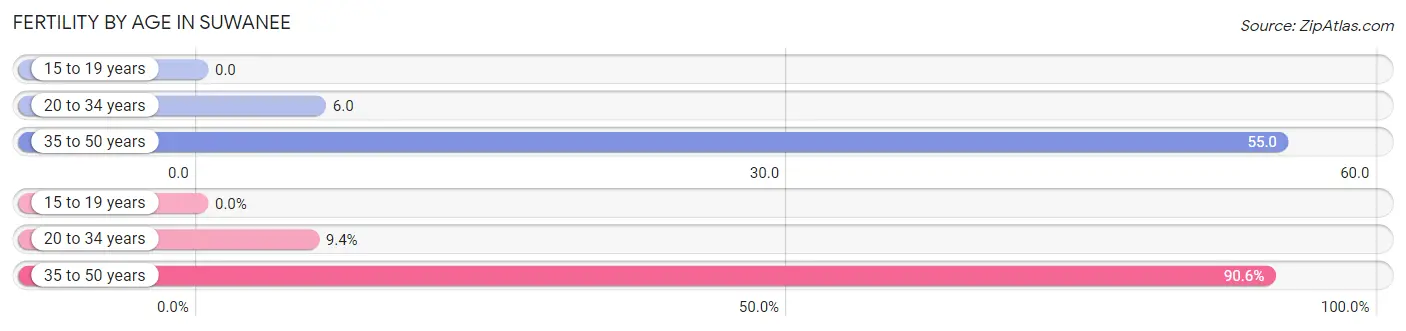
| Age Bracket | Women with Births | Births / 1,000 Women |
| 15 to 19 years | 0 (0.0%) | 0.0 |
| 20 to 34 years | 14 (9.4%) | 6.0 |
| 35 to 50 years | 135 (90.6%) | 55.0 |
| Total | 149 (100.0%) | 27.0 |
Fertility by Age by Marriage Status in Suwanee
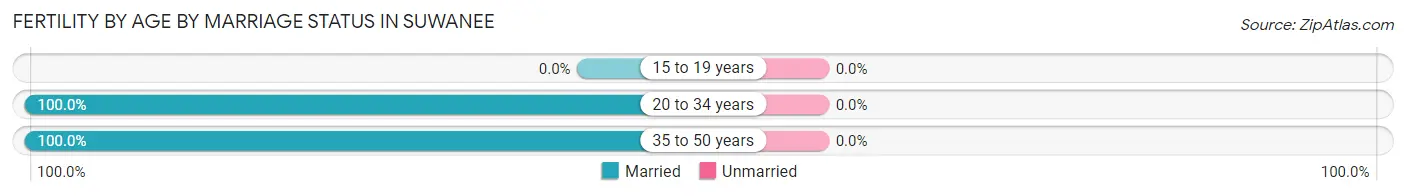
| Age Bracket | Married | Unmarried |
| 15 to 19 years | 0 (0.0%) | 0 (0.0%) |
| 20 to 34 years | 14 (100.0%) | 0 (0.0%) |
| 35 to 50 years | 135 (100.0%) | 0 (0.0%) |
| Total | 149 (100.0%) | 0 (0.0%) |
Fertility by Education in Suwanee
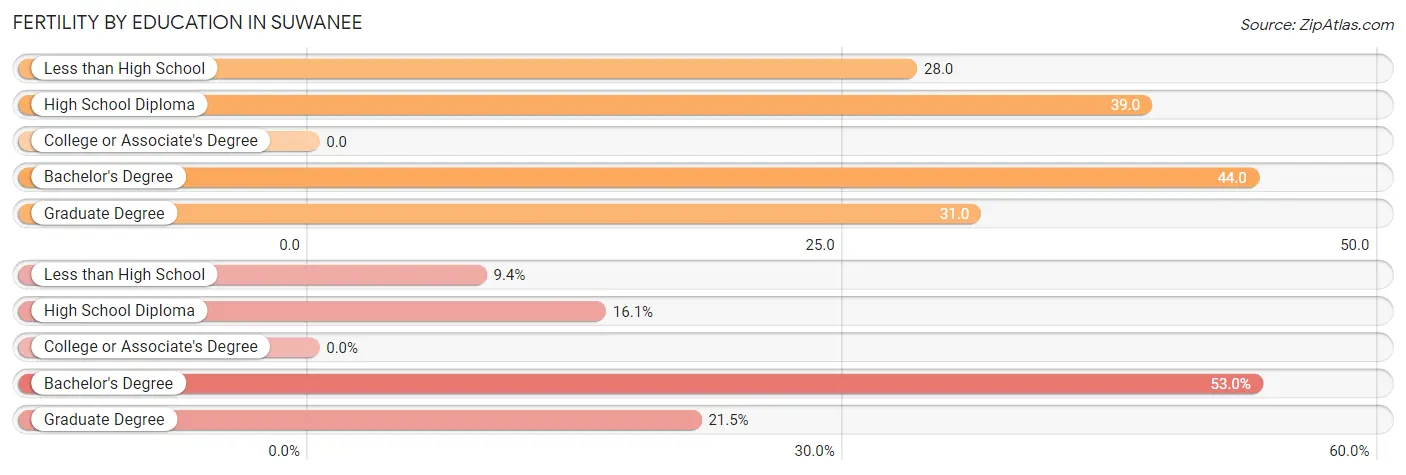
| Educational Attainment | Women with Births | Births / 1,000 Women |
| Less than High School | 14 (9.4%) | 28.0 |
| High School Diploma | 24 (16.1%) | 39.0 |
| College or Associate's Degree | 0 (0.0%) | 0.0 |
| Bachelor's Degree | 79 (53.0%) | 44.0 |
| Graduate Degree | 32 (21.5%) | 31.0 |
| Total | 149 (100.0%) | 27.0 |
Fertility by Education by Marriage Status in Suwanee
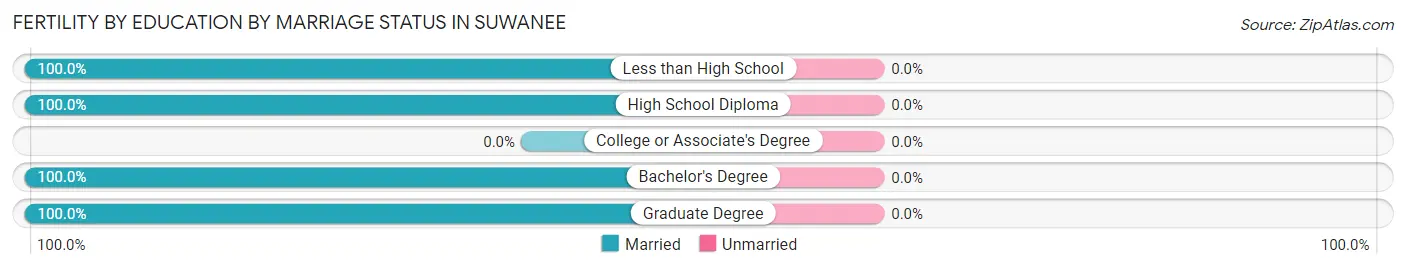
| Educational Attainment | Married | Unmarried |
| Less than High School | 14 (100.0%) | 0 (0.0%) |
| High School Diploma | 24 (100.0%) | 0 (0.0%) |
| College or Associate's Degree | 0 (0.0%) | 0 (0.0%) |
| Bachelor's Degree | 79 (100.0%) | 0 (0.0%) |
| Graduate Degree | 32 (100.0%) | 0 (0.0%) |
| Total | 149 (100.0%) | 0 (0.0%) |
Employment Characteristics in Suwanee
Employment by Class of Employer in Suwanee
Among the 12,385 employed individuals in Suwanee, private company employees (9,472 | 76.5%), not-for-profit organizations (970 | 7.8%), and local government employees (828 | 6.7%) make up the most common classes of employment.
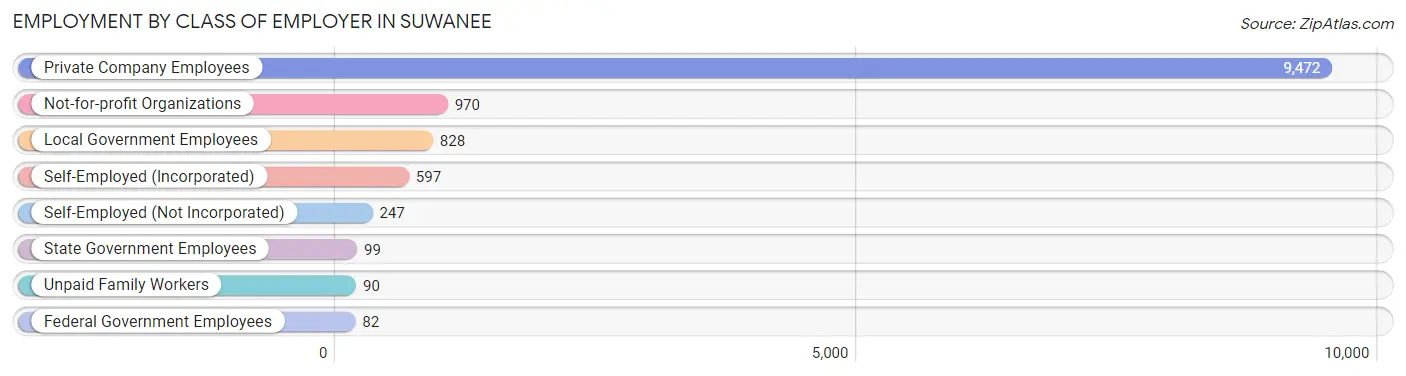
| Employer Class | # Employees | % Employees |
| Private Company Employees | 9,472 | 76.5% |
| Self-Employed (Incorporated) | 597 | 4.8% |
| Self-Employed (Not Incorporated) | 247 | 2.0% |
| Not-for-profit Organizations | 970 | 7.8% |
| Local Government Employees | 828 | 6.7% |
| State Government Employees | 99 | 0.8% |
| Federal Government Employees | 82 | 0.7% |
| Unpaid Family Workers | 90 | 0.7% |
| Total | 12,385 | 100.0% |
Employment Status by Age in Suwanee
According to the labor force statistics for Suwanee, out of the total population over 16 years of age (17,000), 77.0% or 13,090 individuals are in the labor force, with 5.0% or 654 of them unemployed. The age group with the highest labor force participation rate is 25 to 29 years, with 93.6% or 1,093 individuals in the labor force. Within the labor force, the 20 to 24 years age range has the highest percentage of unemployed individuals, with 17.4% or 311 of them being unemployed.
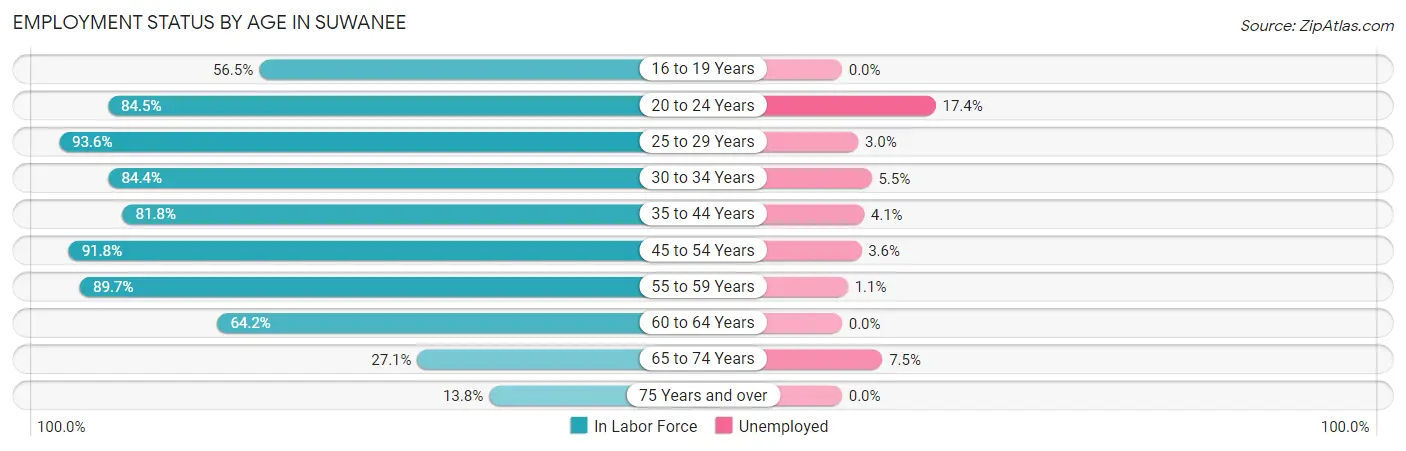
| Age Bracket | In Labor Force | Unemployed |
| 16 to 19 Years | 792 (56.5%) | 0 (0.0%) |
| 20 to 24 Years | 1,790 (84.5%) | 311 (17.4%) |
| 25 to 29 Years | 1,093 (93.6%) | 33 (3.0%) |
| 30 to 34 Years | 903 (84.4%) | 50 (5.5%) |
| 35 to 44 Years | 2,266 (81.8%) | 93 (4.1%) |
| 45 to 54 Years | 3,670 (91.8%) | 132 (3.6%) |
| 55 to 59 Years | 1,521 (89.7%) | 17 (1.1%) |
| 60 to 64 Years | 664 (64.2%) | 0 (0.0%) |
| 65 to 74 Years | 308 (27.1%) | 23 (7.5%) |
| 75 Years and over | 84 (13.8%) | 0 (0.0%) |
| Total | 13,090 (77.0%) | 654 (5.0%) |
Employment Status by Educational Attainment in Suwanee
According to labor force statistics for Suwanee, 86.2% of individuals (10,117) out of the total population between 25 and 64 years of age (11,737) are in the labor force, with 3.2% or 324 of them being unemployed. The group with the highest labor force participation rate are those with the educational attainment of bachelor's degree or higher, with 89.5% or 6,898 individuals in the labor force. Within the labor force, individuals with less than high school education have the highest percentage of unemployment, with 9.8% or 24 of them being unemployed.
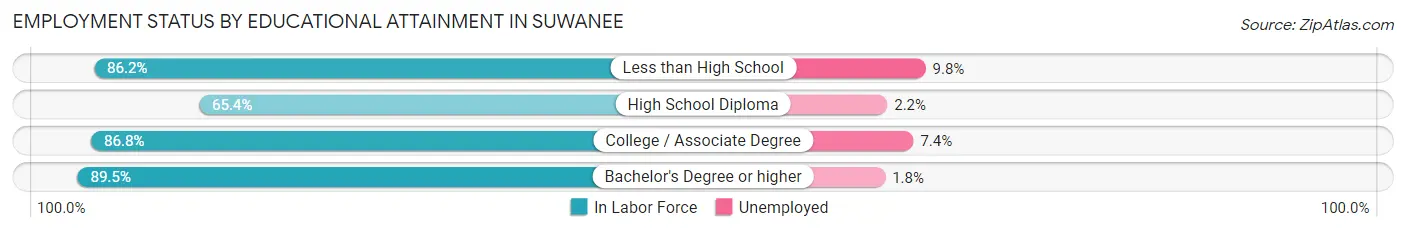
| Educational Attainment | In Labor Force | Unemployed |
| Less than High School | 244 (86.2%) | 28 (9.8%) |
| High School Diploma | 846 (65.4%) | 28 (2.2%) |
| College / Associate Degree | 2,129 (86.8%) | 182 (7.4%) |
| Bachelor's Degree or higher | 6,898 (89.5%) | 139 (1.8%) |
| Total | 10,117 (86.2%) | 376 (3.2%) |
Employment Occupations by Sex in Suwanee
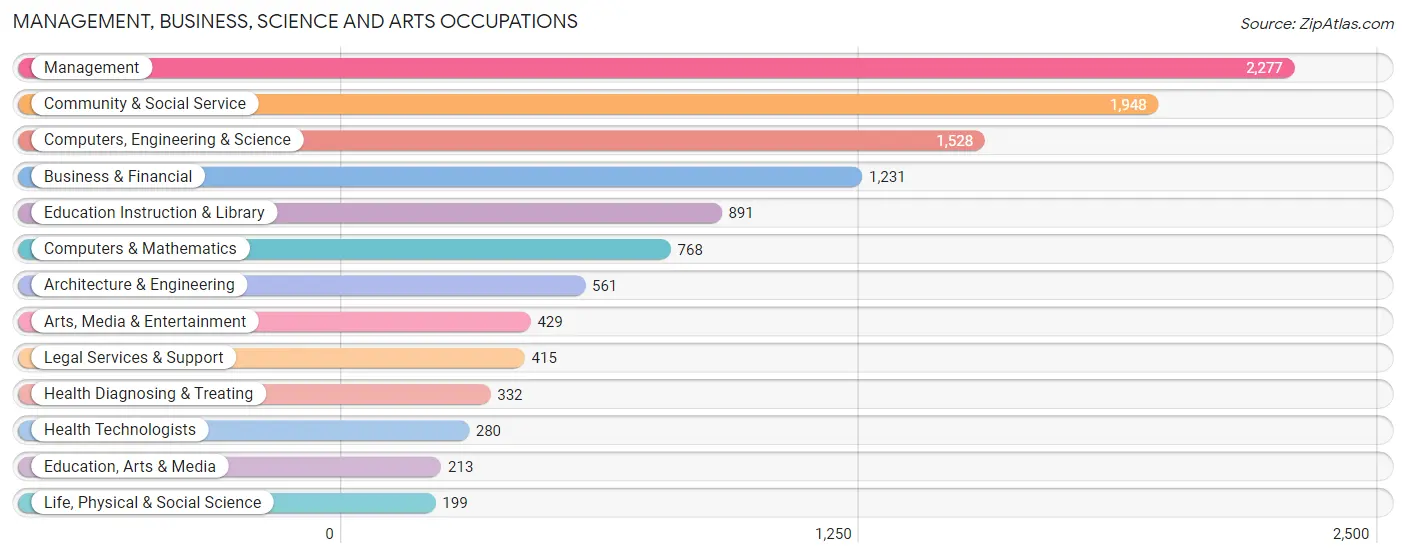
Management, Business, Science and Arts Occupations
The most common Management, Business, Science and Arts occupations in Suwanee are Management (2,277 | 18.3%), Community & Social Service (1,948 | 15.7%), Computers, Engineering & Science (1,528 | 12.3%), Business & Financial (1,231 | 9.9%), and Education Instruction & Library (891 | 7.2%).
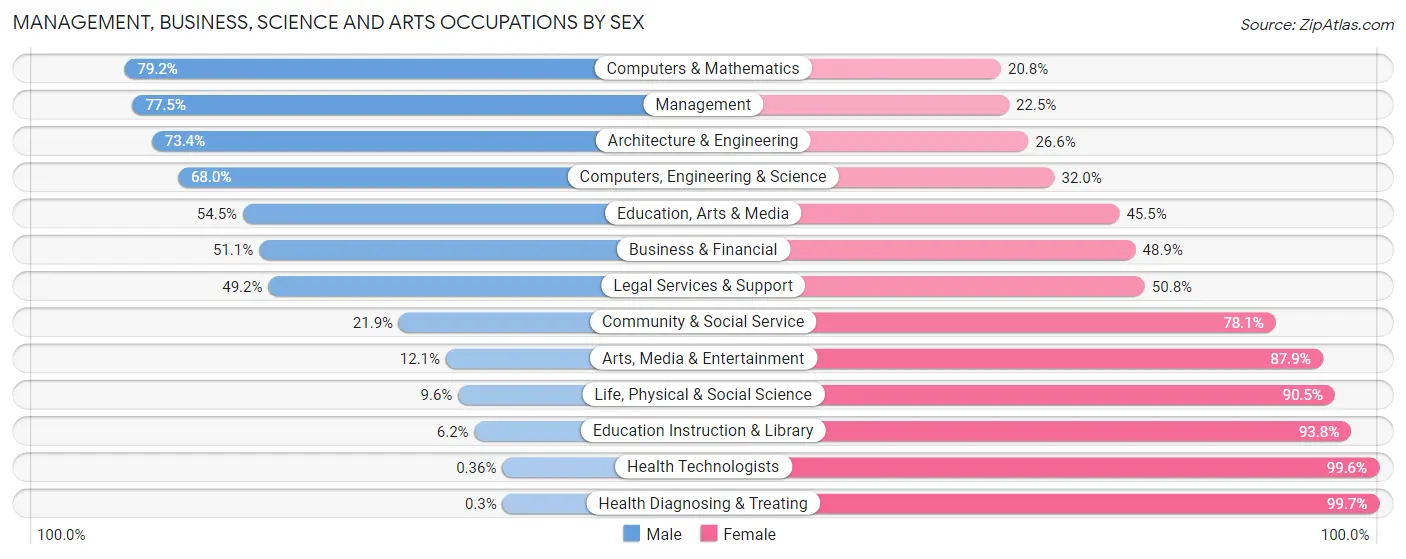
Management, Business, Science and Arts Occupations by Sex
Within the Management, Business, Science and Arts occupations in Suwanee, the most male-oriented occupations are Computers & Mathematics (79.2%), Management (77.5%), and Architecture & Engineering (73.4%), while the most female-oriented occupations are Health Diagnosing & Treating (99.7%), Health Technologists (99.6%), and Education Instruction & Library (93.8%).
| Occupation | Male | Female |
| Management | 1,764 (77.5%) | 513 (22.5%) |
| Business & Financial | 629 (51.1%) | 602 (48.9%) |
| Computers, Engineering & Science | 1,039 (68.0%) | 489 (32.0%) |
| Computers & Mathematics | 608 (79.2%) | 160 (20.8%) |
| Architecture & Engineering | 412 (73.4%) | 149 (26.6%) |
| Life, Physical & Social Science | 19 (9.6%) | 180 (90.4%) |
| Community & Social Service | 427 (21.9%) | 1,521 (78.1%) |
| Education, Arts & Media | 116 (54.5%) | 97 (45.5%) |
| Legal Services & Support | 204 (49.2%) | 211 (50.8%) |
| Education Instruction & Library | 55 (6.2%) | 836 (93.8%) |
| Arts, Media & Entertainment | 52 (12.1%) | 377 (87.9%) |
| Health Diagnosing & Treating | 1 (0.3%) | 331 (99.7%) |
| Health Technologists | 1 (0.4%) | 279 (99.6%) |
| Total (Category) | 3,860 (52.8%) | 3,456 (47.2%) |
| Total (Overall) | 6,391 (51.4%) | 6,043 (48.6%) |
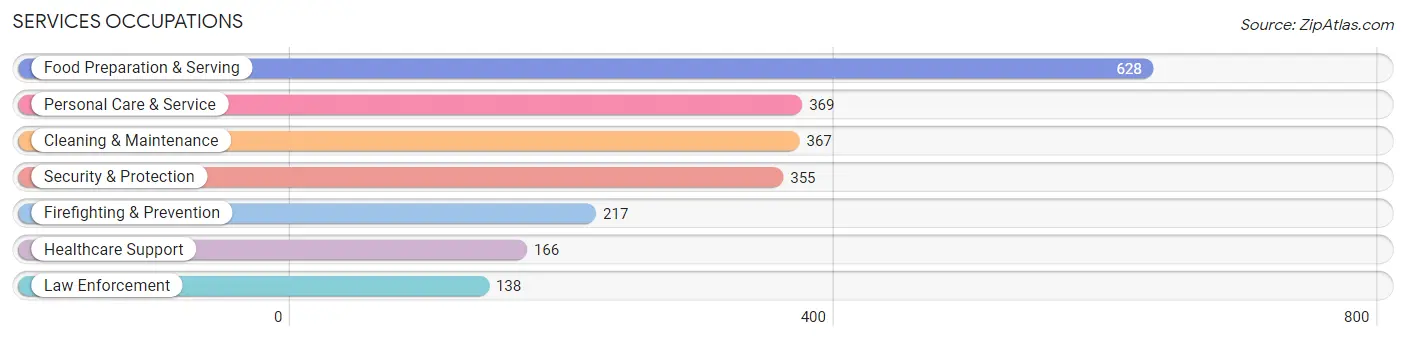
Services Occupations
The most common Services occupations in Suwanee are Food Preparation & Serving (628 | 5.1%), Personal Care & Service (369 | 3.0%), Cleaning & Maintenance (367 | 2.9%), Security & Protection (355 | 2.9%), and Firefighting & Prevention (217 | 1.8%).
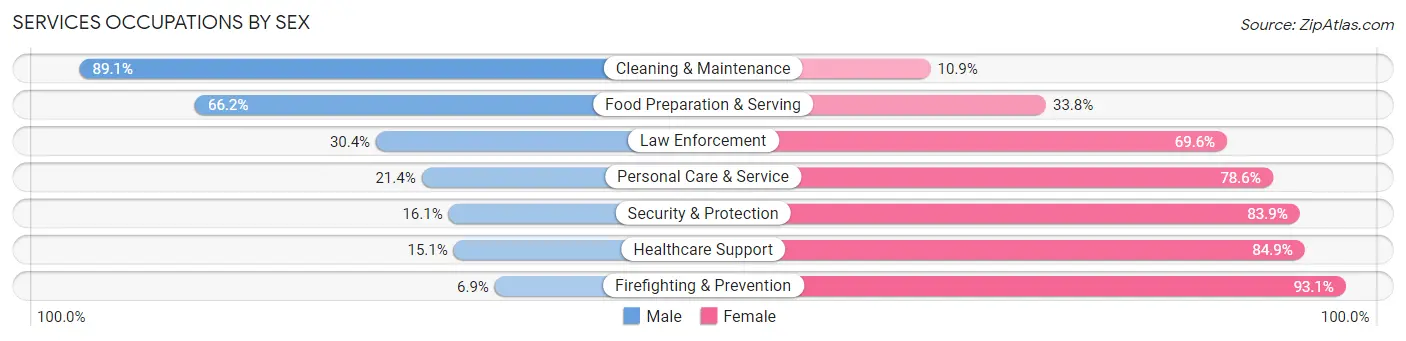
Services Occupations by Sex
Within the Services occupations in Suwanee, the most male-oriented occupations are Cleaning & Maintenance (89.1%), Food Preparation & Serving (66.2%), and Law Enforcement (30.4%), while the most female-oriented occupations are Firefighting & Prevention (93.1%), Healthcare Support (84.9%), and Security & Protection (83.9%).
| Occupation | Male | Female |
| Healthcare Support | 25 (15.1%) | 141 (84.9%) |
| Security & Protection | 57 (16.1%) | 298 (83.9%) |
| Firefighting & Prevention | 15 (6.9%) | 202 (93.1%) |
| Law Enforcement | 42 (30.4%) | 96 (69.6%) |
| Food Preparation & Serving | 416 (66.2%) | 212 (33.8%) |
| Cleaning & Maintenance | 327 (89.1%) | 40 (10.9%) |
| Personal Care & Service | 79 (21.4%) | 290 (78.6%) |
| Total (Category) | 904 (48.0%) | 981 (52.0%) |
| Total (Overall) | 6,391 (51.4%) | 6,043 (48.6%) |
Sales and Office Occupations
The most common Sales and Office occupations in Suwanee are Office & Administration (1,094 | 8.8%), and Sales & Related (989 | 8.0%).
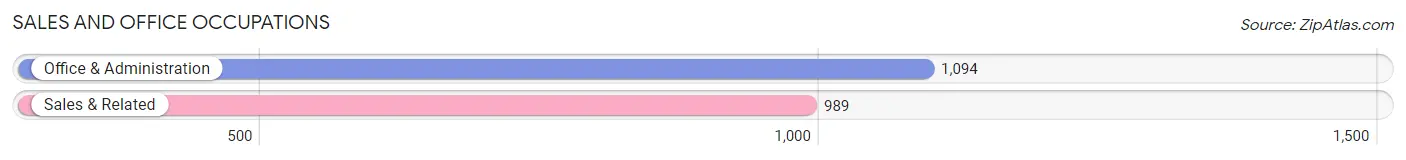
Sales and Office Occupations by Sex
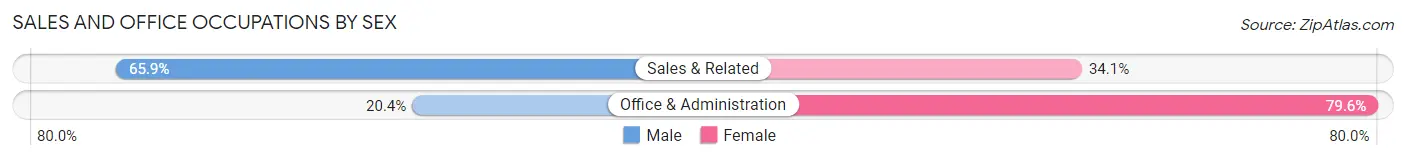
| Occupation | Male | Female |
| Sales & Related | 652 (65.9%) | 337 (34.1%) |
| Office & Administration | 223 (20.4%) | 871 (79.6%) |
| Total (Category) | 875 (42.0%) | 1,208 (58.0%) |
| Total (Overall) | 6,391 (51.4%) | 6,043 (48.6%) |
Natural Resources, Construction and Maintenance Occupations
The most common Natural Resources, Construction and Maintenance occupations in Suwanee are Installation, Maintenance & Repair (225 | 1.8%), and Construction & Extraction (81 | 0.6%).
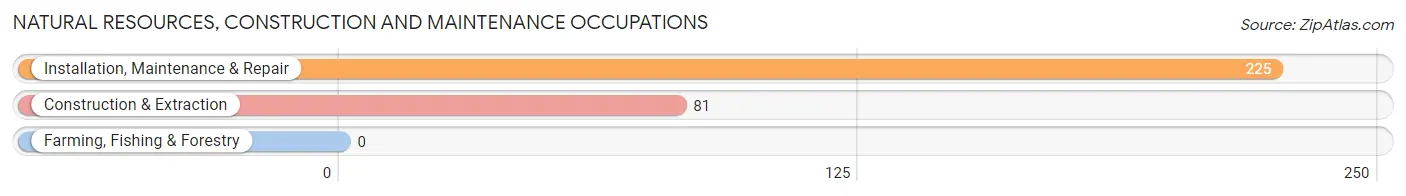
Natural Resources, Construction and Maintenance Occupations by Sex
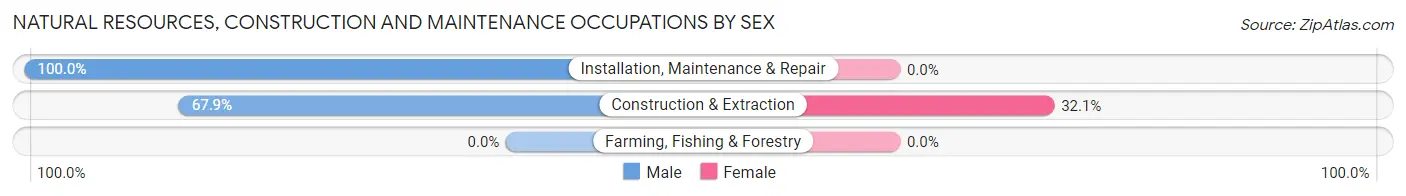
| Occupation | Male | Female |
| Farming, Fishing & Forestry | 0 (0.0%) | 0 (0.0%) |
| Construction & Extraction | 55 (67.9%) | 26 (32.1%) |
| Installation, Maintenance & Repair | 225 (100.0%) | 0 (0.0%) |
| Total (Category) | 280 (91.5%) | 26 (8.5%) |
| Total (Overall) | 6,391 (51.4%) | 6,043 (48.6%) |
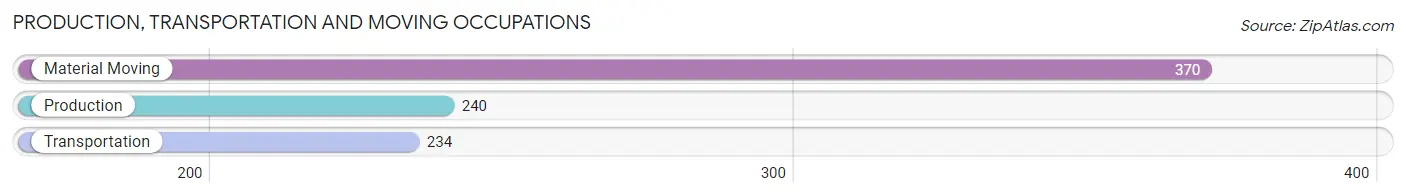
Production, Transportation and Moving Occupations
The most common Production, Transportation and Moving occupations in Suwanee are Material Moving (370 | 3.0%), Production (240 | 1.9%), and Transportation (234 | 1.9%).
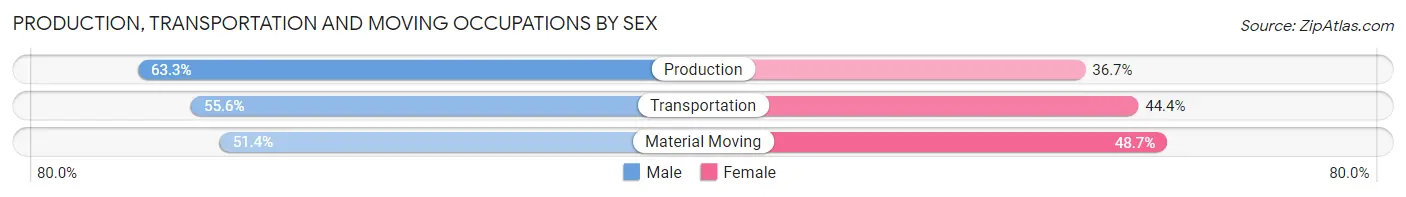
Production, Transportation and Moving Occupations by Sex
| Occupation | Male | Female |
| Production | 152 (63.3%) | 88 (36.7%) |
| Transportation | 130 (55.6%) | 104 (44.4%) |
| Material Moving | 190 (51.3%) | 180 (48.6%) |
| Total (Category) | 472 (55.9%) | 372 (44.1%) |
| Total (Overall) | 6,391 (51.4%) | 6,043 (48.6%) |
Employment Industries by Sex in Suwanee
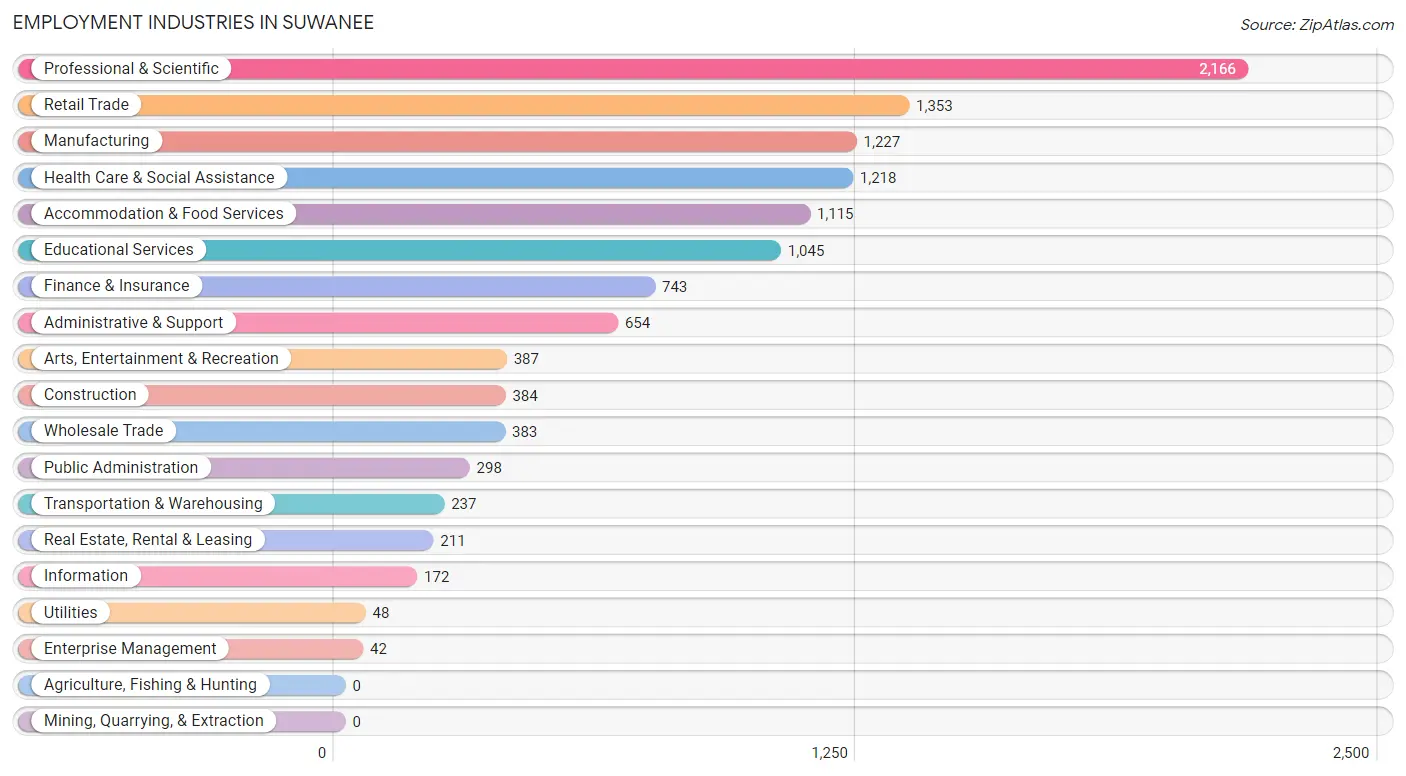
Employment Industries in Suwanee
The major employment industries in Suwanee include Professional & Scientific (2,166 | 17.4%), Retail Trade (1,353 | 10.9%), Manufacturing (1,227 | 9.9%), Health Care & Social Assistance (1,218 | 9.8%), and Accommodation & Food Services (1,115 | 9.0%).
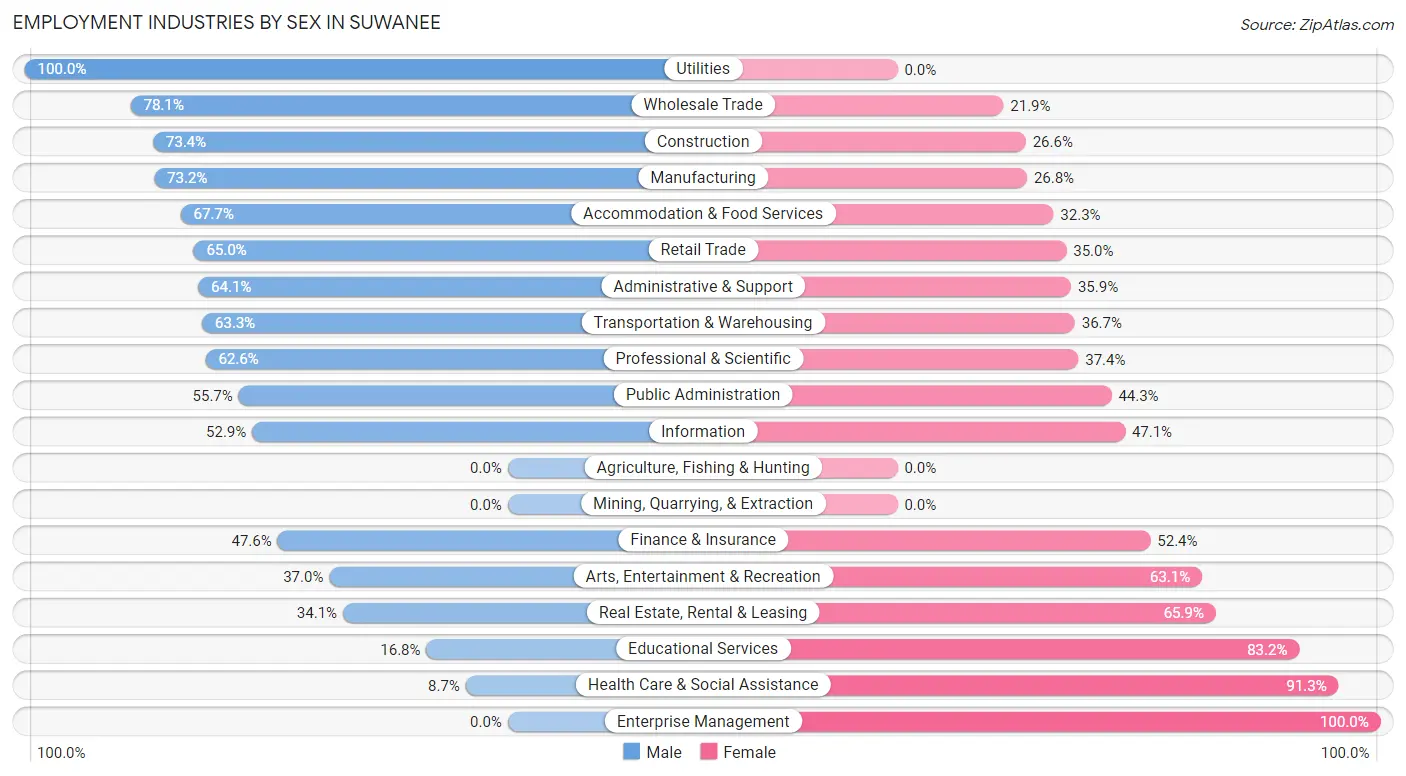
Employment Industries by Sex in Suwanee
The Suwanee industries that see more men than women are Utilities (100.0%), Wholesale Trade (78.1%), and Construction (73.4%), whereas the industries that tend to have a higher number of women are Enterprise Management (100.0%), Health Care & Social Assistance (91.3%), and Educational Services (83.2%).
| Industry | Male | Female |
| Agriculture, Fishing & Hunting | 0 (0.0%) | 0 (0.0%) |
| Mining, Quarrying, & Extraction | 0 (0.0%) | 0 (0.0%) |
| Construction | 282 (73.4%) | 102 (26.6%) |
| Manufacturing | 898 (73.2%) | 329 (26.8%) |
| Wholesale Trade | 299 (78.1%) | 84 (21.9%) |
| Retail Trade | 880 (65.0%) | 473 (35.0%) |
| Transportation & Warehousing | 150 (63.3%) | 87 (36.7%) |
| Utilities | 48 (100.0%) | 0 (0.0%) |
| Information | 91 (52.9%) | 81 (47.1%) |
| Finance & Insurance | 354 (47.6%) | 389 (52.4%) |
| Real Estate, Rental & Leasing | 72 (34.1%) | 139 (65.9%) |
| Professional & Scientific | 1,355 (62.6%) | 811 (37.4%) |
| Enterprise Management | 0 (0.0%) | 42 (100.0%) |
| Administrative & Support | 419 (64.1%) | 235 (35.9%) |
| Educational Services | 176 (16.8%) | 869 (83.2%) |
| Health Care & Social Assistance | 106 (8.7%) | 1,112 (91.3%) |
| Arts, Entertainment & Recreation | 143 (36.9%) | 244 (63.0%) |
| Accommodation & Food Services | 755 (67.7%) | 360 (32.3%) |
| Public Administration | 166 (55.7%) | 132 (44.3%) |
| Total | 6,391 (51.4%) | 6,043 (48.6%) |
Education in Suwanee
School Enrollment in Suwanee
The most common levels of schooling among the 6,419 students in Suwanee are high school (1,666 | 26.0%), college / undergraduate (1,495 | 23.3%), and middle school (1,167 | 18.2%).
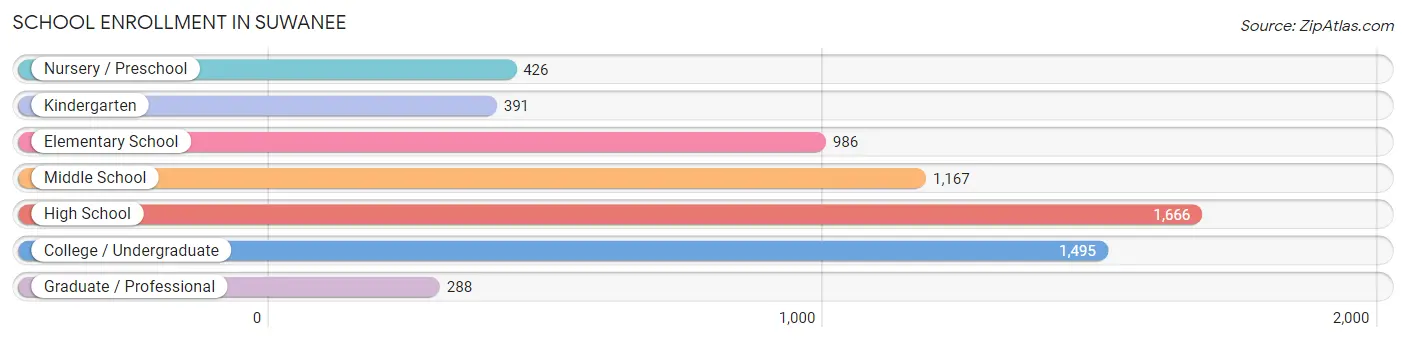
| School Level | # Students | % Students |
| Nursery / Preschool | 426 | 6.6% |
| Kindergarten | 391 | 6.1% |
| Elementary School | 986 | 15.4% |
| Middle School | 1,167 | 18.2% |
| High School | 1,666 | 26.0% |
| College / Undergraduate | 1,495 | 23.3% |
| Graduate / Professional | 288 | 4.5% |
| Total | 6,419 | 100.0% |
School Enrollment by Age by Funding Source in Suwanee
Out of a total of 6,419 students who are enrolled in schools in Suwanee, 1,913 (29.8%) attend a private institution, while the remaining 4,506 (70.2%) are enrolled in public schools. The age group of 3 to 4 year olds has the highest likelihood of being enrolled in private schools, with 142 (60.7% in the age bracket) enrolled. Conversely, the age group of 10 to 14 year olds has the lowest likelihood of being enrolled in a private school, with 1,384 (95.1% in the age bracket) attending a public institution.
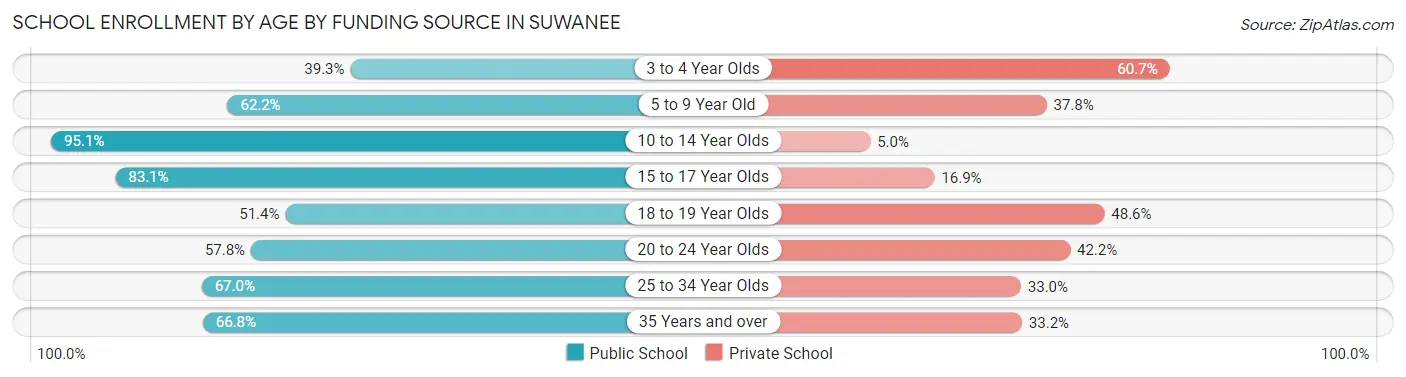
| Age Bracket | Public School | Private School |
| 3 to 4 Year Olds | 92 (39.3%) | 142 (60.7%) |
| 5 to 9 Year Old | 922 (62.2%) | 560 (37.8%) |
| 10 to 14 Year Olds | 1,384 (95.1%) | 72 (5.0%) |
| 15 to 17 Year Olds | 737 (83.1%) | 150 (16.9%) |
| 18 to 19 Year Olds | 357 (51.4%) | 337 (48.6%) |
| 20 to 24 Year Olds | 649 (57.8%) | 473 (42.2%) |
| 25 to 34 Year Olds | 201 (67.0%) | 99 (33.0%) |
| 35 Years and over | 163 (66.8%) | 81 (33.2%) |
| Total | 4,506 (70.2%) | 1,913 (29.8%) |
Educational Attainment by Field of Study in Suwanee
Business (2,379 | 26.8%), computers & mathematics (1,141 | 12.8%), education (1,006 | 11.3%), engineering (748 | 8.4%), and science & technology (565 | 6.4%) are the most common fields of study among 8,886 individuals in Suwanee who have obtained a bachelor's degree or higher.
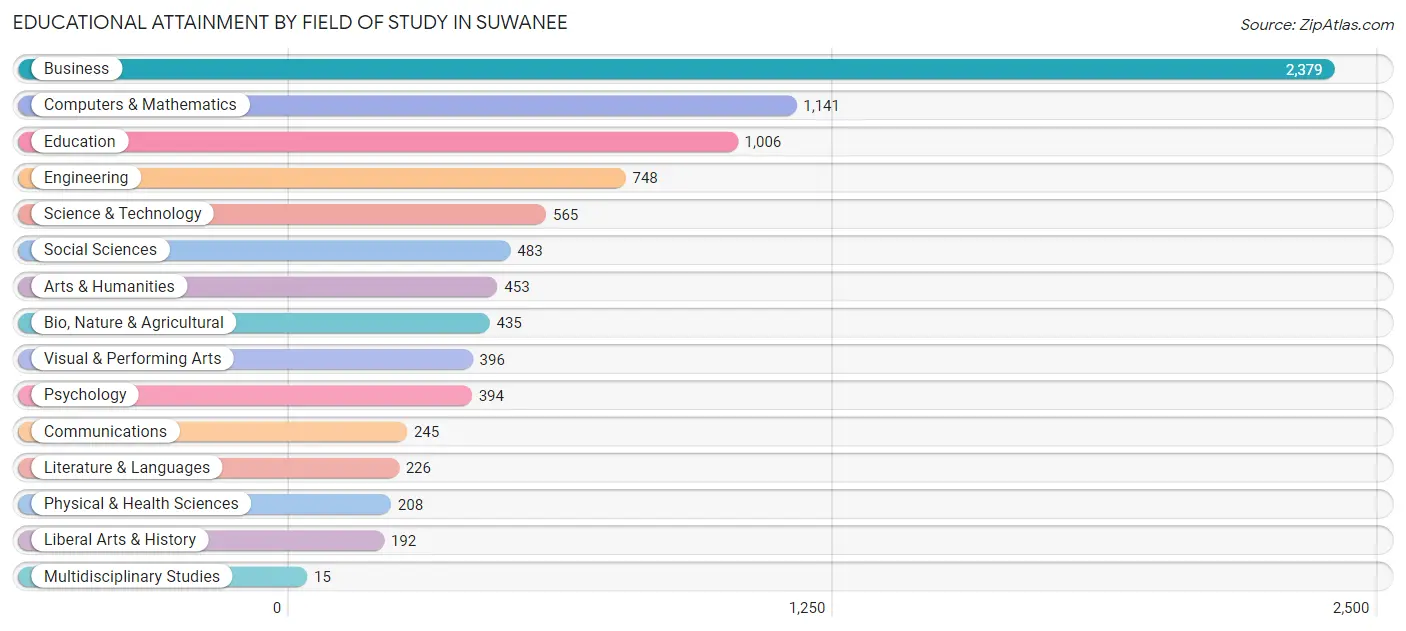
| Field of Study | # Graduates | % Graduates |
| Computers & Mathematics | 1,141 | 12.8% |
| Bio, Nature & Agricultural | 435 | 4.9% |
| Physical & Health Sciences | 208 | 2.3% |
| Psychology | 394 | 4.4% |
| Social Sciences | 483 | 5.4% |
| Engineering | 748 | 8.4% |
| Multidisciplinary Studies | 15 | 0.2% |
| Science & Technology | 565 | 6.4% |
| Business | 2,379 | 26.8% |
| Education | 1,006 | 11.3% |
| Literature & Languages | 226 | 2.5% |
| Liberal Arts & History | 192 | 2.2% |
| Visual & Performing Arts | 396 | 4.5% |
| Communications | 245 | 2.8% |
| Arts & Humanities | 453 | 5.1% |
| Total | 8,886 | 100.0% |
Transportation & Commute in Suwanee
Vehicle Availability by Sex in Suwanee
The most prevalent vehicle ownership categories in Suwanee are males with 2 vehicles (2,486, accounting for 39.2%) and females with 2 vehicles (2,040, making up 41.3%).
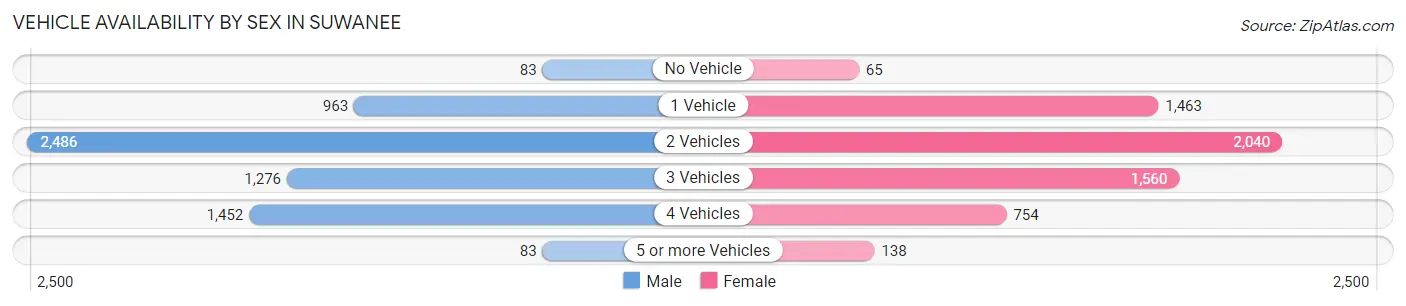
| Vehicles Available | Male | Female |
| No Vehicle | 83 (1.3%) | 65 (1.1%) |
| 1 Vehicle | 963 (15.2%) | 1,463 (24.3%) |
| 2 Vehicles | 2,486 (39.2%) | 2,040 (33.9%) |
| 3 Vehicles | 1,276 (20.1%) | 1,560 (25.9%) |
| 4 Vehicles | 1,452 (22.9%) | 754 (12.5%) |
| 5 or more Vehicles | 83 (1.3%) | 138 (2.3%) |
| Total | 6,343 (100.0%) | 6,020 (100.0%) |
Commute Time in Suwanee
The most frequently occuring commute durations in Suwanee are 30 to 34 minutes (1,845 commuters, 18.5%), 10 to 14 minutes (1,465 commuters, 14.6%), and 20 to 24 minutes (1,435 commuters, 14.3%).
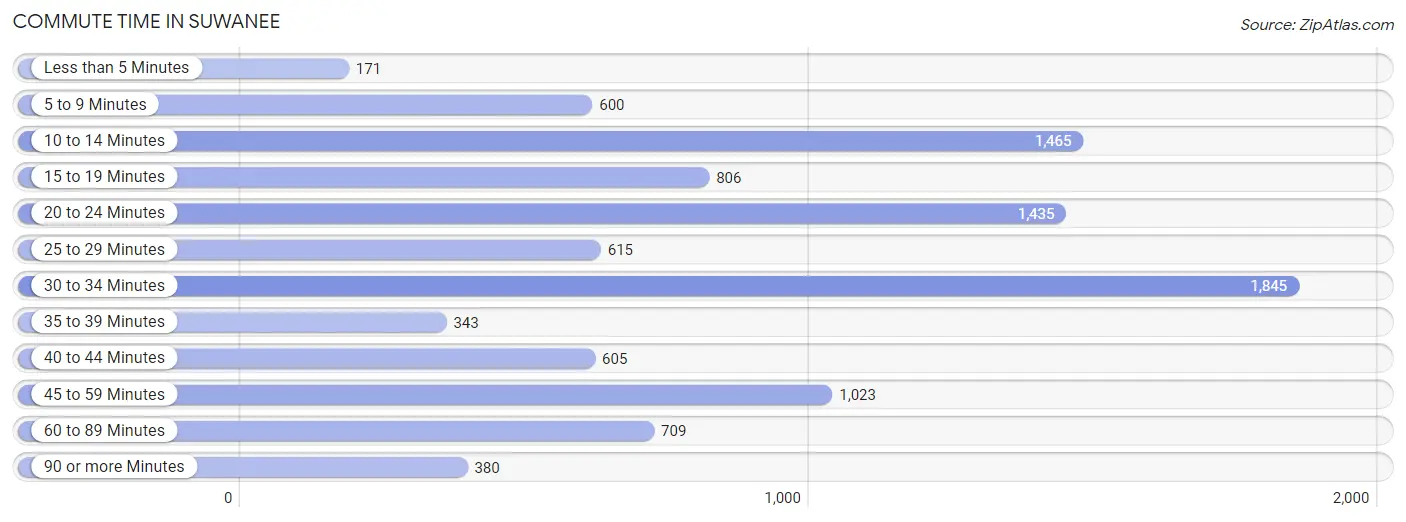
| Commute Time | # Commuters | % Commuters |
| Less than 5 Minutes | 171 | 1.7% |
| 5 to 9 Minutes | 600 | 6.0% |
| 10 to 14 Minutes | 1,465 | 14.6% |
| 15 to 19 Minutes | 806 | 8.1% |
| 20 to 24 Minutes | 1,435 | 14.3% |
| 25 to 29 Minutes | 615 | 6.1% |
| 30 to 34 Minutes | 1,845 | 18.5% |
| 35 to 39 Minutes | 343 | 3.4% |
| 40 to 44 Minutes | 605 | 6.0% |
| 45 to 59 Minutes | 1,023 | 10.2% |
| 60 to 89 Minutes | 709 | 7.1% |
| 90 or more Minutes | 380 | 3.8% |
Commute Time by Sex in Suwanee
The most common commute times in Suwanee are 10 to 14 minutes (809 commuters, 16.3%) for males and 30 to 34 minutes (1,099 commuters, 21.8%) for females.
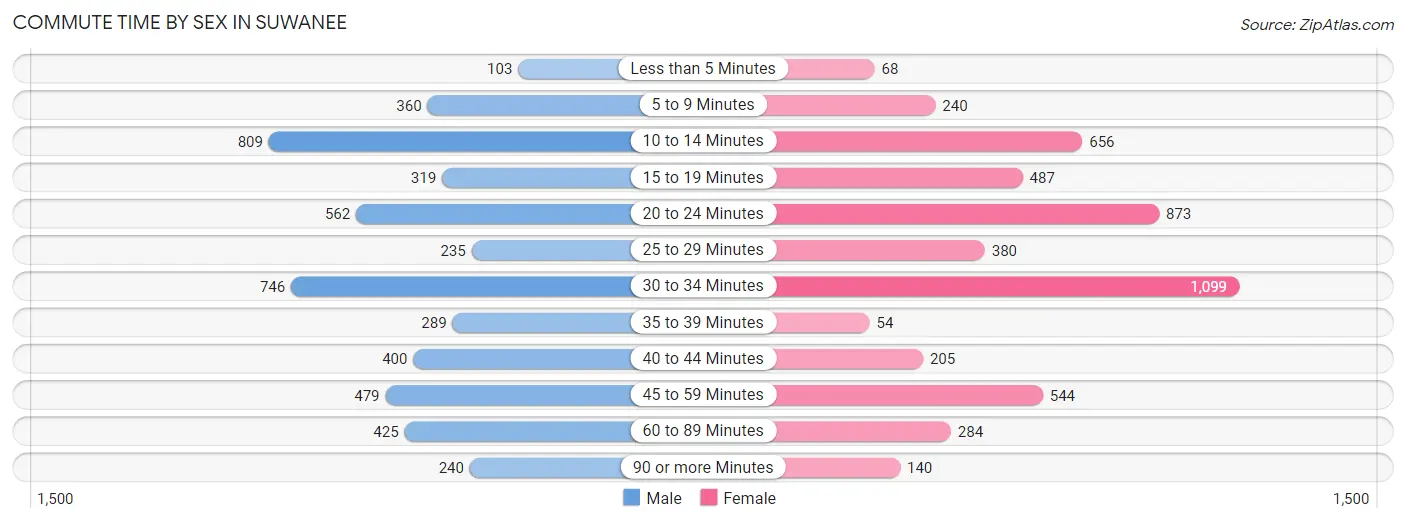
| Commute Time | Male | Female |
| Less than 5 Minutes | 103 (2.1%) | 68 (1.3%) |
| 5 to 9 Minutes | 360 (7.2%) | 240 (4.8%) |
| 10 to 14 Minutes | 809 (16.3%) | 656 (13.0%) |
| 15 to 19 Minutes | 319 (6.4%) | 487 (9.7%) |
| 20 to 24 Minutes | 562 (11.3%) | 873 (17.4%) |
| 25 to 29 Minutes | 235 (4.7%) | 380 (7.5%) |
| 30 to 34 Minutes | 746 (15.0%) | 1,099 (21.8%) |
| 35 to 39 Minutes | 289 (5.8%) | 54 (1.1%) |
| 40 to 44 Minutes | 400 (8.1%) | 205 (4.1%) |
| 45 to 59 Minutes | 479 (9.6%) | 544 (10.8%) |
| 60 to 89 Minutes | 425 (8.6%) | 284 (5.7%) |
| 90 or more Minutes | 240 (4.8%) | 140 (2.8%) |
Time of Departure to Work by Sex in Suwanee
The most frequent times of departure to work in Suwanee are 8:00 AM to 8:29 AM (830, 16.7%) for males and 7:00 AM to 7:29 AM (827, 16.4%) for females.
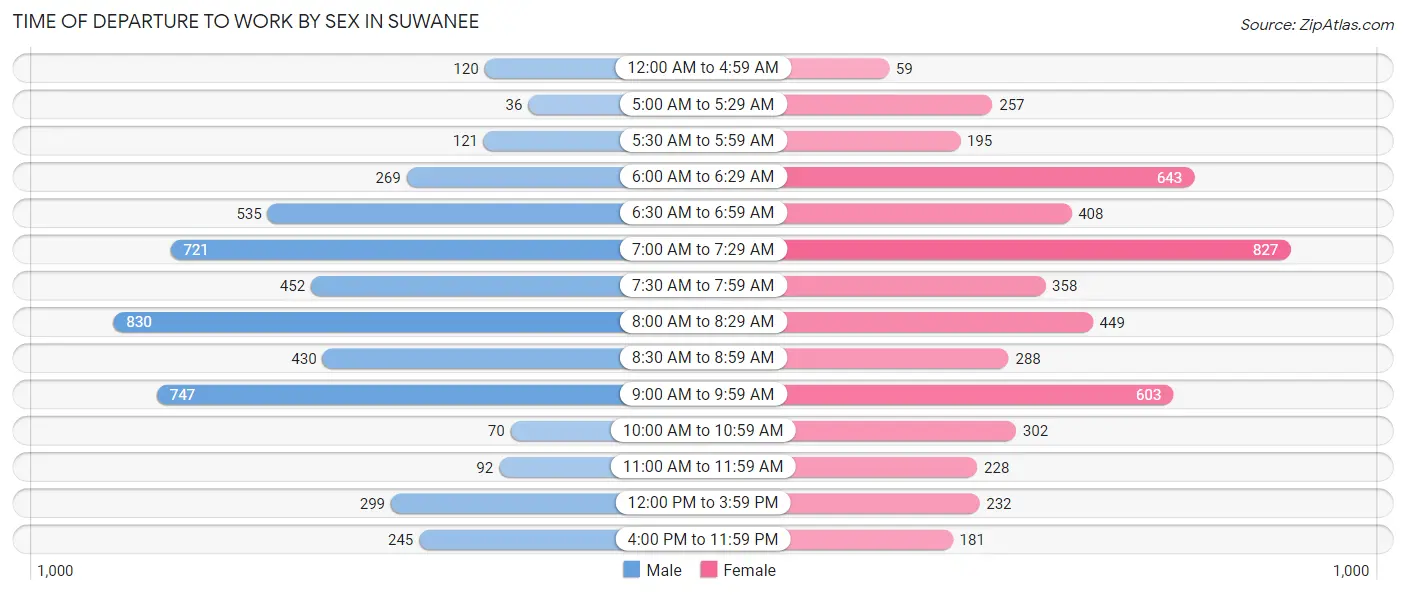
| Time of Departure | Male | Female |
| 12:00 AM to 4:59 AM | 120 (2.4%) | 59 (1.2%) |
| 5:00 AM to 5:29 AM | 36 (0.7%) | 257 (5.1%) |
| 5:30 AM to 5:59 AM | 121 (2.4%) | 195 (3.9%) |
| 6:00 AM to 6:29 AM | 269 (5.4%) | 643 (12.8%) |
| 6:30 AM to 6:59 AM | 535 (10.8%) | 408 (8.1%) |
| 7:00 AM to 7:29 AM | 721 (14.5%) | 827 (16.4%) |
| 7:30 AM to 7:59 AM | 452 (9.1%) | 358 (7.1%) |
| 8:00 AM to 8:29 AM | 830 (16.7%) | 449 (8.9%) |
| 8:30 AM to 8:59 AM | 430 (8.7%) | 288 (5.7%) |
| 9:00 AM to 9:59 AM | 747 (15.0%) | 603 (12.0%) |
| 10:00 AM to 10:59 AM | 70 (1.4%) | 302 (6.0%) |
| 11:00 AM to 11:59 AM | 92 (1.8%) | 228 (4.5%) |
| 12:00 PM to 3:59 PM | 299 (6.0%) | 232 (4.6%) |
| 4:00 PM to 11:59 PM | 245 (4.9%) | 181 (3.6%) |
| Total | 4,967 (100.0%) | 5,030 (100.0%) |
Housing Occupancy in Suwanee
Occupancy by Ownership in Suwanee
Of the total 7,847 dwellings in Suwanee, owner-occupied units account for 5,009 (63.8%), while renter-occupied units make up 2,838 (36.2%).
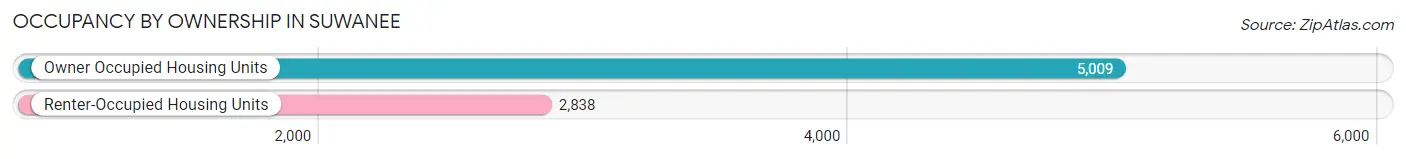
| Occupancy | # Housing Units | % Housing Units |
| Owner Occupied Housing Units | 5,009 | 63.8% |
| Renter-Occupied Housing Units | 2,838 | 36.2% |
| Total Occupied Housing Units | 7,847 | 100.0% |
Occupancy by Household Size in Suwanee
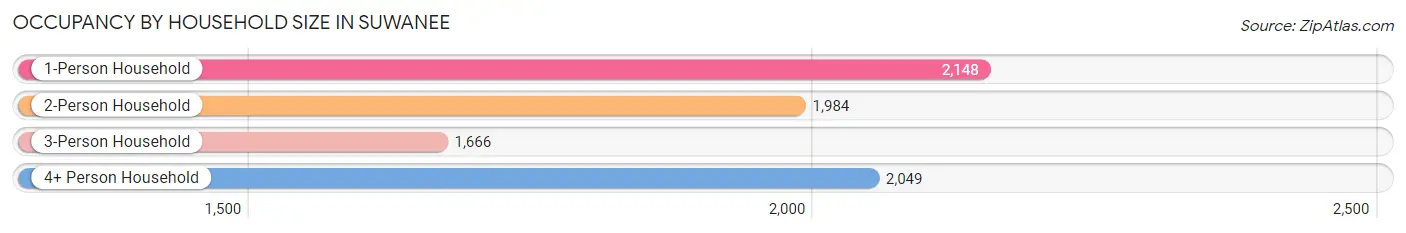
| Household Size | # Housing Units | % Housing Units |
| 1-Person Household | 2,148 | 27.4% |
| 2-Person Household | 1,984 | 25.3% |
| 3-Person Household | 1,666 | 21.2% |
| 4+ Person Household | 2,049 | 26.1% |
| Total Housing Units | 7,847 | 100.0% |
Occupancy by Ownership by Household Size in Suwanee
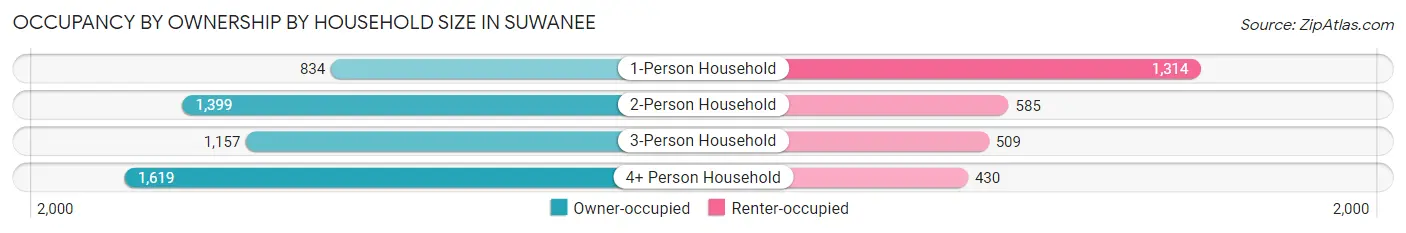
| Household Size | Owner-occupied | Renter-occupied |
| 1-Person Household | 834 (38.8%) | 1,314 (61.2%) |
| 2-Person Household | 1,399 (70.5%) | 585 (29.5%) |
| 3-Person Household | 1,157 (69.5%) | 509 (30.5%) |
| 4+ Person Household | 1,619 (79.0%) | 430 (21.0%) |
| Total Housing Units | 5,009 (63.8%) | 2,838 (36.2%) |
Occupancy by Educational Attainment in Suwanee
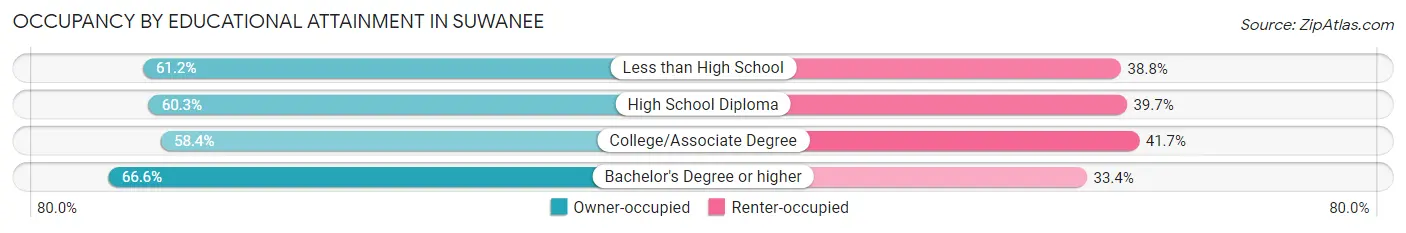
| Household Size | Owner-occupied | Renter-occupied |
| Less than High School | 30 (61.2%) | 19 (38.8%) |
| High School Diploma | 366 (60.3%) | 241 (39.7%) |
| College/Associate Degree | 1,258 (58.4%) | 898 (41.6%) |
| Bachelor's Degree or higher | 3,355 (66.6%) | 1,680 (33.4%) |
Occupancy by Age of Householder in Suwanee
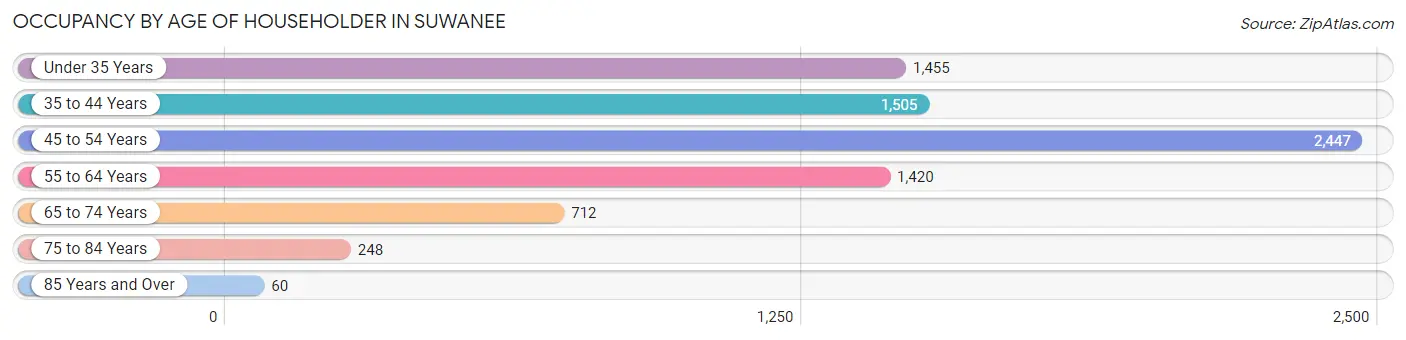
| Age Bracket | # Households | % Households |
| Under 35 Years | 1,455 | 18.5% |
| 35 to 44 Years | 1,505 | 19.2% |
| 45 to 54 Years | 2,447 | 31.2% |
| 55 to 64 Years | 1,420 | 18.1% |
| 65 to 74 Years | 712 | 9.1% |
| 75 to 84 Years | 248 | 3.2% |
| 85 Years and Over | 60 | 0.8% |
| Total | 7,847 | 100.0% |
Housing Finances in Suwanee
Median Income by Occupancy in Suwanee
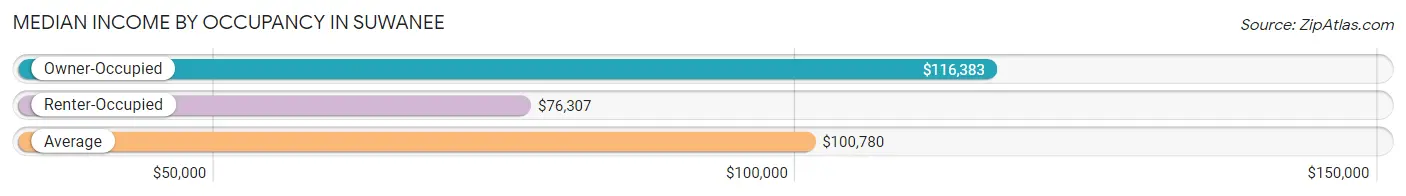
| Occupancy Type | # Households | Median Income |
| Owner-Occupied | 5,009 (63.8%) | $116,383 |
| Renter-Occupied | 2,838 (36.2%) | $76,307 |
| Average | 7,847 (100.0%) | $100,780 |
Occupancy by Householder Income Bracket in Suwanee
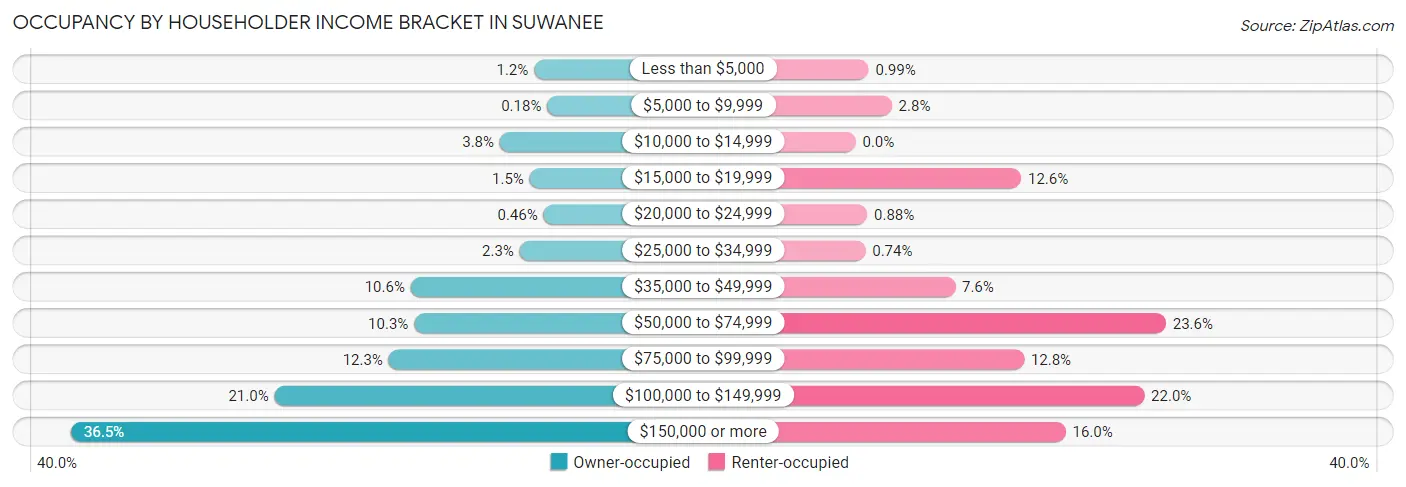
| Income Bracket | Owner-occupied | Renter-occupied |
| Less than $5,000 | 59 (1.2%) | 28 (1.0%) |
| $5,000 to $9,999 | 9 (0.2%) | 78 (2.8%) |
| $10,000 to $14,999 | 190 (3.8%) | 0 (0.0%) |
| $15,000 to $19,999 | 76 (1.5%) | 358 (12.6%) |
| $20,000 to $24,999 | 23 (0.5%) | 25 (0.9%) |
| $25,000 to $34,999 | 114 (2.3%) | 21 (0.7%) |
| $35,000 to $49,999 | 530 (10.6%) | 215 (7.6%) |
| $50,000 to $74,999 | 517 (10.3%) | 671 (23.6%) |
| $75,000 to $99,999 | 614 (12.3%) | 364 (12.8%) |
| $100,000 to $149,999 | 1,050 (21.0%) | 624 (22.0%) |
| $150,000 or more | 1,827 (36.5%) | 454 (16.0%) |
| Total | 5,009 (100.0%) | 2,838 (100.0%) |
Monthly Housing Cost Tiers in Suwanee
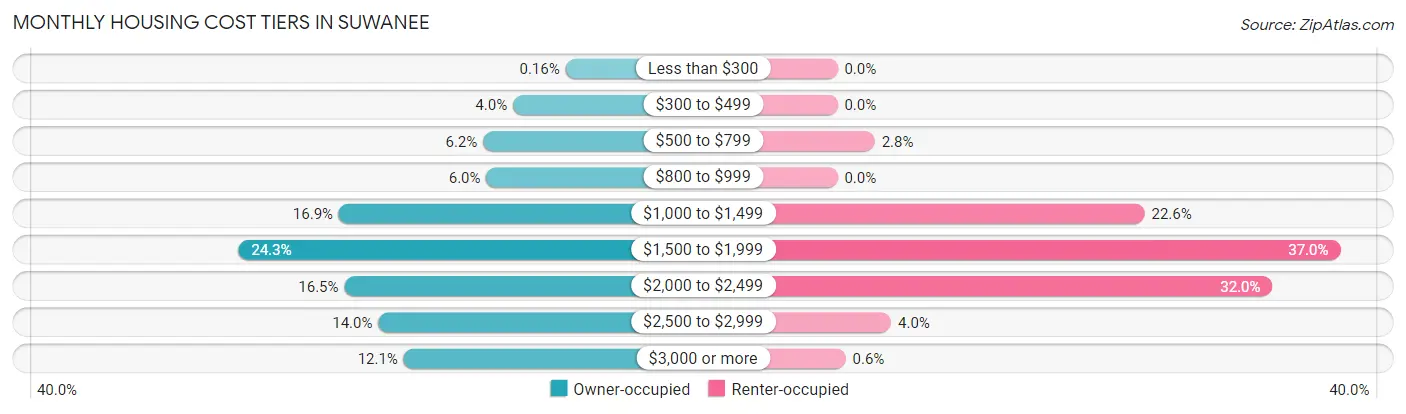
| Monthly Cost | Owner-occupied | Renter-occupied |
| Less than $300 | 8 (0.2%) | 0 (0.0%) |
| $300 to $499 | 202 (4.0%) | 0 (0.0%) |
| $500 to $799 | 312 (6.2%) | 78 (2.8%) |
| $800 to $999 | 300 (6.0%) | 0 (0.0%) |
| $1,000 to $1,499 | 844 (16.9%) | 642 (22.6%) |
| $1,500 to $1,999 | 1,215 (24.3%) | 1,051 (37.0%) |
| $2,000 to $2,499 | 824 (16.5%) | 909 (32.0%) |
| $2,500 to $2,999 | 699 (14.0%) | 112 (4.0%) |
| $3,000 or more | 605 (12.1%) | 17 (0.6%) |
| Total | 5,009 (100.0%) | 2,838 (100.0%) |
Physical Housing Characteristics in Suwanee
Housing Structures in Suwanee
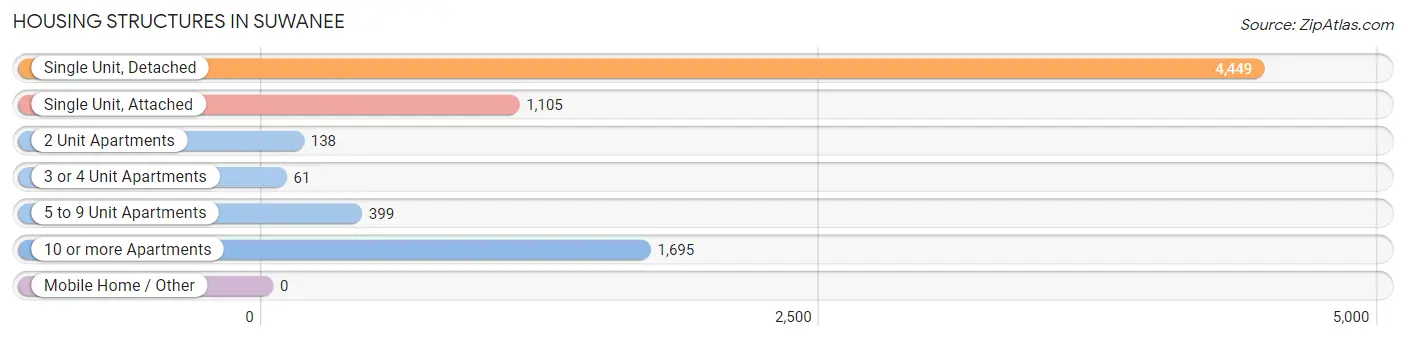
| Structure Type | # Housing Units | % Housing Units |
| Single Unit, Detached | 4,449 | 56.7% |
| Single Unit, Attached | 1,105 | 14.1% |
| 2 Unit Apartments | 138 | 1.8% |
| 3 or 4 Unit Apartments | 61 | 0.8% |
| 5 to 9 Unit Apartments | 399 | 5.1% |
| 10 or more Apartments | 1,695 | 21.6% |
| Mobile Home / Other | 0 | 0.0% |
| Total | 7,847 | 100.0% |
Housing Structures by Occupancy in Suwanee
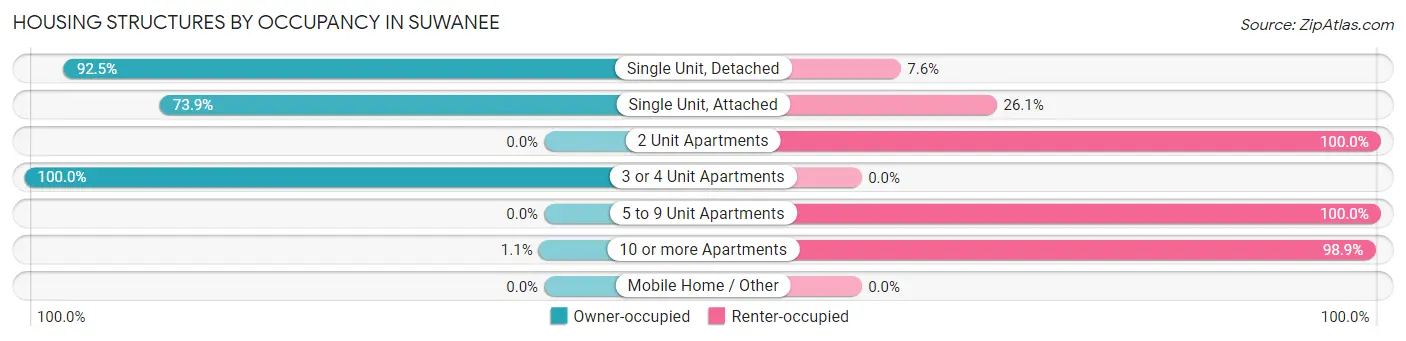
| Structure Type | Owner-occupied | Renter-occupied |
| Single Unit, Detached | 4,113 (92.4%) | 336 (7.5%) |
| Single Unit, Attached | 817 (73.9%) | 288 (26.1%) |
| 2 Unit Apartments | 0 (0.0%) | 138 (100.0%) |
| 3 or 4 Unit Apartments | 61 (100.0%) | 0 (0.0%) |
| 5 to 9 Unit Apartments | 0 (0.0%) | 399 (100.0%) |
| 10 or more Apartments | 18 (1.1%) | 1,677 (98.9%) |
| Mobile Home / Other | 0 (0.0%) | 0 (0.0%) |
| Total | 5,009 (63.8%) | 2,838 (36.2%) |
Housing Structures by Number of Rooms in Suwanee
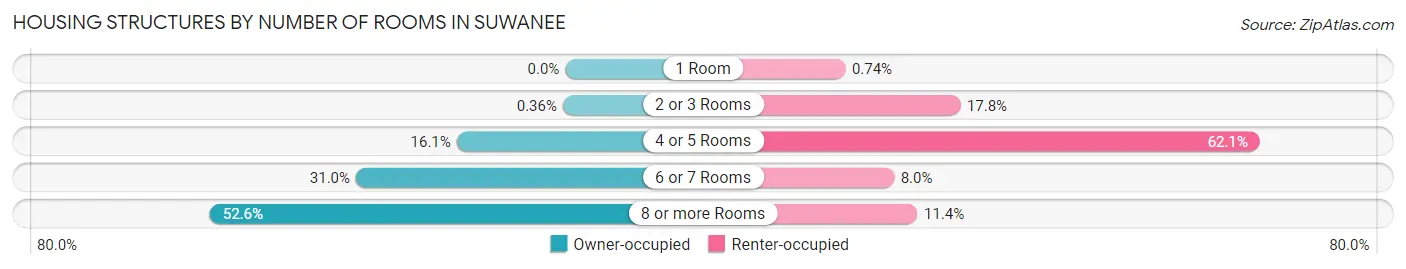
| Number of Rooms | Owner-occupied | Renter-occupied |
| 1 Room | 0 (0.0%) | 21 (0.7%) |
| 2 or 3 Rooms | 18 (0.4%) | 504 (17.8%) |
| 4 or 5 Rooms | 805 (16.1%) | 1,763 (62.1%) |
| 6 or 7 Rooms | 1,552 (31.0%) | 226 (8.0%) |
| 8 or more Rooms | 2,634 (52.6%) | 324 (11.4%) |
| Total | 5,009 (100.0%) | 2,838 (100.0%) |
Housing Structure by Heating Type in Suwanee
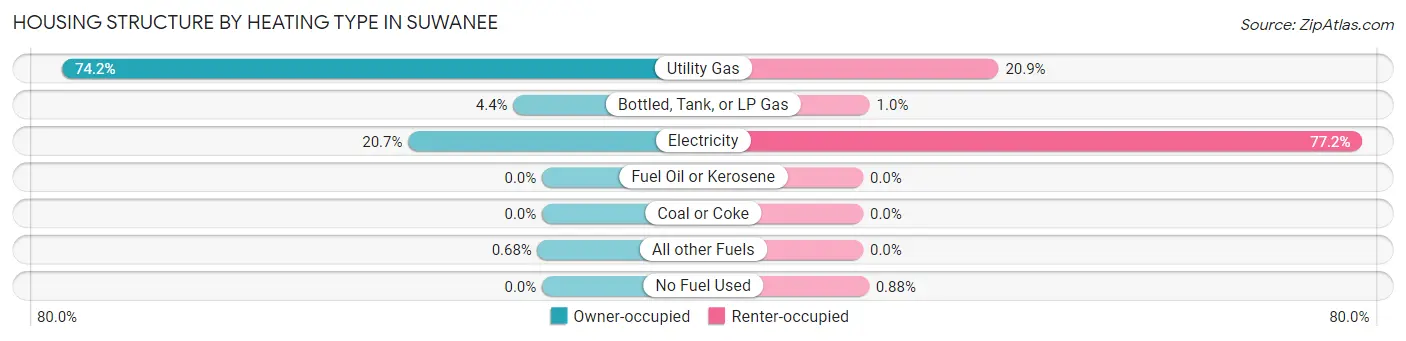
| Heating Type | Owner-occupied | Renter-occupied |
| Utility Gas | 3,717 (74.2%) | 594 (20.9%) |
| Bottled, Tank, or LP Gas | 222 (4.4%) | 29 (1.0%) |
| Electricity | 1,036 (20.7%) | 2,190 (77.2%) |
| Fuel Oil or Kerosene | 0 (0.0%) | 0 (0.0%) |
| Coal or Coke | 0 (0.0%) | 0 (0.0%) |
| All other Fuels | 34 (0.7%) | 0 (0.0%) |
| No Fuel Used | 0 (0.0%) | 25 (0.9%) |
| Total | 5,009 (100.0%) | 2,838 (100.0%) |
Household Vehicle Usage in Suwanee
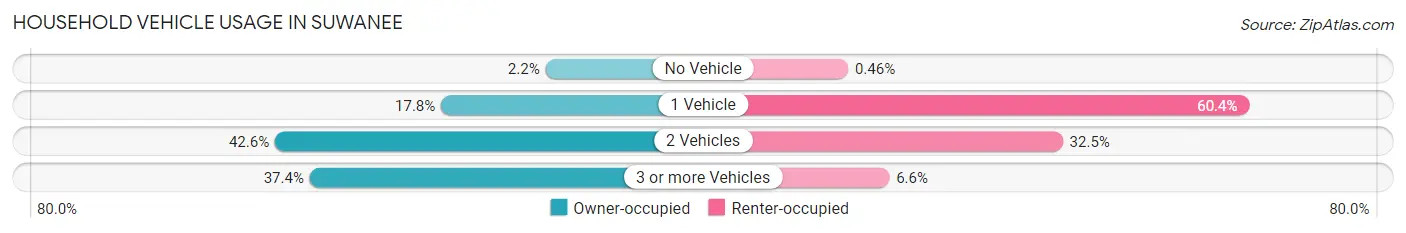
| Vehicles per Household | Owner-occupied | Renter-occupied |
| No Vehicle | 110 (2.2%) | 13 (0.5%) |
| 1 Vehicle | 891 (17.8%) | 1,714 (60.4%) |
| 2 Vehicles | 2,134 (42.6%) | 923 (32.5%) |
| 3 or more Vehicles | 1,874 (37.4%) | 188 (6.6%) |
| Total | 5,009 (100.0%) | 2,838 (100.0%) |
Real Estate & Mortgages in Suwanee
Real Estate and Mortgage Overview in Suwanee
| Characteristic | Without Mortgage | With Mortgage |
| Housing Units | 1,040 | 3,969 |
| Median Property Value | $398,600 | $369,100 |
| Median Household Income | $112,885 | $1,490 |
| Monthly Housing Costs | $798 | $605 |
| Real Estate Taxes | $4,216 | $0 |
Property Value by Mortgage Status in Suwanee
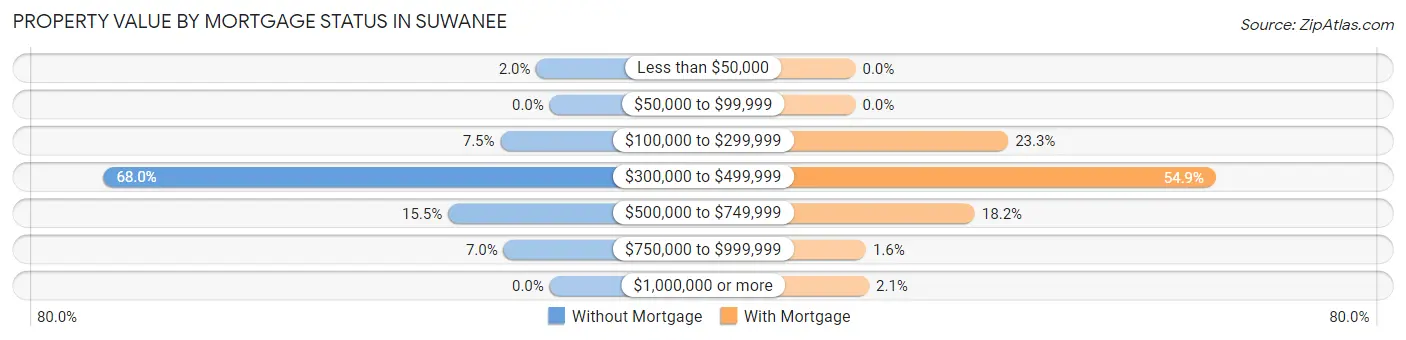
| Property Value | Without Mortgage | With Mortgage |
| Less than $50,000 | 21 (2.0%) | 0 (0.0%) |
| $50,000 to $99,999 | 0 (0.0%) | 0 (0.0%) |
| $100,000 to $299,999 | 78 (7.5%) | 923 (23.3%) |
| $300,000 to $499,999 | 707 (68.0%) | 2,179 (54.9%) |
| $500,000 to $749,999 | 161 (15.5%) | 722 (18.2%) |
| $750,000 to $999,999 | 73 (7.0%) | 63 (1.6%) |
| $1,000,000 or more | 0 (0.0%) | 82 (2.1%) |
| Total | 1,040 (100.0%) | 3,969 (100.0%) |
Household Income by Mortgage Status in Suwanee
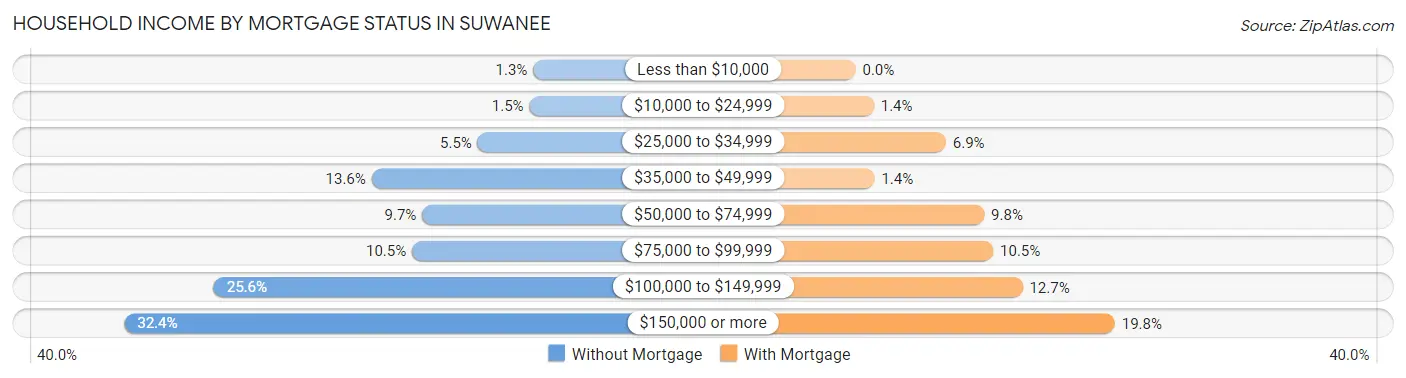
| Household Income | Without Mortgage | With Mortgage |
| Less than $10,000 | 13 (1.3%) | 0 (0.0%) |
| $10,000 to $24,999 | 16 (1.5%) | 55 (1.4%) |
| $25,000 to $34,999 | 57 (5.5%) | 273 (6.9%) |
| $35,000 to $49,999 | 141 (13.6%) | 57 (1.4%) |
| $50,000 to $74,999 | 101 (9.7%) | 389 (9.8%) |
| $75,000 to $99,999 | 109 (10.5%) | 416 (10.5%) |
| $100,000 to $149,999 | 266 (25.6%) | 505 (12.7%) |
| $150,000 or more | 337 (32.4%) | 784 (19.8%) |
| Total | 1,040 (100.0%) | 3,969 (100.0%) |
Property Value to Household Income Ratio in Suwanee
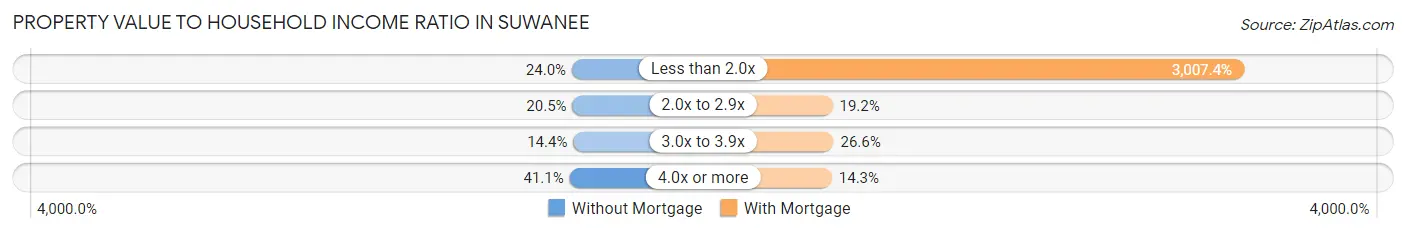
| Value-to-Income Ratio | Without Mortgage | With Mortgage |
| Less than 2.0x | 250 (24.0%) | 119,364 (3,007.4%) |
| 2.0x to 2.9x | 213 (20.5%) | 761 (19.2%) |
| 3.0x to 3.9x | 150 (14.4%) | 1,057 (26.6%) |
| 4.0x or more | 427 (41.1%) | 567 (14.3%) |
| Total | 1,040 (100.0%) | 3,969 (100.0%) |
Real Estate Taxes by Mortgage Status in Suwanee
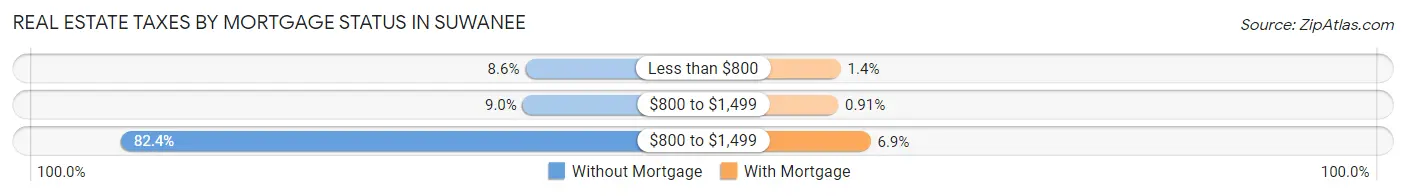
| Property Taxes | Without Mortgage | With Mortgage |
| Less than $800 | 89 (8.6%) | 55 (1.4%) |
| $800 to $1,499 | 94 (9.0%) | 36 (0.9%) |
| $800 to $1,499 | 857 (82.4%) | 272 (6.9%) |
| Total | 1,040 (100.0%) | 3,969 (100.0%) |
Health & Disability in Suwanee
Health Insurance Coverage by Age in Suwanee
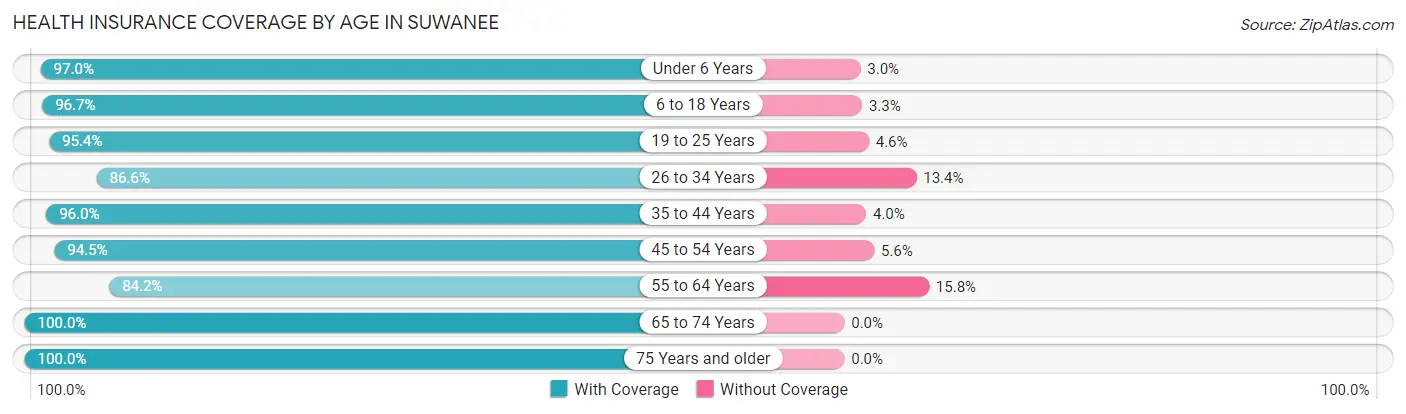
| Age Bracket | With Coverage | Without Coverage |
| Under 6 Years | 1,199 (97.0%) | 37 (3.0%) |
| 6 to 18 Years | 4,169 (96.7%) | 142 (3.3%) |
| 19 to 25 Years | 2,275 (95.4%) | 109 (4.6%) |
| 26 to 34 Years | 1,787 (86.6%) | 277 (13.4%) |
| 35 to 44 Years | 2,658 (96.0%) | 112 (4.0%) |
| 45 to 54 Years | 3,776 (94.5%) | 222 (5.6%) |
| 55 to 64 Years | 2,300 (84.2%) | 431 (15.8%) |
| 65 to 74 Years | 1,129 (100.0%) | 0 (0.0%) |
| 75 Years and older | 591 (100.0%) | 0 (0.0%) |
| Total | 19,884 (93.7%) | 1,330 (6.3%) |
Health Insurance Coverage by Citizenship Status in Suwanee
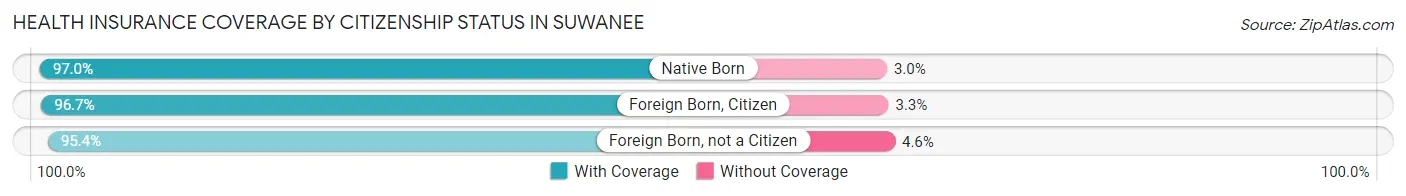
| Citizenship Status | With Coverage | Without Coverage |
| Native Born | 1,199 (97.0%) | 37 (3.0%) |
| Foreign Born, Citizen | 4,169 (96.7%) | 142 (3.3%) |
| Foreign Born, not a Citizen | 2,275 (95.4%) | 109 (4.6%) |
Health Insurance Coverage by Household Income in Suwanee
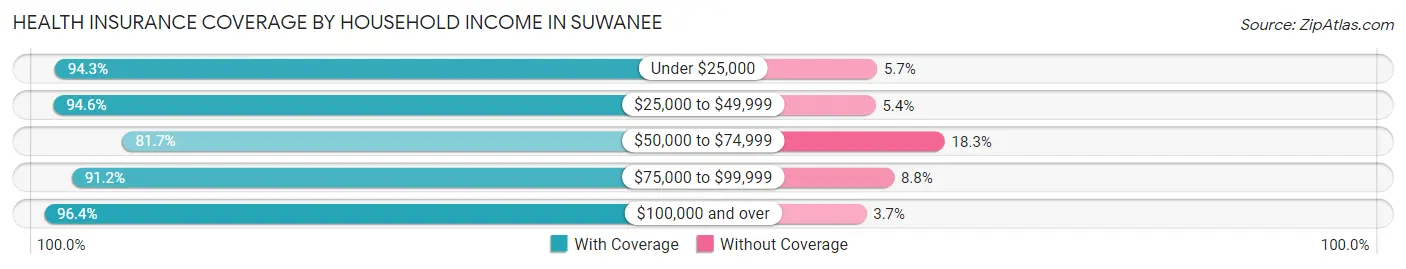
| Household Income | With Coverage | Without Coverage |
| Under $25,000 | 2,033 (94.3%) | 122 (5.7%) |
| $25,000 to $49,999 | 1,727 (94.6%) | 98 (5.4%) |
| $50,000 to $74,999 | 1,874 (81.7%) | 421 (18.3%) |
| $75,000 to $99,999 | 2,159 (91.2%) | 209 (8.8%) |
| $100,000 and over | 12,091 (96.4%) | 458 (3.6%) |
Public vs Private Health Insurance Coverage by Age in Suwanee
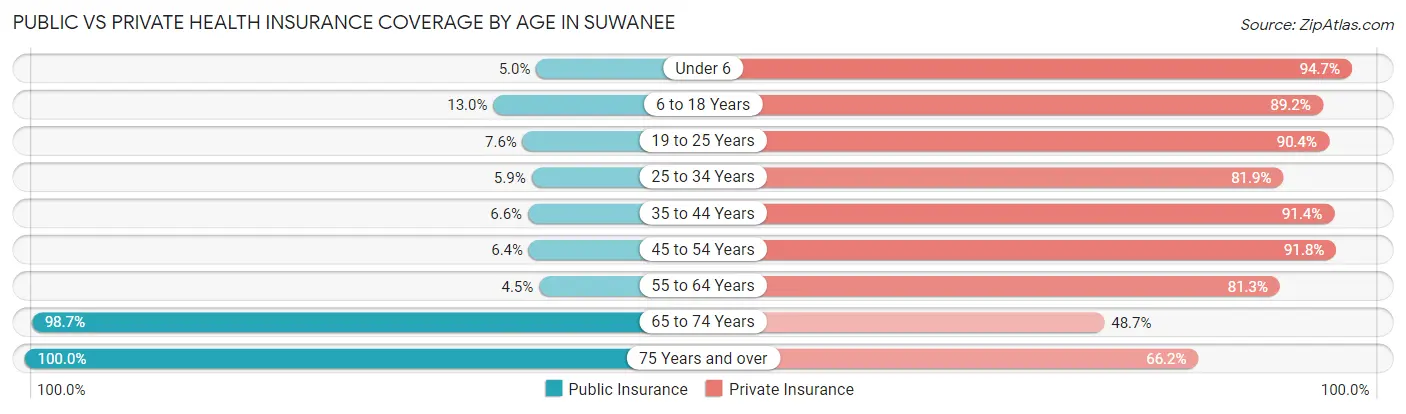
| Age Bracket | Public Insurance | Private Insurance |
| Under 6 | 62 (5.0%) | 1,170 (94.7%) |
| 6 to 18 Years | 561 (13.0%) | 3,847 (89.2%) |
| 19 to 25 Years | 180 (7.5%) | 2,155 (90.4%) |
| 25 to 34 Years | 122 (5.9%) | 1,691 (81.9%) |
| 35 to 44 Years | 182 (6.6%) | 2,531 (91.4%) |
| 45 to 54 Years | 256 (6.4%) | 3,668 (91.7%) |
| 55 to 64 Years | 123 (4.5%) | 2,220 (81.3%) |
| 65 to 74 Years | 1,114 (98.7%) | 550 (48.7%) |
| 75 Years and over | 591 (100.0%) | 391 (66.2%) |
| Total | 3,191 (15.0%) | 18,223 (85.9%) |
Disability Status by Sex by Age in Suwanee
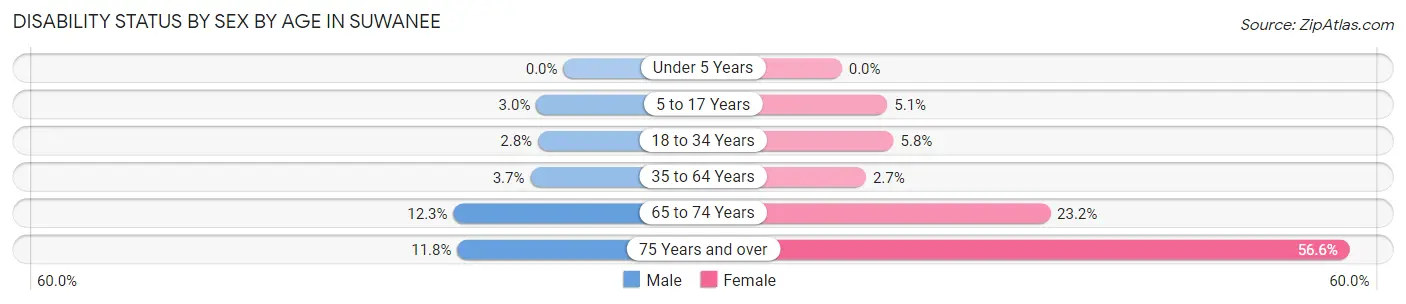
| Age Bracket | Male | Female |
| Under 5 Years | 0 (0.0%) | 0 (0.0%) |
| 5 to 17 Years | 43 (3.0%) | 126 (5.1%) |
| 18 to 34 Years | 71 (2.8%) | 151 (5.8%) |
| 35 to 64 Years | 173 (3.7%) | 129 (2.7%) |
| 65 to 74 Years | 67 (12.2%) | 135 (23.2%) |
| 75 Years and over | 32 (11.8%) | 181 (56.6%) |
Disability Class by Sex by Age in Suwanee
Disability Class: Hearing Difficulty
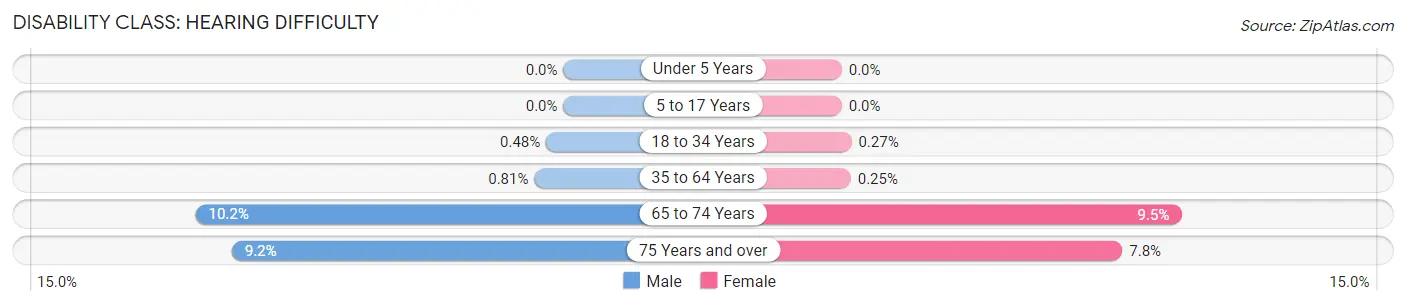
| Age Bracket | Male | Female |
| Under 5 Years | 0 (0.0%) | 0 (0.0%) |
| 5 to 17 Years | 0 (0.0%) | 0 (0.0%) |
| 18 to 34 Years | 12 (0.5%) | 7 (0.3%) |
| 35 to 64 Years | 38 (0.8%) | 12 (0.3%) |
| 65 to 74 Years | 56 (10.2%) | 55 (9.5%) |
| 75 Years and over | 25 (9.2%) | 25 (7.8%) |
Disability Class: Vision Difficulty
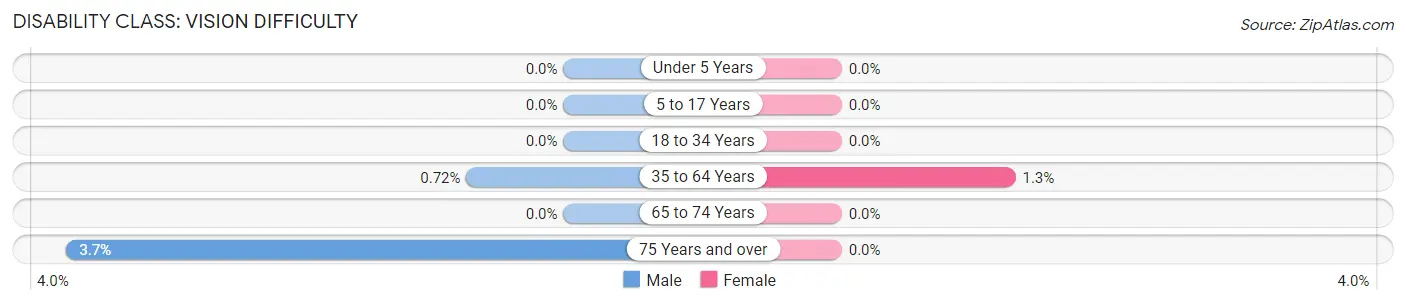
| Age Bracket | Male | Female |
| Under 5 Years | 0 (0.0%) | 0 (0.0%) |
| 5 to 17 Years | 0 (0.0%) | 0 (0.0%) |
| 18 to 34 Years | 0 (0.0%) | 0 (0.0%) |
| 35 to 64 Years | 34 (0.7%) | 62 (1.3%) |
| 65 to 74 Years | 0 (0.0%) | 0 (0.0%) |
| 75 Years and over | 10 (3.7%) | 0 (0.0%) |
Disability Class: Cognitive Difficulty
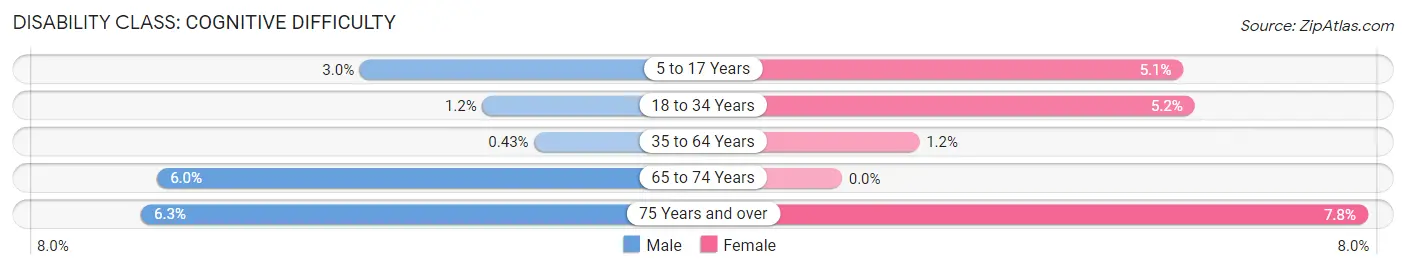
| Age Bracket | Male | Female |
| 5 to 17 Years | 43 (3.0%) | 126 (5.1%) |
| 18 to 34 Years | 30 (1.2%) | 137 (5.2%) |
| 35 to 64 Years | 20 (0.4%) | 55 (1.1%) |
| 65 to 74 Years | 33 (6.0%) | 0 (0.0%) |
| 75 Years and over | 17 (6.3%) | 25 (7.8%) |
Disability Class: Ambulatory Difficulty
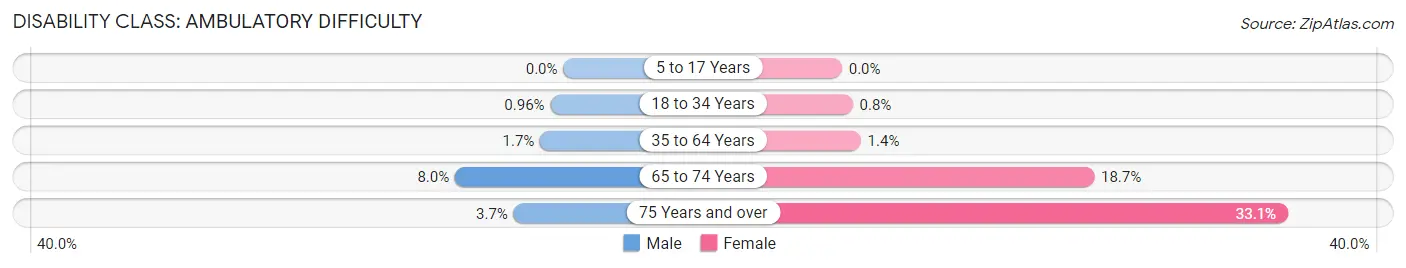
| Age Bracket | Male | Female |
| 5 to 17 Years | 0 (0.0%) | 0 (0.0%) |
| 18 to 34 Years | 24 (1.0%) | 21 (0.8%) |
| 35 to 64 Years | 81 (1.7%) | 67 (1.4%) |
| 65 to 74 Years | 44 (8.0%) | 109 (18.7%) |
| 75 Years and over | 10 (3.7%) | 106 (33.1%) |
Disability Class: Self-Care Difficulty
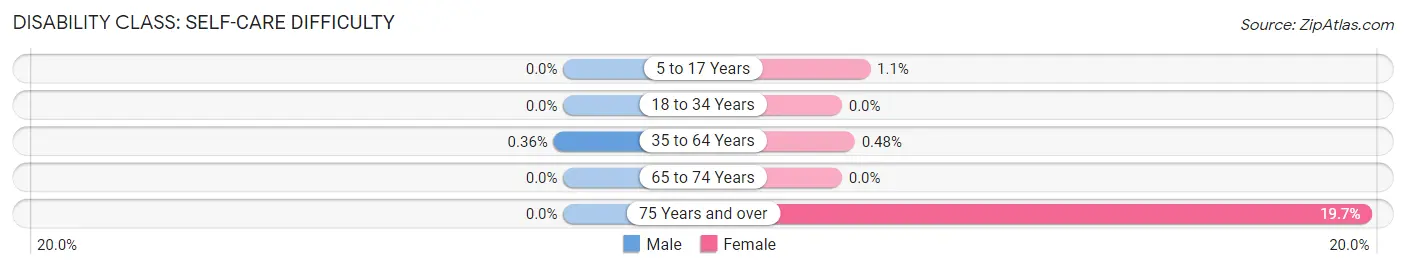
| Age Bracket | Male | Female |
| 5 to 17 Years | 0 (0.0%) | 26 (1.1%) |
| 18 to 34 Years | 0 (0.0%) | 0 (0.0%) |
| 35 to 64 Years | 17 (0.4%) | 23 (0.5%) |
| 65 to 74 Years | 0 (0.0%) | 0 (0.0%) |
| 75 Years and over | 0 (0.0%) | 63 (19.7%) |
Technology Access in Suwanee
Computing Device Access in Suwanee

| Device Type | # Households | % Households |
| Desktop or Laptop | 7,640 | 97.4% |
| Smartphone | 7,583 | 96.6% |
| Tablet | 5,903 | 75.2% |
| No Computing Device | 33 | 0.4% |
| Total | 7,847 | 100.0% |
Internet Access in Suwanee
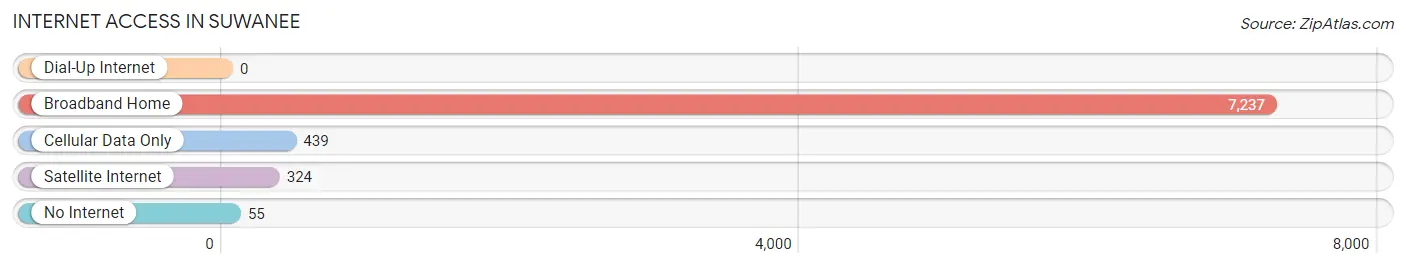
| Internet Type | # Households | % Households |
| Dial-Up Internet | 0 | 0.0% |
| Broadband Home | 7,237 | 92.2% |
| Cellular Data Only | 439 | 5.6% |
| Satellite Internet | 324 | 4.1% |
| No Internet | 55 | 0.7% |
| Total | 7,847 | 100.0% |
Suwanee Summary
Suwanee, Georgia is a city located in Gwinnett County, Georgia, United States. It is a suburb of Atlanta and is part of the Atlanta metropolitan area. As of the 2010 census, the population of Suwanee was 15,355.
History
The area that is now Suwanee was originally inhabited by the Cherokee Indians. The city was founded in 1837 by European-American settlers, who named it after the Cherokee word for “echo”. The city was incorporated in 1872 and was originally known as Suwanee Station. The city was a major stop on the Seaboard Air Line Railroad, which ran from Atlanta to Savannah.
Geography
Suwanee is located in the foothills of the Blue Ridge Mountains in northern Georgia. It is situated at the intersection of Interstate 85 and Georgia State Route 316. The city is located approximately 30 miles northeast of downtown Atlanta. The city has a total area of 8.2 square miles, all of which is land.
Economy
The economy of Suwanee is largely driven by the city’s proximity to Atlanta. The city is home to several corporate headquarters, including the headquarters of the Atlanta Falcons and the Atlanta Braves. The city is also home to several large retail stores, including Walmart, Target, and Home Depot.
Demographics
As of the 2010 census, the population of Suwanee was 15,355. The racial makeup of the city was 77.3% White, 11.2% African American, 0.3% Native American, 5.2% Asian, 0.1% Pacific Islander, 3.2% from other races, and 2.9% from two or more races. Hispanic or Latino of any race were 8.2% of the population.
The median income for a household in the city was $76,837, and the median income for a family was $90,945. The per capita income for the city was $37,945. About 4.2% of families and 5.7% of the population were below the poverty line, including 6.3% of those under age 18 and 4.2% of those age 65 or over.
Conclusion
Suwanee, Georgia is a city located in Gwinnett County, Georgia, United States. It is a suburb of Atlanta and is part of the Atlanta metropolitan area. As of the 2010 census, the population of Suwanee was 15,355. The city was founded in 1837 by European-American settlers and was originally known as Suwanee Station. The economy of Suwanee is largely driven by the city’s proximity to Atlanta. The city is home to several corporate headquarters, including the headquarters of the Atlanta Falcons and the Atlanta Braves. The racial makeup of the city was 77.3% White, 11.2% African American, 0.3% Native American, 5.2% Asian, 0.1% Pacific Islander, 3.2% from other races, and 2.9% from two or more races. The median income for a household in the city was $76,837, and the median income for a family was $90,945. Suwanee is a vibrant city with a rich history and a bright future.
Common Questions
What is Per Capita Income in Suwanee?
Per Capita income in Suwanee is $47,763.
What is the Median Family Income in Suwanee?
Median Family Income in Suwanee is $115,713.
What is the Median Household income in Suwanee?
Median Household Income in Suwanee is $100,780.
What is Income or Wage Gap in Suwanee?
Income or Wage Gap in Suwanee is 42.5%.
Women in Suwanee earn 57.5 cents for every dollar earned by a man.
What is Inequality or Gini Index in Suwanee?
Inequality or Gini Index in Suwanee is 0.41.
What is the Total Population of Suwanee?
Total Population of Suwanee is 21,238.
What is the Total Male Population of Suwanee?
Total Male Population of Suwanee is 10,032.
What is the Total Female Population of Suwanee?
Total Female Population of Suwanee is 11,206.
What is the Ratio of Males per 100 Females in Suwanee?
There are 89.52 Males per 100 Females in Suwanee.
What is the Ratio of Females per 100 Males in Suwanee?
There are 111.70 Females per 100 Males in Suwanee.
What is the Median Population Age in Suwanee?
Median Population Age in Suwanee is 37.9 Years.
What is the Average Family Size in Suwanee
Average Family Size in Suwanee is 3.4 People.
What is the Average Household Size in Suwanee
Average Household Size in Suwanee is 2.7 People.
How Large is the Labor Force in Suwanee?
There are 13,090 People in the Labor Forcein in Suwanee.
What is the Percentage of People in the Labor Force in Suwanee?
77.0% of People are in the Labor Force in Suwanee.
What is the Unemployment Rate in Suwanee?
Unemployment Rate in Suwanee is 5.0%.