Houghton, MI Map & Demographics
Houghton Map
Houghton Overview
$21,630
PER CAPITA INCOME
$85,400
AVG FAMILY INCOME
$29,821
AVG HOUSEHOLD INCOME
31.0%
WAGE / INCOME GAP [ % ]
69.0¢/ $1
WAGE / INCOME GAP [ $ ]
0.58
INEQUALITY / GINI INDEX
8,303
TOTAL POPULATION
5,189
MALE POPULATION
3,114
FEMALE POPULATION
166.63
MALES / 100 FEMALES
60.01
FEMALES / 100 MALES
22.2
MEDIAN AGE
3.1
AVG FAMILY SIZE
2.2
AVG HOUSEHOLD SIZE
4,001
LABOR FORCE [ PEOPLE ]
53.1%
PERCENT IN LABOR FORCE
11.9%
UNEMPLOYMENT RATE
Houghton Zip Codes
Houghton Area Codes
Income in Houghton
Income Overview in Houghton
Per Capita Income in Houghton is $21,630, while median incomes of families and households are $85,400 and $29,821 respectively.
| Characteristic | Number | Measure |
| Per Capita Income | 8,303 | $21,630 |
| Median Family Income | 920 | $85,400 |
| Mean Family Income | 920 | $117,670 |
| Median Household Income | 2,385 | $29,821 |
| Mean Household Income | 2,385 | $64,362 |
| Income Deficit | 920 | $0 |
| Wage / Income Gap (%) | 8,303 | 30.98% |
| Wage / Income Gap ($) | 8,303 | 69.02¢ per $1 |
| Gini / Inequality Index | 8,303 | 0.58 |
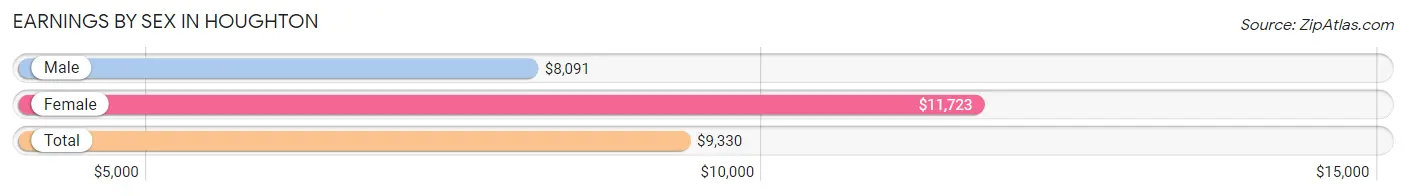
Earnings by Sex in Houghton
Average Earnings in Houghton are $9,330, $8,091 for men and $11,723 for women, a difference of 31.0%.
| Sex | Number | Average Earnings |
| Male | 3,587 (66.0%) | $8,091 |
| Female | 1,847 (34.0%) | $11,723 |
| Total | 5,434 (100.0%) | $9,330 |
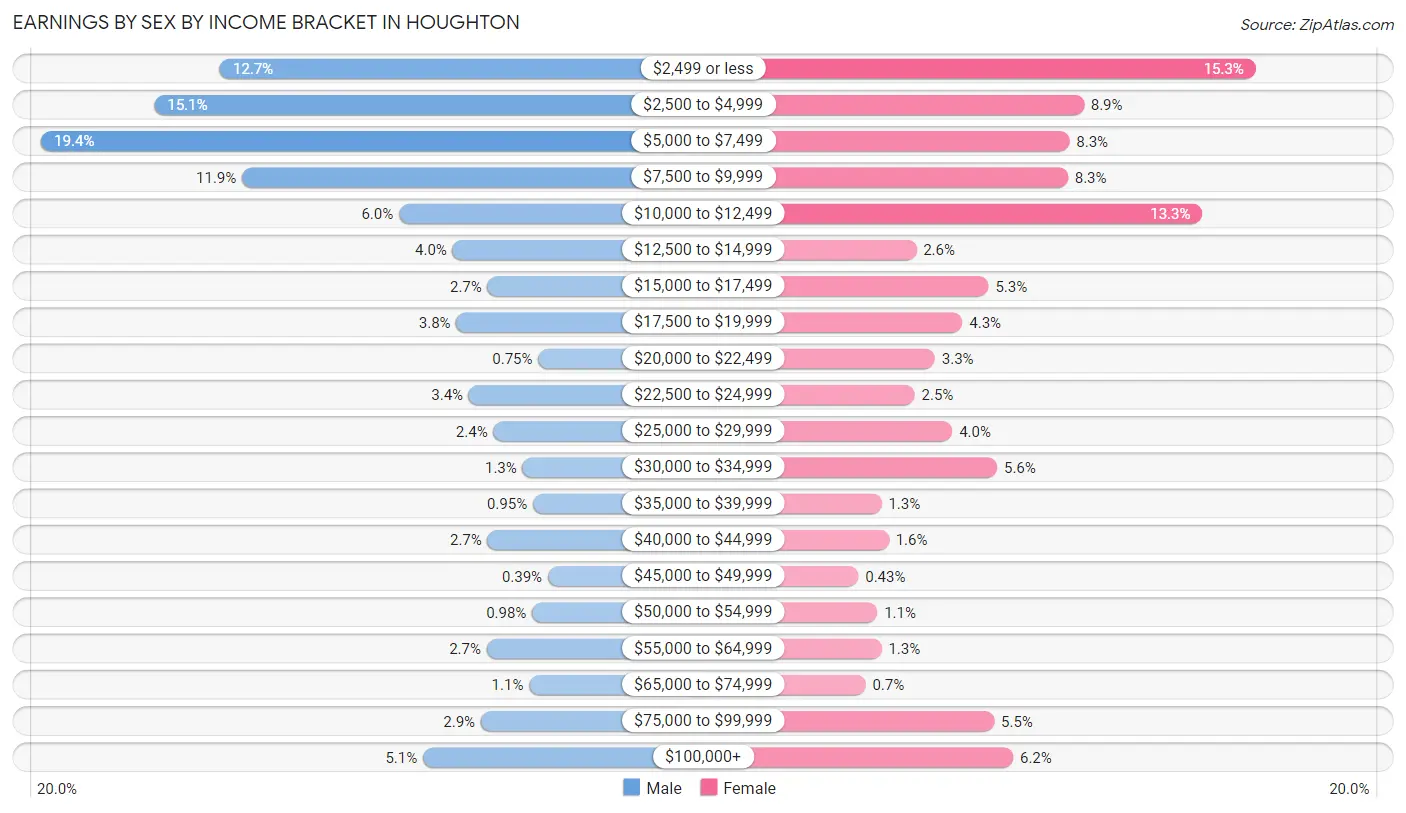
Earnings by Sex by Income Bracket in Houghton
The most common earnings brackets in Houghton are $5,000 to $7,499 for men (695 | 19.4%) and $2,499 or less for women (283 | 15.3%).
| Income | Male | Female |
| $2,499 or less | 455 (12.7%) | 283 (15.3%) |
| $2,500 to $4,999 | 543 (15.1%) | 164 (8.9%) |
| $5,000 to $7,499 | 695 (19.4%) | 154 (8.3%) |
| $7,500 to $9,999 | 425 (11.8%) | 153 (8.3%) |
| $10,000 to $12,499 | 214 (6.0%) | 246 (13.3%) |
| $12,500 to $14,999 | 142 (4.0%) | 48 (2.6%) |
| $15,000 to $17,499 | 95 (2.6%) | 98 (5.3%) |
| $17,500 to $19,999 | 137 (3.8%) | 80 (4.3%) |
| $20,000 to $22,499 | 27 (0.7%) | 61 (3.3%) |
| $22,500 to $24,999 | 120 (3.4%) | 47 (2.5%) |
| $25,000 to $29,999 | 87 (2.4%) | 73 (4.0%) |
| $30,000 to $34,999 | 48 (1.3%) | 104 (5.6%) |
| $35,000 to $39,999 | 34 (0.9%) | 24 (1.3%) |
| $40,000 to $44,999 | 95 (2.6%) | 29 (1.6%) |
| $45,000 to $49,999 | 14 (0.4%) | 8 (0.4%) |
| $50,000 to $54,999 | 35 (1.0%) | 21 (1.1%) |
| $55,000 to $64,999 | 96 (2.7%) | 24 (1.3%) |
| $65,000 to $74,999 | 39 (1.1%) | 13 (0.7%) |
| $75,000 to $99,999 | 104 (2.9%) | 102 (5.5%) |
| $100,000+ | 182 (5.1%) | 115 (6.2%) |
| Total | 3,587 (100.0%) | 1,847 (100.0%) |
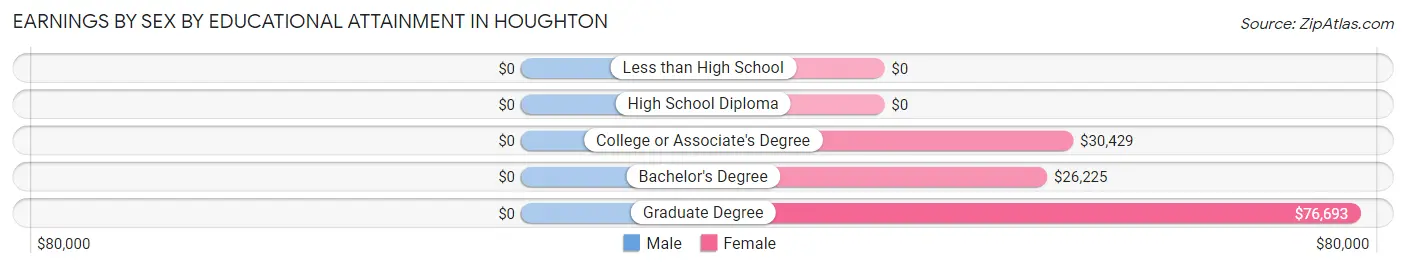
Earnings by Sex by Educational Attainment in Houghton
| Educational Attainment | Male Income | Female Income |
| Less than High School | - | - |
| High School Diploma | - | - |
| College or Associate's Degree | - | - |
| Bachelor's Degree | - | - |
| Graduate Degree | - | - |
| Total | $24,954 | $26,123 |
Family Income in Houghton
Family Income Brackets in Houghton
According to the Houghton family income data, there are 163 families falling into the $150,000 to $199,999 income range, which is the most common income bracket and makes up 17.7% of all families. Conversely, the $35,000 to $49,999 income bracket is the least frequent group with only 8 families (0.9%) belonging to this category.
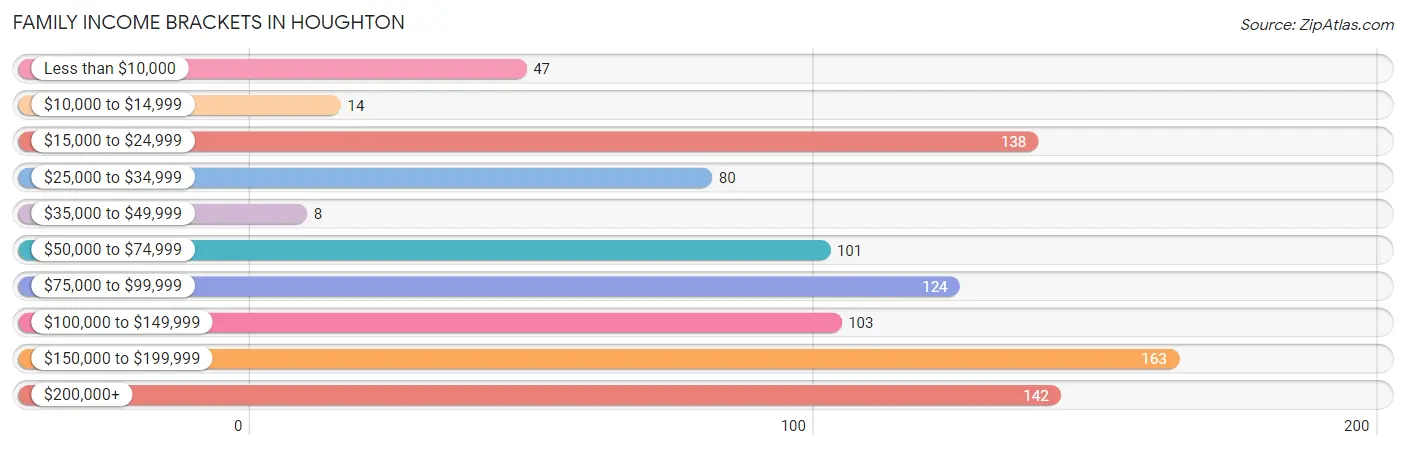
| Income Bracket | # Families | % Families |
| Less than $10,000 | 47 | 5.1% |
| $10,000 to $14,999 | 14 | 1.5% |
| $15,000 to $24,999 | 138 | 15.0% |
| $25,000 to $34,999 | 80 | 8.7% |
| $35,000 to $49,999 | 8 | 0.9% |
| $50,000 to $74,999 | 101 | 11.0% |
| $75,000 to $99,999 | 124 | 13.5% |
| $100,000 to $149,999 | 103 | 11.2% |
| $150,000 to $199,999 | 163 | 17.7% |
| $200,000+ | 142 | 15.4% |
Family Income by Famaliy Size in Houghton
4-person families (92 | 10.0%) account for the highest median family income in Houghton with $182,708 per family, while 4-person families (92 | 10.0%) have the highest median income of $45,677 per family member.
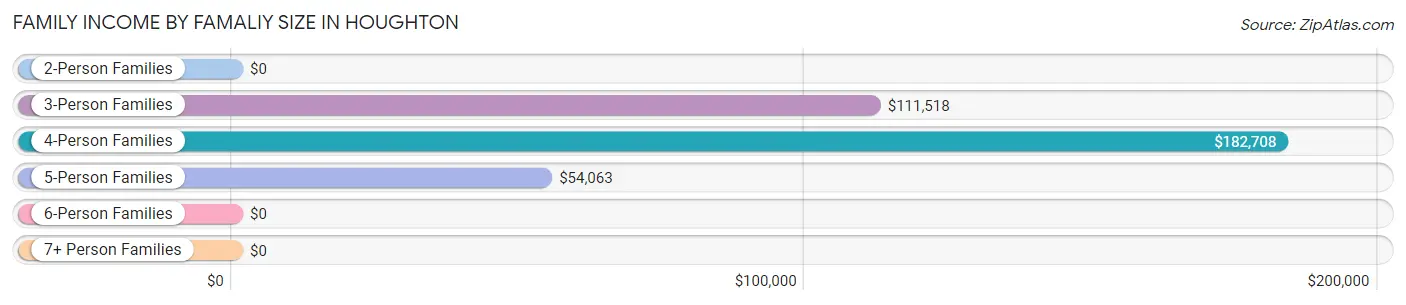
| Income Bracket | # Families | Median Income |
| 2-Person Families | 432 (47.0%) | $0 |
| 3-Person Families | 251 (27.3%) | $111,518 |
| 4-Person Families | 92 (10.0%) | $182,708 |
| 5-Person Families | 86 (9.3%) | $54,063 |
| 6-Person Families | 36 (3.9%) | $0 |
| 7+ Person Families | 23 (2.5%) | $0 |
| Total | 920 (100.0%) | $85,400 |
Family Income by Number of Earners in Houghton
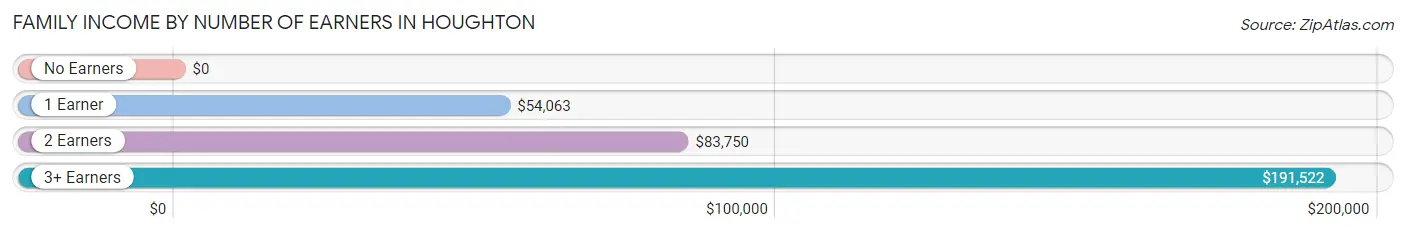
| Number of Earners | # Families | Median Income |
| No Earners | 105 (11.4%) | $0 |
| 1 Earner | 272 (29.6%) | $54,063 |
| 2 Earners | 403 (43.8%) | $83,750 |
| 3+ Earners | 140 (15.2%) | $191,522 |
| Total | 920 (100.0%) | $85,400 |
Household Income in Houghton
Household Income Brackets in Houghton
With 563 households falling in the category, the $15,000 to $24,999 income range is the most frequent in Houghton, accounting for 23.6% of all households. In contrast, only 114 households (4.8%) fall into the $100,000 to $149,999 income bracket, making it the least populous group.
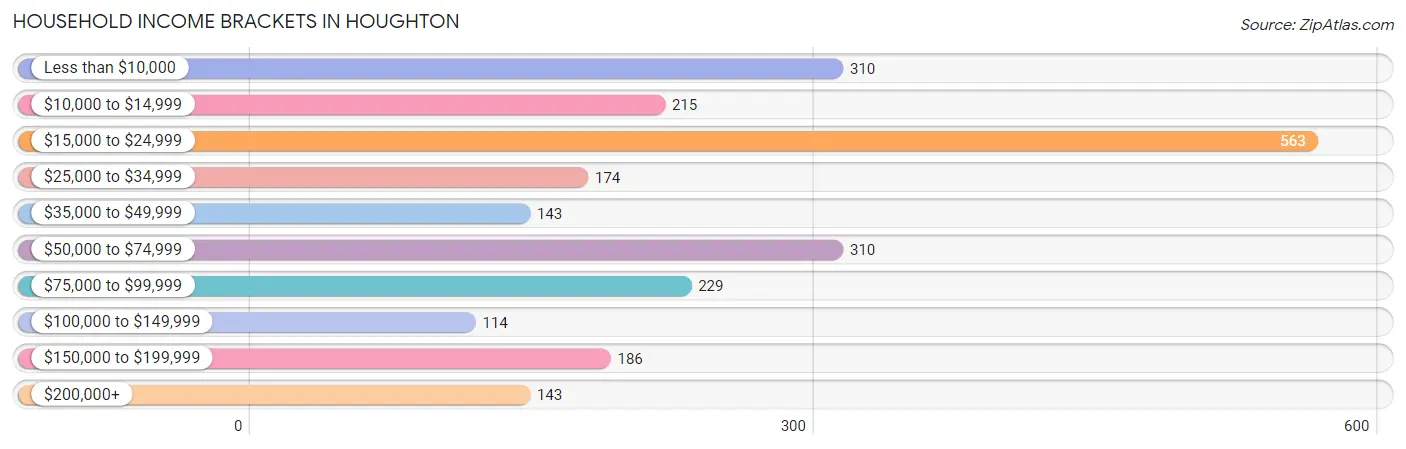
| Income Bracket | # Households | % Households |
| Less than $10,000 | 310 | 13.0% |
| $10,000 to $14,999 | 215 | 9.0% |
| $15,000 to $24,999 | 563 | 23.6% |
| $25,000 to $34,999 | 174 | 7.3% |
| $35,000 to $49,999 | 143 | 6.0% |
| $50,000 to $74,999 | 310 | 13.0% |
| $75,000 to $99,999 | 229 | 9.6% |
| $100,000 to $149,999 | 114 | 4.8% |
| $150,000 to $199,999 | 186 | 7.8% |
| $200,000+ | 143 | 6.0% |
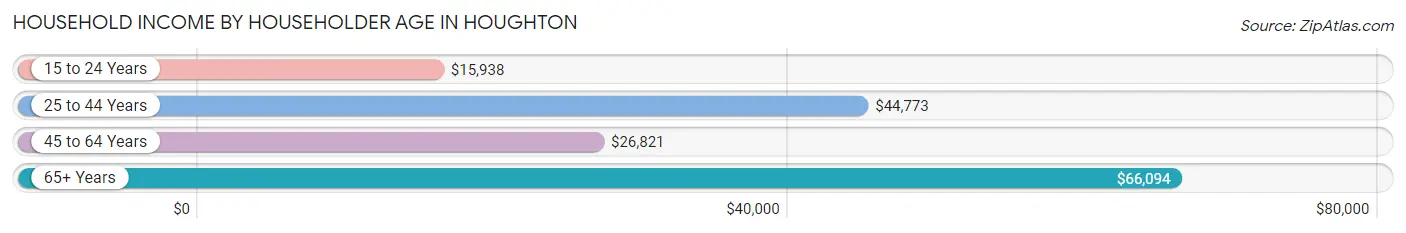
Household Income by Householder Age in Houghton
The median household income in Houghton is $29,821, with the highest median household income of $66,094 found in the 65+ years age bracket for the primary householder. A total of 487 households (20.4%) fall into this category. Meanwhile, the 15 to 24 years age bracket for the primary householder has the lowest median household income of $15,938, with 781 households (32.8%) in this group.
| Income Bracket | # Households | Median Income |
| 15 to 24 Years | 781 (32.8%) | $15,938 |
| 25 to 44 Years | 628 (26.3%) | $44,773 |
| 45 to 64 Years | 489 (20.5%) | $26,821 |
| 65+ Years | 487 (20.4%) | $66,094 |
| Total | 2,385 (100.0%) | $29,821 |
Poverty in Houghton
Income Below Poverty by Sex and Age in Houghton
With 41.6% poverty level for males and 26.6% for females among the residents of Houghton, 18 to 24 year old males and 18 to 24 year old females are the most vulnerable to poverty, with 885 males (71.8%) and 437 females (70.9%) in their respective age groups living below the poverty level.
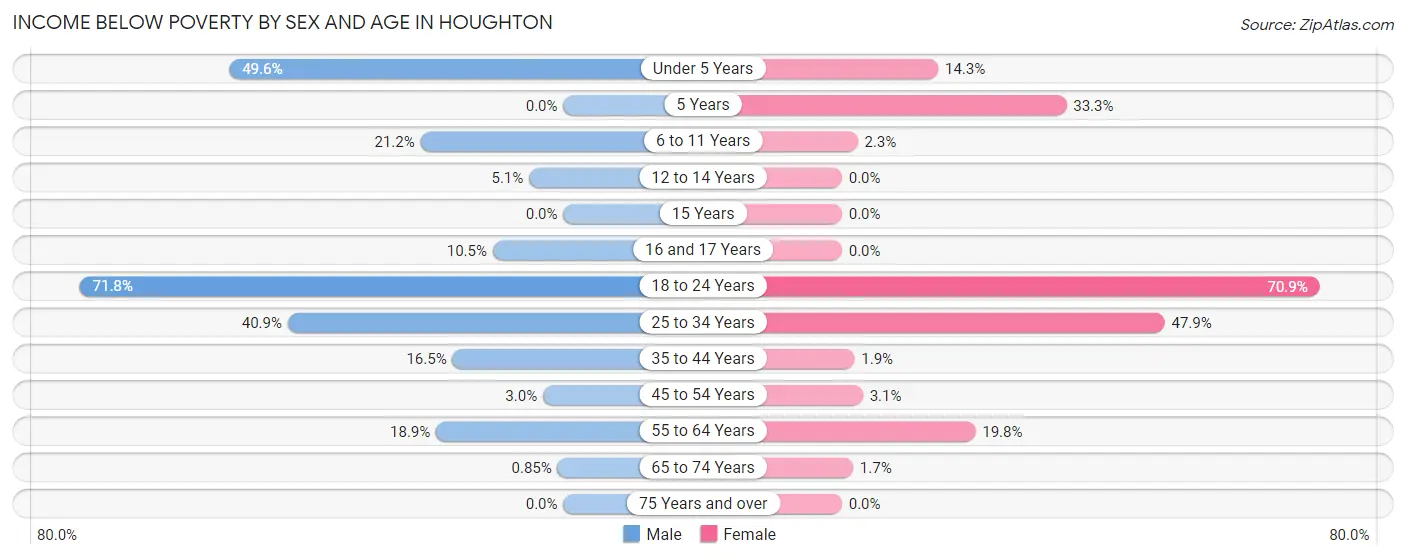
| Age Bracket | Male | Female |
| Under 5 Years | 63 (49.6%) | 12 (14.3%) |
| 5 Years | 0 (0.0%) | 13 (33.3%) |
| 6 to 11 Years | 28 (21.2%) | 3 (2.3%) |
| 12 to 14 Years | 3 (5.1%) | 0 (0.0%) |
| 15 Years | 0 (0.0%) | 0 (0.0%) |
| 16 and 17 Years | 9 (10.5%) | 0 (0.0%) |
| 18 to 24 Years | 885 (71.8%) | 437 (70.9%) |
| 25 to 34 Years | 169 (40.9%) | 116 (47.9%) |
| 35 to 44 Years | 26 (16.5%) | 4 (1.9%) |
| 45 to 54 Years | 6 (3.0%) | 7 (3.1%) |
| 55 to 64 Years | 34 (18.9%) | 44 (19.8%) |
| 65 to 74 Years | 1 (0.9%) | 3 (1.7%) |
| 75 Years and over | 0 (0.0%) | 0 (0.0%) |
| Total | 1,224 (41.6%) | 639 (26.6%) |
Income Above Poverty by Sex and Age in Houghton
According to the poverty statistics in Houghton, males aged 5 years and females aged 12 to 14 years are the age groups that are most secure financially, with 100.0% of males and 100.0% of females in these age groups living above the poverty line.
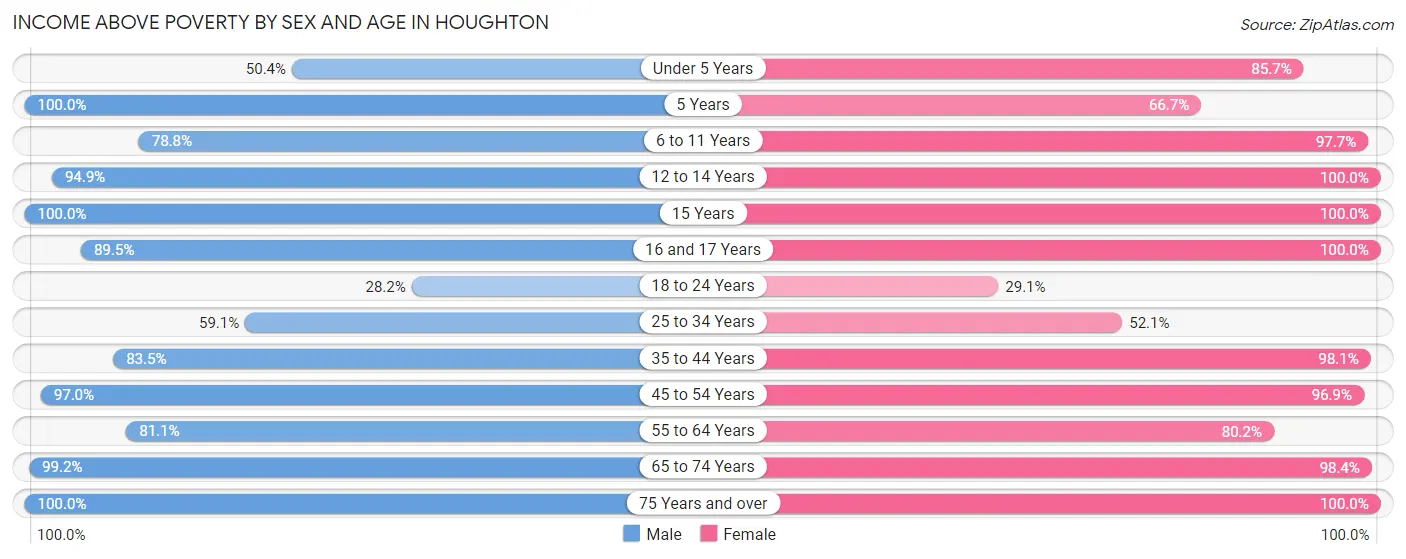
| Age Bracket | Male | Female |
| Under 5 Years | 64 (50.4%) | 72 (85.7%) |
| 5 Years | 36 (100.0%) | 26 (66.7%) |
| 6 to 11 Years | 104 (78.8%) | 125 (97.7%) |
| 12 to 14 Years | 56 (94.9%) | 131 (100.0%) |
| 15 Years | 19 (100.0%) | 10 (100.0%) |
| 16 and 17 Years | 77 (89.5%) | 76 (100.0%) |
| 18 to 24 Years | 347 (28.2%) | 179 (29.1%) |
| 25 to 34 Years | 244 (59.1%) | 126 (52.1%) |
| 35 to 44 Years | 132 (83.5%) | 210 (98.1%) |
| 45 to 54 Years | 193 (97.0%) | 218 (96.9%) |
| 55 to 64 Years | 146 (81.1%) | 178 (80.2%) |
| 65 to 74 Years | 117 (99.2%) | 179 (98.4%) |
| 75 Years and over | 180 (100.0%) | 237 (100.0%) |
| Total | 1,715 (58.4%) | 1,767 (73.4%) |
Income Below Poverty Among Married-Couple Families in Houghton
The poverty statistics for married-couple families in Houghton show that 9.0% or 59 of the total 654 families live below the poverty line. Families with 3 or 4 children have the highest poverty rate of 14.1%, comprising of 12 families. On the other hand, families with 1 or 2 children have the lowest poverty rate of 7.9%, which includes 17 families.
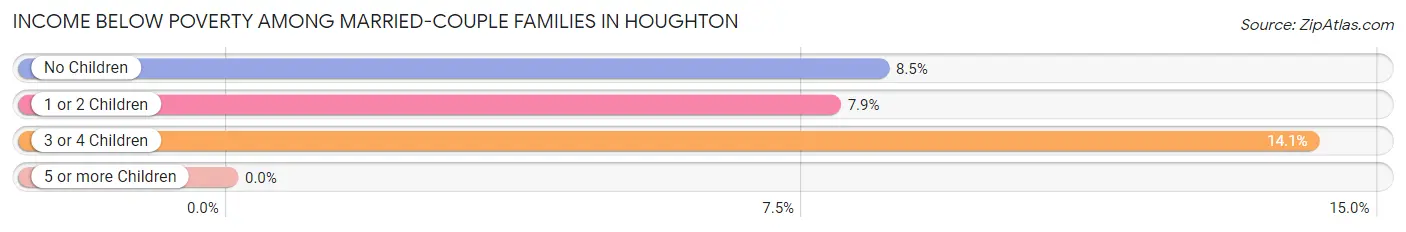
| Children | Above Poverty | Below Poverty |
| No Children | 323 (91.5%) | 30 (8.5%) |
| 1 or 2 Children | 199 (92.1%) | 17 (7.9%) |
| 3 or 4 Children | 73 (85.9%) | 12 (14.1%) |
| 5 or more Children | 0 (0.0%) | 0 (0.0%) |
| Total | 595 (91.0%) | 59 (9.0%) |
Income Below Poverty Among Single-Parent Households in Houghton
According to the poverty data in Houghton, 88.5% or 69 single-father households and 12.8% or 24 single-mother households are living below the poverty line. Among single-father households, those with no children have the highest poverty rate, with 53 households (100.0%) experiencing poverty. Likewise, among single-mother households, those with 1 or 2 children have the highest poverty rate, with 24 households (15.6%) falling below the poverty line.
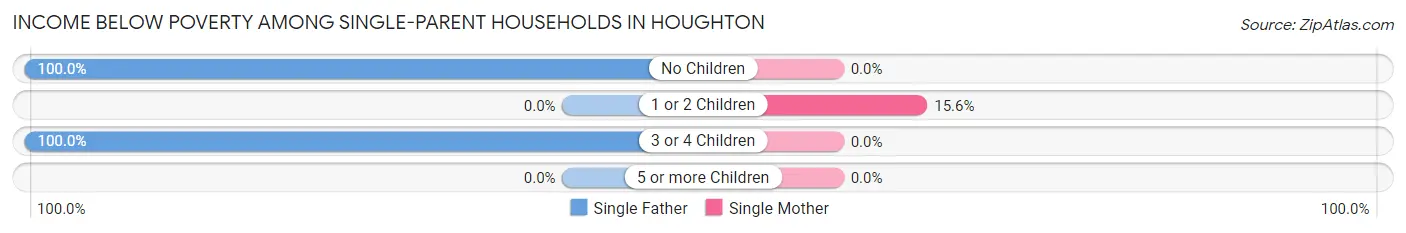
| Children | Single Father | Single Mother |
| No Children | 53 (100.0%) | 0 (0.0%) |
| 1 or 2 Children | 0 (0.0%) | 24 (15.6%) |
| 3 or 4 Children | 16 (100.0%) | 0 (0.0%) |
| 5 or more Children | 0 (0.0%) | 0 (0.0%) |
| Total | 69 (88.5%) | 24 (12.8%) |
Income Below Poverty Among Married-Couple vs Single-Parent Households in Houghton
The poverty data for Houghton shows that 59 of the married-couple family households (9.0%) and 93 of the single-parent households (35.0%) are living below the poverty level. Within the married-couple family households, those with 3 or 4 children have the highest poverty rate, with 12 households (14.1%) falling below the poverty line. Among the single-parent households, those with 3 or 4 children have the highest poverty rate, with 16 household (72.7%) living below poverty.
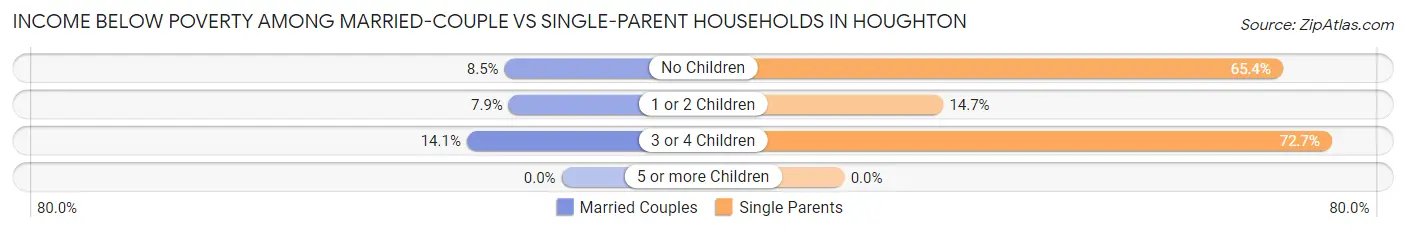
| Children | Married-Couple Families | Single-Parent Households |
| No Children | 30 (8.5%) | 53 (65.4%) |
| 1 or 2 Children | 17 (7.9%) | 24 (14.7%) |
| 3 or 4 Children | 12 (14.1%) | 16 (72.7%) |
| 5 or more Children | 0 (0.0%) | 0 (0.0%) |
| Total | 59 (9.0%) | 93 (35.0%) |
Race in Houghton
The most populous races in Houghton are White / Caucasian (6,566 | 79.1%), Asian (757 | 9.1%), and Two or more Races (382 | 4.6%).
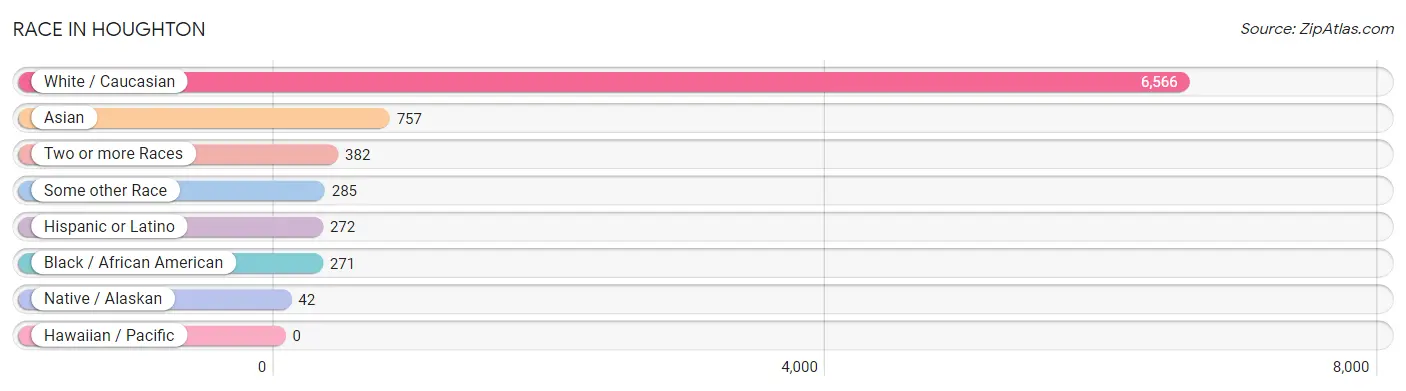
| Race | # Population | % Population |
| Asian | 757 | 9.1% |
| Black / African American | 271 | 3.3% |
| Hawaiian / Pacific | 0 | 0.0% |
| Hispanic or Latino | 272 | 3.3% |
| Native / Alaskan | 42 | 0.5% |
| White / Caucasian | 6,566 | 79.1% |
| Two or more Races | 382 | 4.6% |
| Some other Race | 285 | 3.4% |
| Total | 8,303 | 100.0% |
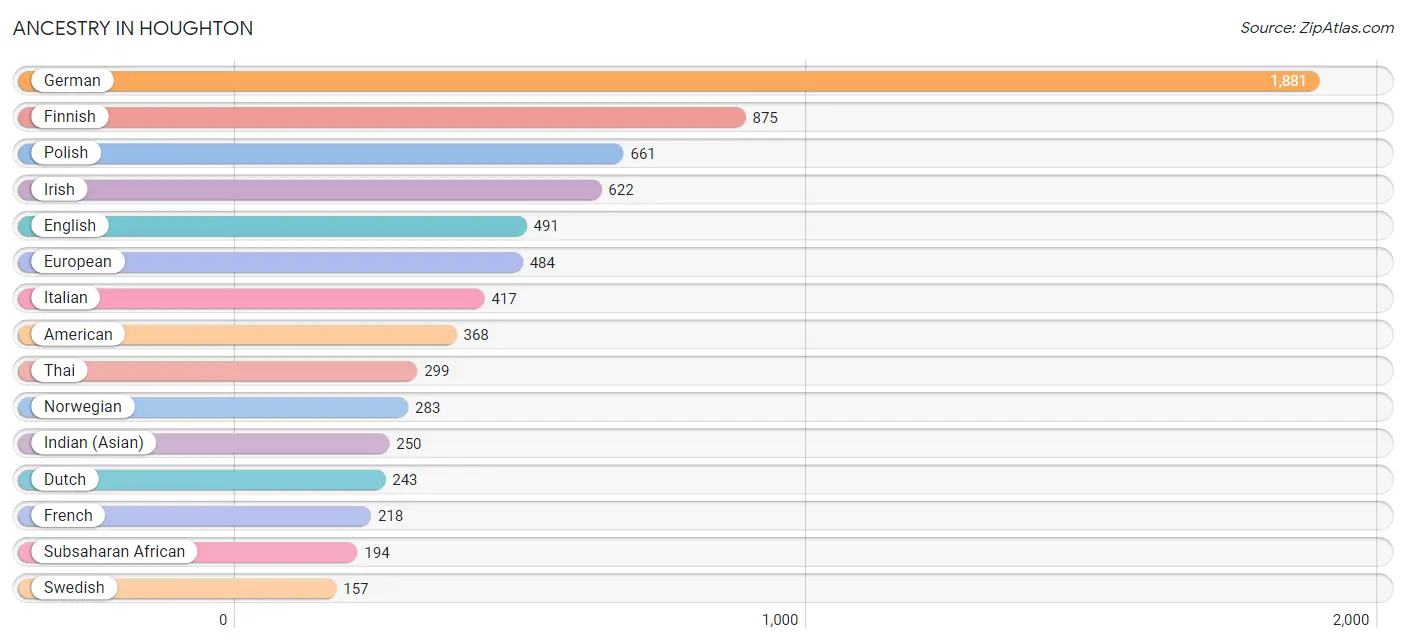
Ancestry in Houghton
The most populous ancestries reported in Houghton are German (1,881 | 22.7%), Finnish (875 | 10.5%), Polish (661 | 8.0%), Irish (622 | 7.5%), and English (491 | 5.9%), together accounting for 54.5% of all Houghton residents.
| Ancestry | # Population | % Population |
| African | 8 | 0.1% |
| Albanian | 11 | 0.1% |
| American | 368 | 4.4% |
| Arab | 55 | 0.7% |
| Argentinean | 15 | 0.2% |
| Austrian | 8 | 0.1% |
| Belgian | 13 | 0.2% |
| Bhutanese | 6 | 0.1% |
| Blackfeet | 5 | 0.1% |
| Brazilian | 11 | 0.1% |
| British | 10 | 0.1% |
| Burmese | 106 | 1.3% |
| Canadian | 11 | 0.1% |
| Cherokee | 5 | 0.1% |
| Chippewa | 63 | 0.8% |
| Cuban | 39 | 0.5% |
| Czech | 39 | 0.5% |
| Danish | 10 | 0.1% |
| Dutch | 243 | 2.9% |
| Eastern European | 135 | 1.6% |
| English | 491 | 5.9% |
| European | 484 | 5.8% |
| Finnish | 875 | 10.5% |
| French | 218 | 2.6% |
| French Canadian | 75 | 0.9% |
| German | 1,881 | 22.7% |
| Greek | 24 | 0.3% |
| Hungarian | 60 | 0.7% |
| Indian (Asian) | 250 | 3.0% |
| Iranian | 49 | 0.6% |
| Irish | 622 | 7.5% |
| Italian | 417 | 5.0% |
| Kenyan | 62 | 0.7% |
| Korean | 5 | 0.1% |
| Lebanese | 55 | 0.7% |
| Lithuanian | 33 | 0.4% |
| Lumbee | 3 | 0.0% |
| Mexican | 125 | 1.5% |
| Native Hawaiian | 10 | 0.1% |
| Nigerian | 124 | 1.5% |
| Northern European | 109 | 1.3% |
| Norwegian | 283 | 3.4% |
| Peruvian | 15 | 0.2% |
| Polish | 661 | 8.0% |
| Potawatomi | 23 | 0.3% |
| Puerto Rican | 14 | 0.2% |
| Russian | 40 | 0.5% |
| Scandinavian | 59 | 0.7% |
| Scotch-Irish | 118 | 1.4% |
| Scottish | 103 | 1.2% |
| Sioux | 48 | 0.6% |
| Slovak | 16 | 0.2% |
| Slovene | 2 | 0.0% |
| South American | 47 | 0.6% |
| Spaniard | 39 | 0.5% |
| Spanish | 8 | 0.1% |
| Sri Lankan | 16 | 0.2% |
| Subsaharan African | 194 | 2.3% |
| Swedish | 157 | 1.9% |
| Thai | 299 | 3.6% |
| Turkish | 37 | 0.4% |
| Ukrainian | 19 | 0.2% |
| Venezuelan | 17 | 0.2% |
| Vietnamese | 62 | 0.7% |
| Welsh | 30 | 0.4% | View All 65 Rows |
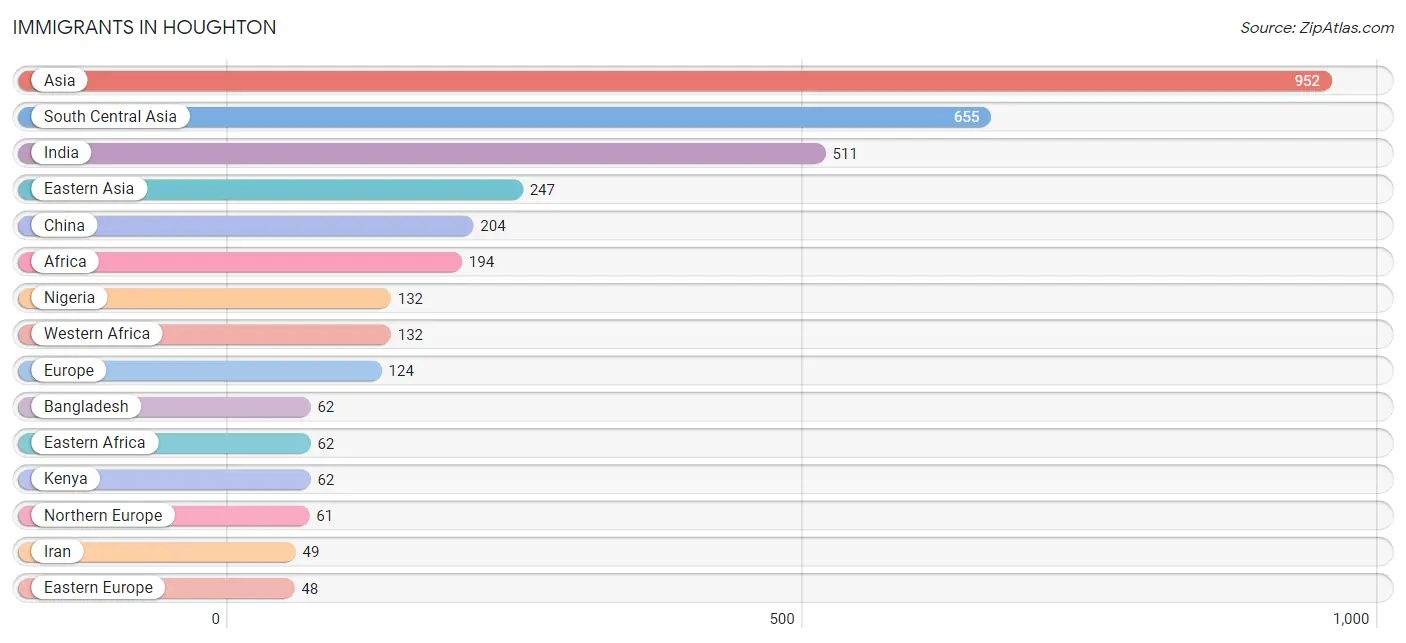
Immigrants in Houghton
The most numerous immigrant groups reported in Houghton came from Asia (952 | 11.5%), South Central Asia (655 | 7.9%), India (511 | 6.1%), Eastern Asia (247 | 3.0%), and China (204 | 2.5%), together accounting for 30.9% of all Houghton residents.
| Immigration Origin | # Population | % Population |
| Africa | 194 | 2.3% |
| Argentina | 15 | 0.2% |
| Asia | 952 | 11.5% |
| Bangladesh | 62 | 0.7% |
| Canada | 46 | 0.5% |
| Caribbean | 8 | 0.1% |
| China | 204 | 2.5% |
| Eastern Africa | 62 | 0.7% |
| Eastern Asia | 247 | 3.0% |
| Eastern Europe | 48 | 0.6% |
| England | 24 | 0.3% |
| Europe | 124 | 1.5% |
| Greece | 6 | 0.1% |
| India | 511 | 6.1% |
| Iran | 49 | 0.6% |
| Japan | 16 | 0.2% |
| Kenya | 62 | 0.7% |
| Korea | 27 | 0.3% |
| Latin America | 23 | 0.3% |
| Lithuania | 11 | 0.1% |
| Nigeria | 132 | 1.6% |
| Northern Europe | 61 | 0.7% |
| Pakistan | 33 | 0.4% |
| Philippines | 5 | 0.1% |
| Russia | 18 | 0.2% |
| Singapore | 8 | 0.1% |
| South America | 15 | 0.2% |
| South Central Asia | 655 | 7.9% |
| South Eastern Asia | 13 | 0.2% |
| Southern Europe | 15 | 0.2% |
| Spain | 9 | 0.1% |
| Taiwan | 5 | 0.1% |
| Trinidad and Tobago | 8 | 0.1% |
| Turkey | 37 | 0.4% |
| Ukraine | 19 | 0.2% |
| Western Africa | 132 | 1.6% |
| Western Asia | 37 | 0.4% | View All 37 Rows |
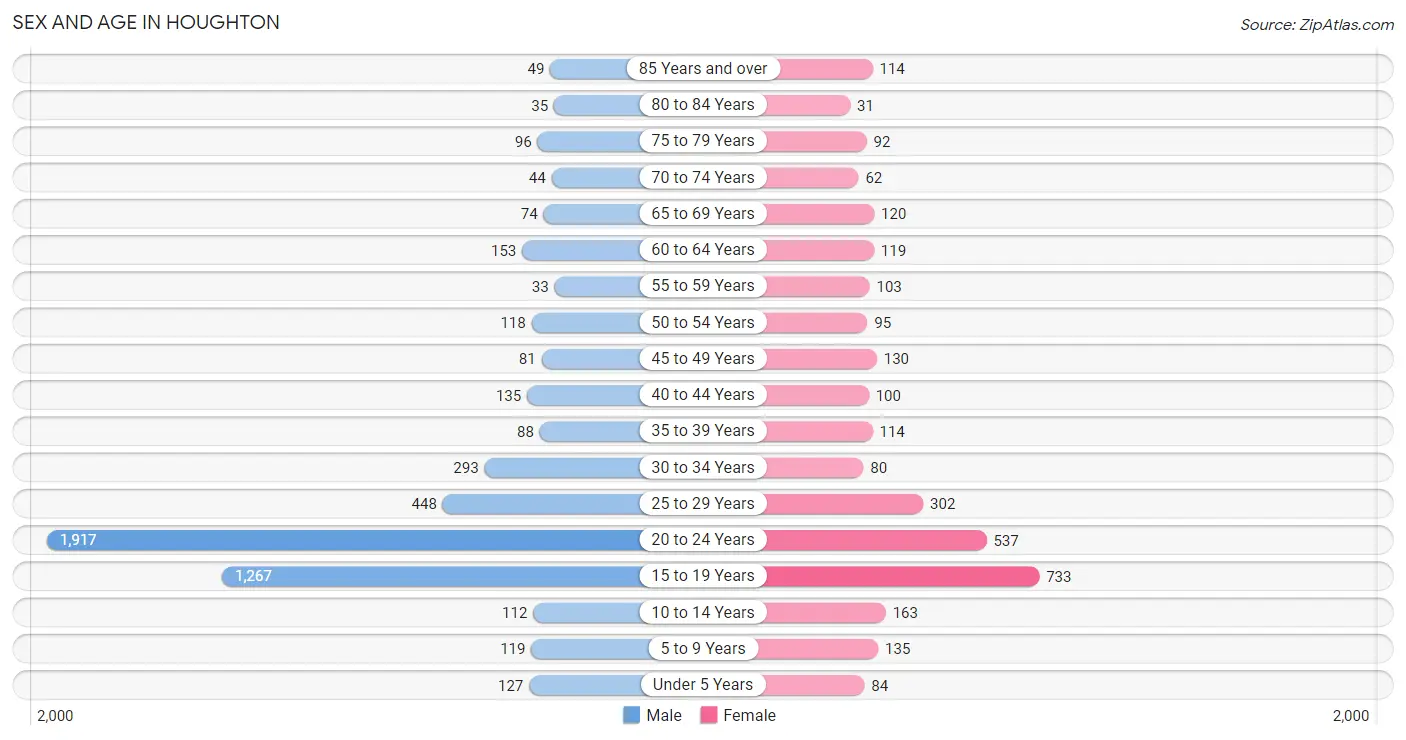
Sex and Age in Houghton
Sex and Age in Houghton
The most populous age groups in Houghton are 20 to 24 Years (1,917 | 36.9%) for men and 15 to 19 Years (733 | 23.5%) for women.
| Age Bracket | Male | Female |
| Under 5 Years | 127 (2.5%) | 84 (2.7%) |
| 5 to 9 Years | 119 (2.3%) | 135 (4.3%) |
| 10 to 14 Years | 112 (2.2%) | 163 (5.2%) |
| 15 to 19 Years | 1,267 (24.4%) | 733 (23.5%) |
| 20 to 24 Years | 1,917 (36.9%) | 537 (17.2%) |
| 25 to 29 Years | 448 (8.6%) | 302 (9.7%) |
| 30 to 34 Years | 293 (5.7%) | 80 (2.6%) |
| 35 to 39 Years | 88 (1.7%) | 114 (3.7%) |
| 40 to 44 Years | 135 (2.6%) | 100 (3.2%) |
| 45 to 49 Years | 81 (1.6%) | 130 (4.2%) |
| 50 to 54 Years | 118 (2.3%) | 95 (3.0%) |
| 55 to 59 Years | 33 (0.6%) | 103 (3.3%) |
| 60 to 64 Years | 153 (2.9%) | 119 (3.8%) |
| 65 to 69 Years | 74 (1.4%) | 120 (3.8%) |
| 70 to 74 Years | 44 (0.9%) | 62 (2.0%) |
| 75 to 79 Years | 96 (1.8%) | 92 (2.9%) |
| 80 to 84 Years | 35 (0.7%) | 31 (1.0%) |
| 85 Years and over | 49 (0.9%) | 114 (3.7%) |
| Total | 5,189 (100.0%) | 3,114 (100.0%) |
Families and Households in Houghton
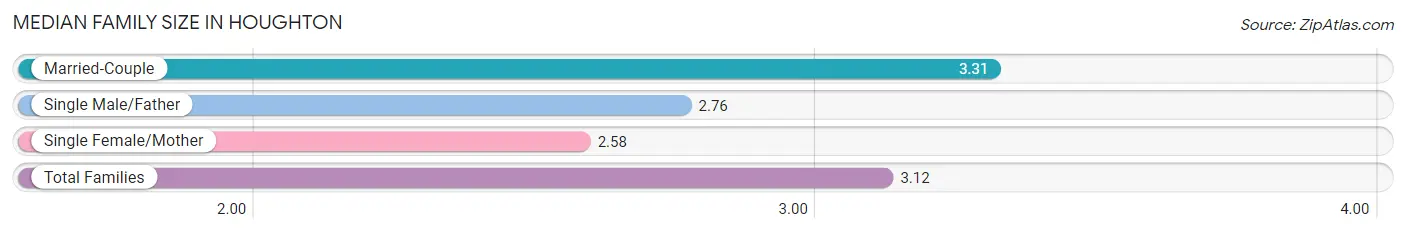
Median Family Size in Houghton
The median family size in Houghton is 3.12 persons per family, with married-couple families (654 | 71.1%) accounting for the largest median family size of 3.31 persons per family. On the other hand, single female/mother families (188 | 20.4%) represent the smallest median family size with 2.58 persons per family.
| Family Type | # Families | Family Size |
| Married-Couple | 654 (71.1%) | 3.31 |
| Single Male/Father | 78 (8.5%) | 2.76 |
| Single Female/Mother | 188 (20.4%) | 2.58 |
| Total Families | 920 (100.0%) | 3.12 |
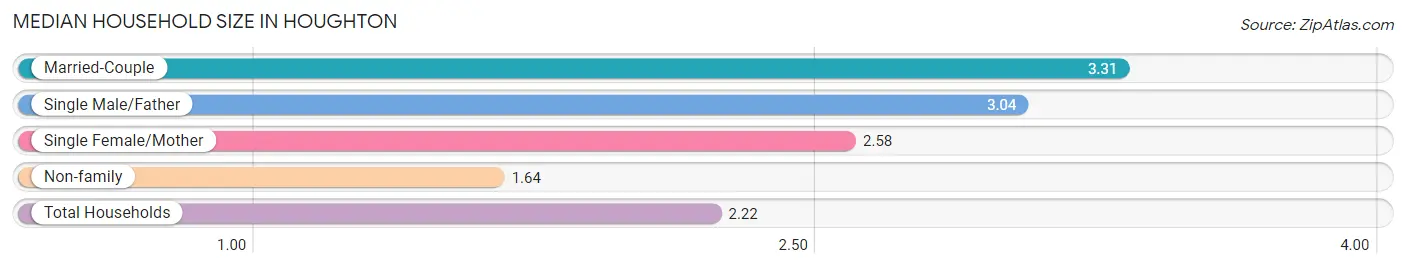
Median Household Size in Houghton
The median household size in Houghton is 2.22 persons per household, with married-couple households (654 | 27.4%) accounting for the largest median household size of 3.31 persons per household. non-family households (1,465 | 61.4%) represent the smallest median household size with 1.64 persons per household.
| Household Type | # Households | Household Size |
| Married-Couple | 654 (27.4%) | 3.31 |
| Single Male/Father | 78 (3.3%) | 3.04 |
| Single Female/Mother | 188 (7.9%) | 2.58 |
| Non-family | 1,465 (61.4%) | 1.64 |
| Total Households | 2,385 (100.0%) | 2.22 |
Household Size by Marriage Status in Houghton
Out of a total of 2,385 households in Houghton, 920 (38.6%) are family households, while 1,465 (61.4%) are nonfamily households. The most numerous type of family households are 2-person households, comprising 432, and the most common type of nonfamily households are 1-person households, comprising 958.
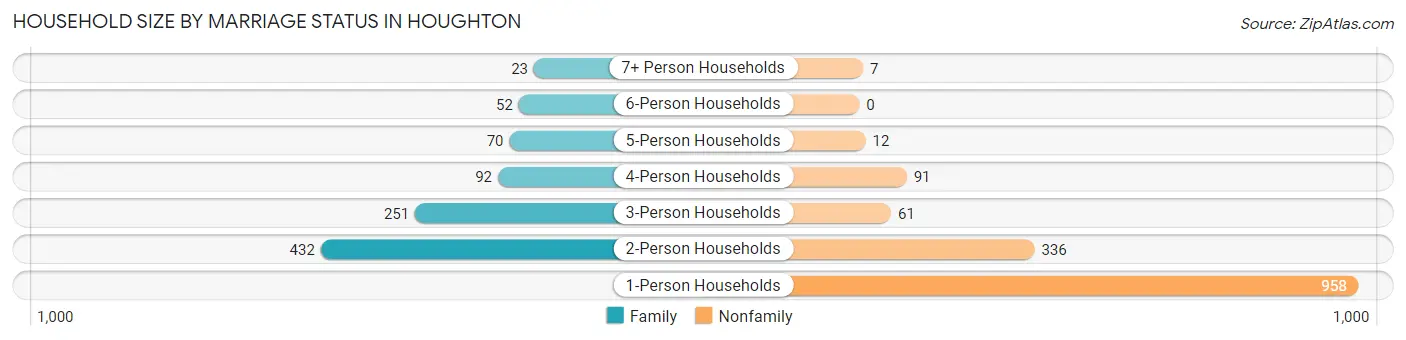
| Household Size | Family Households | Nonfamily Households |
| 1-Person Households | - | 958 (40.2%) |
| 2-Person Households | 432 (18.1%) | 336 (14.1%) |
| 3-Person Households | 251 (10.5%) | 61 (2.6%) |
| 4-Person Households | 92 (3.9%) | 91 (3.8%) |
| 5-Person Households | 70 (2.9%) | 12 (0.5%) |
| 6-Person Households | 52 (2.2%) | 0 (0.0%) |
| 7+ Person Households | 23 (1.0%) | 7 (0.3%) |
| Total | 920 (38.6%) | 1,465 (61.4%) |
Female Fertility in Houghton
Fertility by Age in Houghton
Average fertility rate in Houghton is 20.0 births per 1,000 women. Women in the age bracket of 35 to 50 years have the highest fertility rate with 51.0 births per 1,000 women. Women in the age bracket of 20 to 34 years acount for 53.7% of all women with births.
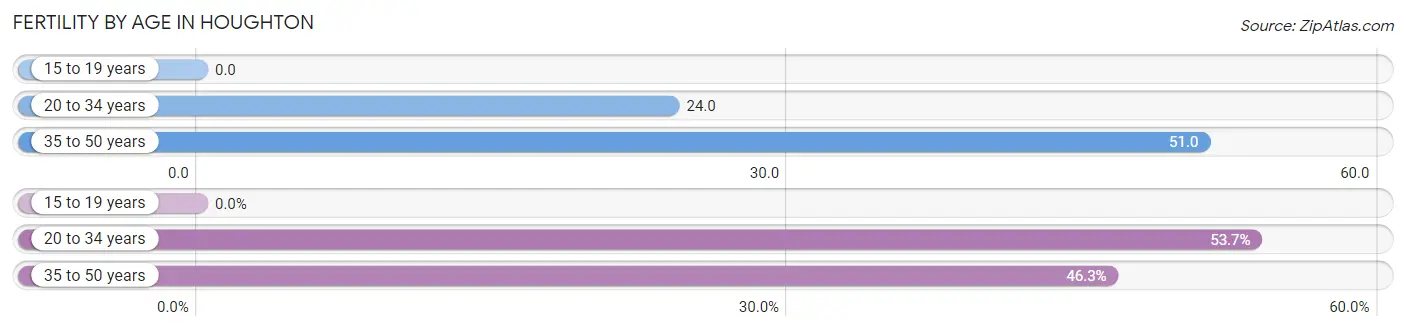
| Age Bracket | Women with Births | Births / 1,000 Women |
| 15 to 19 years | 0 (0.0%) | 0.0 |
| 20 to 34 years | 22 (53.7%) | 24.0 |
| 35 to 50 years | 19 (46.3%) | 51.0 |
| Total | 41 (100.0%) | 20.0 |
Fertility by Age by Marriage Status in Houghton
46.3% of women with births (41) in Houghton are married. The highest percentage of unmarried women with births falls into 20 to 34 years age bracket with 100.0% of them unmarried at the time of birth, while the lowest percentage of unmarried women with births belong to 35 to 50 years age bracket with 0.0% of them unmarried.
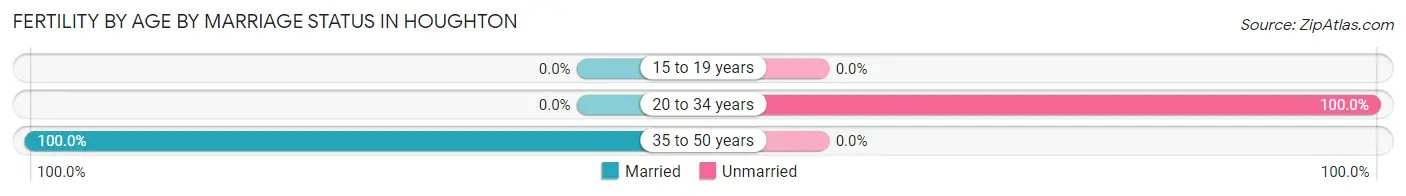
| Age Bracket | Married | Unmarried |
| 15 to 19 years | 0 (0.0%) | 0 (0.0%) |
| 20 to 34 years | 0 (0.0%) | 22 (100.0%) |
| 35 to 50 years | 19 (100.0%) | 0 (0.0%) |
| Total | 19 (46.3%) | 22 (53.7%) |
Fertility by Education in Houghton
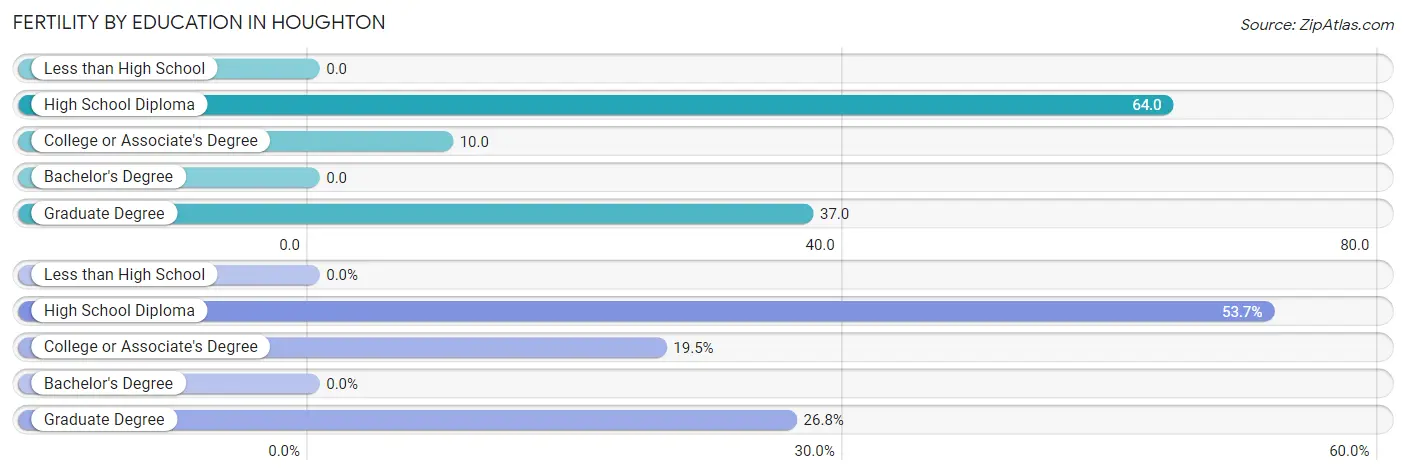
| Educational Attainment | Women with Births | Births / 1,000 Women |
| Less than High School | 0 (0.0%) | 0.0 |
| High School Diploma | 22 (53.7%) | 64.0 |
| College or Associate's Degree | 8 (19.5%) | 10.0 |
| Bachelor's Degree | 0 (0.0%) | 0.0 |
| Graduate Degree | 11 (26.8%) | 37.0 |
| Total | 41 (100.0%) | 20.0 |
Fertility by Education by Marriage Status in Houghton
53.7% of women with births in Houghton are unmarried. Women with the educational attainment of college or associate's degree are most likely to be married with 100.0% of them married at childbirth, while women with the educational attainment of high school diploma are least likely to be married with 100.0% of them unmarried at childbirth.
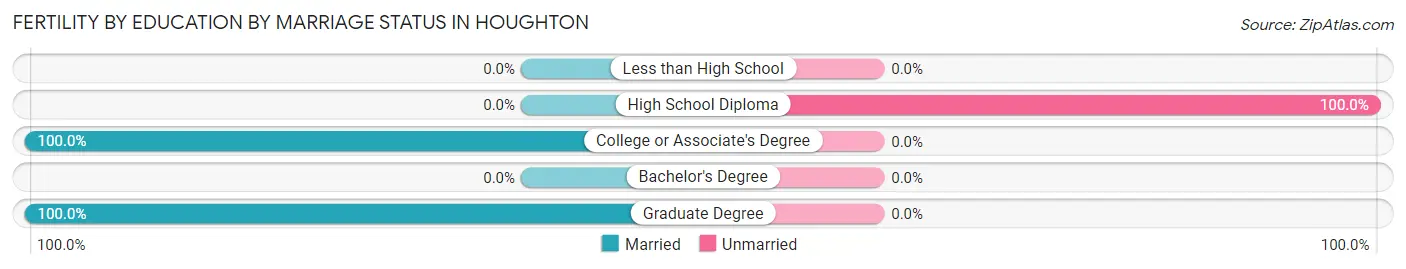
| Educational Attainment | Married | Unmarried |
| Less than High School | 0 (0.0%) | 0 (0.0%) |
| High School Diploma | 0 (0.0%) | 22 (100.0%) |
| College or Associate's Degree | 8 (100.0%) | 0 (0.0%) |
| Bachelor's Degree | 0 (0.0%) | 0 (0.0%) |
| Graduate Degree | 11 (100.0%) | 0 (0.0%) |
| Total | 19 (46.3%) | 22 (53.7%) |
Employment Characteristics in Houghton
Employment by Class of Employer in Houghton
Among the 3,343 employed individuals in Houghton, private company employees (1,798 | 53.8%), state government employees (928 | 27.8%), and not-for-profit organizations (276 | 8.3%) make up the most common classes of employment.
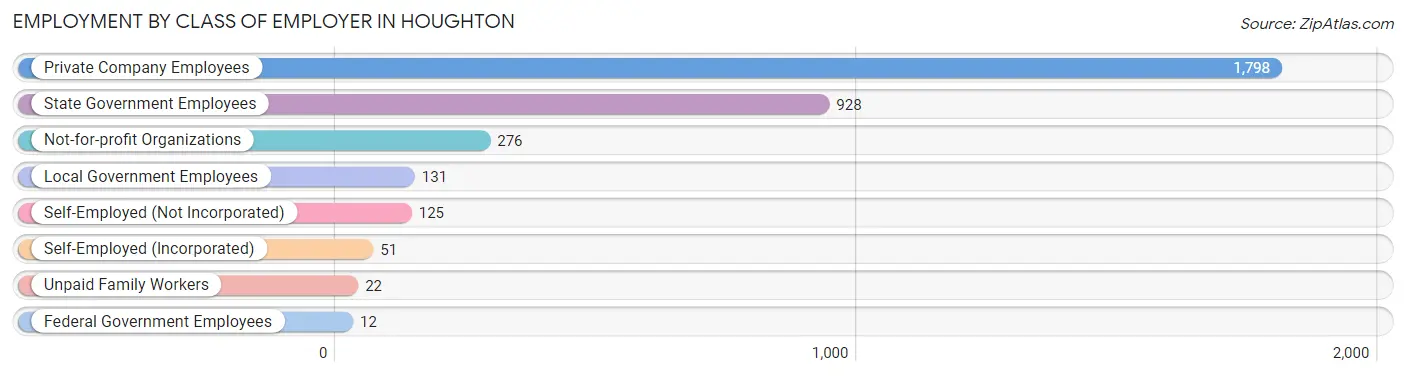
| Employer Class | # Employees | % Employees |
| Private Company Employees | 1,798 | 53.8% |
| Self-Employed (Incorporated) | 51 | 1.5% |
| Self-Employed (Not Incorporated) | 125 | 3.7% |
| Not-for-profit Organizations | 276 | 8.3% |
| Local Government Employees | 131 | 3.9% |
| State Government Employees | 928 | 27.8% |
| Federal Government Employees | 12 | 0.4% |
| Unpaid Family Workers | 22 | 0.7% |
| Total | 3,343 | 100.0% |
Employment Status by Age in Houghton
According to the labor force statistics for Houghton, out of the total population over 16 years of age (7,534), 53.1% or 4,001 individuals are in the labor force, with 11.9% or 476 of them unemployed. The age group with the highest labor force participation rate is 55 to 59 years, with 100.0% or 136 individuals in the labor force. Within the labor force, the 20 to 24 years age range has the highest percentage of unemployed individuals, with 22.7% or 293 of them being unemployed.
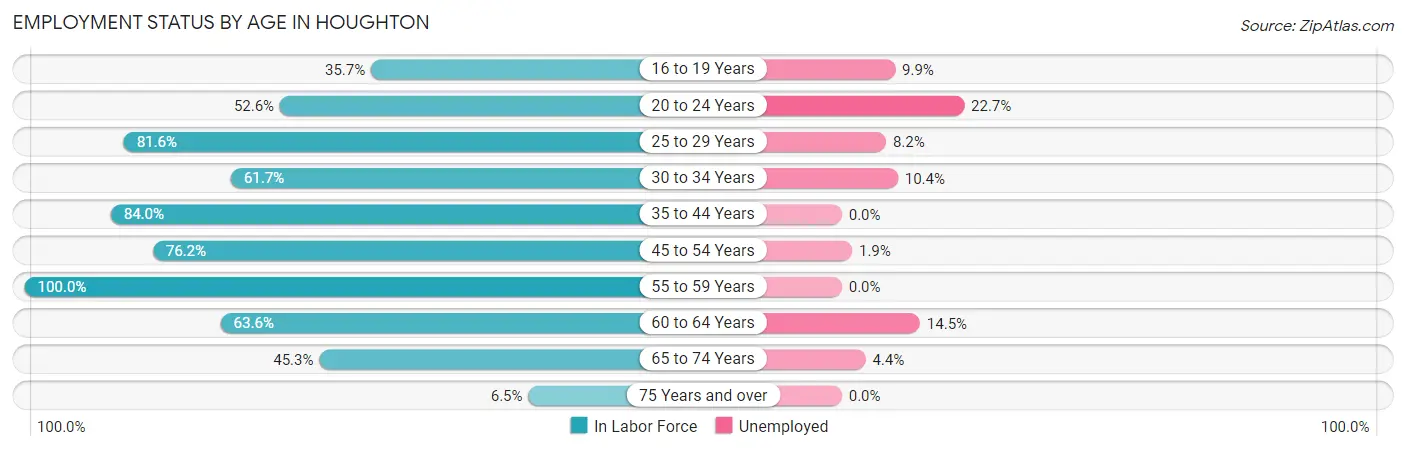
| Age Bracket | In Labor Force | Unemployed |
| 16 to 19 Years | 704 (35.7%) | 70 (9.9%) |
| 20 to 24 Years | 1,291 (52.6%) | 293 (22.7%) |
| 25 to 29 Years | 612 (81.6%) | 50 (8.2%) |
| 30 to 34 Years | 230 (61.7%) | 24 (10.4%) |
| 35 to 44 Years | 367 (84.0%) | 0 (0.0%) |
| 45 to 54 Years | 323 (76.2%) | 6 (1.9%) |
| 55 to 59 Years | 136 (100.0%) | 0 (0.0%) |
| 60 to 64 Years | 173 (63.6%) | 25 (14.5%) |
| 65 to 74 Years | 136 (45.3%) | 6 (4.4%) |
| 75 Years and over | 27 (6.5%) | 0 (0.0%) |
| Total | 4,001 (53.1%) | 476 (11.9%) |
Employment Status by Educational Attainment in Houghton
According to labor force statistics for Houghton, 77.0% of individuals (1,842) out of the total population between 25 and 64 years of age (2,392) are in the labor force, with 5.7% or 105 of them being unemployed. The group with the highest labor force participation rate are those with the educational attainment of college / associate degree, with 87.0% or 322 individuals in the labor force. Within the labor force, individuals with less than high school education have the highest percentage of unemployment, with 25.2% or 26 of them being unemployed.
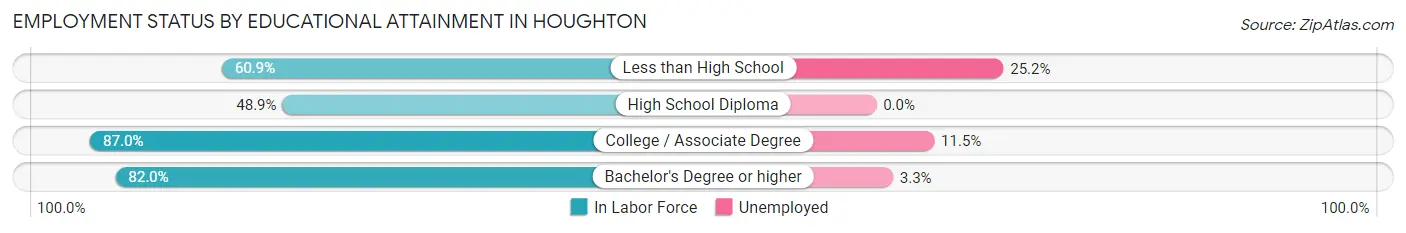
| Educational Attainment | In Labor Force | Unemployed |
| Less than High School | 103 (60.9%) | 43 (25.2%) |
| High School Diploma | 152 (48.9%) | 0 (0.0%) |
| College / Associate Degree | 322 (87.0%) | 43 (11.5%) |
| Bachelor's Degree or higher | 1,264 (82.0%) | 51 (3.3%) |
| Total | 1,842 (77.0%) | 136 (5.7%) |
Employment Occupations by Sex in Houghton
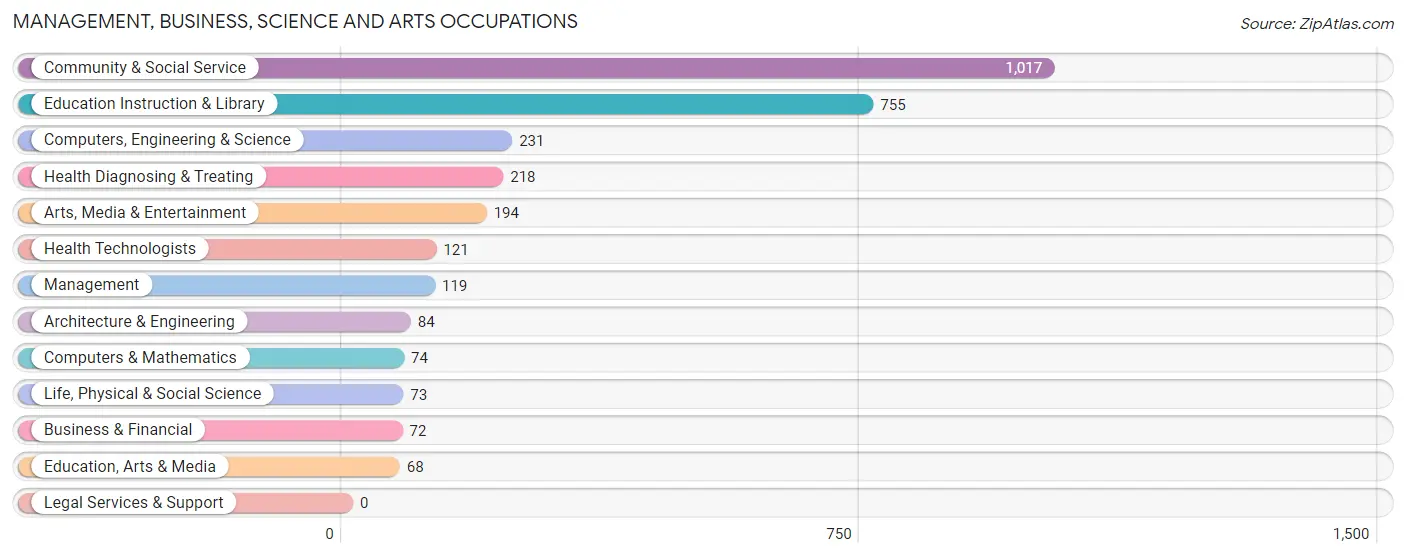
Management, Business, Science and Arts Occupations
The most common Management, Business, Science and Arts occupations in Houghton are Community & Social Service (1,017 | 28.8%), Education Instruction & Library (755 | 21.4%), Computers, Engineering & Science (231 | 6.6%), Health Diagnosing & Treating (218 | 6.2%), and Arts, Media & Entertainment (194 | 5.5%).
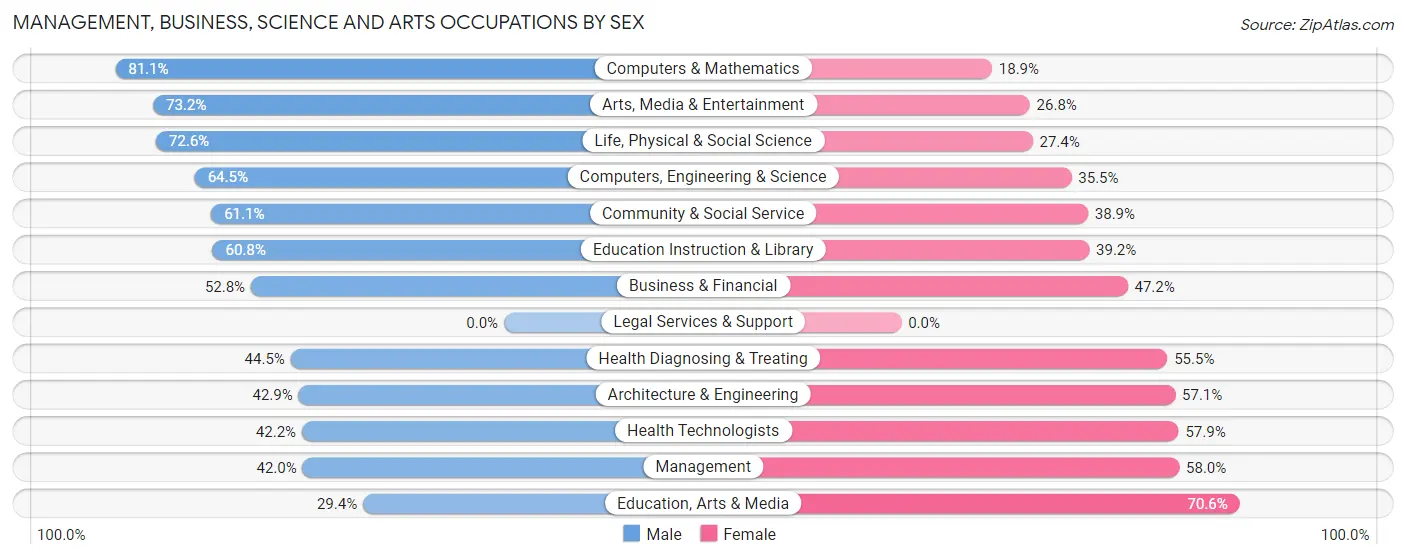
Management, Business, Science and Arts Occupations by Sex
Within the Management, Business, Science and Arts occupations in Houghton, the most male-oriented occupations are Computers & Mathematics (81.1%), Arts, Media & Entertainment (73.2%), and Life, Physical & Social Science (72.6%), while the most female-oriented occupations are Education, Arts & Media (70.6%), Management (58.0%), and Health Technologists (57.9%).
| Occupation | Male | Female |
| Management | 50 (42.0%) | 69 (58.0%) |
| Business & Financial | 38 (52.8%) | 34 (47.2%) |
| Computers, Engineering & Science | 149 (64.5%) | 82 (35.5%) |
| Computers & Mathematics | 60 (81.1%) | 14 (18.9%) |
| Architecture & Engineering | 36 (42.9%) | 48 (57.1%) |
| Life, Physical & Social Science | 53 (72.6%) | 20 (27.4%) |
| Community & Social Service | 621 (61.1%) | 396 (38.9%) |
| Education, Arts & Media | 20 (29.4%) | 48 (70.6%) |
| Legal Services & Support | 0 (0.0%) | 0 (0.0%) |
| Education Instruction & Library | 459 (60.8%) | 296 (39.2%) |
| Arts, Media & Entertainment | 142 (73.2%) | 52 (26.8%) |
| Health Diagnosing & Treating | 97 (44.5%) | 121 (55.5%) |
| Health Technologists | 51 (42.1%) | 70 (57.9%) |
| Total (Category) | 955 (57.6%) | 702 (42.4%) |
| Total (Overall) | 2,069 (58.7%) | 1,457 (41.3%) |
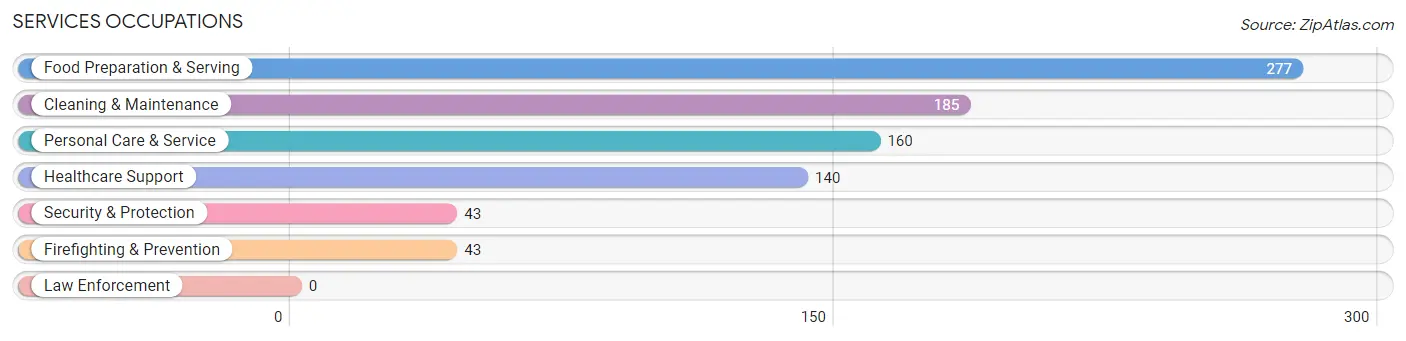
Services Occupations
The most common Services occupations in Houghton are Food Preparation & Serving (277 | 7.9%), Cleaning & Maintenance (185 | 5.2%), Personal Care & Service (160 | 4.5%), Healthcare Support (140 | 4.0%), and Security & Protection (43 | 1.2%).
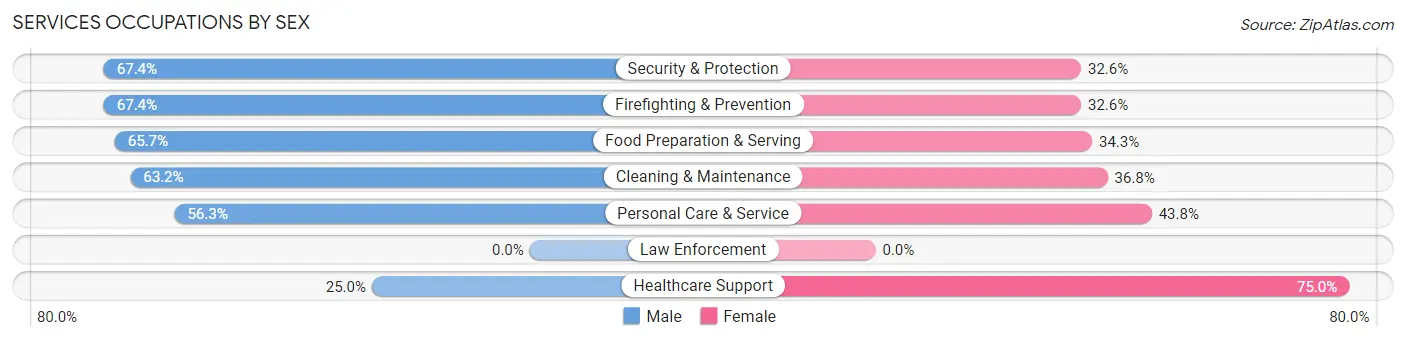
Services Occupations by Sex
Within the Services occupations in Houghton, the most male-oriented occupations are Security & Protection (67.4%), Firefighting & Prevention (67.4%), and Food Preparation & Serving (65.7%), while the most female-oriented occupations are Healthcare Support (75.0%), Personal Care & Service (43.8%), and Cleaning & Maintenance (36.8%).
| Occupation | Male | Female |
| Healthcare Support | 35 (25.0%) | 105 (75.0%) |
| Security & Protection | 29 (67.4%) | 14 (32.6%) |
| Firefighting & Prevention | 29 (67.4%) | 14 (32.6%) |
| Law Enforcement | 0 (0.0%) | 0 (0.0%) |
| Food Preparation & Serving | 182 (65.7%) | 95 (34.3%) |
| Cleaning & Maintenance | 117 (63.2%) | 68 (36.8%) |
| Personal Care & Service | 90 (56.2%) | 70 (43.8%) |
| Total (Category) | 453 (56.3%) | 352 (43.7%) |
| Total (Overall) | 2,069 (58.7%) | 1,457 (41.3%) |
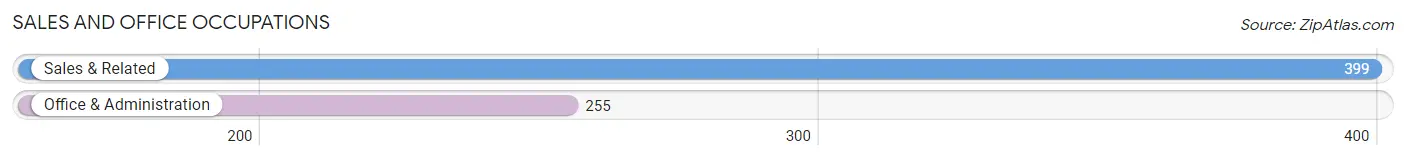
Sales and Office Occupations
The most common Sales and Office occupations in Houghton are Sales & Related (399 | 11.3%), and Office & Administration (255 | 7.2%).
Sales and Office Occupations by Sex
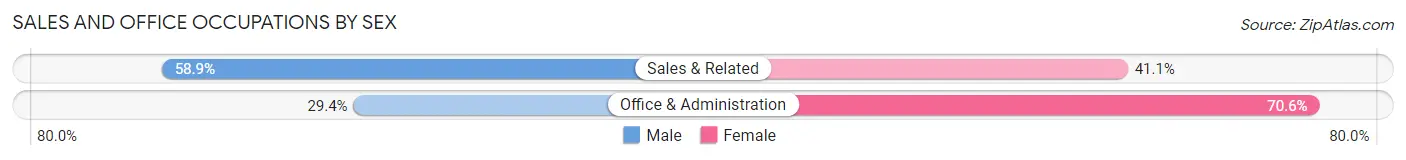
| Occupation | Male | Female |
| Sales & Related | 235 (58.9%) | 164 (41.1%) |
| Office & Administration | 75 (29.4%) | 180 (70.6%) |
| Total (Category) | 310 (47.4%) | 344 (52.6%) |
| Total (Overall) | 2,069 (58.7%) | 1,457 (41.3%) |
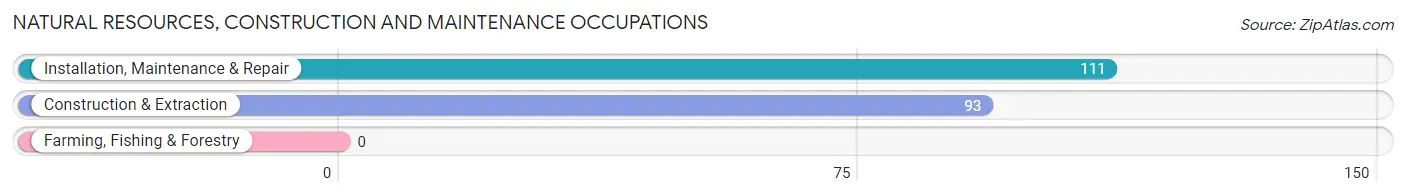
Natural Resources, Construction and Maintenance Occupations
The most common Natural Resources, Construction and Maintenance occupations in Houghton are Installation, Maintenance & Repair (111 | 3.2%), and Construction & Extraction (93 | 2.6%).
Natural Resources, Construction and Maintenance Occupations by Sex
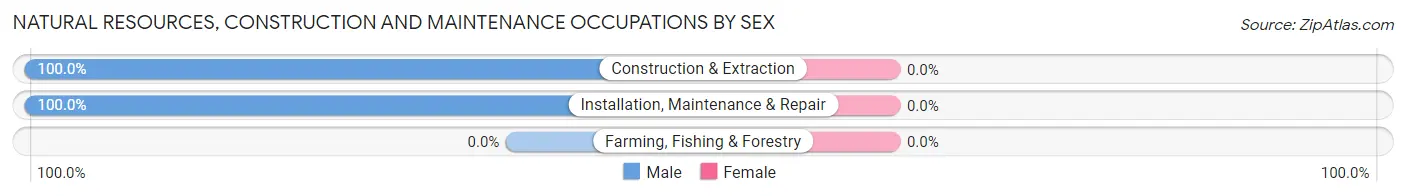
| Occupation | Male | Female |
| Farming, Fishing & Forestry | 0 (0.0%) | 0 (0.0%) |
| Construction & Extraction | 93 (100.0%) | 0 (0.0%) |
| Installation, Maintenance & Repair | 111 (100.0%) | 0 (0.0%) |
| Total (Category) | 204 (100.0%) | 0 (0.0%) |
| Total (Overall) | 2,069 (58.7%) | 1,457 (41.3%) |
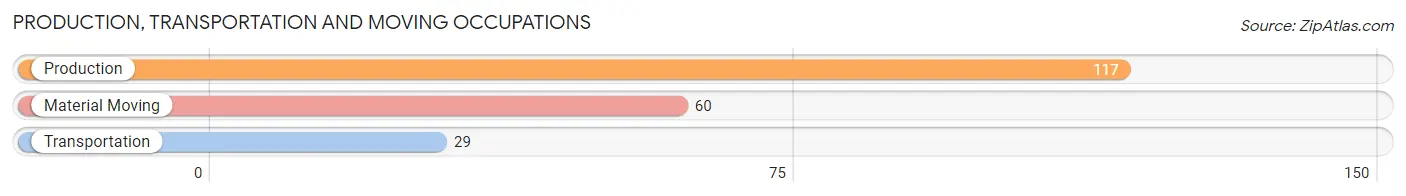
Production, Transportation and Moving Occupations
The most common Production, Transportation and Moving occupations in Houghton are Production (117 | 3.3%), Material Moving (60 | 1.7%), and Transportation (29 | 0.8%).
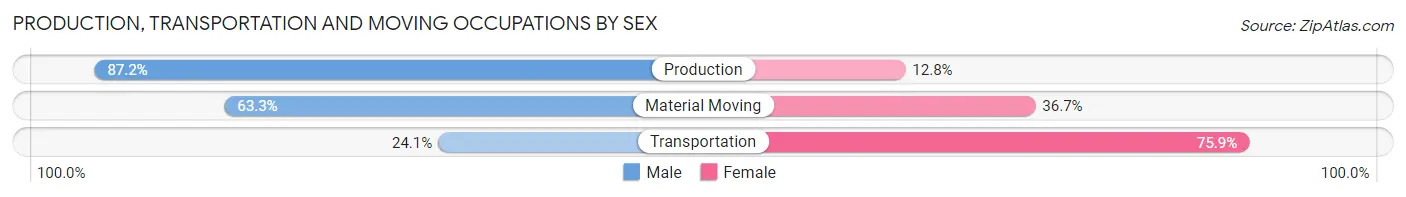
Production, Transportation and Moving Occupations by Sex
| Occupation | Male | Female |
| Production | 102 (87.2%) | 15 (12.8%) |
| Transportation | 7 (24.1%) | 22 (75.9%) |
| Material Moving | 38 (63.3%) | 22 (36.7%) |
| Total (Category) | 147 (71.4%) | 59 (28.6%) |
| Total (Overall) | 2,069 (58.7%) | 1,457 (41.3%) |
Employment Industries by Sex in Houghton
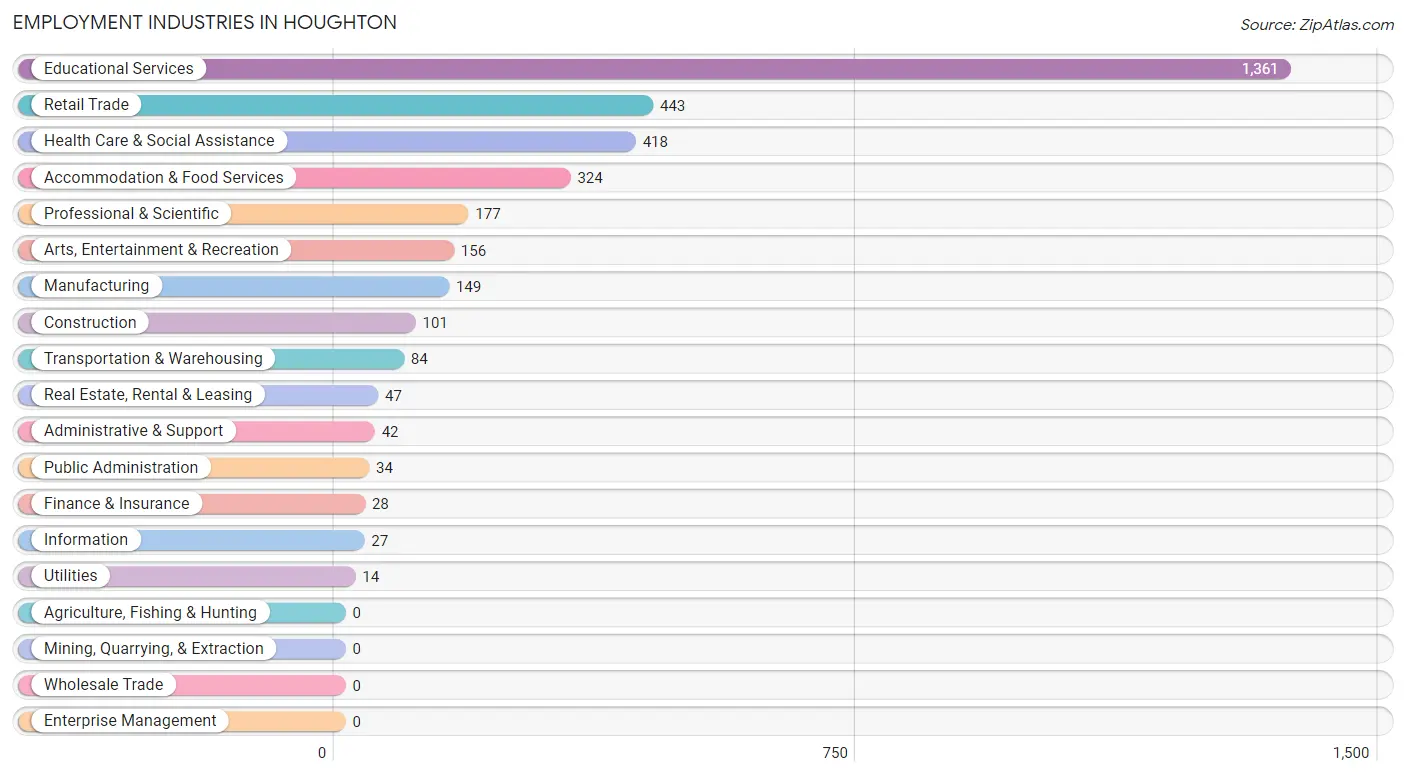
Employment Industries in Houghton
The major employment industries in Houghton include Educational Services (1,361 | 38.6%), Retail Trade (443 | 12.6%), Health Care & Social Assistance (418 | 11.8%), Accommodation & Food Services (324 | 9.2%), and Professional & Scientific (177 | 5.0%).
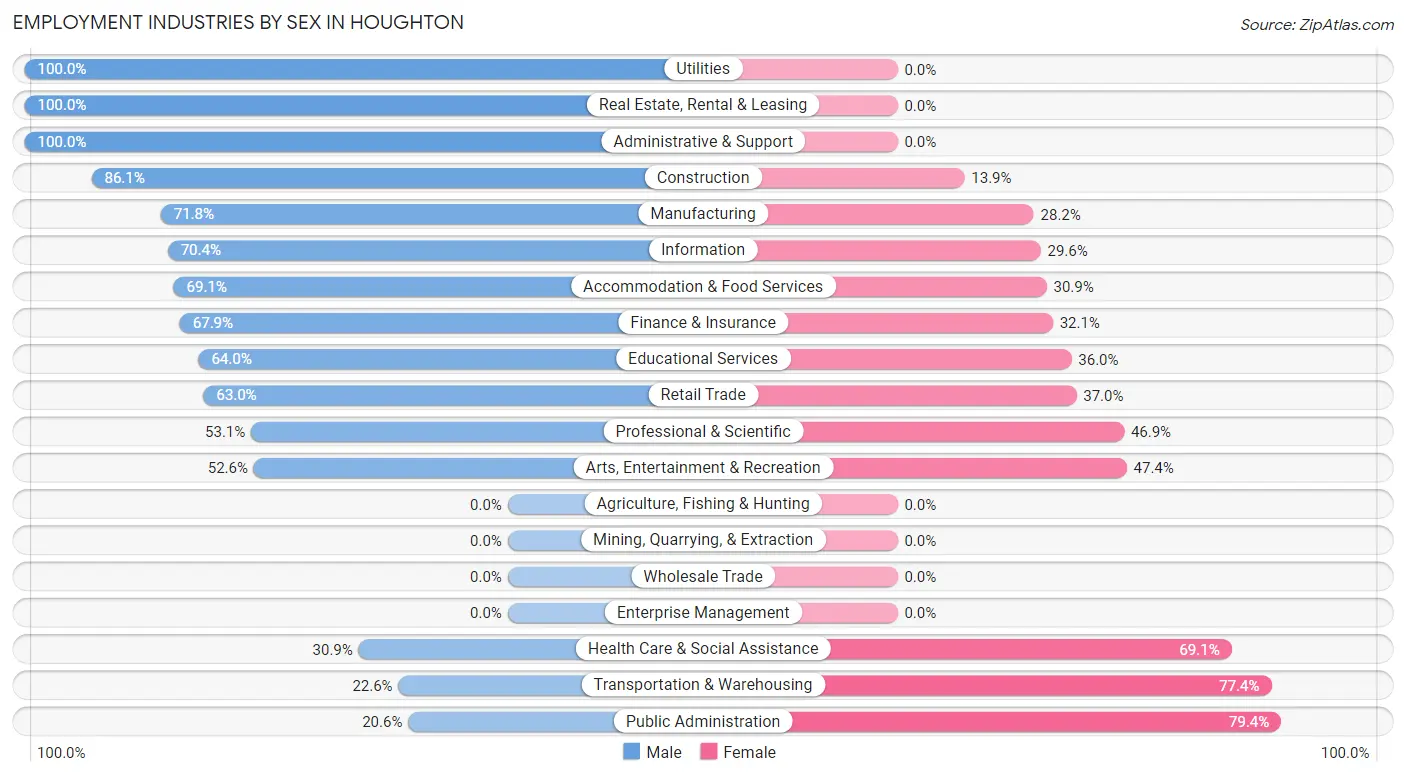
Employment Industries by Sex in Houghton
The Houghton industries that see more men than women are Utilities (100.0%), Real Estate, Rental & Leasing (100.0%), and Administrative & Support (100.0%), whereas the industries that tend to have a higher number of women are Public Administration (79.4%), Transportation & Warehousing (77.4%), and Health Care & Social Assistance (69.1%).
| Industry | Male | Female |
| Agriculture, Fishing & Hunting | 0 (0.0%) | 0 (0.0%) |
| Mining, Quarrying, & Extraction | 0 (0.0%) | 0 (0.0%) |
| Construction | 87 (86.1%) | 14 (13.9%) |
| Manufacturing | 107 (71.8%) | 42 (28.2%) |
| Wholesale Trade | 0 (0.0%) | 0 (0.0%) |
| Retail Trade | 279 (63.0%) | 164 (37.0%) |
| Transportation & Warehousing | 19 (22.6%) | 65 (77.4%) |
| Utilities | 14 (100.0%) | 0 (0.0%) |
| Information | 19 (70.4%) | 8 (29.6%) |
| Finance & Insurance | 19 (67.9%) | 9 (32.1%) |
| Real Estate, Rental & Leasing | 47 (100.0%) | 0 (0.0%) |
| Professional & Scientific | 94 (53.1%) | 83 (46.9%) |
| Enterprise Management | 0 (0.0%) | 0 (0.0%) |
| Administrative & Support | 42 (100.0%) | 0 (0.0%) |
| Educational Services | 871 (64.0%) | 490 (36.0%) |
| Health Care & Social Assistance | 129 (30.9%) | 289 (69.1%) |
| Arts, Entertainment & Recreation | 82 (52.6%) | 74 (47.4%) |
| Accommodation & Food Services | 224 (69.1%) | 100 (30.9%) |
| Public Administration | 7 (20.6%) | 27 (79.4%) |
| Total | 2,069 (58.7%) | 1,457 (41.3%) |
Education in Houghton
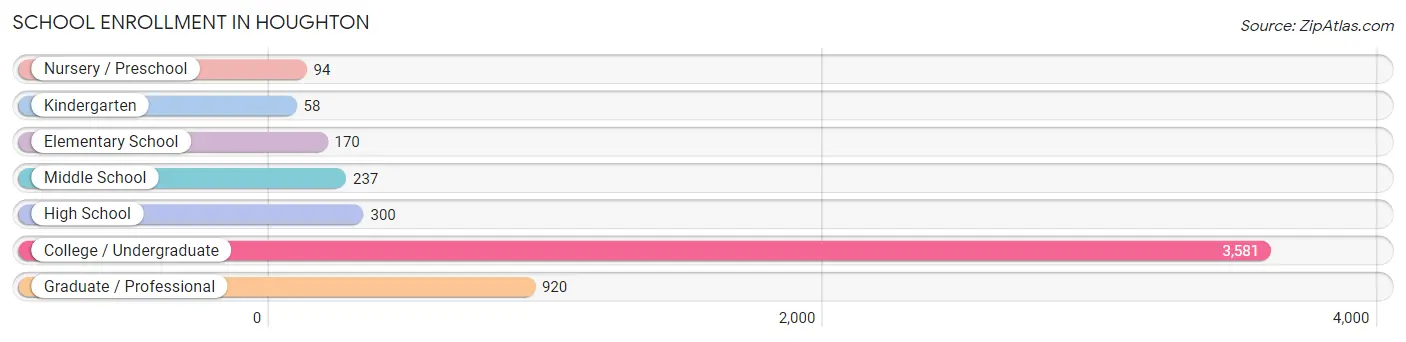
School Enrollment in Houghton
The most common levels of schooling among the 5,360 students in Houghton are college / undergraduate (3,581 | 66.8%), graduate / professional (920 | 17.2%), and high school (300 | 5.6%).
| School Level | # Students | % Students |
| Nursery / Preschool | 94 | 1.8% |
| Kindergarten | 58 | 1.1% |
| Elementary School | 170 | 3.2% |
| Middle School | 237 | 4.4% |
| High School | 300 | 5.6% |
| College / Undergraduate | 3,581 | 66.8% |
| Graduate / Professional | 920 | 17.2% |
| Total | 5,360 | 100.0% |
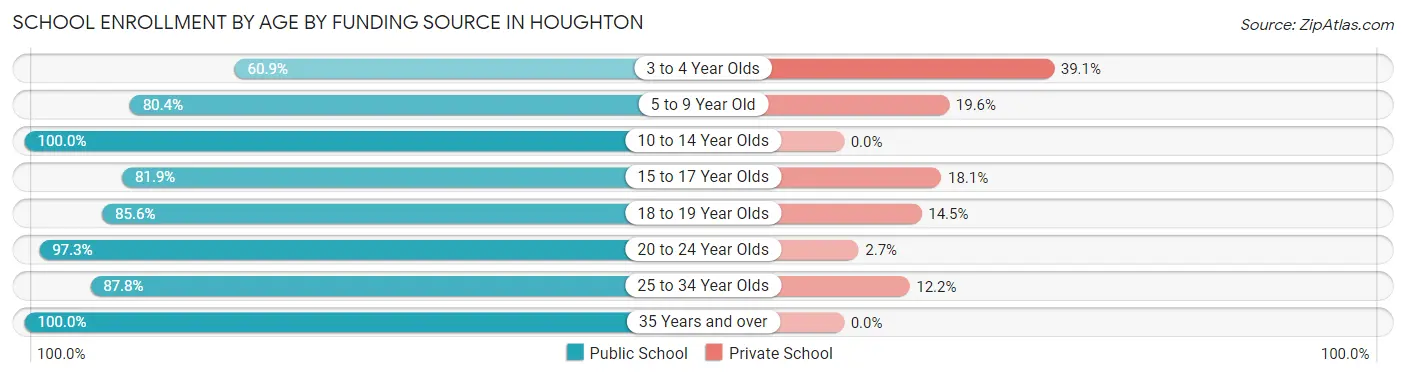
School Enrollment by Age by Funding Source in Houghton
Out of a total of 5,360 students who are enrolled in schools in Houghton, 488 (9.1%) attend a private institution, while the remaining 4,872 (90.9%) are enrolled in public schools. The age group of 3 to 4 year olds has the highest likelihood of being enrolled in private schools, with 27 (39.1% in the age bracket) enrolled. Conversely, the age group of 10 to 14 year olds has the lowest likelihood of being enrolled in a private school, with 275 (100.0% in the age bracket) attending a public institution.
| Age Bracket | Public School | Private School |
| 3 to 4 Year Olds | 42 (60.9%) | 27 (39.1%) |
| 5 to 9 Year Old | 197 (80.4%) | 48 (19.6%) |
| 10 to 14 Year Olds | 275 (100.0%) | 0 (0.0%) |
| 15 to 17 Year Olds | 176 (81.9%) | 39 (18.1%) |
| 18 to 19 Year Olds | 1,457 (85.6%) | 246 (14.4%) |
| 20 to 24 Year Olds | 2,210 (97.3%) | 62 (2.7%) |
| 25 to 34 Year Olds | 474 (87.8%) | 66 (12.2%) |
| 35 Years and over | 41 (100.0%) | 0 (0.0%) |
| Total | 4,872 (90.9%) | 488 (9.1%) |
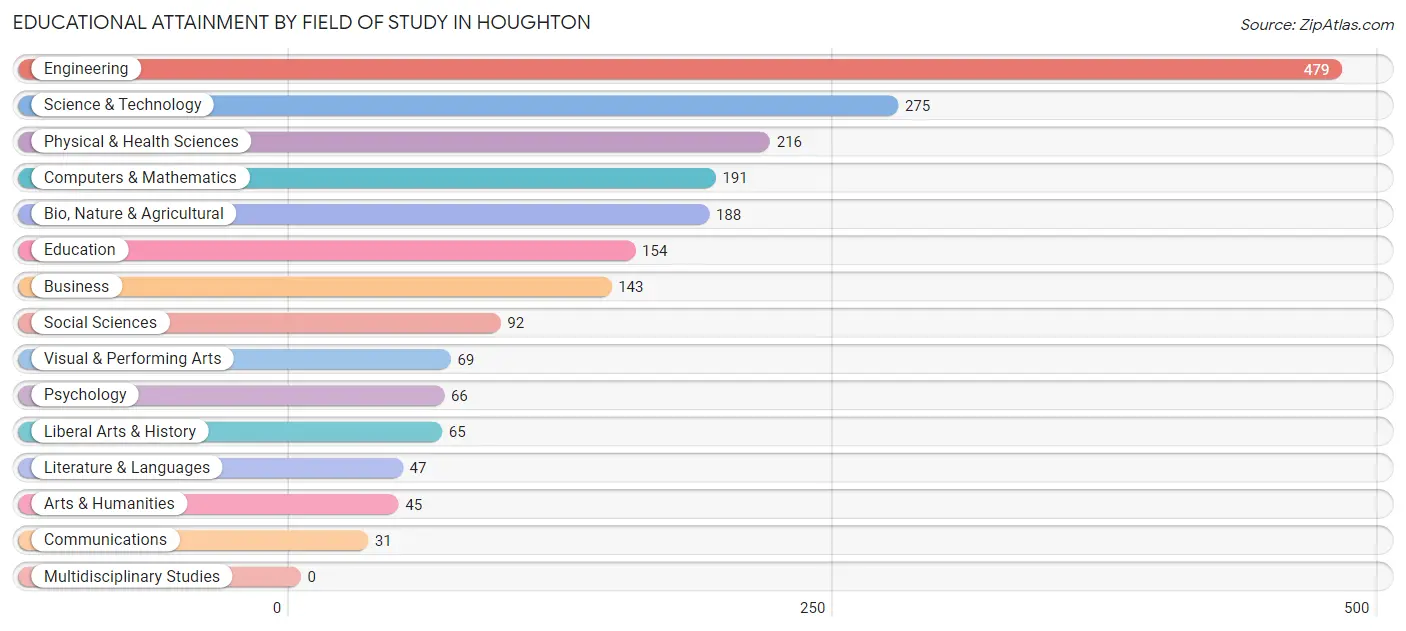
Educational Attainment by Field of Study in Houghton
Engineering (479 | 23.2%), science & technology (275 | 13.3%), physical & health sciences (216 | 10.5%), computers & mathematics (191 | 9.3%), and bio, nature & agricultural (188 | 9.1%) are the most common fields of study among 2,061 individuals in Houghton who have obtained a bachelor's degree or higher.
| Field of Study | # Graduates | % Graduates |
| Computers & Mathematics | 191 | 9.3% |
| Bio, Nature & Agricultural | 188 | 9.1% |
| Physical & Health Sciences | 216 | 10.5% |
| Psychology | 66 | 3.2% |
| Social Sciences | 92 | 4.5% |
| Engineering | 479 | 23.2% |
| Multidisciplinary Studies | 0 | 0.0% |
| Science & Technology | 275 | 13.3% |
| Business | 143 | 6.9% |
| Education | 154 | 7.5% |
| Literature & Languages | 47 | 2.3% |
| Liberal Arts & History | 65 | 3.2% |
| Visual & Performing Arts | 69 | 3.4% |
| Communications | 31 | 1.5% |
| Arts & Humanities | 45 | 2.2% |
| Total | 2,061 | 100.0% |
Transportation & Commute in Houghton
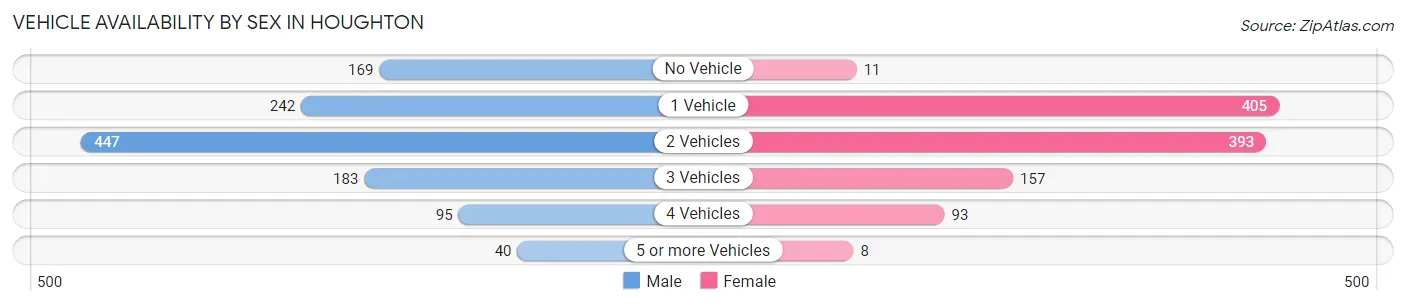
Vehicle Availability by Sex in Houghton
The most prevalent vehicle ownership categories in Houghton are males with 2 vehicles (447, accounting for 38.0%) and females with 2 vehicles (393, making up 41.9%).
| Vehicles Available | Male | Female |
| No Vehicle | 169 (14.4%) | 11 (1.0%) |
| 1 Vehicle | 242 (20.6%) | 405 (38.0%) |
| 2 Vehicles | 447 (38.0%) | 393 (36.8%) |
| 3 Vehicles | 183 (15.6%) | 157 (14.7%) |
| 4 Vehicles | 95 (8.1%) | 93 (8.7%) |
| 5 or more Vehicles | 40 (3.4%) | 8 (0.7%) |
| Total | 1,176 (100.0%) | 1,067 (100.0%) |
Commute Time in Houghton
The most frequently occuring commute durations in Houghton are 5 to 9 minutes (1,085 commuters, 34.3%), 10 to 14 minutes (869 commuters, 27.5%), and 15 to 19 minutes (465 commuters, 14.7%).
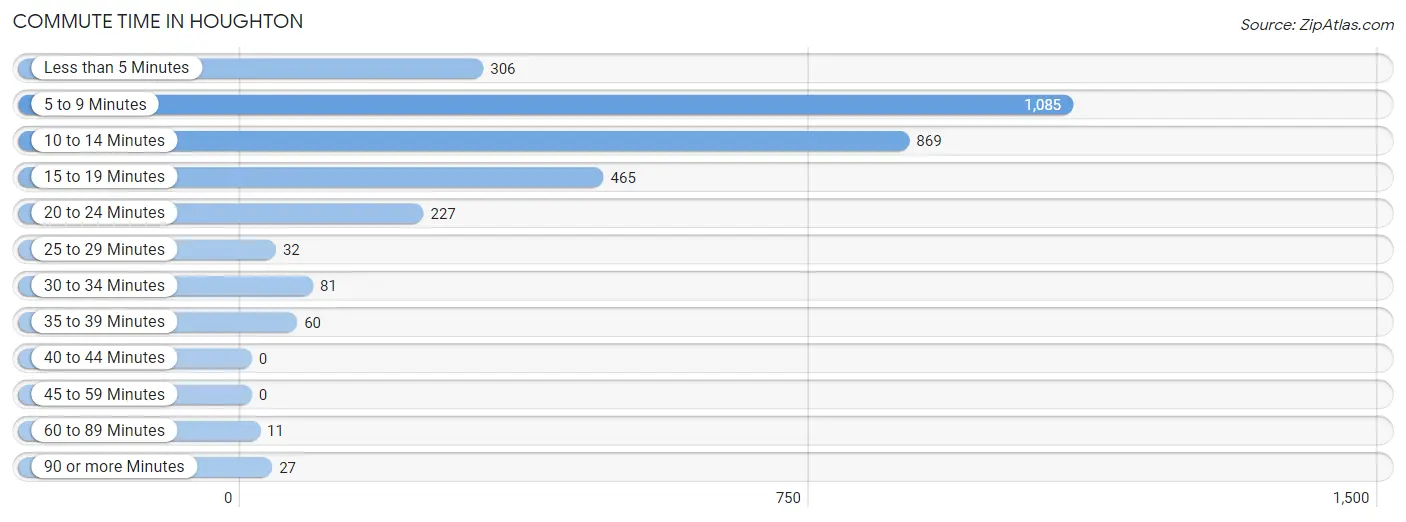
| Commute Time | # Commuters | % Commuters |
| Less than 5 Minutes | 306 | 9.7% |
| 5 to 9 Minutes | 1,085 | 34.3% |
| 10 to 14 Minutes | 869 | 27.5% |
| 15 to 19 Minutes | 465 | 14.7% |
| 20 to 24 Minutes | 227 | 7.2% |
| 25 to 29 Minutes | 32 | 1.0% |
| 30 to 34 Minutes | 81 | 2.6% |
| 35 to 39 Minutes | 60 | 1.9% |
| 40 to 44 Minutes | 0 | 0.0% |
| 45 to 59 Minutes | 0 | 0.0% |
| 60 to 89 Minutes | 11 | 0.4% |
| 90 or more Minutes | 27 | 0.9% |
Commute Time by Sex in Houghton
The most common commute times in Houghton are 5 to 9 minutes (632 commuters, 33.3%) for males and 5 to 9 minutes (453 commuters, 35.9%) for females.
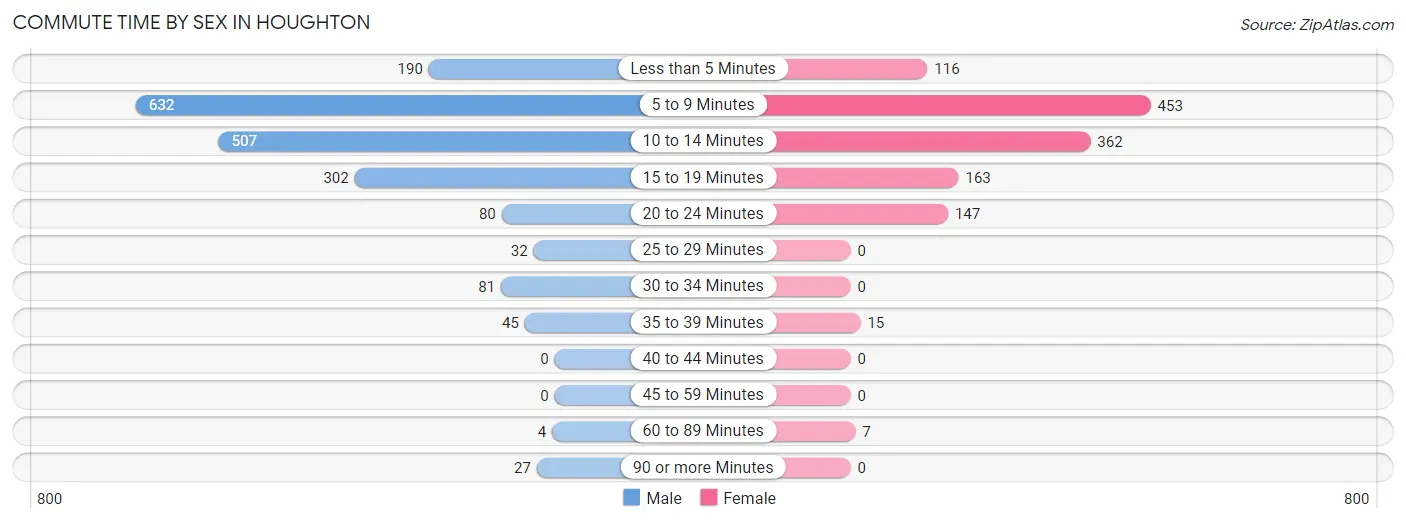
| Commute Time | Male | Female |
| Less than 5 Minutes | 190 (10.0%) | 116 (9.2%) |
| 5 to 9 Minutes | 632 (33.3%) | 453 (35.9%) |
| 10 to 14 Minutes | 507 (26.7%) | 362 (28.7%) |
| 15 to 19 Minutes | 302 (15.9%) | 163 (12.9%) |
| 20 to 24 Minutes | 80 (4.2%) | 147 (11.6%) |
| 25 to 29 Minutes | 32 (1.7%) | 0 (0.0%) |
| 30 to 34 Minutes | 81 (4.3%) | 0 (0.0%) |
| 35 to 39 Minutes | 45 (2.4%) | 15 (1.2%) |
| 40 to 44 Minutes | 0 (0.0%) | 0 (0.0%) |
| 45 to 59 Minutes | 0 (0.0%) | 0 (0.0%) |
| 60 to 89 Minutes | 4 (0.2%) | 7 (0.5%) |
| 90 or more Minutes | 27 (1.4%) | 0 (0.0%) |
Time of Departure to Work by Sex in Houghton
The most frequent times of departure to work in Houghton are 9:00 AM to 9:59 AM (328, 17.3%) for males and 8:00 AM to 8:29 AM (357, 28.3%) for females.
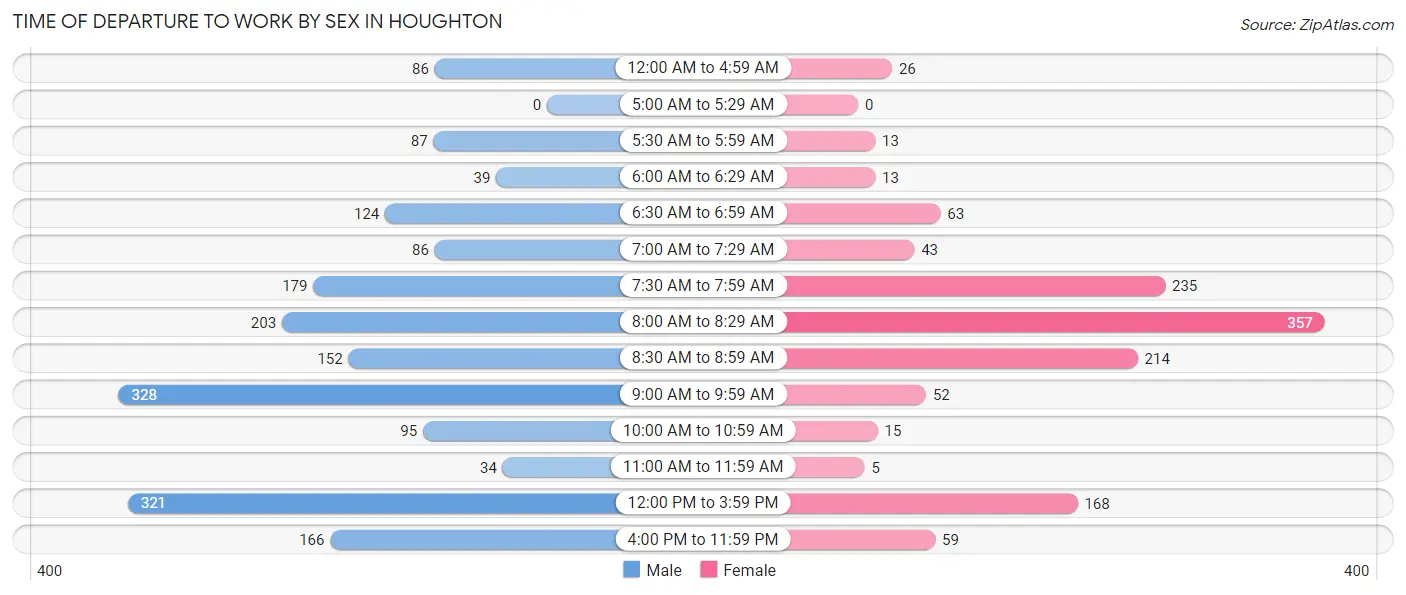
| Time of Departure | Male | Female |
| 12:00 AM to 4:59 AM | 86 (4.5%) | 26 (2.1%) |
| 5:00 AM to 5:29 AM | 0 (0.0%) | 0 (0.0%) |
| 5:30 AM to 5:59 AM | 87 (4.6%) | 13 (1.0%) |
| 6:00 AM to 6:29 AM | 39 (2.1%) | 13 (1.0%) |
| 6:30 AM to 6:59 AM | 124 (6.5%) | 63 (5.0%) |
| 7:00 AM to 7:29 AM | 86 (4.5%) | 43 (3.4%) |
| 7:30 AM to 7:59 AM | 179 (9.4%) | 235 (18.6%) |
| 8:00 AM to 8:29 AM | 203 (10.7%) | 357 (28.3%) |
| 8:30 AM to 8:59 AM | 152 (8.0%) | 214 (16.9%) |
| 9:00 AM to 9:59 AM | 328 (17.3%) | 52 (4.1%) |
| 10:00 AM to 10:59 AM | 95 (5.0%) | 15 (1.2%) |
| 11:00 AM to 11:59 AM | 34 (1.8%) | 5 (0.4%) |
| 12:00 PM to 3:59 PM | 321 (16.9%) | 168 (13.3%) |
| 4:00 PM to 11:59 PM | 166 (8.7%) | 59 (4.7%) |
| Total | 1,900 (100.0%) | 1,263 (100.0%) |
Housing Occupancy in Houghton
Occupancy by Ownership in Houghton
Of the total 2,385 dwellings in Houghton, owner-occupied units account for 840 (35.2%), while renter-occupied units make up 1,545 (64.8%).
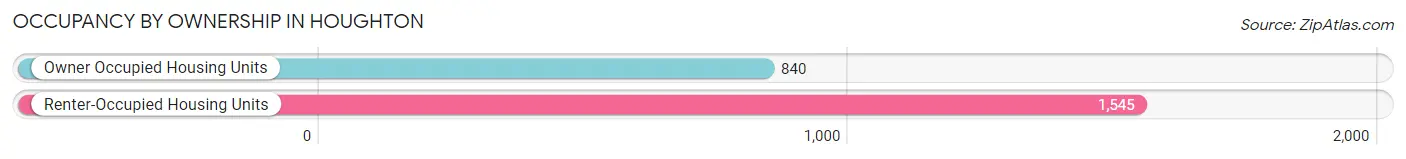
| Occupancy | # Housing Units | % Housing Units |
| Owner Occupied Housing Units | 840 | 35.2% |
| Renter-Occupied Housing Units | 1,545 | 64.8% |
| Total Occupied Housing Units | 2,385 | 100.0% |
Occupancy by Household Size in Houghton
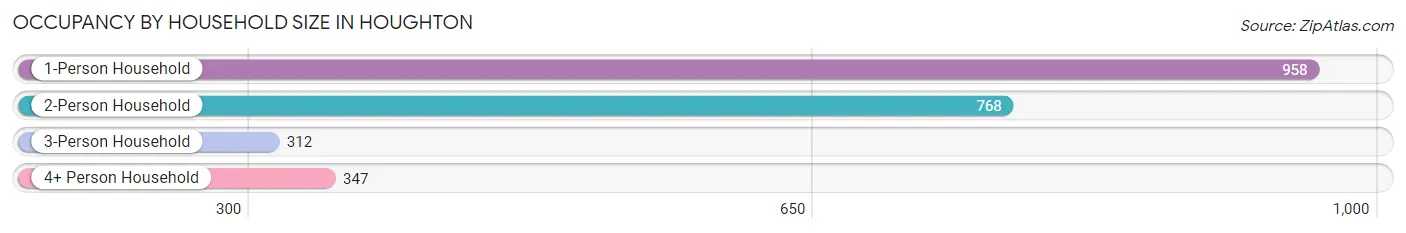
| Household Size | # Housing Units | % Housing Units |
| 1-Person Household | 958 | 40.2% |
| 2-Person Household | 768 | 32.2% |
| 3-Person Household | 312 | 13.1% |
| 4+ Person Household | 347 | 14.5% |
| Total Housing Units | 2,385 | 100.0% |
Occupancy by Ownership by Household Size in Houghton
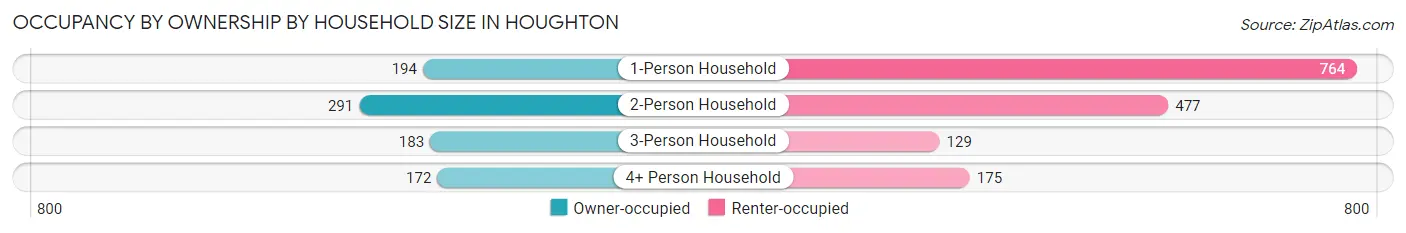
| Household Size | Owner-occupied | Renter-occupied |
| 1-Person Household | 194 (20.3%) | 764 (79.7%) |
| 2-Person Household | 291 (37.9%) | 477 (62.1%) |
| 3-Person Household | 183 (58.7%) | 129 (41.3%) |
| 4+ Person Household | 172 (49.6%) | 175 (50.4%) |
| Total Housing Units | 840 (35.2%) | 1,545 (64.8%) |
Occupancy by Educational Attainment in Houghton
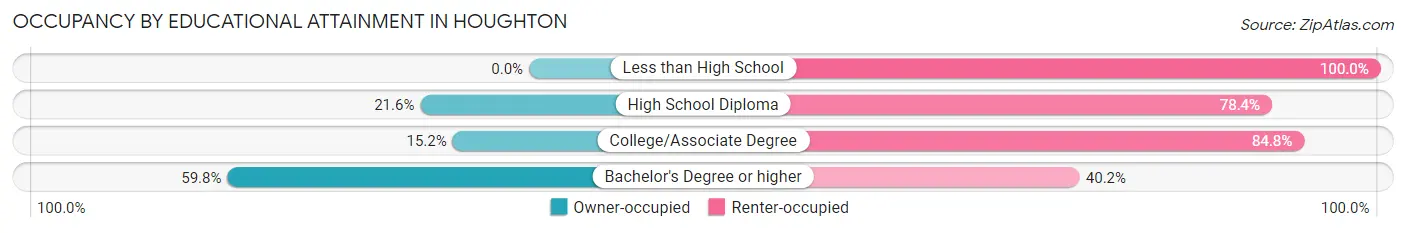
| Household Size | Owner-occupied | Renter-occupied |
| Less than High School | 0 (0.0%) | 107 (100.0%) |
| High School Diploma | 72 (21.6%) | 262 (78.4%) |
| College/Associate Degree | 134 (15.2%) | 750 (84.8%) |
| Bachelor's Degree or higher | 634 (59.8%) | 426 (40.2%) |
Occupancy by Age of Householder in Houghton
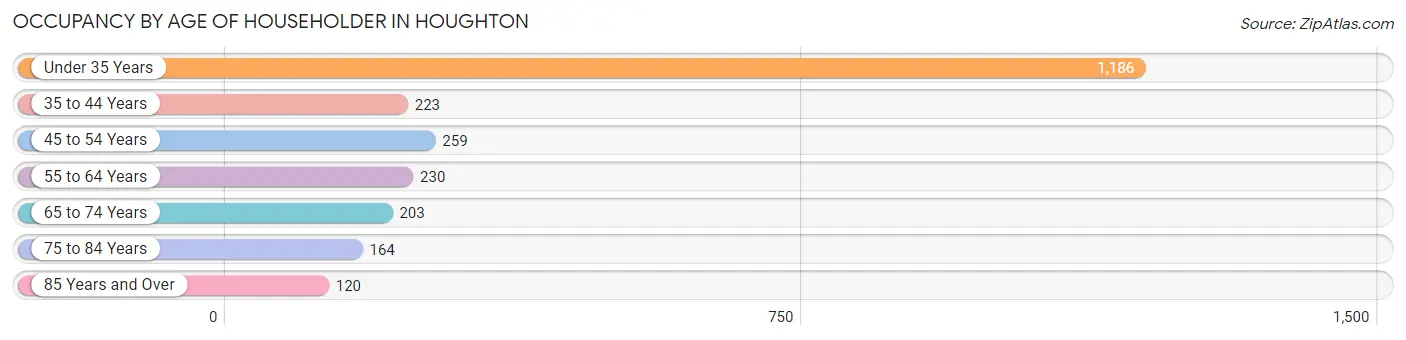
| Age Bracket | # Households | % Households |
| Under 35 Years | 1,186 | 49.7% |
| 35 to 44 Years | 223 | 9.3% |
| 45 to 54 Years | 259 | 10.9% |
| 55 to 64 Years | 230 | 9.6% |
| 65 to 74 Years | 203 | 8.5% |
| 75 to 84 Years | 164 | 6.9% |
| 85 Years and Over | 120 | 5.0% |
| Total | 2,385 | 100.0% |
Housing Finances in Houghton
Median Income by Occupancy in Houghton
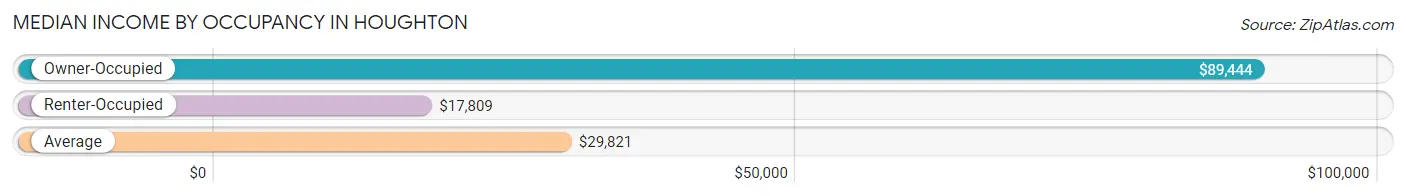
| Occupancy Type | # Households | Median Income |
| Owner-Occupied | 840 (35.2%) | $89,444 |
| Renter-Occupied | 1,545 (64.8%) | $17,809 |
| Average | 2,385 (100.0%) | $29,821 |
Occupancy by Householder Income Bracket in Houghton
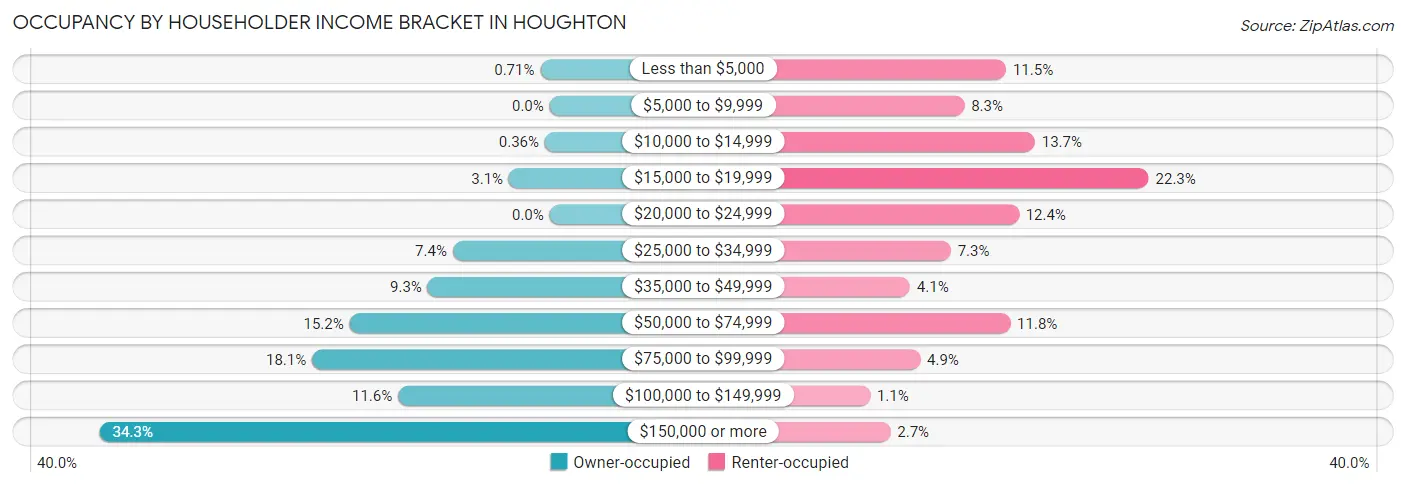
| Income Bracket | Owner-occupied | Renter-occupied |
| Less than $5,000 | 6 (0.7%) | 177 (11.5%) |
| $5,000 to $9,999 | 0 (0.0%) | 128 (8.3%) |
| $10,000 to $14,999 | 3 (0.4%) | 211 (13.7%) |
| $15,000 to $19,999 | 26 (3.1%) | 345 (22.3%) |
| $20,000 to $24,999 | 0 (0.0%) | 192 (12.4%) |
| $25,000 to $34,999 | 62 (7.4%) | 112 (7.2%) |
| $35,000 to $49,999 | 78 (9.3%) | 64 (4.1%) |
| $50,000 to $74,999 | 128 (15.2%) | 182 (11.8%) |
| $75,000 to $99,999 | 152 (18.1%) | 76 (4.9%) |
| $100,000 to $149,999 | 97 (11.6%) | 17 (1.1%) |
| $150,000 or more | 288 (34.3%) | 41 (2.6%) |
| Total | 840 (100.0%) | 1,545 (100.0%) |
Monthly Housing Cost Tiers in Houghton
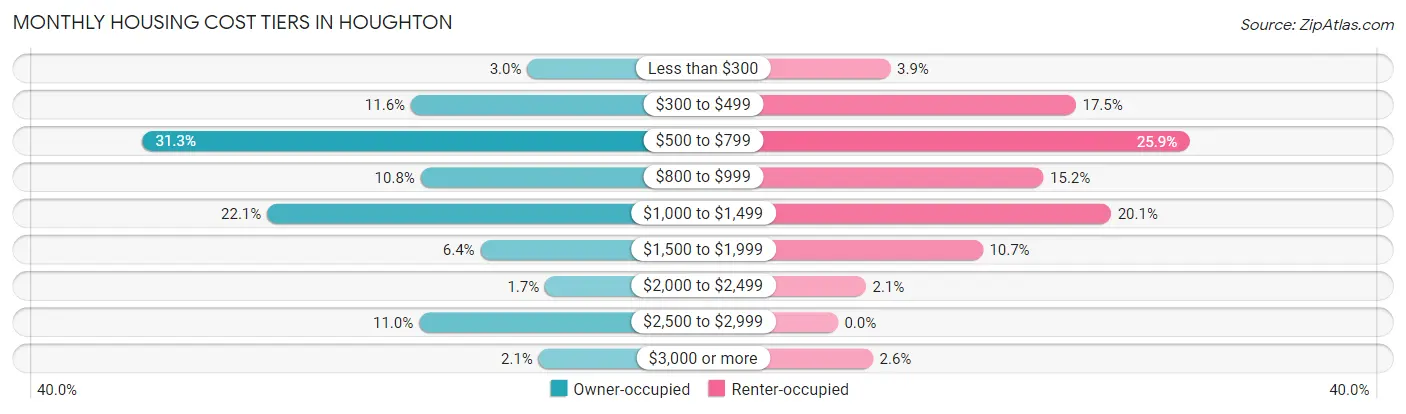
| Monthly Cost | Owner-occupied | Renter-occupied |
| Less than $300 | 25 (3.0%) | 60 (3.9%) |
| $300 to $499 | 97 (11.6%) | 271 (17.5%) |
| $500 to $799 | 263 (31.3%) | 400 (25.9%) |
| $800 to $999 | 91 (10.8%) | 234 (15.1%) |
| $1,000 to $1,499 | 186 (22.1%) | 311 (20.1%) |
| $1,500 to $1,999 | 54 (6.4%) | 165 (10.7%) |
| $2,000 to $2,499 | 14 (1.7%) | 32 (2.1%) |
| $2,500 to $2,999 | 92 (11.0%) | 0 (0.0%) |
| $3,000 or more | 18 (2.1%) | 40 (2.6%) |
| Total | 840 (100.0%) | 1,545 (100.0%) |
Physical Housing Characteristics in Houghton
Housing Structures in Houghton
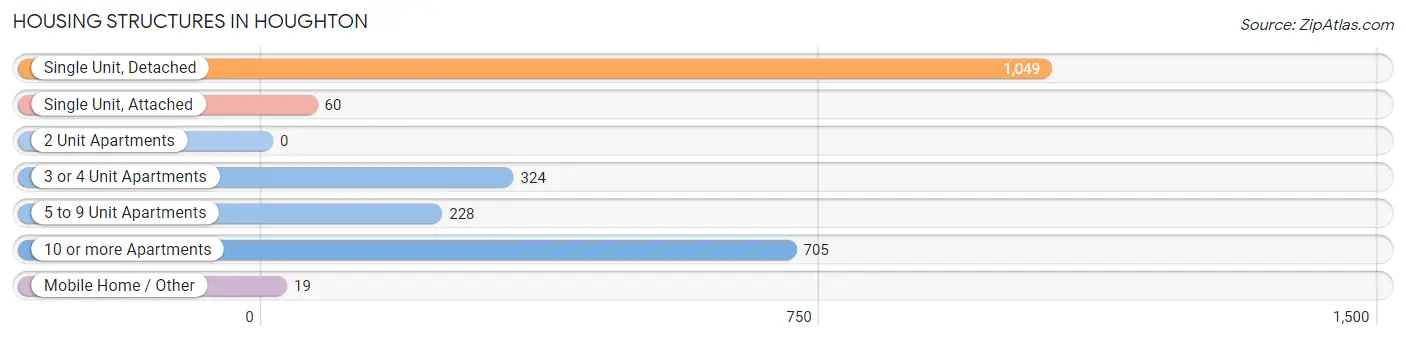
| Structure Type | # Housing Units | % Housing Units |
| Single Unit, Detached | 1,049 | 44.0% |
| Single Unit, Attached | 60 | 2.5% |
| 2 Unit Apartments | 0 | 0.0% |
| 3 or 4 Unit Apartments | 324 | 13.6% |
| 5 to 9 Unit Apartments | 228 | 9.6% |
| 10 or more Apartments | 705 | 29.6% |
| Mobile Home / Other | 19 | 0.8% |
| Total | 2,385 | 100.0% |
Housing Structures by Occupancy in Houghton
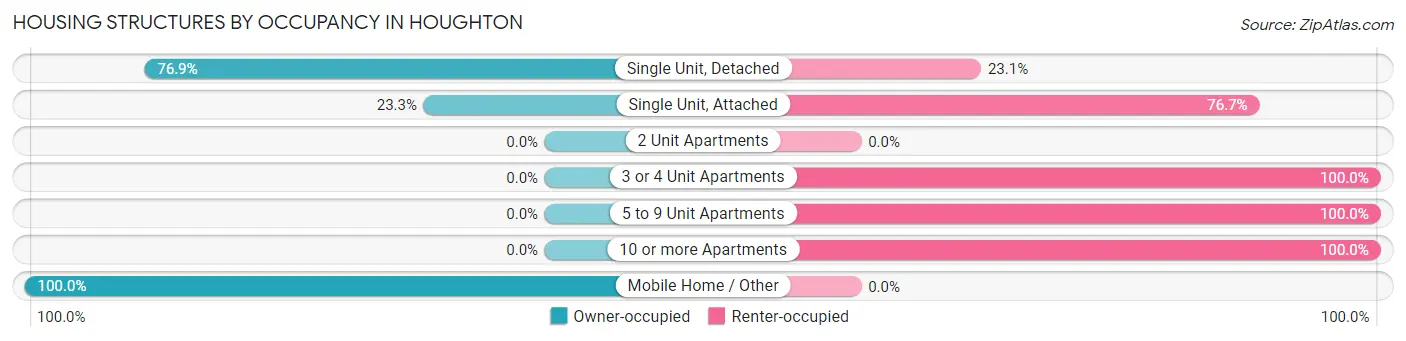
| Structure Type | Owner-occupied | Renter-occupied |
| Single Unit, Detached | 807 (76.9%) | 242 (23.1%) |
| Single Unit, Attached | 14 (23.3%) | 46 (76.7%) |
| 2 Unit Apartments | 0 (0.0%) | 0 (0.0%) |
| 3 or 4 Unit Apartments | 0 (0.0%) | 324 (100.0%) |
| 5 to 9 Unit Apartments | 0 (0.0%) | 228 (100.0%) |
| 10 or more Apartments | 0 (0.0%) | 705 (100.0%) |
| Mobile Home / Other | 19 (100.0%) | 0 (0.0%) |
| Total | 840 (35.2%) | 1,545 (64.8%) |
Housing Structures by Number of Rooms in Houghton
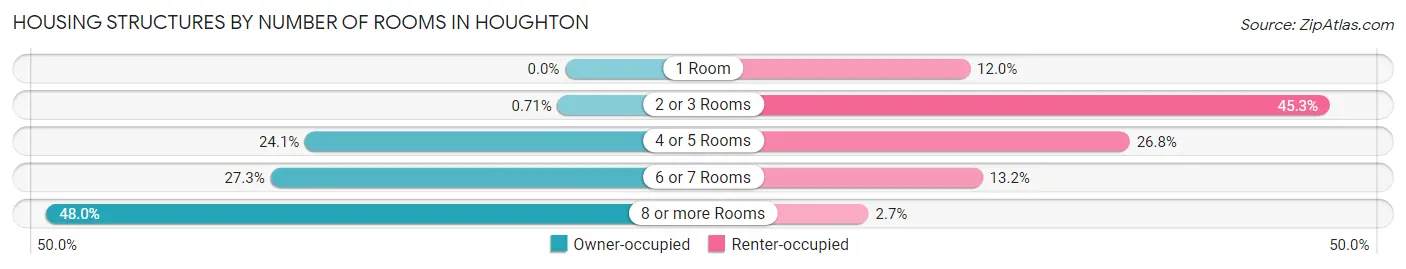
| Number of Rooms | Owner-occupied | Renter-occupied |
| 1 Room | 0 (0.0%) | 186 (12.0%) |
| 2 or 3 Rooms | 6 (0.7%) | 700 (45.3%) |
| 4 or 5 Rooms | 202 (24.0%) | 414 (26.8%) |
| 6 or 7 Rooms | 229 (27.3%) | 204 (13.2%) |
| 8 or more Rooms | 403 (48.0%) | 41 (2.6%) |
| Total | 840 (100.0%) | 1,545 (100.0%) |
Housing Structure by Heating Type in Houghton
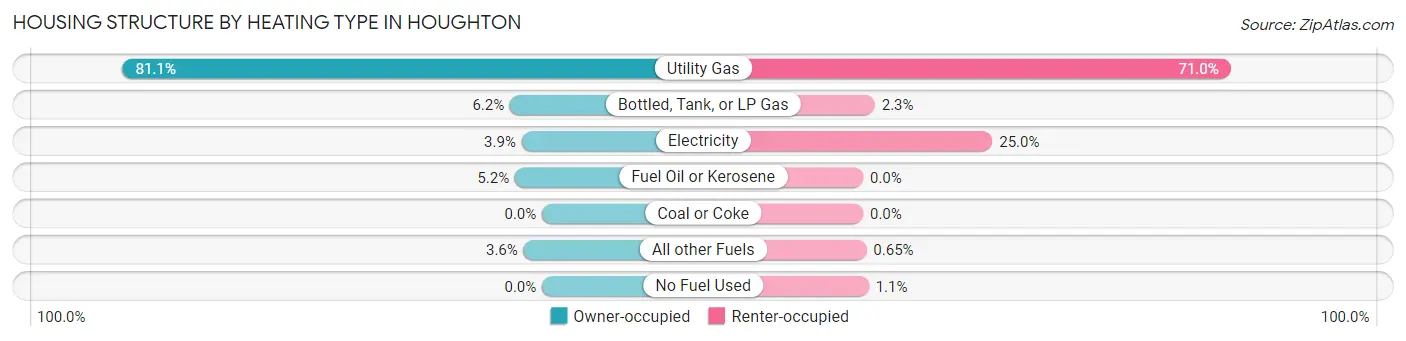
| Heating Type | Owner-occupied | Renter-occupied |
| Utility Gas | 681 (81.1%) | 1,097 (71.0%) |
| Bottled, Tank, or LP Gas | 52 (6.2%) | 35 (2.3%) |
| Electricity | 33 (3.9%) | 386 (25.0%) |
| Fuel Oil or Kerosene | 44 (5.2%) | 0 (0.0%) |
| Coal or Coke | 0 (0.0%) | 0 (0.0%) |
| All other Fuels | 30 (3.6%) | 10 (0.6%) |
| No Fuel Used | 0 (0.0%) | 17 (1.1%) |
| Total | 840 (100.0%) | 1,545 (100.0%) |
Household Vehicle Usage in Houghton
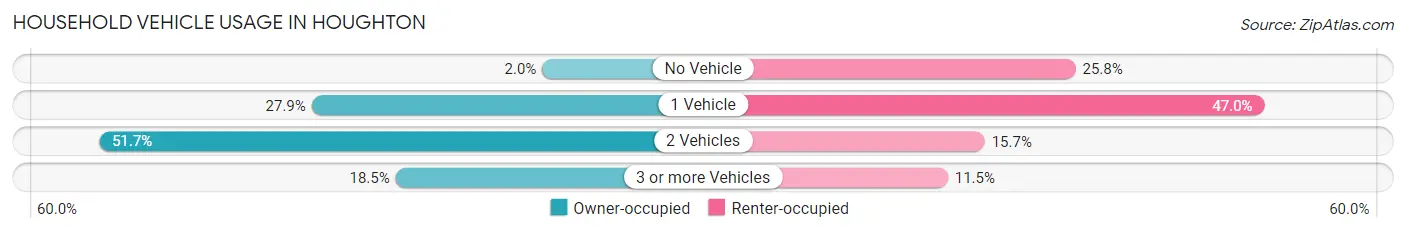
| Vehicles per Household | Owner-occupied | Renter-occupied |
| No Vehicle | 17 (2.0%) | 399 (25.8%) |
| 1 Vehicle | 234 (27.9%) | 726 (47.0%) |
| 2 Vehicles | 434 (51.7%) | 242 (15.7%) |
| 3 or more Vehicles | 155 (18.4%) | 178 (11.5%) |
| Total | 840 (100.0%) | 1,545 (100.0%) |
Real Estate & Mortgages in Houghton
Real Estate and Mortgage Overview in Houghton
| Characteristic | Without Mortgage | With Mortgage |
| Housing Units | 413 | 427 |
| Median Property Value | $217,700 | $194,000 |
| Median Household Income | $110,268 | $144 |
| Monthly Housing Costs | $575 | $18 |
| Real Estate Taxes | $3,311 | $0 |
Property Value by Mortgage Status in Houghton
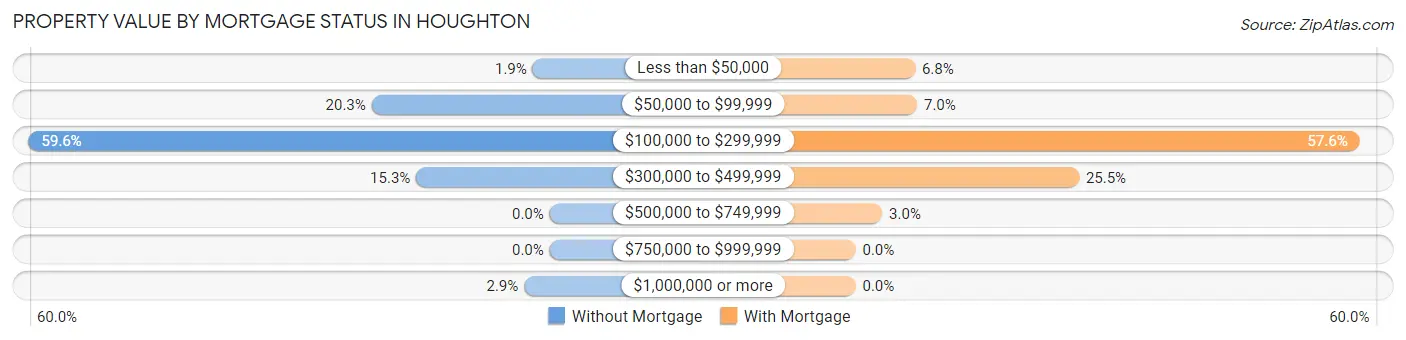
| Property Value | Without Mortgage | With Mortgage |
| Less than $50,000 | 8 (1.9%) | 29 (6.8%) |
| $50,000 to $99,999 | 84 (20.3%) | 30 (7.0%) |
| $100,000 to $299,999 | 246 (59.6%) | 246 (57.6%) |
| $300,000 to $499,999 | 63 (15.2%) | 109 (25.5%) |
| $500,000 to $749,999 | 0 (0.0%) | 13 (3.0%) |
| $750,000 to $999,999 | 0 (0.0%) | 0 (0.0%) |
| $1,000,000 or more | 12 (2.9%) | 0 (0.0%) |
| Total | 413 (100.0%) | 427 (100.0%) |
Household Income by Mortgage Status in Houghton
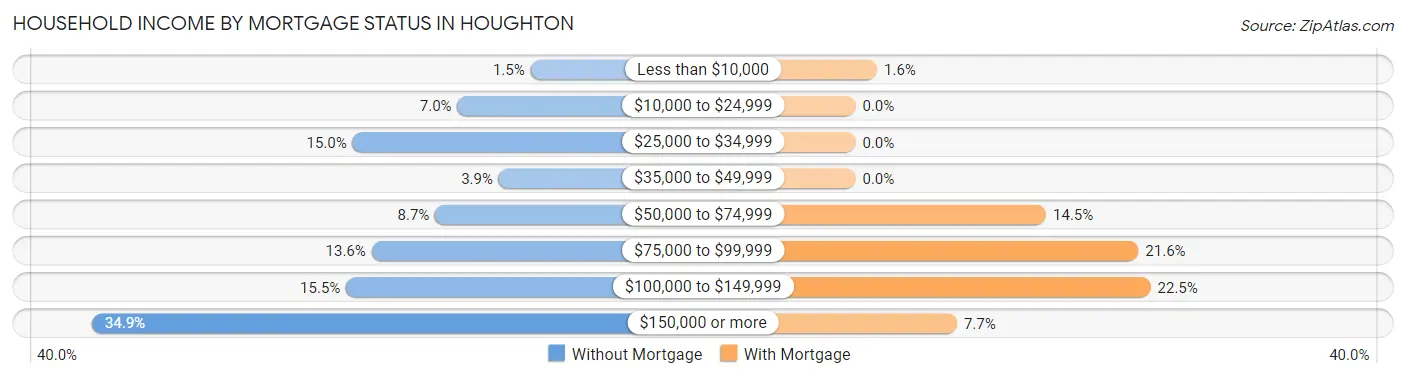
| Household Income | Without Mortgage | With Mortgage |
| Less than $10,000 | 6 (1.5%) | 7 (1.6%) |
| $10,000 to $24,999 | 29 (7.0%) | 0 (0.0%) |
| $25,000 to $34,999 | 62 (15.0%) | 0 (0.0%) |
| $35,000 to $49,999 | 16 (3.9%) | 0 (0.0%) |
| $50,000 to $74,999 | 36 (8.7%) | 62 (14.5%) |
| $75,000 to $99,999 | 56 (13.6%) | 92 (21.5%) |
| $100,000 to $149,999 | 64 (15.5%) | 96 (22.5%) |
| $150,000 or more | 144 (34.9%) | 33 (7.7%) |
| Total | 413 (100.0%) | 427 (100.0%) |
Property Value to Household Income Ratio in Houghton
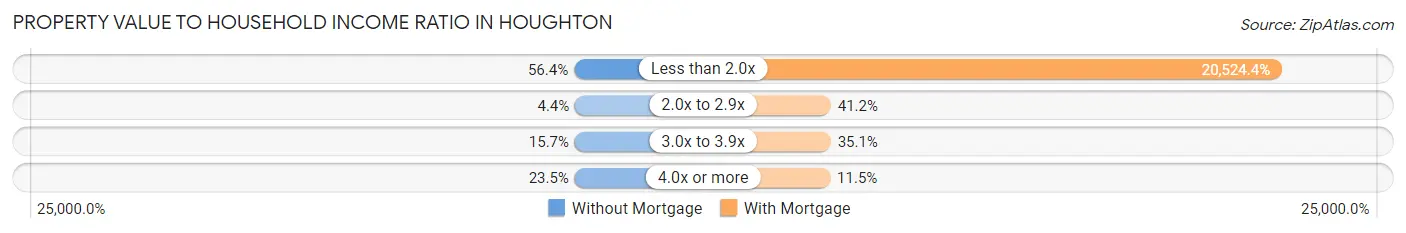
| Value-to-Income Ratio | Without Mortgage | With Mortgage |
| Less than 2.0x | 233 (56.4%) | 87,639 (20,524.4%) |
| 2.0x to 2.9x | 18 (4.4%) | 176 (41.2%) |
| 3.0x to 3.9x | 65 (15.7%) | 150 (35.1%) |
| 4.0x or more | 97 (23.5%) | 49 (11.5%) |
| Total | 413 (100.0%) | 427 (100.0%) |
Real Estate Taxes by Mortgage Status in Houghton
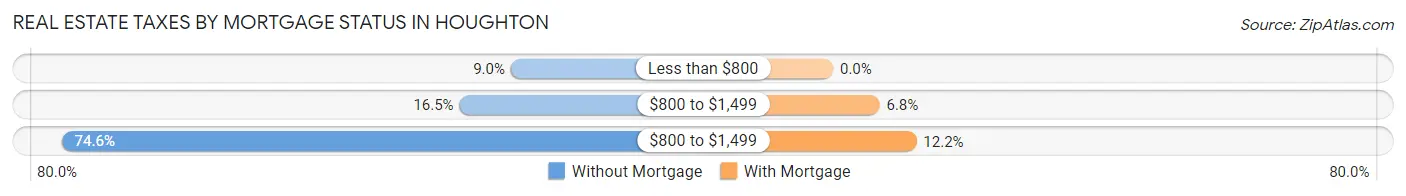
| Property Taxes | Without Mortgage | With Mortgage |
| Less than $800 | 37 (9.0%) | 0 (0.0%) |
| $800 to $1,499 | 68 (16.5%) | 29 (6.8%) |
| $800 to $1,499 | 308 (74.6%) | 52 (12.2%) |
| Total | 413 (100.0%) | 427 (100.0%) |
Health & Disability in Houghton
Health Insurance Coverage by Age in Houghton
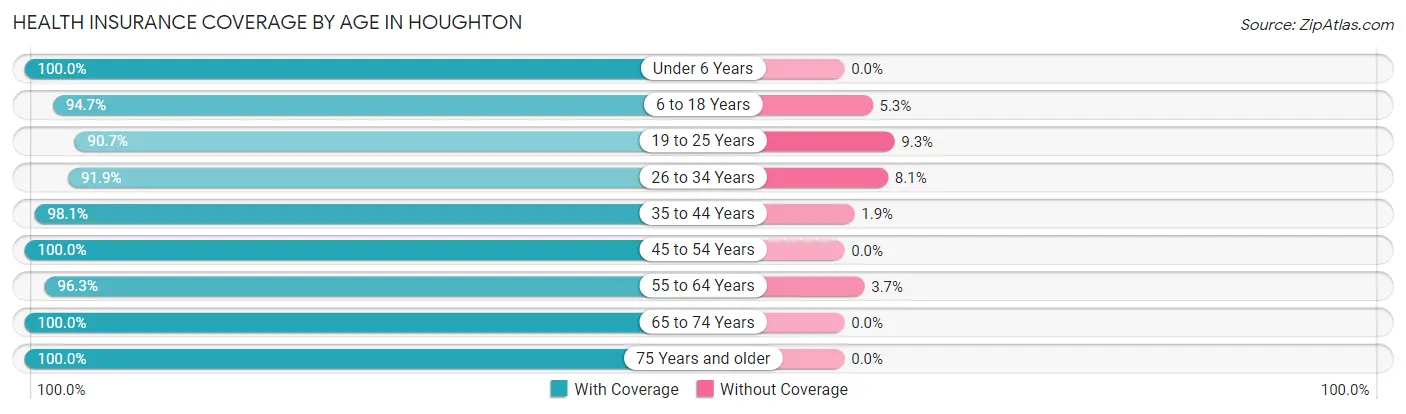
| Age Bracket | With Coverage | Without Coverage |
| Under 6 Years | 286 (100.0%) | 0 (0.0%) |
| 6 to 18 Years | 1,225 (94.7%) | 68 (5.3%) |
| 19 to 25 Years | 3,379 (90.7%) | 348 (9.3%) |
| 26 to 34 Years | 915 (91.9%) | 81 (8.1%) |
| 35 to 44 Years | 418 (98.1%) | 8 (1.9%) |
| 45 to 54 Years | 424 (100.0%) | 0 (0.0%) |
| 55 to 64 Years | 387 (96.3%) | 15 (3.7%) |
| 65 to 74 Years | 300 (100.0%) | 0 (0.0%) |
| 75 Years and older | 417 (100.0%) | 0 (0.0%) |
| Total | 7,751 (93.7%) | 520 (6.3%) |
Health Insurance Coverage by Citizenship Status in Houghton
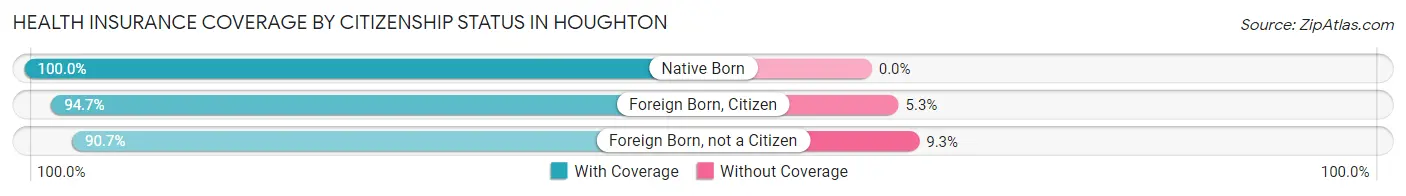
| Citizenship Status | With Coverage | Without Coverage |
| Native Born | 286 (100.0%) | 0 (0.0%) |
| Foreign Born, Citizen | 1,225 (94.7%) | 68 (5.3%) |
| Foreign Born, not a Citizen | 3,379 (90.7%) | 348 (9.3%) |
Health Insurance Coverage by Household Income in Houghton
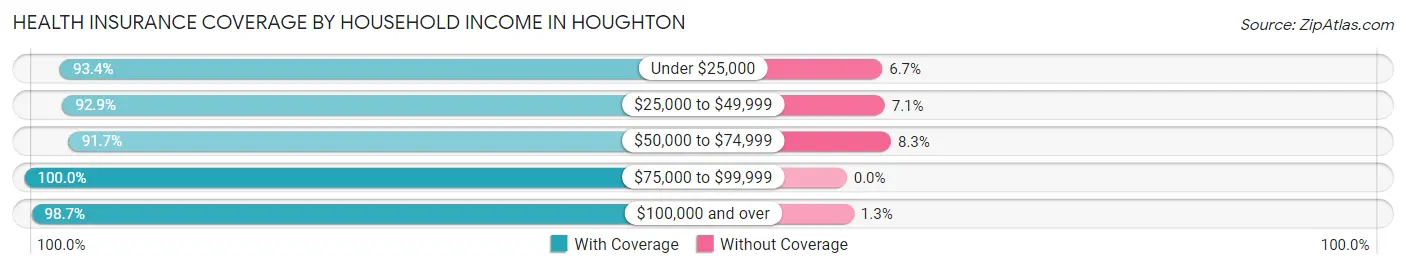
| Household Income | With Coverage | Without Coverage |
| Under $25,000 | 1,614 (93.3%) | 115 (6.7%) |
| $25,000 to $49,999 | 496 (92.9%) | 38 (7.1%) |
| $50,000 to $74,999 | 907 (91.7%) | 82 (8.3%) |
| $75,000 to $99,999 | 530 (100.0%) | 0 (0.0%) |
| $100,000 and over | 1,482 (98.7%) | 20 (1.3%) |
Public vs Private Health Insurance Coverage by Age in Houghton
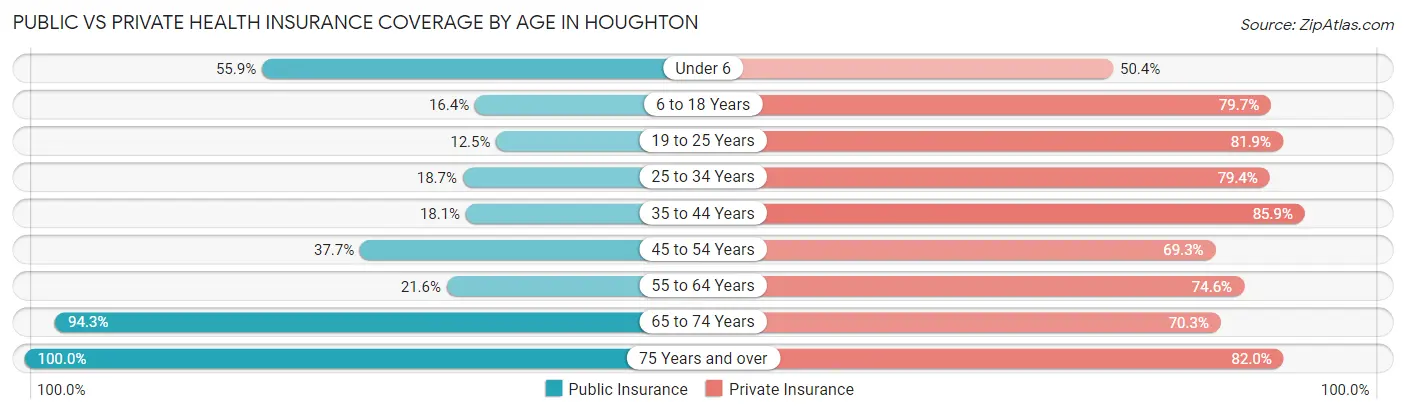
| Age Bracket | Public Insurance | Private Insurance |
| Under 6 | 160 (55.9%) | 144 (50.3%) |
| 6 to 18 Years | 212 (16.4%) | 1,030 (79.7%) |
| 19 to 25 Years | 464 (12.4%) | 3,051 (81.9%) |
| 25 to 34 Years | 186 (18.7%) | 791 (79.4%) |
| 35 to 44 Years | 77 (18.1%) | 366 (85.9%) |
| 45 to 54 Years | 160 (37.7%) | 294 (69.3%) |
| 55 to 64 Years | 87 (21.6%) | 300 (74.6%) |
| 65 to 74 Years | 283 (94.3%) | 211 (70.3%) |
| 75 Years and over | 417 (100.0%) | 342 (82.0%) |
| Total | 2,046 (24.7%) | 6,529 (78.9%) |
Disability Status by Sex by Age in Houghton
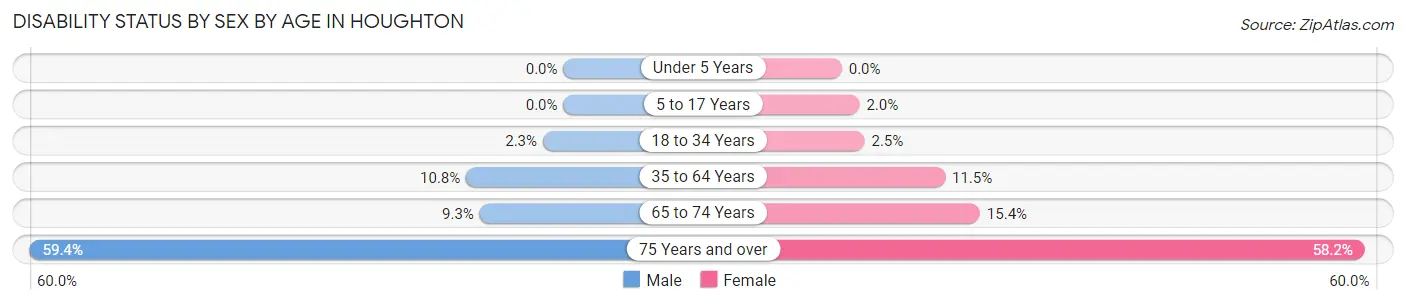
| Age Bracket | Male | Female |
| Under 5 Years | 0 (0.0%) | 0 (0.0%) |
| 5 to 17 Years | 0 (0.0%) | 8 (2.0%) |
| 18 to 34 Years | 87 (2.3%) | 39 (2.5%) |
| 35 to 64 Years | 64 (10.8%) | 76 (11.5%) |
| 65 to 74 Years | 11 (9.3%) | 28 (15.4%) |
| 75 Years and over | 107 (59.4%) | 138 (58.2%) |
Disability Class by Sex by Age in Houghton
Disability Class: Hearing Difficulty
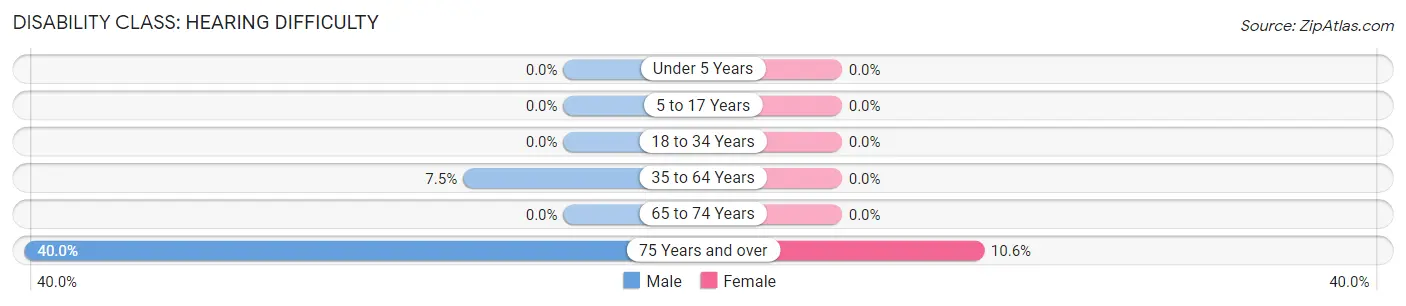
| Age Bracket | Male | Female |
| Under 5 Years | 0 (0.0%) | 0 (0.0%) |
| 5 to 17 Years | 0 (0.0%) | 0 (0.0%) |
| 18 to 34 Years | 0 (0.0%) | 0 (0.0%) |
| 35 to 64 Years | 44 (7.4%) | 0 (0.0%) |
| 65 to 74 Years | 0 (0.0%) | 0 (0.0%) |
| 75 Years and over | 72 (40.0%) | 25 (10.5%) |
Disability Class: Vision Difficulty
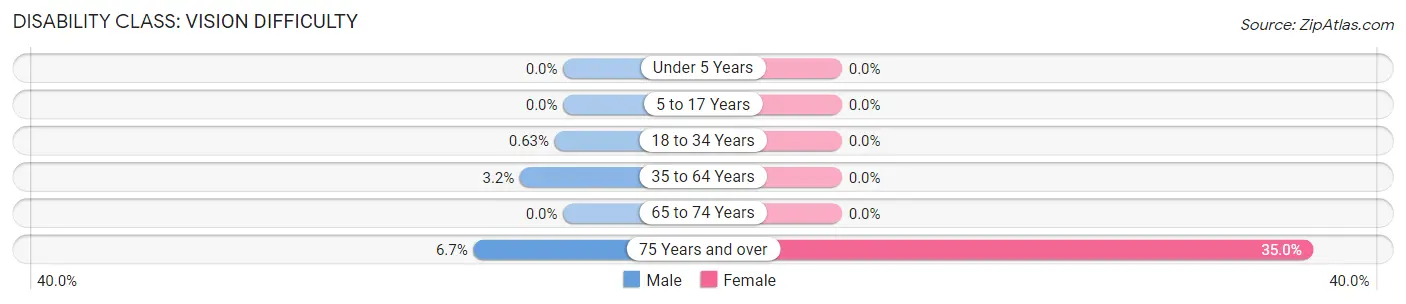
| Age Bracket | Male | Female |
| Under 5 Years | 0 (0.0%) | 0 (0.0%) |
| 5 to 17 Years | 0 (0.0%) | 0 (0.0%) |
| 18 to 34 Years | 24 (0.6%) | 0 (0.0%) |
| 35 to 64 Years | 19 (3.2%) | 0 (0.0%) |
| 65 to 74 Years | 0 (0.0%) | 0 (0.0%) |
| 75 Years and over | 12 (6.7%) | 83 (35.0%) |
Disability Class: Cognitive Difficulty
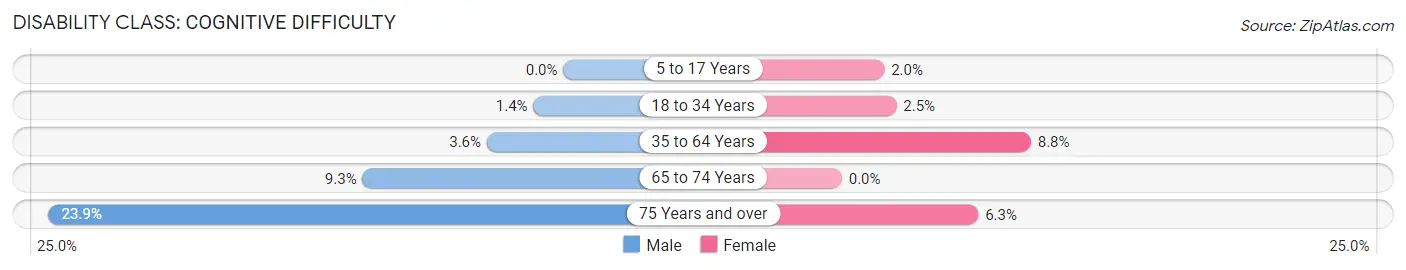
| Age Bracket | Male | Female |
| 5 to 17 Years | 0 (0.0%) | 8 (2.0%) |
| 18 to 34 Years | 53 (1.4%) | 39 (2.5%) |
| 35 to 64 Years | 21 (3.5%) | 58 (8.8%) |
| 65 to 74 Years | 11 (9.3%) | 0 (0.0%) |
| 75 Years and over | 43 (23.9%) | 15 (6.3%) |
Disability Class: Ambulatory Difficulty
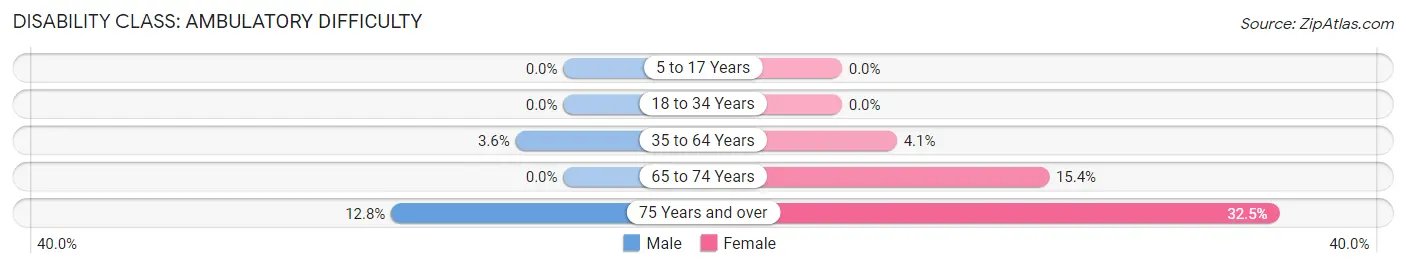
| Age Bracket | Male | Female |
| 5 to 17 Years | 0 (0.0%) | 0 (0.0%) |
| 18 to 34 Years | 0 (0.0%) | 0 (0.0%) |
| 35 to 64 Years | 21 (3.5%) | 27 (4.1%) |
| 65 to 74 Years | 0 (0.0%) | 28 (15.4%) |
| 75 Years and over | 23 (12.8%) | 77 (32.5%) |
Disability Class: Self-Care Difficulty
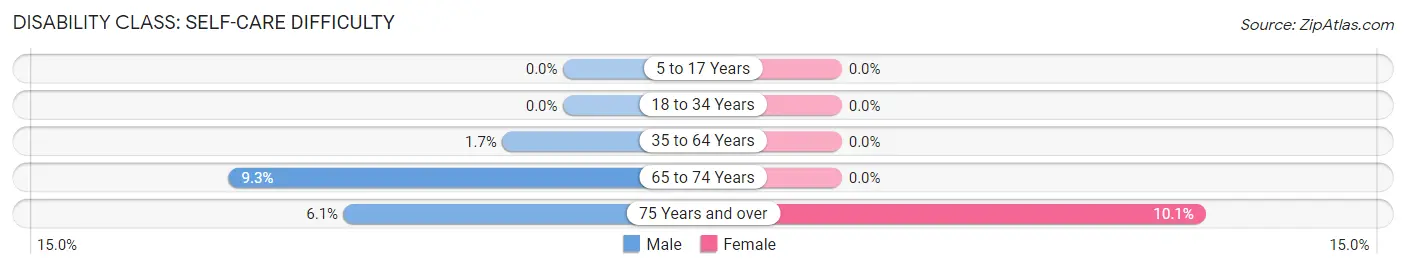
| Age Bracket | Male | Female |
| 5 to 17 Years | 0 (0.0%) | 0 (0.0%) |
| 18 to 34 Years | 0 (0.0%) | 0 (0.0%) |
| 35 to 64 Years | 10 (1.7%) | 0 (0.0%) |
| 65 to 74 Years | 11 (9.3%) | 0 (0.0%) |
| 75 Years and over | 11 (6.1%) | 24 (10.1%) |
Technology Access in Houghton
Computing Device Access in Houghton
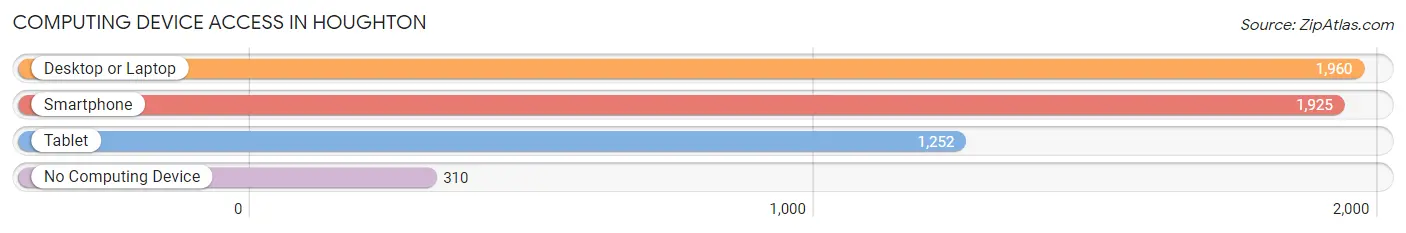
| Device Type | # Households | % Households |
| Desktop or Laptop | 1,960 | 82.2% |
| Smartphone | 1,925 | 80.7% |
| Tablet | 1,252 | 52.5% |
| No Computing Device | 310 | 13.0% |
| Total | 2,385 | 100.0% |
Internet Access in Houghton
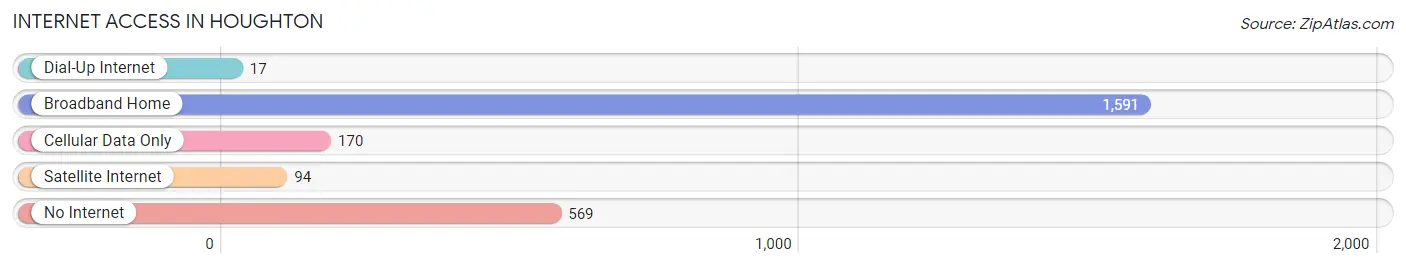
| Internet Type | # Households | % Households |
| Dial-Up Internet | 17 | 0.7% |
| Broadband Home | 1,591 | 66.7% |
| Cellular Data Only | 170 | 7.1% |
| Satellite Internet | 94 | 3.9% |
| No Internet | 569 | 23.9% |
| Total | 2,385 | 100.0% |
Houghton Summary
Houghton, Michigan is a city located in the Upper Peninsula of Michigan. It is the county seat of Houghton County and is located on the Keweenaw Peninsula, which is the northernmost part of the state. The city is situated on the shore of Portage Lake, which is part of the Keweenaw Waterway. The city is home to Michigan Technological University, which is a major employer in the area.
Geography
Houghton is located in the Upper Peninsula of Michigan, in the Keweenaw Peninsula. The city is situated on the shore of Portage Lake, which is part of the Keweenaw Waterway. The city is surrounded by forests and is located near the Porcupine Mountains. The city has a total area of 8.2 square miles, of which 7.9 square miles is land and 0.3 square miles is water.
The climate in Houghton is classified as a humid continental climate, with cold, snowy winters and warm, humid summers. The average temperature in the winter is around 20°F, while the average temperature in the summer is around 70°F. The average annual precipitation is around 30 inches.
Economy
Houghton’s economy is largely driven by Michigan Technological University, which is the city’s largest employer. The university employs over 3,000 people and has an annual economic impact of over $1 billion. Other major employers in the city include Houghton County Medical Care Facility, Houghton County Memorial Hospital, and the Houghton County Sheriff’s Office.
The city is also home to several small businesses, including restaurants, retail stores, and other service-based businesses. The city is also home to several manufacturing companies, including a paper mill and a copper smelter.
Demographics
As of the 2010 census, the population of Houghton was 7,708. The racial makeup of the city was 94.2% White, 0.7% African American, 0.6% Native American, 1.3% Asian, 0.1% Pacific Islander, 0.9% from other races, and 2.2% from two or more races. Hispanic or Latino of any race were 2.7% of the population.
The median income for a household in the city was $37,917, and the median income for a family was $50,917. The per capita income for the city was $20,917. About 11.2% of families and 17.2% of the population were below the poverty line, including 22.2% of those under age 18 and 8.2% of those age 65 or over.
Conclusion
Houghton, Michigan is a city located in the Upper Peninsula of Michigan. It is the county seat of Houghton County and is located on the Keweenaw Peninsula. The city is situated on the shore of Portage Lake, which is part of the Keweenaw Waterway. The city is home to Michigan Technological University, which is a major employer in the area. The city has a humid continental climate, with cold, snowy winters and warm, humid summers. The economy of the city is largely driven by Michigan Technological University, which is the city’s largest employer. The city is also home to several small businesses, including restaurants, retail stores, and other service-based businesses. As of the 2010 census, the population of Houghton was 7,708. The median income for a household in the city was $37,917, and the median income for a family was $50,917.
Common Questions
What is Per Capita Income in Houghton?
Per Capita income in Houghton is $21,630.
What is the Median Family Income in Houghton?
Median Family Income in Houghton is $85,400.
What is the Median Household income in Houghton?
Median Household Income in Houghton is $29,821.
What is Income or Wage Gap in Houghton?
Income or Wage Gap in Houghton is 31.0%.
Women in Houghton earn 69.0 cents for every dollar earned by a man.
What is Inequality or Gini Index in Houghton?
Inequality or Gini Index in Houghton is 0.58.
What is the Total Population of Houghton?
Total Population of Houghton is 8,303.
What is the Total Male Population of Houghton?
Total Male Population of Houghton is 5,189.
What is the Total Female Population of Houghton?
Total Female Population of Houghton is 3,114.
What is the Ratio of Males per 100 Females in Houghton?
There are 166.63 Males per 100 Females in Houghton.
What is the Ratio of Females per 100 Males in Houghton?
There are 60.01 Females per 100 Males in Houghton.
What is the Median Population Age in Houghton?
Median Population Age in Houghton is 22.2 Years.
What is the Average Family Size in Houghton
Average Family Size in Houghton is 3.1 People.
What is the Average Household Size in Houghton
Average Household Size in Houghton is 2.2 People.
How Large is the Labor Force in Houghton?
There are 4,001 People in the Labor Forcein in Houghton.
What is the Percentage of People in the Labor Force in Houghton?
53.1% of People are in the Labor Force in Houghton.
What is the Unemployment Rate in Houghton?
Unemployment Rate in Houghton is 11.9%.