Five Forks, SC Map & Demographics
Five Forks Map
Five Forks Overview
$53,614
PER CAPITA INCOME
$145,753
AVG FAMILY INCOME
$133,750
AVG HOUSEHOLD INCOME
48.5%
WAGE / INCOME GAP [ % ]
51.5¢/ $1
WAGE / INCOME GAP [ $ ]
$12,672
FAMILY INCOME DEFICIT
0.40
INEQUALITY / GINI INDEX
18,592
TOTAL POPULATION
9,609
MALE POPULATION
8,983
FEMALE POPULATION
106.97
MALES / 100 FEMALES
93.49
FEMALES / 100 MALES
36.6
MEDIAN AGE
3.3
AVG FAMILY SIZE
3.0
AVG HOUSEHOLD SIZE
8,984
LABOR FORCE [ PEOPLE ]
64.7%
PERCENT IN LABOR FORCE
3.5%
UNEMPLOYMENT RATE
Income in Five Forks
Income Overview in Five Forks
Per Capita Income in Five Forks is $53,614, while median incomes of families and households are $145,753 and $133,750 respectively.
| Characteristic | Number | Measure |
| Per Capita Income | 18,592 | $53,614 |
| Median Family Income | 5,205 | $145,753 |
| Mean Family Income | 5,205 | $178,556 |
| Median Household Income | 6,192 | $133,750 |
| Mean Household Income | 6,192 | $160,957 |
| Income Deficit | 5,205 | $12,672 |
| Wage / Income Gap (%) | 18,592 | 48.46% |
| Wage / Income Gap ($) | 18,592 | 51.54¢ per $1 |
| Gini / Inequality Index | 18,592 | 0.40 |
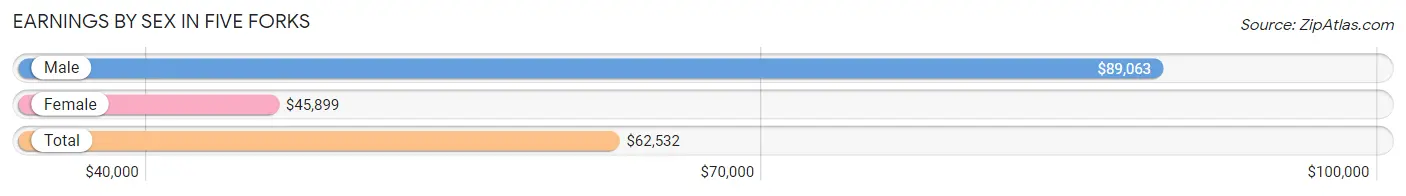
Earnings by Sex in Five Forks
Average Earnings in Five Forks are $62,532, $89,063 for men and $45,899 for women, a difference of 48.5%.
| Sex | Number | Average Earnings |
| Male | 5,236 (55.4%) | $89,063 |
| Female | 4,207 (44.6%) | $45,899 |
| Total | 9,443 (100.0%) | $62,532 |
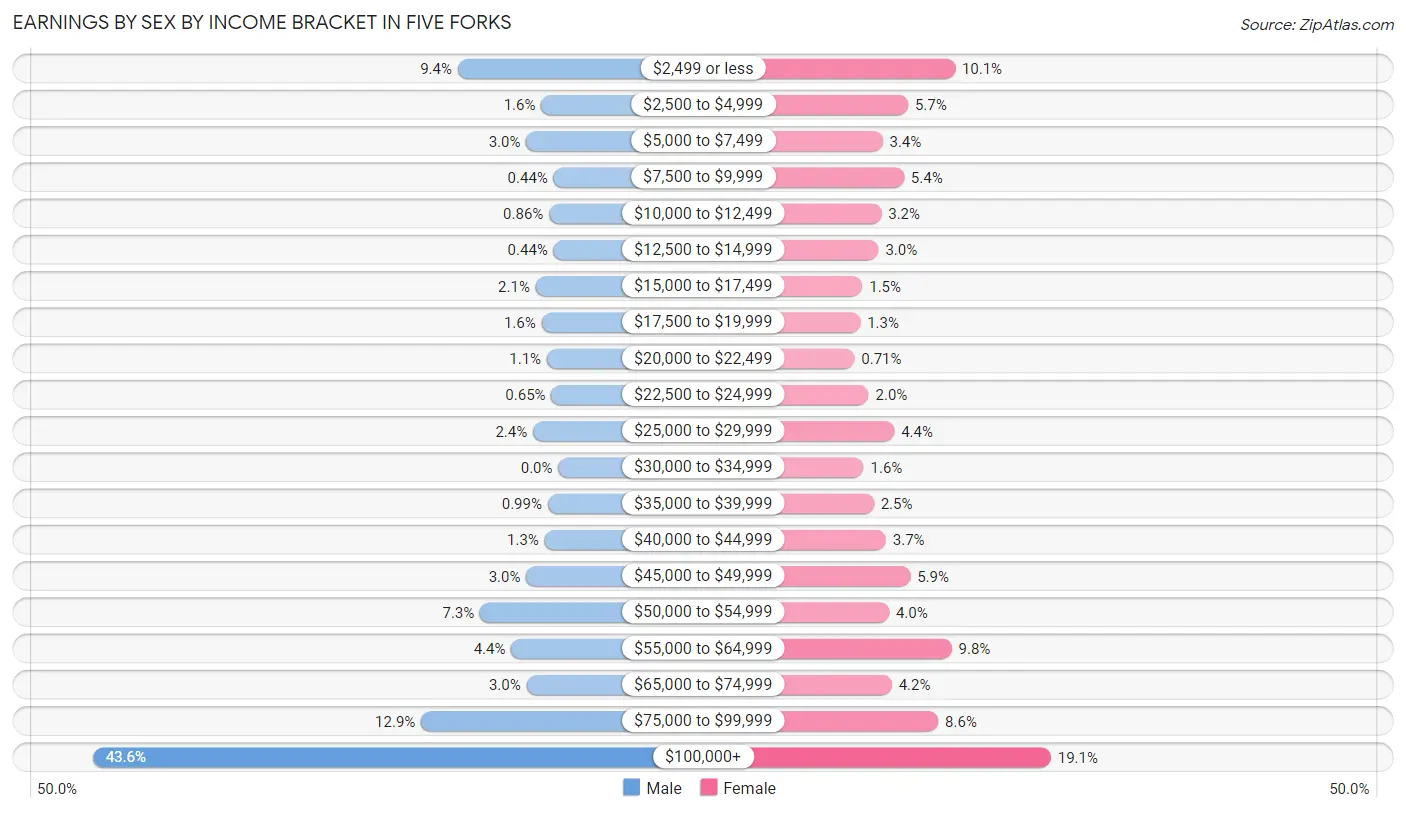
Earnings by Sex by Income Bracket in Five Forks
The most common earnings brackets in Five Forks are $100,000+ for men (2,284 | 43.6%) and $100,000+ for women (804 | 19.1%).
| Income | Male | Female |
| $2,499 or less | 493 (9.4%) | 426 (10.1%) |
| $2,500 to $4,999 | 84 (1.6%) | 241 (5.7%) |
| $5,000 to $7,499 | 157 (3.0%) | 141 (3.4%) |
| $7,500 to $9,999 | 23 (0.4%) | 225 (5.3%) |
| $10,000 to $12,499 | 45 (0.9%) | 136 (3.2%) |
| $12,500 to $14,999 | 23 (0.4%) | 125 (3.0%) |
| $15,000 to $17,499 | 111 (2.1%) | 61 (1.5%) |
| $17,500 to $19,999 | 82 (1.6%) | 53 (1.3%) |
| $20,000 to $22,499 | 56 (1.1%) | 30 (0.7%) |
| $22,500 to $24,999 | 34 (0.6%) | 86 (2.0%) |
| $25,000 to $29,999 | 124 (2.4%) | 187 (4.4%) |
| $30,000 to $34,999 | 0 (0.0%) | 66 (1.6%) |
| $35,000 to $39,999 | 52 (1.0%) | 106 (2.5%) |
| $40,000 to $44,999 | 67 (1.3%) | 154 (3.7%) |
| $45,000 to $49,999 | 157 (3.0%) | 250 (5.9%) |
| $50,000 to $54,999 | 384 (7.3%) | 166 (4.0%) |
| $55,000 to $64,999 | 231 (4.4%) | 413 (9.8%) |
| $65,000 to $74,999 | 156 (3.0%) | 177 (4.2%) |
| $75,000 to $99,999 | 673 (12.9%) | 360 (8.6%) |
| $100,000+ | 2,284 (43.6%) | 804 (19.1%) |
| Total | 5,236 (100.0%) | 4,207 (100.0%) |
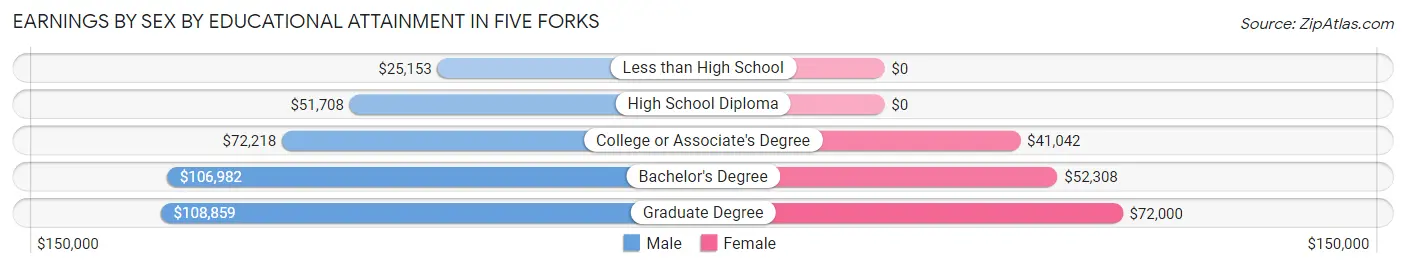
Earnings by Sex by Educational Attainment in Five Forks
Average earnings in Five Forks are $100,075 for men and $52,395 for women, a difference of 47.6%. Men with an educational attainment of graduate degree enjoy the highest average annual earnings of $108,859, while those with less than high school education earn the least with $25,153. Women with an educational attainment of graduate degree earn the most with the average annual earnings of $72,000, while those with college or associate's degree education have the smallest earnings of $41,042.
| Educational Attainment | Male Income | Female Income |
| Less than High School | $25,153 | $0 |
| High School Diploma | $51,708 | $0 |
| College or Associate's Degree | $72,218 | $41,042 |
| Bachelor's Degree | $106,982 | $52,308 |
| Graduate Degree | $108,859 | $72,000 |
| Total | $100,075 | $52,395 |
Family Income in Five Forks
Family Income Brackets in Five Forks
According to the Five Forks family income data, there are 1,452 families falling into the $100,000 to $149,999 income range, which is the most common income bracket and makes up 27.9% of all families. Conversely, the $15,000 to $24,999 income bracket is the least frequent group with only 10 families (0.2%) belonging to this category.
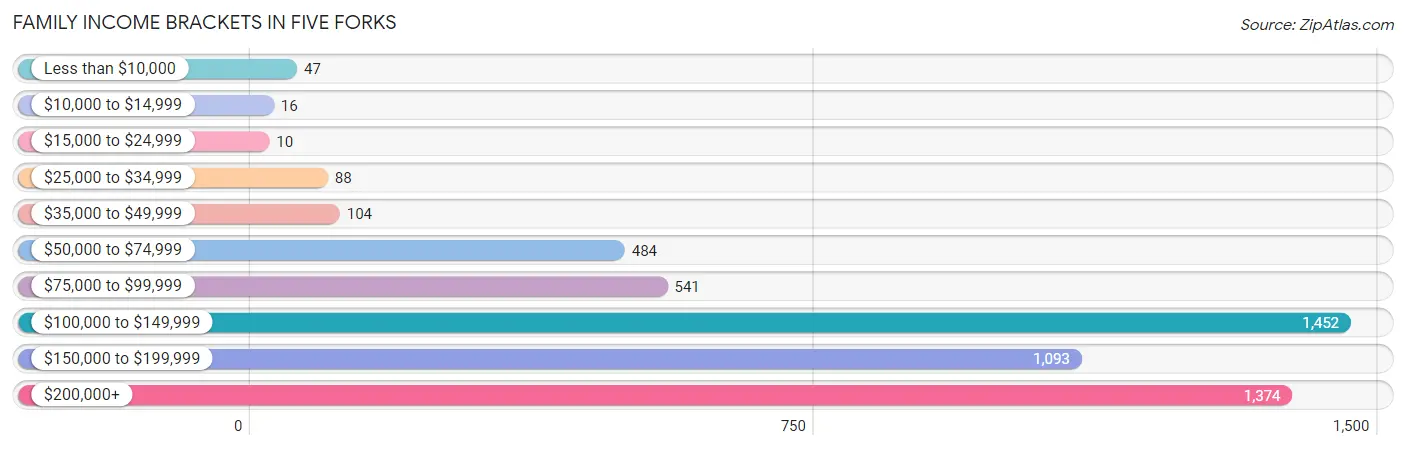
| Income Bracket | # Families | % Families |
| Less than $10,000 | 47 | 0.9% |
| $10,000 to $14,999 | 16 | 0.3% |
| $15,000 to $24,999 | 10 | 0.2% |
| $25,000 to $34,999 | 88 | 1.7% |
| $35,000 to $49,999 | 104 | 2.0% |
| $50,000 to $74,999 | 484 | 9.3% |
| $75,000 to $99,999 | 541 | 10.4% |
| $100,000 to $149,999 | 1,452 | 27.9% |
| $150,000 to $199,999 | 1,093 | 21.0% |
| $200,000+ | 1,374 | 26.4% |
Family Income by Famaliy Size in Five Forks
5-person families (329 | 6.3%) account for the highest median family income in Five Forks with $237,321 per family, while 2-person families (1,801 | 34.6%) have the highest median income of $68,688 per family member.
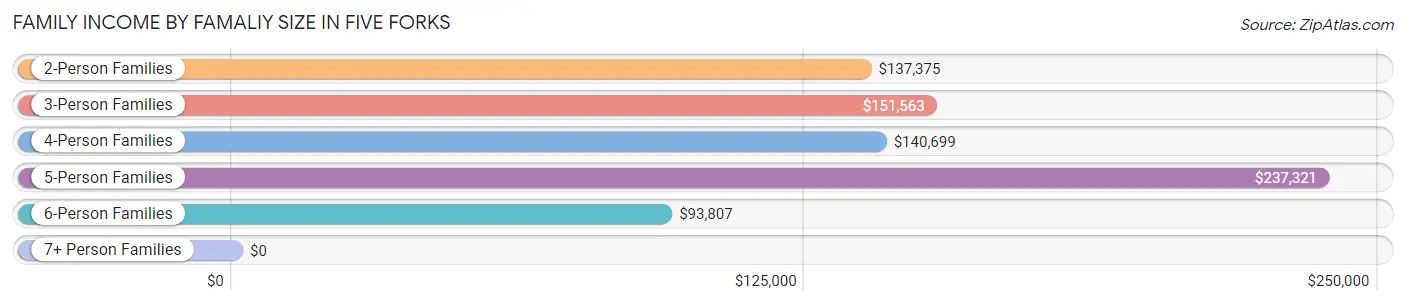
| Income Bracket | # Families | Median Income |
| 2-Person Families | 1,801 (34.6%) | $137,375 |
| 3-Person Families | 1,077 (20.7%) | $151,563 |
| 4-Person Families | 1,785 (34.3%) | $140,699 |
| 5-Person Families | 329 (6.3%) | $237,321 |
| 6-Person Families | 185 (3.5%) | $93,807 |
| 7+ Person Families | 28 (0.5%) | $0 |
| Total | 5,205 (100.0%) | $145,753 |
Family Income by Number of Earners in Five Forks
The median family income in Five Forks is $145,753, with families comprising 3+ earners (798) having the highest median family income of $152,484, while families with no earners (533) have the lowest median family income of $77,841, accounting for 15.3% and 10.2% of families, respectively.
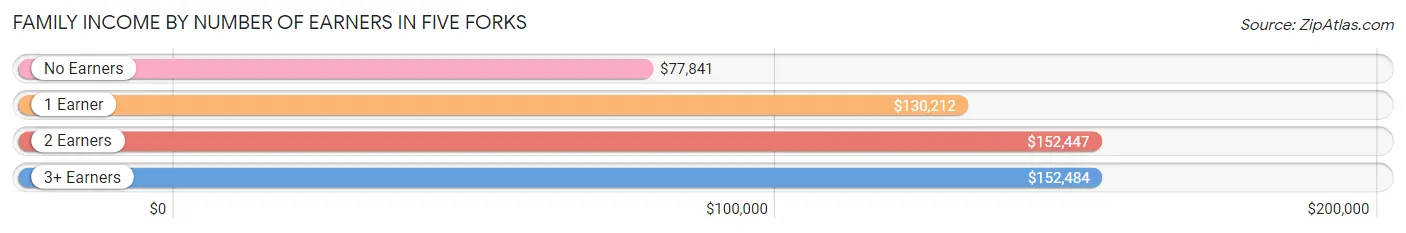
| Number of Earners | # Families | Median Income |
| No Earners | 533 (10.2%) | $77,841 |
| 1 Earner | 1,717 (33.0%) | $130,212 |
| 2 Earners | 2,157 (41.4%) | $152,447 |
| 3+ Earners | 798 (15.3%) | $152,484 |
| Total | 5,205 (100.0%) | $145,753 |
Household Income in Five Forks
Household Income Brackets in Five Forks
With 1,622 households falling in the category, the $100,000 to $149,999 income range is the most frequent in Five Forks, accounting for 26.2% of all households. In contrast, only 31 households (0.5%) fall into the $10,000 to $14,999 income bracket, making it the least populous group.
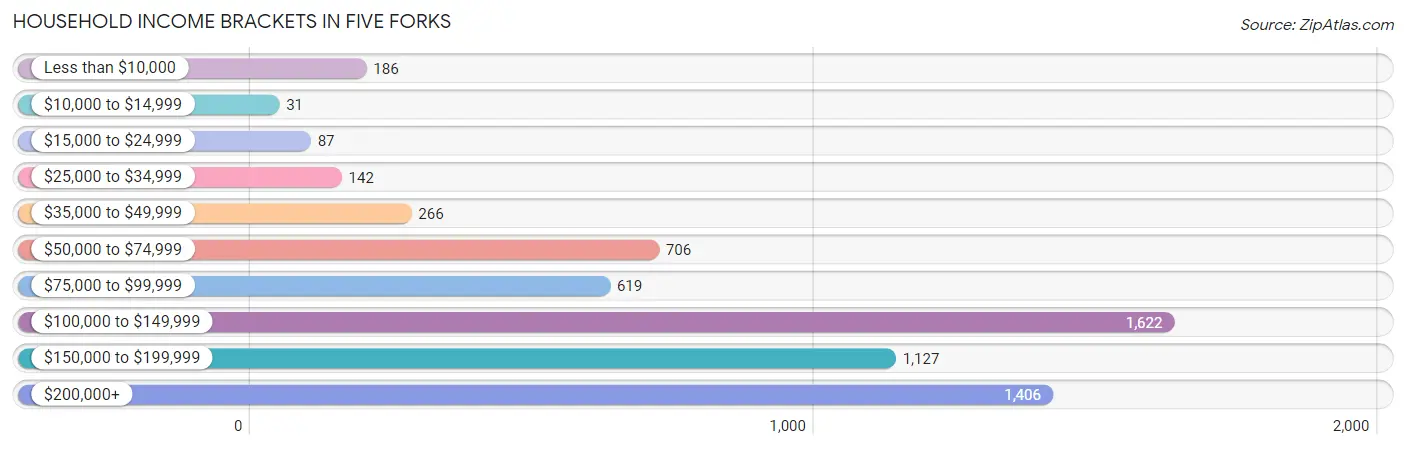
| Income Bracket | # Households | % Households |
| Less than $10,000 | 186 | 3.0% |
| $10,000 to $14,999 | 31 | 0.5% |
| $15,000 to $24,999 | 87 | 1.4% |
| $25,000 to $34,999 | 142 | 2.3% |
| $35,000 to $49,999 | 266 | 4.3% |
| $50,000 to $74,999 | 706 | 11.4% |
| $75,000 to $99,999 | 619 | 10.0% |
| $100,000 to $149,999 | 1,622 | 26.2% |
| $150,000 to $199,999 | 1,127 | 18.2% |
| $200,000+ | 1,406 | 22.7% |
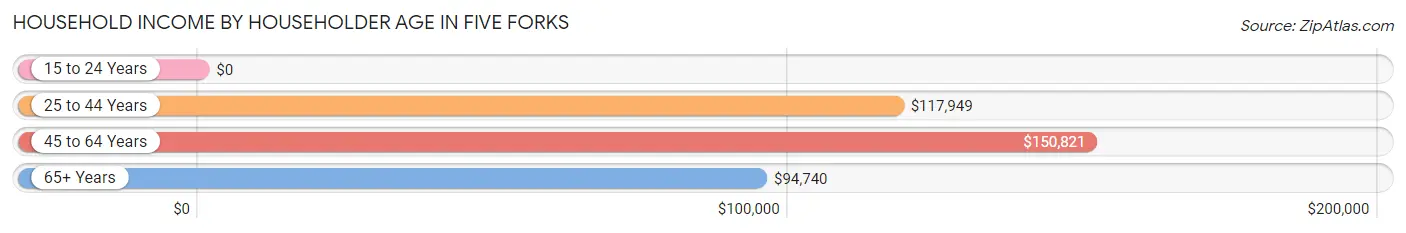
Household Income by Householder Age in Five Forks
The median household income in Five Forks is $133,750, with the highest median household income of $150,821 found in the 45 to 64 years age bracket for the primary householder. A total of 2,964 households (47.9%) fall into this category. Meanwhile, the 15 to 24 years age bracket for the primary householder has the lowest median household income of $0, with 13 households (0.2%) in this group.
| Income Bracket | # Households | Median Income |
| 15 to 24 Years | 13 (0.2%) | $0 |
| 25 to 44 Years | 1,976 (31.9%) | $117,949 |
| 45 to 64 Years | 2,964 (47.9%) | $150,821 |
| 65+ Years | 1,239 (20.0%) | $94,740 |
| Total | 6,192 (100.0%) | $133,750 |
Poverty in Five Forks
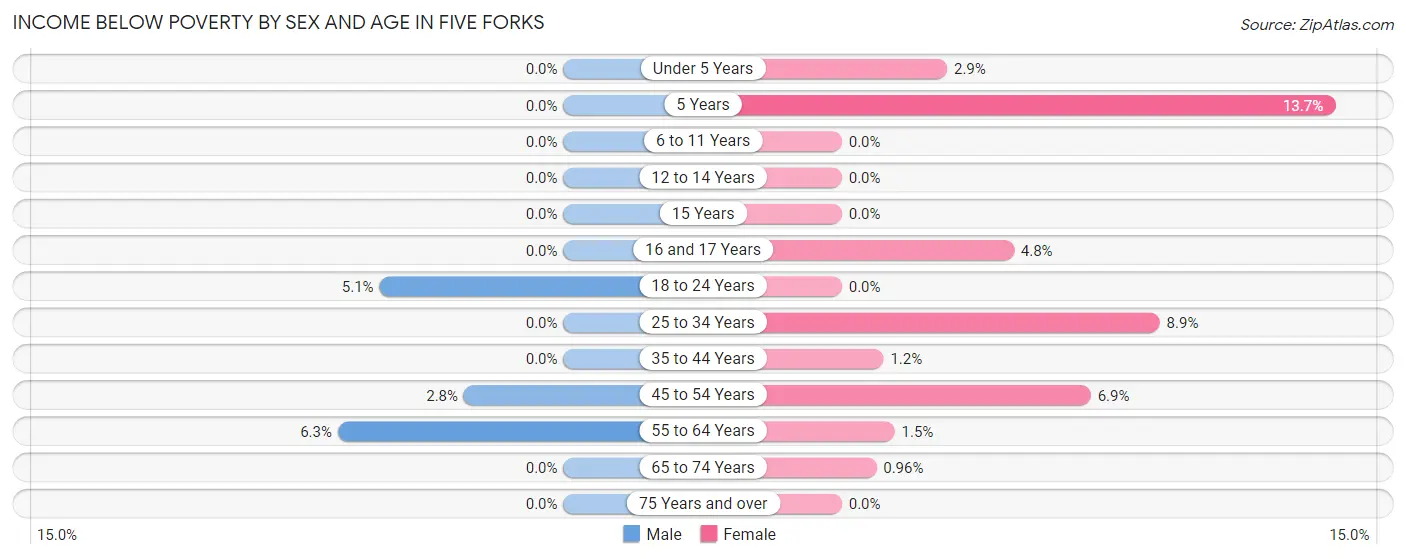
Income Below Poverty by Sex and Age in Five Forks
With 1.3% poverty level for males and 3.2% for females among the residents of Five Forks, 55 to 64 year old males and 5 year old females are the most vulnerable to poverty, with 63 males (6.3%) and 14 females (13.7%) in their respective age groups living below the poverty level.
| Age Bracket | Male | Female |
| Under 5 Years | 0 (0.0%) | 14 (2.9%) |
| 5 Years | 0 (0.0%) | 14 (13.7%) |
| 6 to 11 Years | 0 (0.0%) | 0 (0.0%) |
| 12 to 14 Years | 0 (0.0%) | 0 (0.0%) |
| 15 Years | 0 (0.0%) | 0 (0.0%) |
| 16 and 17 Years | 0 (0.0%) | 14 (4.8%) |
| 18 to 24 Years | 19 (5.1%) | 0 (0.0%) |
| 25 to 34 Years | 0 (0.0%) | 93 (8.8%) |
| 35 to 44 Years | 0 (0.0%) | 13 (1.2%) |
| 45 to 54 Years | 42 (2.8%) | 114 (6.9%) |
| 55 to 64 Years | 63 (6.3%) | 19 (1.5%) |
| 65 to 74 Years | 0 (0.0%) | 7 (1.0%) |
| 75 Years and over | 0 (0.0%) | 0 (0.0%) |
| Total | 124 (1.3%) | 288 (3.2%) |
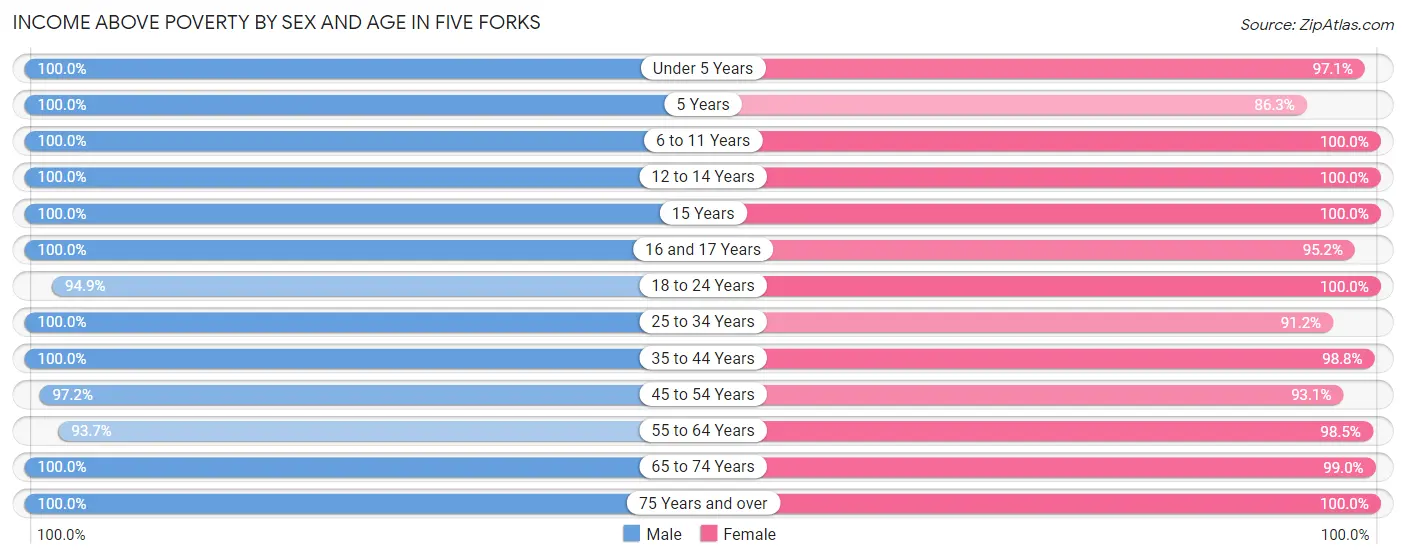
Income Above Poverty by Sex and Age in Five Forks
According to the poverty statistics in Five Forks, males aged under 5 years and females aged 6 to 11 years are the age groups that are most secure financially, with 100.0% of males and 100.0% of females in these age groups living above the poverty line.
| Age Bracket | Male | Female |
| Under 5 Years | 617 (100.0%) | 464 (97.1%) |
| 5 Years | 66 (100.0%) | 88 (86.3%) |
| 6 to 11 Years | 958 (100.0%) | 607 (100.0%) |
| 12 to 14 Years | 818 (100.0%) | 452 (100.0%) |
| 15 Years | 299 (100.0%) | 213 (100.0%) |
| 16 and 17 Years | 568 (100.0%) | 278 (95.2%) |
| 18 to 24 Years | 352 (94.9%) | 613 (100.0%) |
| 25 to 34 Years | 1,328 (100.0%) | 958 (91.1%) |
| 35 to 44 Years | 938 (100.0%) | 1,109 (98.8%) |
| 45 to 54 Years | 1,476 (97.2%) | 1,532 (93.1%) |
| 55 to 64 Years | 940 (93.7%) | 1,272 (98.5%) |
| 65 to 74 Years | 730 (100.0%) | 723 (99.0%) |
| 75 Years and over | 320 (100.0%) | 365 (100.0%) |
| Total | 9,410 (98.7%) | 8,674 (96.8%) |
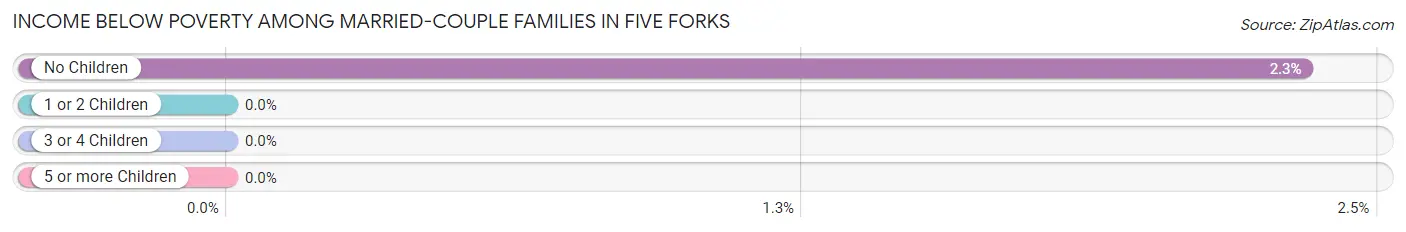
Income Below Poverty Among Married-Couple Families in Five Forks
The poverty statistics for married-couple families in Five Forks show that 1.1% or 48 of the total 4,553 families live below the poverty line. Families with no children have the highest poverty rate of 2.3%, comprising of 48 families. On the other hand, families with 1 or 2 children have the lowest poverty rate of 0.0%, which includes 0 families.
| Children | Above Poverty | Below Poverty |
| No Children | 2,007 (97.7%) | 48 (2.3%) |
| 1 or 2 Children | 2,066 (100.0%) | 0 (0.0%) |
| 3 or 4 Children | 432 (100.0%) | 0 (0.0%) |
| 5 or more Children | 0 (0.0%) | 0 (0.0%) |
| Total | 4,505 (99.0%) | 48 (1.1%) |
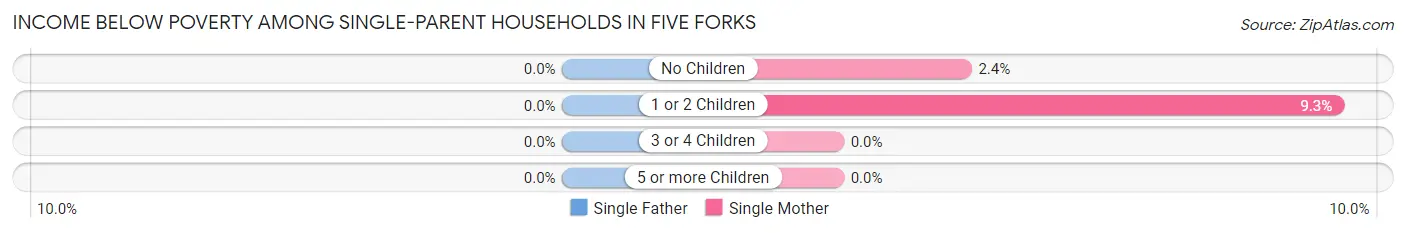
Income Below Poverty Among Single-Parent Households in Five Forks
| Children | Single Father | Single Mother |
| No Children | 0 (0.0%) | 6 (2.4%) |
| 1 or 2 Children | 0 (0.0%) | 15 (9.3%) |
| 3 or 4 Children | 0 (0.0%) | 0 (0.0%) |
| 5 or more Children | 0 (0.0%) | 0 (0.0%) |
| Total | 0 (0.0%) | 21 (4.6%) |
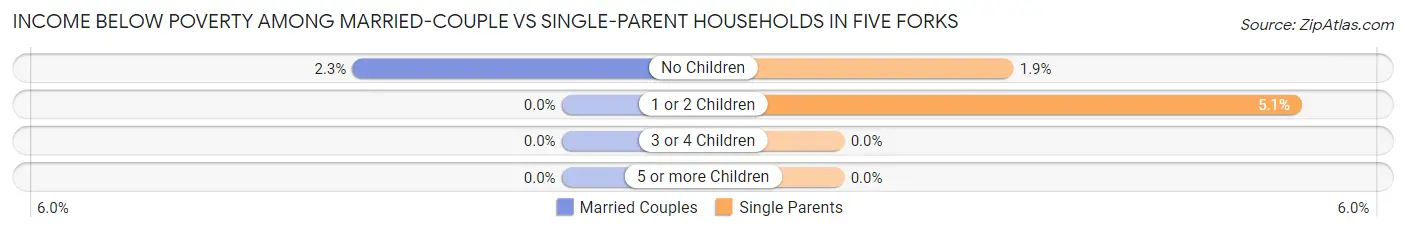
Income Below Poverty Among Married-Couple vs Single-Parent Households in Five Forks
The poverty data for Five Forks shows that 48 of the married-couple family households (1.1%) and 21 of the single-parent households (3.2%) are living below the poverty level. Within the married-couple family households, those with no children have the highest poverty rate, with 48 households (2.3%) falling below the poverty line. Among the single-parent households, those with 1 or 2 children have the highest poverty rate, with 15 household (5.1%) living below poverty.
| Children | Married-Couple Families | Single-Parent Households |
| No Children | 48 (2.3%) | 6 (1.9%) |
| 1 or 2 Children | 0 (0.0%) | 15 (5.1%) |
| 3 or 4 Children | 0 (0.0%) | 0 (0.0%) |
| 5 or more Children | 0 (0.0%) | 0 (0.0%) |
| Total | 48 (1.1%) | 21 (3.2%) |
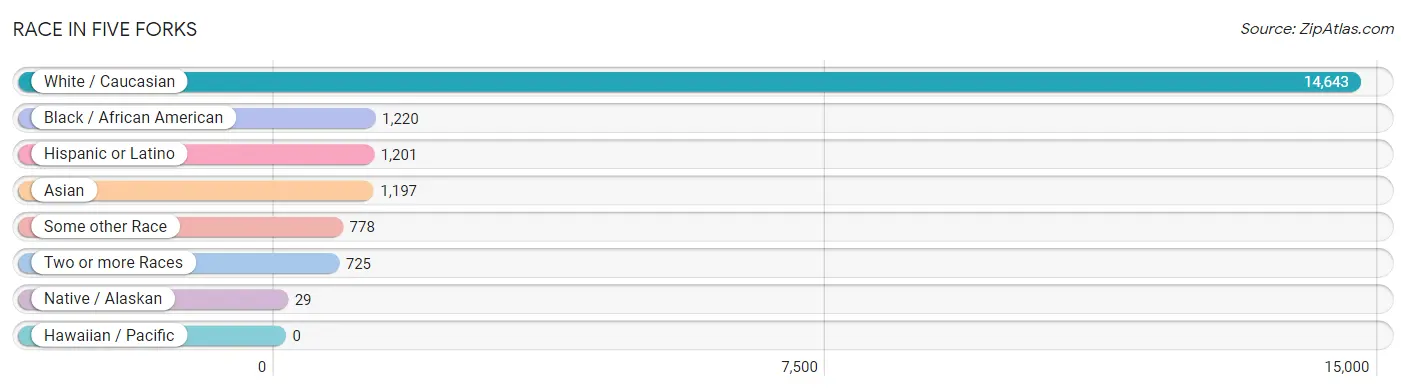
Race in Five Forks
The most populous races in Five Forks are White / Caucasian (14,643 | 78.8%), Black / African American (1,220 | 6.6%), and Hispanic or Latino (1,201 | 6.5%).
| Race | # Population | % Population |
| Asian | 1,197 | 6.4% |
| Black / African American | 1,220 | 6.6% |
| Hawaiian / Pacific | 0 | 0.0% |
| Hispanic or Latino | 1,201 | 6.5% |
| Native / Alaskan | 29 | 0.2% |
| White / Caucasian | 14,643 | 78.8% |
| Two or more Races | 725 | 3.9% |
| Some other Race | 778 | 4.2% |
| Total | 18,592 | 100.0% |
Ancestry in Five Forks
The most populous ancestries reported in Five Forks are German (3,433 | 18.5%), English (2,320 | 12.5%), Irish (1,776 | 9.6%), Polish (1,340 | 7.2%), and American (1,146 | 6.2%), together accounting for 53.9% of all Five Forks residents.

| Ancestry | # Population | % Population |
| Aleut | 9 | 0.1% |
| American | 1,146 | 6.2% |
| Apache | 8 | 0.0% |
| Arab | 1 | 0.0% |
| Austrian | 31 | 0.2% |
| Bahamian | 11 | 0.1% |
| Bhutanese | 77 | 0.4% |
| British | 53 | 0.3% |
| Burmese | 241 | 1.3% |
| Canadian | 27 | 0.2% |
| Central American | 66 | 0.4% |
| Cherokee | 33 | 0.2% |
| Chippewa | 6 | 0.0% |
| Colombian | 419 | 2.2% |
| Comanche | 8 | 0.0% |
| Croatian | 22 | 0.1% |
| Cuban | 9 | 0.1% |
| Czech | 31 | 0.2% |
| Danish | 45 | 0.2% |
| Dutch | 219 | 1.2% |
| Ecuadorian | 16 | 0.1% |
| English | 2,320 | 12.5% |
| European | 580 | 3.1% |
| French | 406 | 2.2% |
| French Canadian | 51 | 0.3% |
| German | 3,433 | 18.5% |
| Greek | 259 | 1.4% |
| Guatemalan | 11 | 0.1% |
| Honduran | 55 | 0.3% |
| Hungarian | 23 | 0.1% |
| Indian (Asian) | 78 | 0.4% |
| Iranian | 29 | 0.2% |
| Irish | 1,776 | 9.6% |
| Italian | 874 | 4.7% |
| Jamaican | 19 | 0.1% |
| Korean | 107 | 0.6% |
| Lebanese | 1 | 0.0% |
| Lithuanian | 19 | 0.1% |
| Lumbee | 18 | 0.1% |
| Mexican | 133 | 0.7% |
| Norwegian | 84 | 0.4% |
| Peruvian | 21 | 0.1% |
| Polish | 1,340 | 7.2% |
| Portuguese | 44 | 0.2% |
| Puerto Rican | 235 | 1.3% |
| Romanian | 78 | 0.4% |
| Russian | 56 | 0.3% |
| Scandinavian | 24 | 0.1% |
| Scotch-Irish | 404 | 2.2% |
| Scottish | 490 | 2.6% |
| Serbian | 15 | 0.1% |
| Slovak | 47 | 0.3% |
| South American | 731 | 3.9% |
| Spaniard | 1 | 0.0% |
| Spanish | 26 | 0.1% |
| Sri Lankan | 143 | 0.8% |
| Subsaharan African | 17 | 0.1% |
| Swedish | 284 | 1.5% |
| Thai | 585 | 3.2% |
| Ukrainian | 146 | 0.8% |
| Uruguayan | 166 | 0.9% |
| Venezuelan | 109 | 0.6% |
| Welsh | 285 | 1.5% | View All 63 Rows |
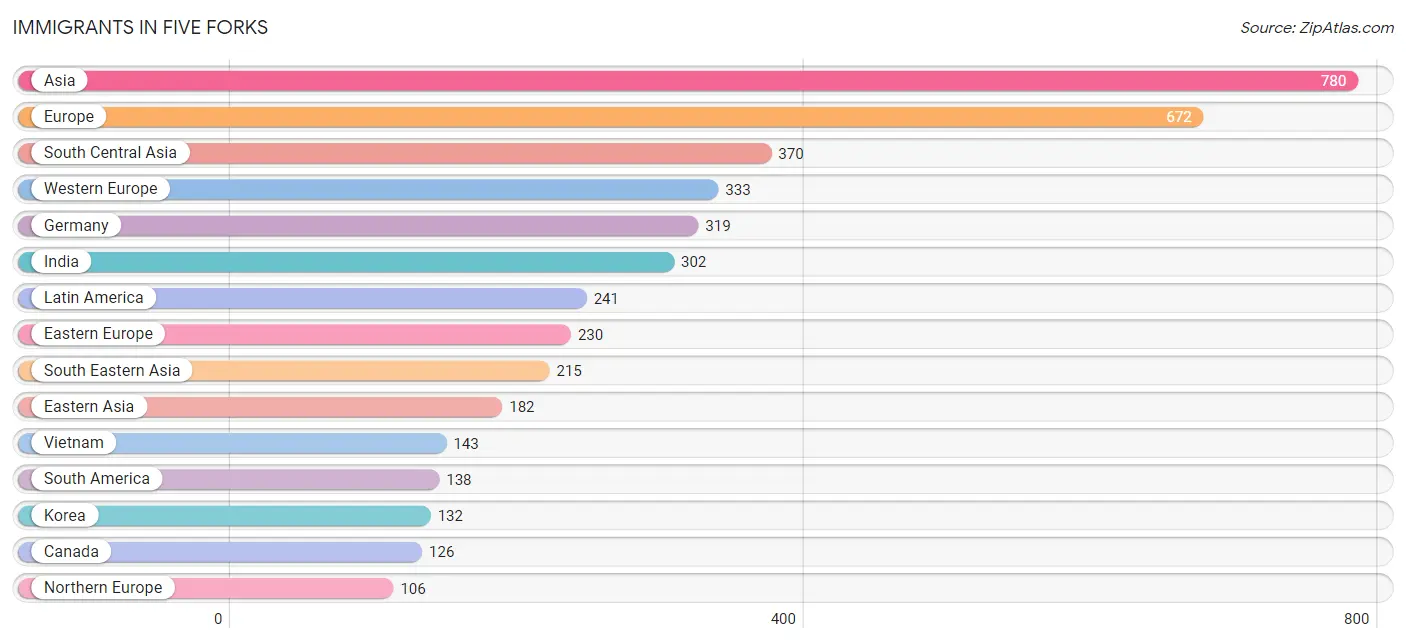
Immigrants in Five Forks
The most numerous immigrant groups reported in Five Forks came from Asia (780 | 4.2%), Europe (672 | 3.6%), South Central Asia (370 | 2.0%), Western Europe (333 | 1.8%), and Germany (319 | 1.7%), together accounting for 13.3% of all Five Forks residents.
| Immigration Origin | # Population | % Population |
| Africa | 38 | 0.2% |
| Asia | 780 | 4.2% |
| Australia | 15 | 0.1% |
| Canada | 126 | 0.7% |
| Caribbean | 9 | 0.1% |
| Central America | 94 | 0.5% |
| China | 50 | 0.3% |
| Colombia | 97 | 0.5% |
| Cuba | 9 | 0.1% |
| Denmark | 16 | 0.1% |
| Eastern Africa | 38 | 0.2% |
| Eastern Asia | 182 | 1.0% |
| Eastern Europe | 230 | 1.2% |
| Ecuador | 16 | 0.1% |
| England | 68 | 0.4% |
| Europe | 672 | 3.6% |
| France | 14 | 0.1% |
| Germany | 319 | 1.7% |
| Guatemala | 11 | 0.1% |
| India | 302 | 1.6% |
| Iran | 16 | 0.1% |
| Italy | 3 | 0.0% |
| Korea | 132 | 0.7% |
| Latin America | 241 | 1.3% |
| Mexico | 83 | 0.4% |
| Northern Europe | 106 | 0.6% |
| Oceania | 15 | 0.1% |
| Pakistan | 52 | 0.3% |
| Peru | 12 | 0.1% |
| Philippines | 72 | 0.4% |
| Poland | 11 | 0.1% |
| Romania | 82 | 0.4% |
| Russia | 33 | 0.2% |
| South America | 138 | 0.7% |
| South Central Asia | 370 | 2.0% |
| South Eastern Asia | 215 | 1.2% |
| Southern Europe | 3 | 0.0% |
| Sweden | 10 | 0.1% |
| Ukraine | 104 | 0.6% |
| Venezuela | 13 | 0.1% |
| Vietnam | 143 | 0.8% |
| Western Asia | 6 | 0.0% |
| Western Europe | 333 | 1.8% | View All 43 Rows |
Sex and Age in Five Forks
Sex and Age in Five Forks
The most populous age groups in Five Forks are 10 to 14 Years (1,137 | 11.8%) for men and 50 to 54 Years (895 | 10.0%) for women.
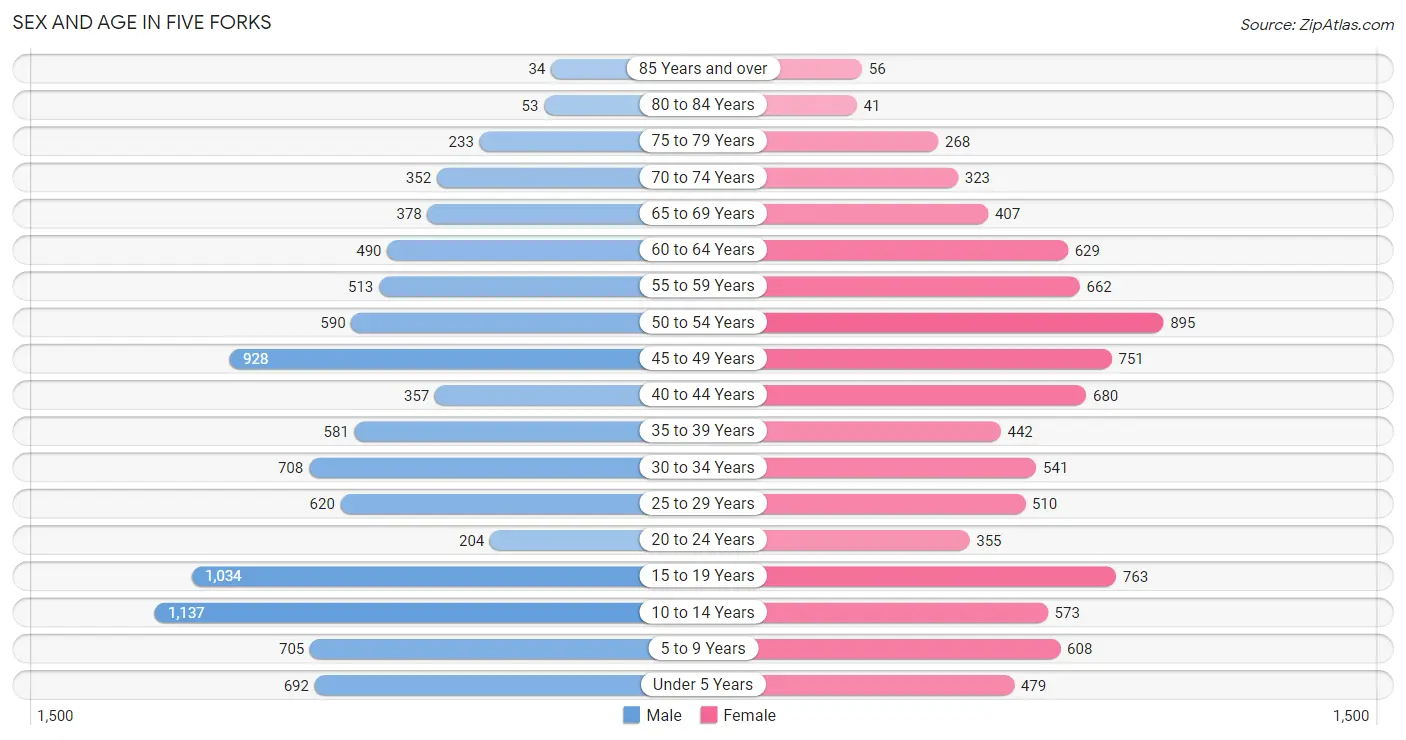
| Age Bracket | Male | Female |
| Under 5 Years | 692 (7.2%) | 479 (5.3%) |
| 5 to 9 Years | 705 (7.3%) | 608 (6.8%) |
| 10 to 14 Years | 1,137 (11.8%) | 573 (6.4%) |
| 15 to 19 Years | 1,034 (10.8%) | 763 (8.5%) |
| 20 to 24 Years | 204 (2.1%) | 355 (4.0%) |
| 25 to 29 Years | 620 (6.5%) | 510 (5.7%) |
| 30 to 34 Years | 708 (7.4%) | 541 (6.0%) |
| 35 to 39 Years | 581 (6.0%) | 442 (4.9%) |
| 40 to 44 Years | 357 (3.7%) | 680 (7.6%) |
| 45 to 49 Years | 928 (9.7%) | 751 (8.4%) |
| 50 to 54 Years | 590 (6.1%) | 895 (10.0%) |
| 55 to 59 Years | 513 (5.3%) | 662 (7.4%) |
| 60 to 64 Years | 490 (5.1%) | 629 (7.0%) |
| 65 to 69 Years | 378 (3.9%) | 407 (4.5%) |
| 70 to 74 Years | 352 (3.7%) | 323 (3.6%) |
| 75 to 79 Years | 233 (2.4%) | 268 (3.0%) |
| 80 to 84 Years | 53 (0.5%) | 41 (0.5%) |
| 85 Years and over | 34 (0.4%) | 56 (0.6%) |
| Total | 9,609 (100.0%) | 8,983 (100.0%) |
Families and Households in Five Forks
Median Family Size in Five Forks
The median family size in Five Forks is 3.33 persons per family, with married-couple families (4,553 | 87.5%) accounting for the largest median family size of 3.41 persons per family. On the other hand, single male/father families (198 | 3.8%) represent the smallest median family size with 2.42 persons per family.
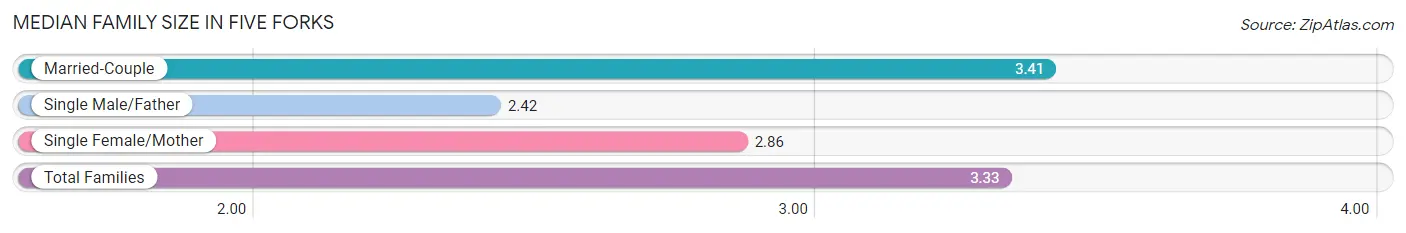
| Family Type | # Families | Family Size |
| Married-Couple | 4,553 (87.5%) | 3.41 |
| Single Male/Father | 198 (3.8%) | 2.42 |
| Single Female/Mother | 454 (8.7%) | 2.86 |
| Total Families | 5,205 (100.0%) | 3.33 |
Median Household Size in Five Forks
The median household size in Five Forks is 3.00 persons per household, with married-couple households (4,553 | 73.5%) accounting for the largest median household size of 3.42 persons per household. non-family households (987 | 15.9%) represent the smallest median household size with 1.10 persons per household.
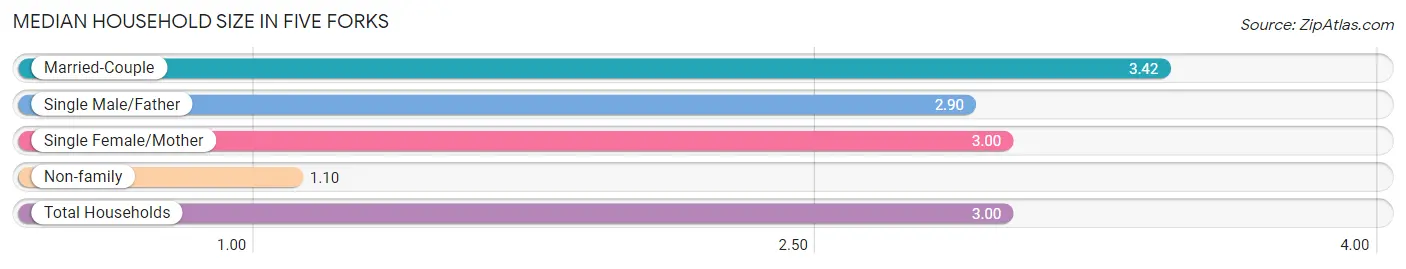
| Household Type | # Households | Household Size |
| Married-Couple | 4,553 (73.5%) | 3.42 |
| Single Male/Father | 198 (3.2%) | 2.90 |
| Single Female/Mother | 454 (7.3%) | 3.00 |
| Non-family | 987 (15.9%) | 1.10 |
| Total Households | 6,192 (100.0%) | 3.00 |
Household Size by Marriage Status in Five Forks
Out of a total of 6,192 households in Five Forks, 5,205 (84.1%) are family households, while 987 (15.9%) are nonfamily households. The most numerous type of family households are 4-person households, comprising 1,746, and the most common type of nonfamily households are 1-person households, comprising 876.
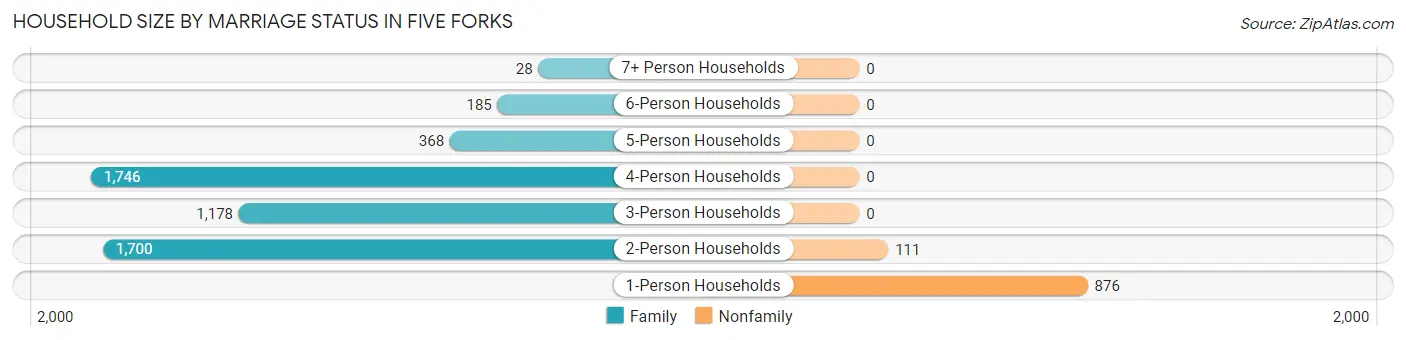
| Household Size | Family Households | Nonfamily Households |
| 1-Person Households | - | 876 (14.1%) |
| 2-Person Households | 1,700 (27.5%) | 111 (1.8%) |
| 3-Person Households | 1,178 (19.0%) | 0 (0.0%) |
| 4-Person Households | 1,746 (28.2%) | 0 (0.0%) |
| 5-Person Households | 368 (5.9%) | 0 (0.0%) |
| 6-Person Households | 185 (3.0%) | 0 (0.0%) |
| 7+ Person Households | 28 (0.4%) | 0 (0.0%) |
| Total | 5,205 (84.1%) | 987 (15.9%) |
Female Fertility in Five Forks
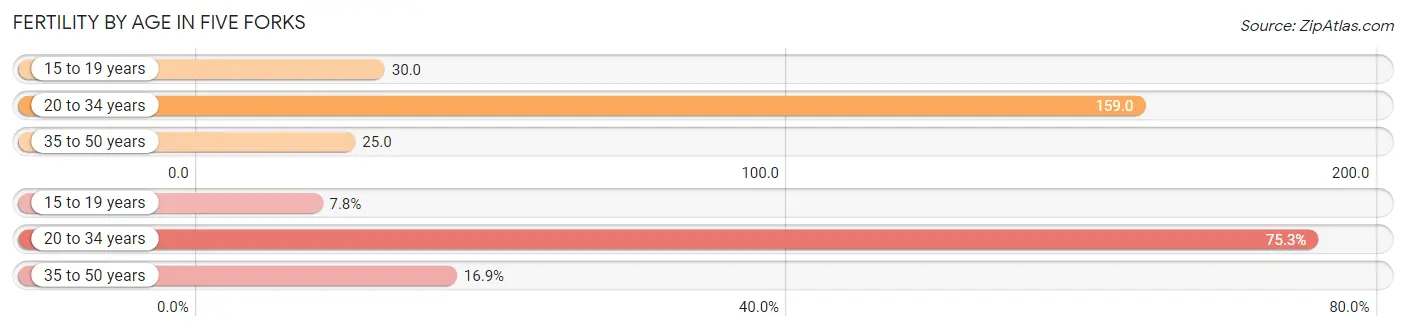
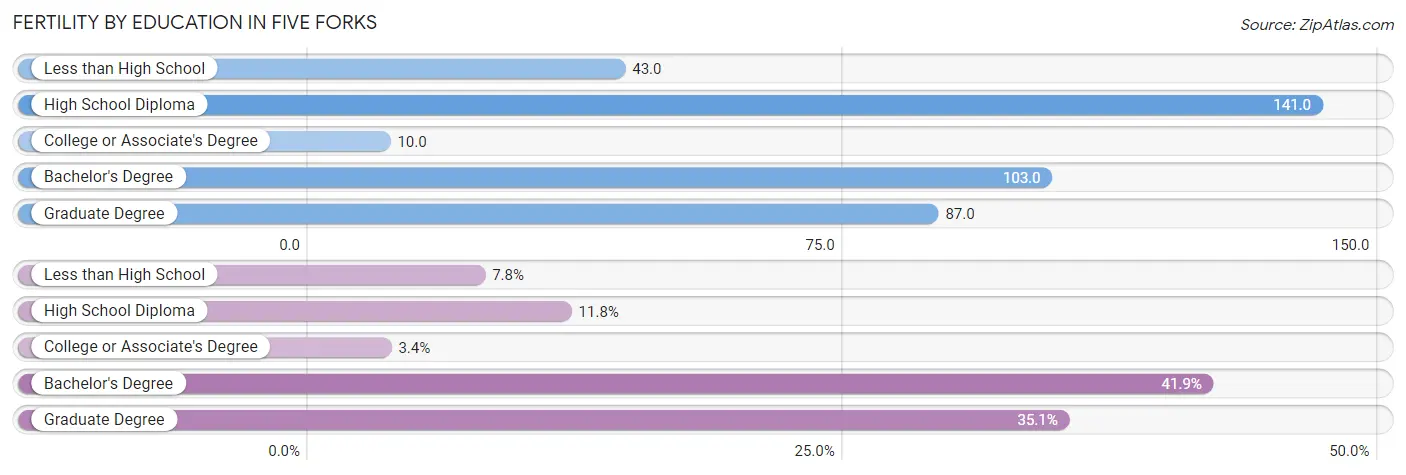
Fertility by Age in Five Forks
Average fertility rate in Five Forks is 71.0 births per 1,000 women. Women in the age bracket of 20 to 34 years have the highest fertility rate with 159.0 births per 1,000 women. Women in the age bracket of 20 to 34 years acount for 75.3% of all women with births.
| Age Bracket | Women with Births | Births / 1,000 Women |
| 15 to 19 years | 23 (7.8%) | 30.0 |
| 20 to 34 years | 223 (75.3%) | 159.0 |
| 35 to 50 years | 50 (16.9%) | 25.0 |
| Total | 296 (100.0%) | 71.0 |
Fertility by Age by Marriage Status in Five Forks
91.6% of women with births (296) in Five Forks are married. The highest percentage of unmarried women with births falls into 15 to 19 years age bracket with 100.0% of them unmarried at the time of birth, while the lowest percentage of unmarried women with births belong to 35 to 50 years age bracket with 0.0% of them unmarried.
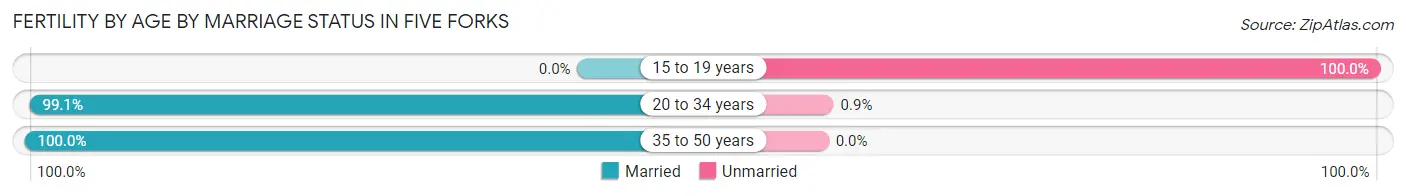
| Age Bracket | Married | Unmarried |
| 15 to 19 years | 0 (0.0%) | 23 (100.0%) |
| 20 to 34 years | 221 (99.1%) | 2 (0.9%) |
| 35 to 50 years | 50 (100.0%) | 0 (0.0%) |
| Total | 271 (91.5%) | 25 (8.5%) |
Fertility by Education in Five Forks
Average fertility rate in Five Forks is 71.0 births per 1,000 women. Women with the education attainment of high school diploma have the highest fertility rate of 141.0 births per 1,000 women, while women with the education attainment of college or associate's degree have the lowest fertility at 10.0 births per 1,000 women. Women with the education attainment of bachelor's degree represent 41.9% of all women with births.
| Educational Attainment | Women with Births | Births / 1,000 Women |
| Less than High School | 23 (7.8%) | 43.0 |
| High School Diploma | 35 (11.8%) | 141.0 |
| College or Associate's Degree | 10 (3.4%) | 10.0 |
| Bachelor's Degree | 124 (41.9%) | 103.0 |
| Graduate Degree | 104 (35.1%) | 87.0 |
| Total | 296 (100.0%) | 71.0 |
Fertility by Education by Marriage Status in Five Forks
8.5% of women with births in Five Forks are unmarried. Women with the educational attainment of high school diploma are most likely to be married with 100.0% of them married at childbirth, while women with the educational attainment of less than high school are least likely to be married with 100.0% of them unmarried at childbirth.
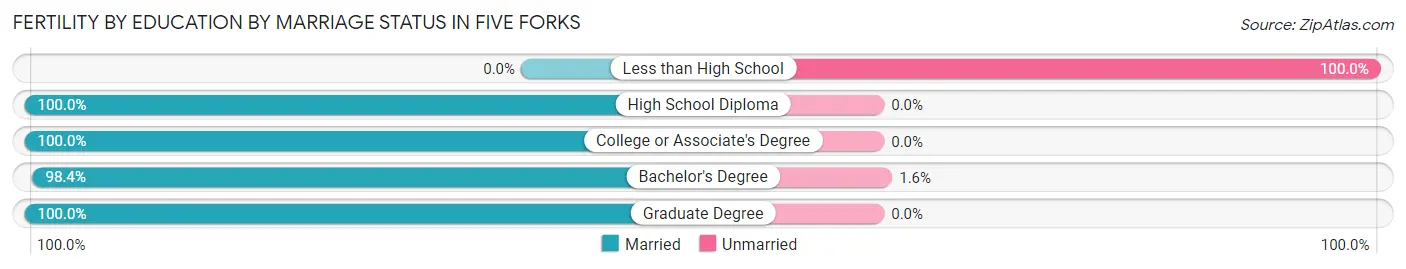
| Educational Attainment | Married | Unmarried |
| Less than High School | 0 (0.0%) | 23 (100.0%) |
| High School Diploma | 35 (100.0%) | 0 (0.0%) |
| College or Associate's Degree | 10 (100.0%) | 0 (0.0%) |
| Bachelor's Degree | 122 (98.4%) | 2 (1.6%) |
| Graduate Degree | 104 (100.0%) | 0 (0.0%) |
| Total | 271 (91.5%) | 25 (8.5%) |
Employment Characteristics in Five Forks
Employment by Class of Employer in Five Forks
Among the 8,308 employed individuals in Five Forks, private company employees (6,001 | 72.2%), self-employed (not incorporated) (647 | 7.8%), and self-employed (incorporated) (569 | 6.9%) make up the most common classes of employment.
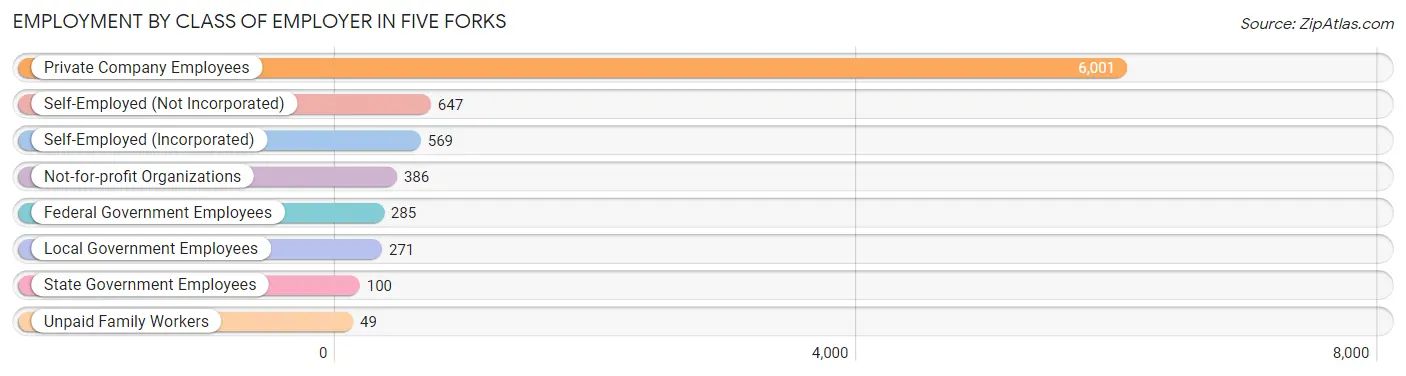
| Employer Class | # Employees | % Employees |
| Private Company Employees | 6,001 | 72.2% |
| Self-Employed (Incorporated) | 569 | 6.9% |
| Self-Employed (Not Incorporated) | 647 | 7.8% |
| Not-for-profit Organizations | 386 | 4.6% |
| Local Government Employees | 271 | 3.3% |
| State Government Employees | 100 | 1.2% |
| Federal Government Employees | 285 | 3.4% |
| Unpaid Family Workers | 49 | 0.6% |
| Total | 8,308 | 100.0% |
Employment Status by Age in Five Forks
According to the labor force statistics for Five Forks, out of the total population over 16 years of age (13,886), 64.7% or 8,984 individuals are in the labor force, with 3.5% or 314 of them unemployed. The age group with the highest labor force participation rate is 20 to 24 years, with 87.1% or 487 individuals in the labor force. Within the labor force, the 20 to 24 years age range has the highest percentage of unemployed individuals, with 21.8% or 106 of them being unemployed.
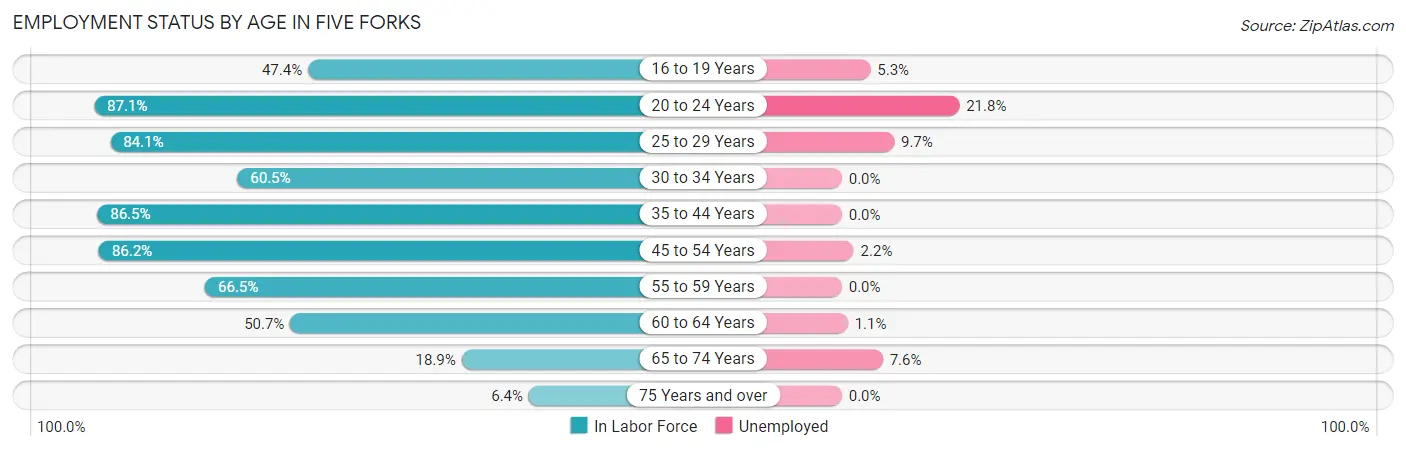
| Age Bracket | In Labor Force | Unemployed |
| 16 to 19 Years | 609 (47.4%) | 32 (5.3%) |
| 20 to 24 Years | 487 (87.1%) | 106 (21.8%) |
| 25 to 29 Years | 950 (84.1%) | 92 (9.7%) |
| 30 to 34 Years | 756 (60.5%) | 0 (0.0%) |
| 35 to 44 Years | 1,782 (86.5%) | 0 (0.0%) |
| 45 to 54 Years | 2,727 (86.2%) | 60 (2.2%) |
| 55 to 59 Years | 781 (66.5%) | 0 (0.0%) |
| 60 to 64 Years | 567 (50.7%) | 6 (1.1%) |
| 65 to 74 Years | 276 (18.9%) | 21 (7.6%) |
| 75 Years and over | 44 (6.4%) | 0 (0.0%) |
| Total | 8,984 (64.7%) | 314 (3.5%) |
Employment Status by Educational Attainment in Five Forks
According to labor force statistics for Five Forks, 76.4% of individuals (7,561) out of the total population between 25 and 64 years of age (9,897) are in the labor force, with 2.1% or 159 of them being unemployed. The group with the highest labor force participation rate are those with the educational attainment of bachelor's degree or higher, with 79.9% or 5,266 individuals in the labor force. Within the labor force, individuals with college / associate degree education have the highest percentage of unemployment, with 8.2% or 117 of them being unemployed.
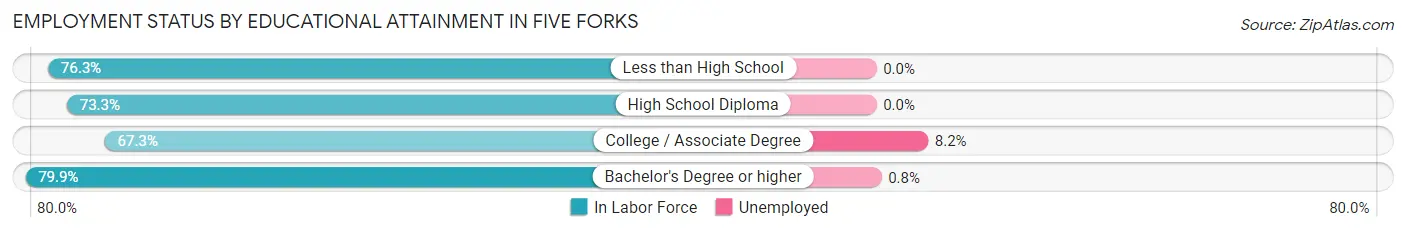
| Educational Attainment | In Labor Force | Unemployed |
| Less than High School | 122 (76.3%) | 0 (0.0%) |
| High School Diploma | 746 (73.3%) | 0 (0.0%) |
| College / Associate Degree | 1,432 (67.3%) | 174 (8.2%) |
| Bachelor's Degree or higher | 5,266 (79.9%) | 53 (0.8%) |
| Total | 7,561 (76.4%) | 208 (2.1%) |
Employment Occupations by Sex in Five Forks
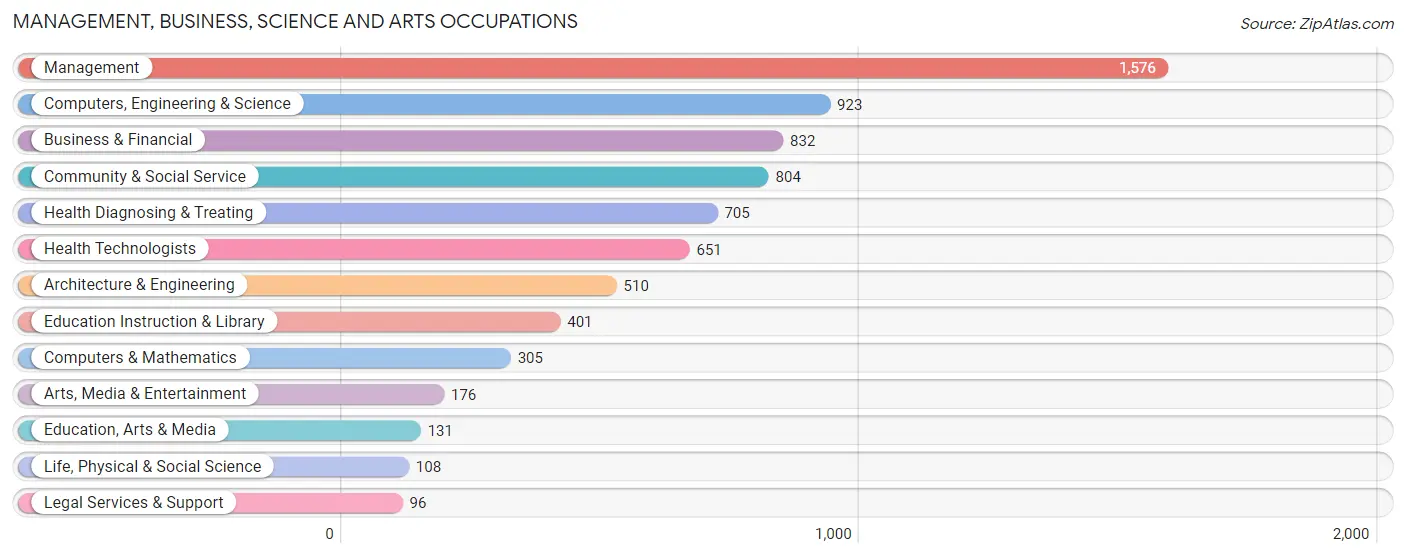
Management, Business, Science and Arts Occupations
The most common Management, Business, Science and Arts occupations in Five Forks are Management (1,576 | 18.2%), Computers, Engineering & Science (923 | 10.7%), Business & Financial (832 | 9.6%), Community & Social Service (804 | 9.3%), and Health Diagnosing & Treating (705 | 8.2%).
Management, Business, Science and Arts Occupations by Sex
Within the Management, Business, Science and Arts occupations in Five Forks, the most male-oriented occupations are Architecture & Engineering (90.6%), Computers, Engineering & Science (79.7%), and Computers & Mathematics (71.5%), while the most female-oriented occupations are Legal Services & Support (100.0%), Education Instruction & Library (84.0%), and Community & Social Service (77.6%).
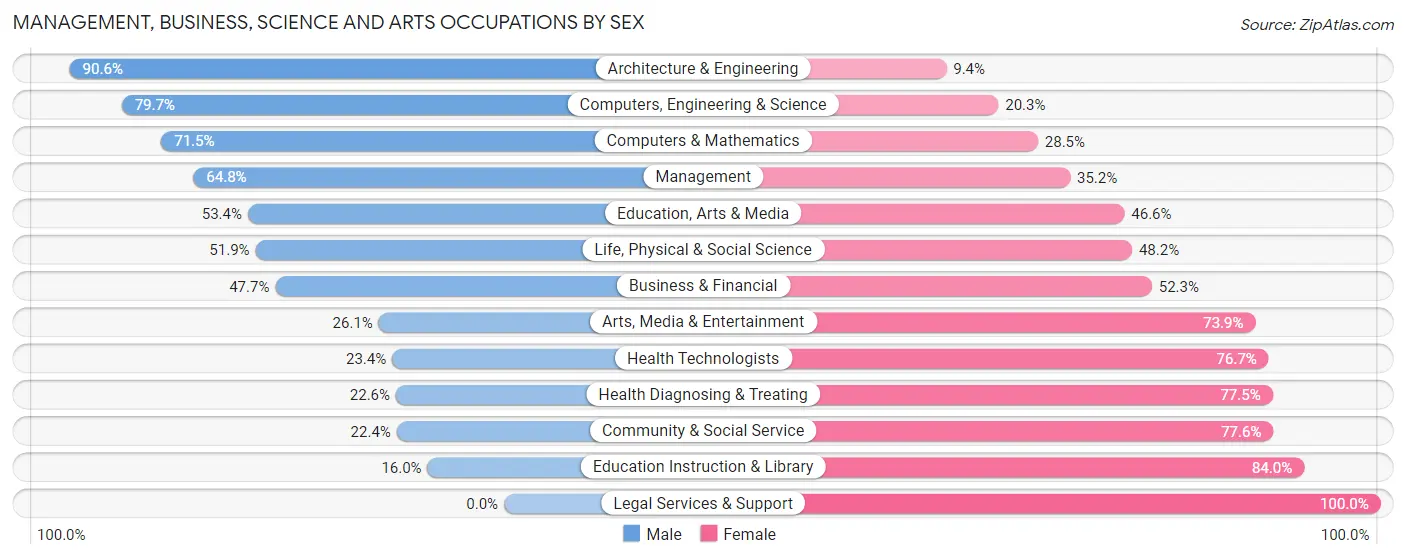
| Occupation | Male | Female |
| Management | 1,021 (64.8%) | 555 (35.2%) |
| Business & Financial | 397 (47.7%) | 435 (52.3%) |
| Computers, Engineering & Science | 736 (79.7%) | 187 (20.3%) |
| Computers & Mathematics | 218 (71.5%) | 87 (28.5%) |
| Architecture & Engineering | 462 (90.6%) | 48 (9.4%) |
| Life, Physical & Social Science | 56 (51.8%) | 52 (48.1%) |
| Community & Social Service | 180 (22.4%) | 624 (77.6%) |
| Education, Arts & Media | 70 (53.4%) | 61 (46.6%) |
| Legal Services & Support | 0 (0.0%) | 96 (100.0%) |
| Education Instruction & Library | 64 (16.0%) | 337 (84.0%) |
| Arts, Media & Entertainment | 46 (26.1%) | 130 (73.9%) |
| Health Diagnosing & Treating | 159 (22.6%) | 546 (77.4%) |
| Health Technologists | 152 (23.4%) | 499 (76.6%) |
| Total (Category) | 2,493 (51.5%) | 2,347 (48.5%) |
| Total (Overall) | 4,765 (55.1%) | 3,879 (44.9%) |
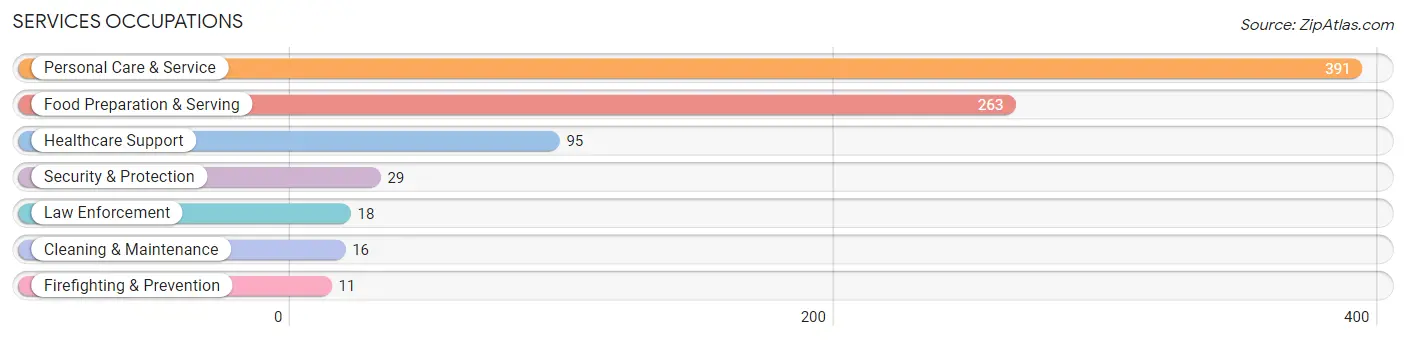
Services Occupations
The most common Services occupations in Five Forks are Personal Care & Service (391 | 4.5%), Food Preparation & Serving (263 | 3.0%), Healthcare Support (95 | 1.1%), Security & Protection (29 | 0.3%), and Law Enforcement (18 | 0.2%).
Services Occupations by Sex
Within the Services occupations in Five Forks, the most male-oriented occupations are Security & Protection (100.0%), Firefighting & Prevention (100.0%), and Law Enforcement (100.0%), while the most female-oriented occupations are Healthcare Support (86.3%), Personal Care & Service (51.7%), and Food Preparation & Serving (43.0%).
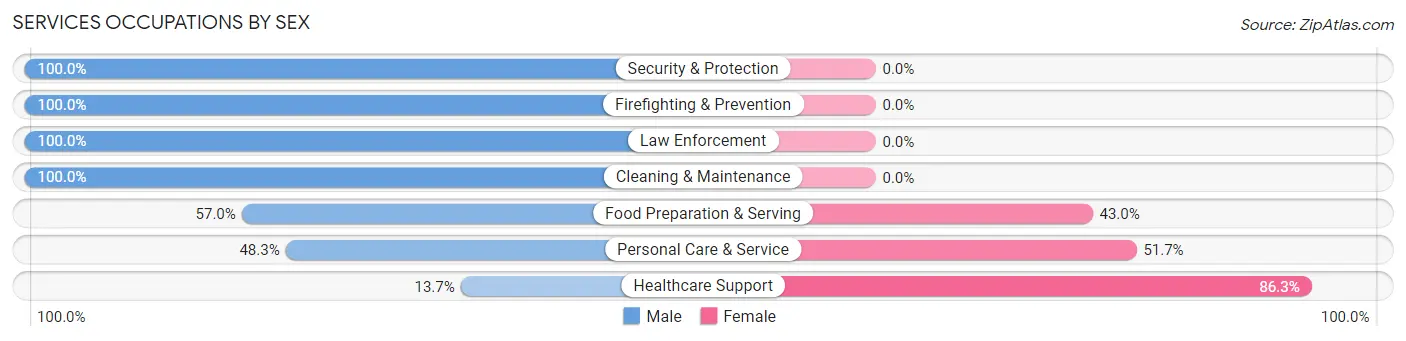
| Occupation | Male | Female |
| Healthcare Support | 13 (13.7%) | 82 (86.3%) |
| Security & Protection | 29 (100.0%) | 0 (0.0%) |
| Firefighting & Prevention | 11 (100.0%) | 0 (0.0%) |
| Law Enforcement | 18 (100.0%) | 0 (0.0%) |
| Food Preparation & Serving | 150 (57.0%) | 113 (43.0%) |
| Cleaning & Maintenance | 16 (100.0%) | 0 (0.0%) |
| Personal Care & Service | 189 (48.3%) | 202 (51.7%) |
| Total (Category) | 397 (50.0%) | 397 (50.0%) |
| Total (Overall) | 4,765 (55.1%) | 3,879 (44.9%) |
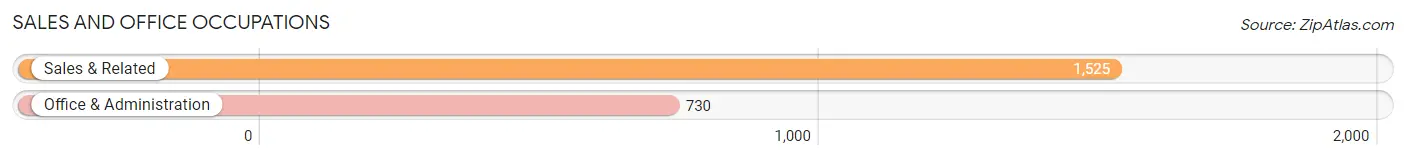
Sales and Office Occupations
The most common Sales and Office occupations in Five Forks are Sales & Related (1,525 | 17.6%), and Office & Administration (730 | 8.5%).
Sales and Office Occupations by Sex
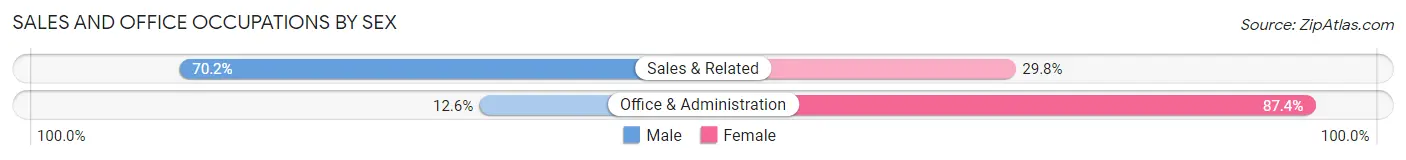
| Occupation | Male | Female |
| Sales & Related | 1,071 (70.2%) | 454 (29.8%) |
| Office & Administration | 92 (12.6%) | 638 (87.4%) |
| Total (Category) | 1,163 (51.6%) | 1,092 (48.4%) |
| Total (Overall) | 4,765 (55.1%) | 3,879 (44.9%) |
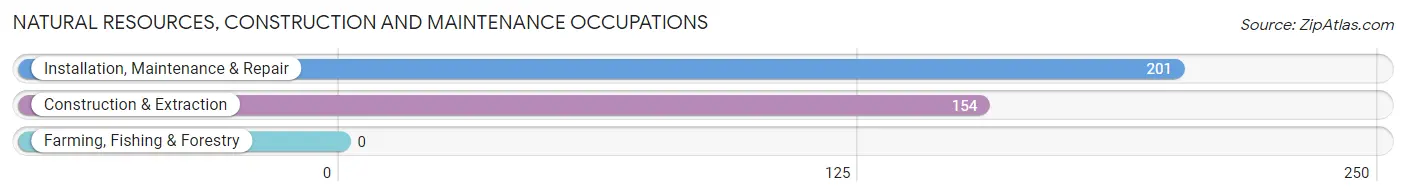
Natural Resources, Construction and Maintenance Occupations
The most common Natural Resources, Construction and Maintenance occupations in Five Forks are Installation, Maintenance & Repair (201 | 2.3%), and Construction & Extraction (154 | 1.8%).
Natural Resources, Construction and Maintenance Occupations by Sex
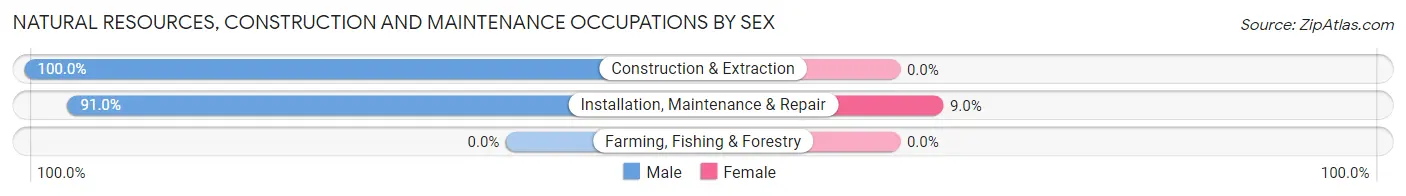
| Occupation | Male | Female |
| Farming, Fishing & Forestry | 0 (0.0%) | 0 (0.0%) |
| Construction & Extraction | 154 (100.0%) | 0 (0.0%) |
| Installation, Maintenance & Repair | 183 (91.0%) | 18 (9.0%) |
| Total (Category) | 337 (94.9%) | 18 (5.1%) |
| Total (Overall) | 4,765 (55.1%) | 3,879 (44.9%) |
Production, Transportation and Moving Occupations
The most common Production, Transportation and Moving occupations in Five Forks are Material Moving (146 | 1.7%), Production (141 | 1.6%), and Transportation (113 | 1.3%).
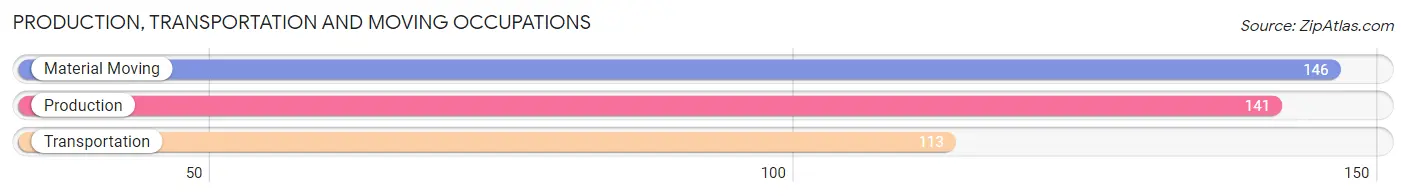
Production, Transportation and Moving Occupations by Sex
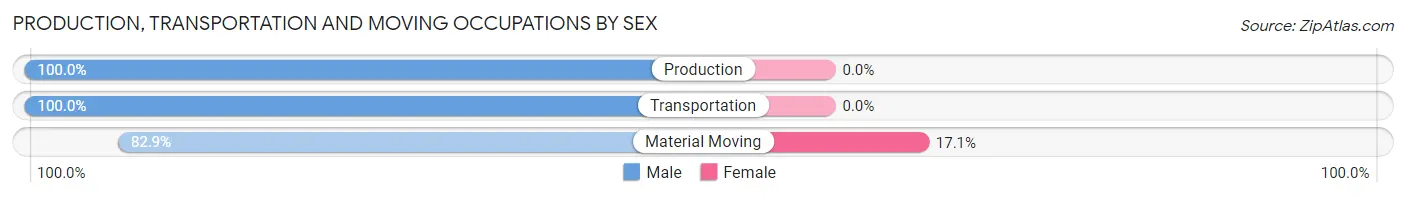
| Occupation | Male | Female |
| Production | 141 (100.0%) | 0 (0.0%) |
| Transportation | 113 (100.0%) | 0 (0.0%) |
| Material Moving | 121 (82.9%) | 25 (17.1%) |
| Total (Category) | 375 (93.8%) | 25 (6.2%) |
| Total (Overall) | 4,765 (55.1%) | 3,879 (44.9%) |
Employment Industries by Sex in Five Forks
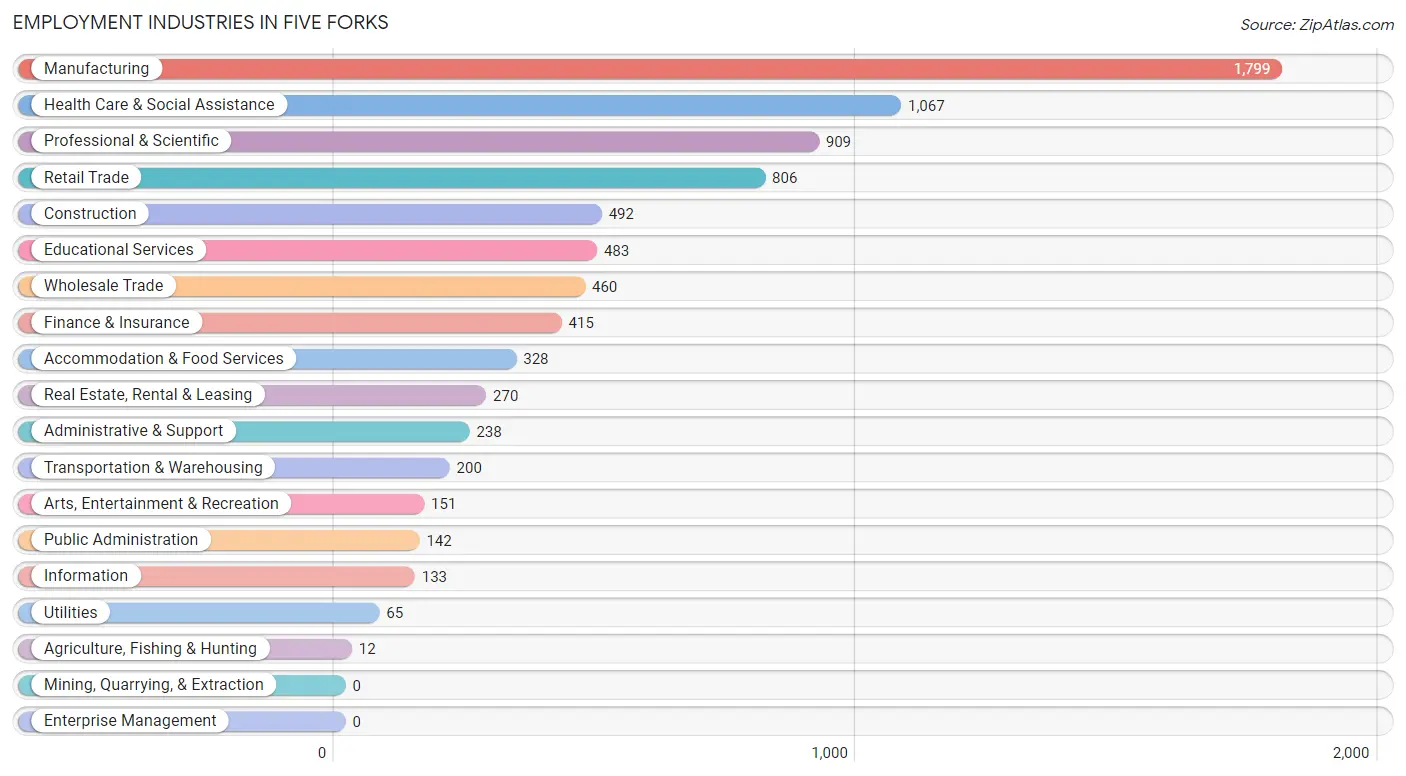
Employment Industries in Five Forks
The major employment industries in Five Forks include Manufacturing (1,799 | 20.8%), Health Care & Social Assistance (1,067 | 12.3%), Professional & Scientific (909 | 10.5%), Retail Trade (806 | 9.3%), and Construction (492 | 5.7%).
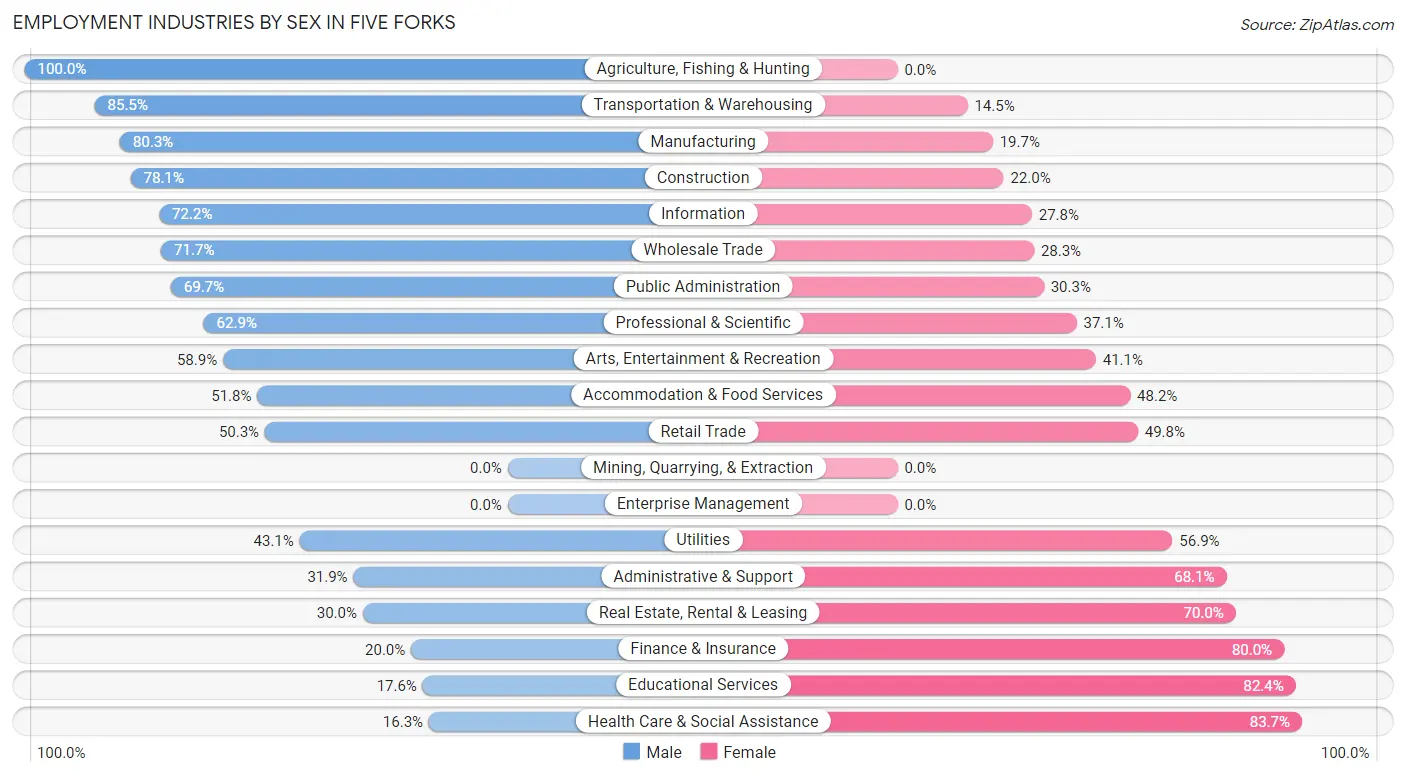
Employment Industries by Sex in Five Forks
The Five Forks industries that see more men than women are Agriculture, Fishing & Hunting (100.0%), Transportation & Warehousing (85.5%), and Manufacturing (80.3%), whereas the industries that tend to have a higher number of women are Health Care & Social Assistance (83.7%), Educational Services (82.4%), and Finance & Insurance (80.0%).
| Industry | Male | Female |
| Agriculture, Fishing & Hunting | 12 (100.0%) | 0 (0.0%) |
| Mining, Quarrying, & Extraction | 0 (0.0%) | 0 (0.0%) |
| Construction | 384 (78.0%) | 108 (22.0%) |
| Manufacturing | 1,444 (80.3%) | 355 (19.7%) |
| Wholesale Trade | 330 (71.7%) | 130 (28.3%) |
| Retail Trade | 405 (50.2%) | 401 (49.7%) |
| Transportation & Warehousing | 171 (85.5%) | 29 (14.5%) |
| Utilities | 28 (43.1%) | 37 (56.9%) |
| Information | 96 (72.2%) | 37 (27.8%) |
| Finance & Insurance | 83 (20.0%) | 332 (80.0%) |
| Real Estate, Rental & Leasing | 81 (30.0%) | 189 (70.0%) |
| Professional & Scientific | 572 (62.9%) | 337 (37.1%) |
| Enterprise Management | 0 (0.0%) | 0 (0.0%) |
| Administrative & Support | 76 (31.9%) | 162 (68.1%) |
| Educational Services | 85 (17.6%) | 398 (82.4%) |
| Health Care & Social Assistance | 174 (16.3%) | 893 (83.7%) |
| Arts, Entertainment & Recreation | 89 (58.9%) | 62 (41.1%) |
| Accommodation & Food Services | 170 (51.8%) | 158 (48.2%) |
| Public Administration | 99 (69.7%) | 43 (30.3%) |
| Total | 4,765 (55.1%) | 3,879 (44.9%) |
Education in Five Forks
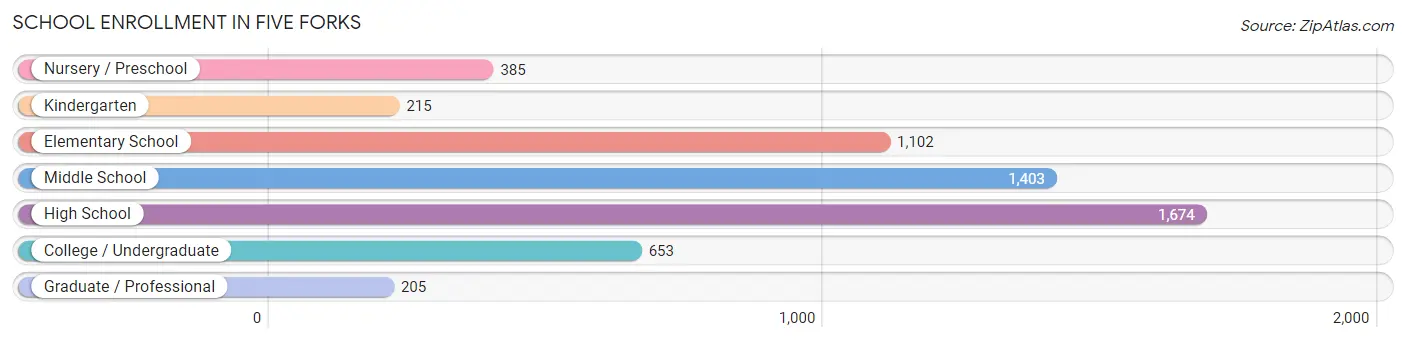
School Enrollment in Five Forks
The most common levels of schooling among the 5,637 students in Five Forks are high school (1,674 | 29.7%), middle school (1,403 | 24.9%), and elementary school (1,102 | 19.6%).
| School Level | # Students | % Students |
| Nursery / Preschool | 385 | 6.8% |
| Kindergarten | 215 | 3.8% |
| Elementary School | 1,102 | 19.6% |
| Middle School | 1,403 | 24.9% |
| High School | 1,674 | 29.7% |
| College / Undergraduate | 653 | 11.6% |
| Graduate / Professional | 205 | 3.6% |
| Total | 5,637 | 100.0% |
School Enrollment by Age by Funding Source in Five Forks
Out of a total of 5,637 students who are enrolled in schools in Five Forks, 947 (16.8%) attend a private institution, while the remaining 4,690 (83.2%) are enrolled in public schools. The age group of 3 to 4 year olds has the highest likelihood of being enrolled in private schools, with 193 (77.2% in the age bracket) enrolled. Conversely, the age group of 25 to 34 year olds has the lowest likelihood of being enrolled in a private school, with 107 (100.0% in the age bracket) attending a public institution.
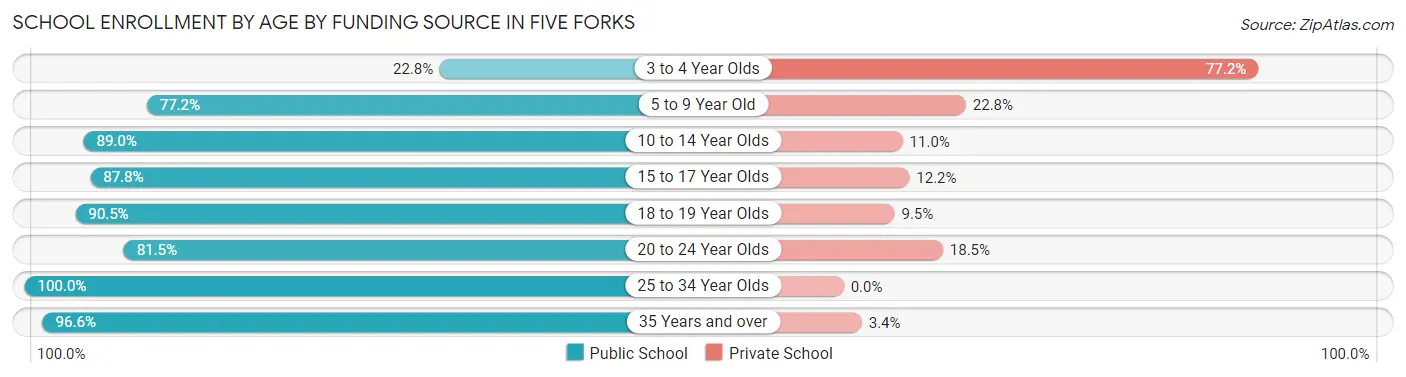
| Age Bracket | Public School | Private School |
| 3 to 4 Year Olds | 57 (22.8%) | 193 (77.2%) |
| 5 to 9 Year Old | 1,008 (77.2%) | 297 (22.8%) |
| 10 to 14 Year Olds | 1,522 (89.0%) | 188 (11.0%) |
| 15 to 17 Year Olds | 1,204 (87.8%) | 168 (12.2%) |
| 18 to 19 Year Olds | 373 (90.5%) | 39 (9.5%) |
| 20 to 24 Year Olds | 247 (81.5%) | 56 (18.5%) |
| 25 to 34 Year Olds | 107 (100.0%) | 0 (0.0%) |
| 35 Years and over | 172 (96.6%) | 6 (3.4%) |
| Total | 4,690 (83.2%) | 947 (16.8%) |
Educational Attainment by Field of Study in Five Forks
Business (1,898 | 23.3%), engineering (1,364 | 16.8%), science & technology (888 | 10.9%), psychology (704 | 8.6%), and education (653 | 8.0%) are the most common fields of study among 8,137 individuals in Five Forks who have obtained a bachelor's degree or higher.
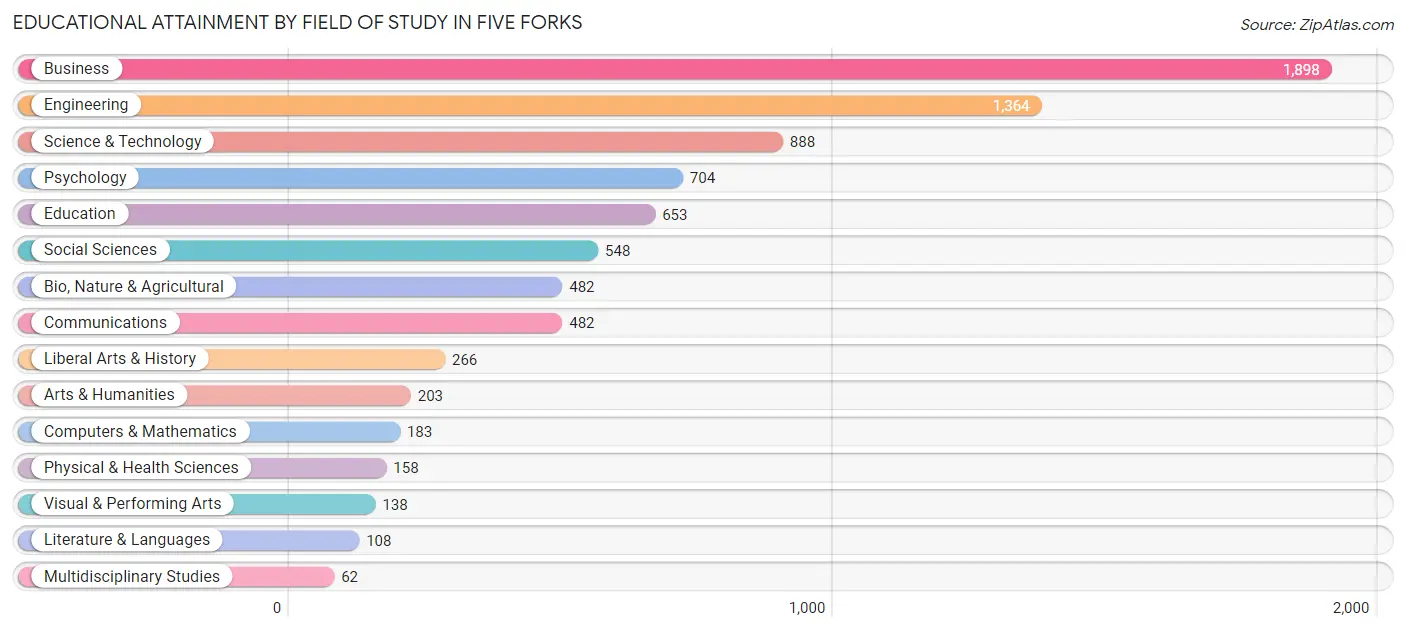
| Field of Study | # Graduates | % Graduates |
| Computers & Mathematics | 183 | 2.2% |
| Bio, Nature & Agricultural | 482 | 5.9% |
| Physical & Health Sciences | 158 | 1.9% |
| Psychology | 704 | 8.6% |
| Social Sciences | 548 | 6.7% |
| Engineering | 1,364 | 16.8% |
| Multidisciplinary Studies | 62 | 0.8% |
| Science & Technology | 888 | 10.9% |
| Business | 1,898 | 23.3% |
| Education | 653 | 8.0% |
| Literature & Languages | 108 | 1.3% |
| Liberal Arts & History | 266 | 3.3% |
| Visual & Performing Arts | 138 | 1.7% |
| Communications | 482 | 5.9% |
| Arts & Humanities | 203 | 2.5% |
| Total | 8,137 | 100.0% |
Transportation & Commute in Five Forks
Vehicle Availability by Sex in Five Forks
The most prevalent vehicle ownership categories in Five Forks are males with 2 vehicles (2,410, accounting for 53.4%) and females with 2 vehicles (1,723, making up 63.5%).
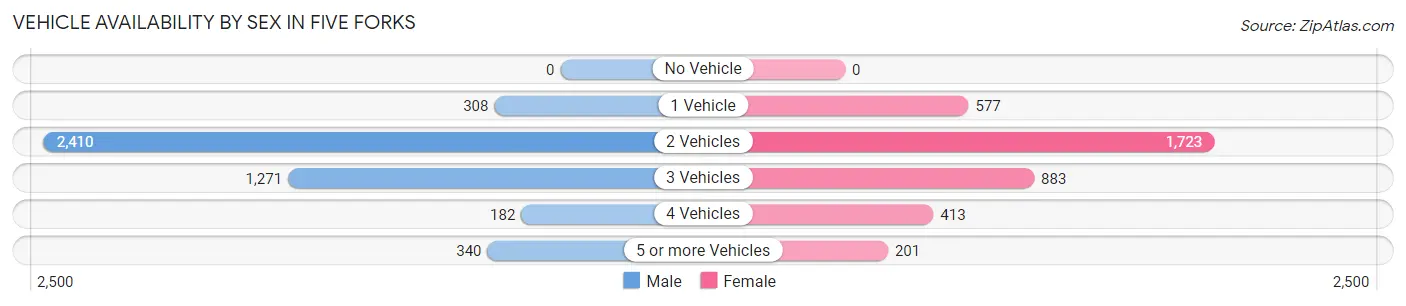
| Vehicles Available | Male | Female |
| No Vehicle | 0 (0.0%) | 0 (0.0%) |
| 1 Vehicle | 308 (6.8%) | 577 (15.2%) |
| 2 Vehicles | 2,410 (53.4%) | 1,723 (45.4%) |
| 3 Vehicles | 1,271 (28.2%) | 883 (23.3%) |
| 4 Vehicles | 182 (4.0%) | 413 (10.9%) |
| 5 or more Vehicles | 340 (7.5%) | 201 (5.3%) |
| Total | 4,511 (100.0%) | 3,797 (100.0%) |
Commute Time in Five Forks
The most frequently occuring commute durations in Five Forks are 20 to 24 minutes (1,548 commuters, 21.4%), 15 to 19 minutes (1,353 commuters, 18.7%), and 30 to 34 minutes (893 commuters, 12.3%).
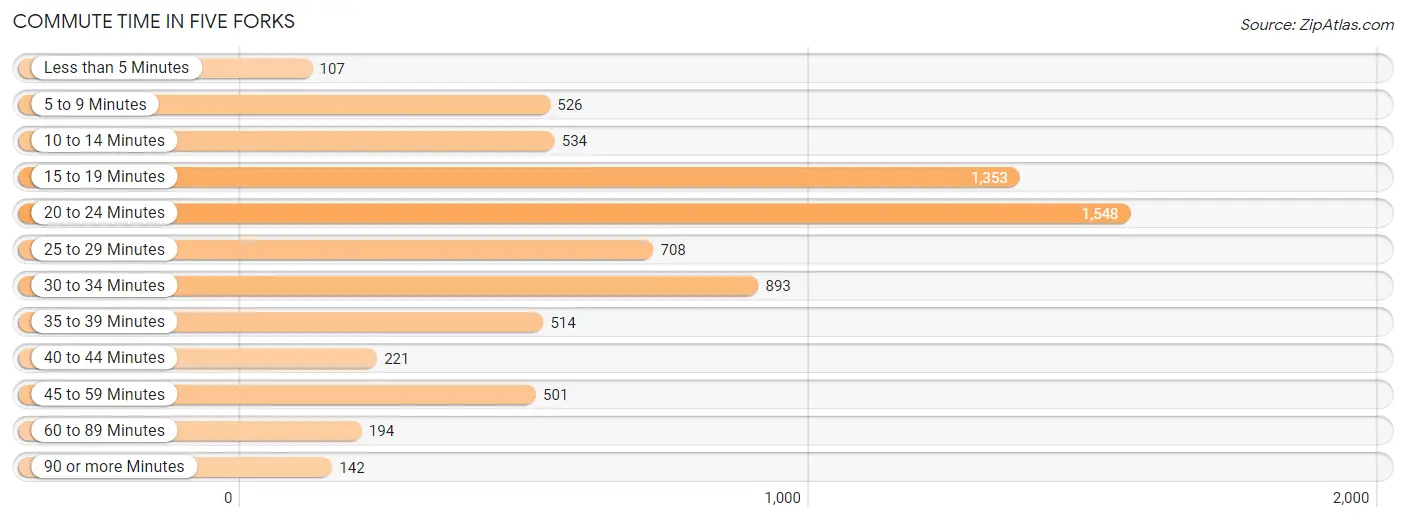
| Commute Time | # Commuters | % Commuters |
| Less than 5 Minutes | 107 | 1.5% |
| 5 to 9 Minutes | 526 | 7.3% |
| 10 to 14 Minutes | 534 | 7.4% |
| 15 to 19 Minutes | 1,353 | 18.7% |
| 20 to 24 Minutes | 1,548 | 21.4% |
| 25 to 29 Minutes | 708 | 9.8% |
| 30 to 34 Minutes | 893 | 12.3% |
| 35 to 39 Minutes | 514 | 7.1% |
| 40 to 44 Minutes | 221 | 3.0% |
| 45 to 59 Minutes | 501 | 6.9% |
| 60 to 89 Minutes | 194 | 2.7% |
| 90 or more Minutes | 142 | 2.0% |
Commute Time by Sex in Five Forks
The most common commute times in Five Forks are 15 to 19 minutes (913 commuters, 22.8%) for males and 20 to 24 minutes (700 commuters, 21.6%) for females.
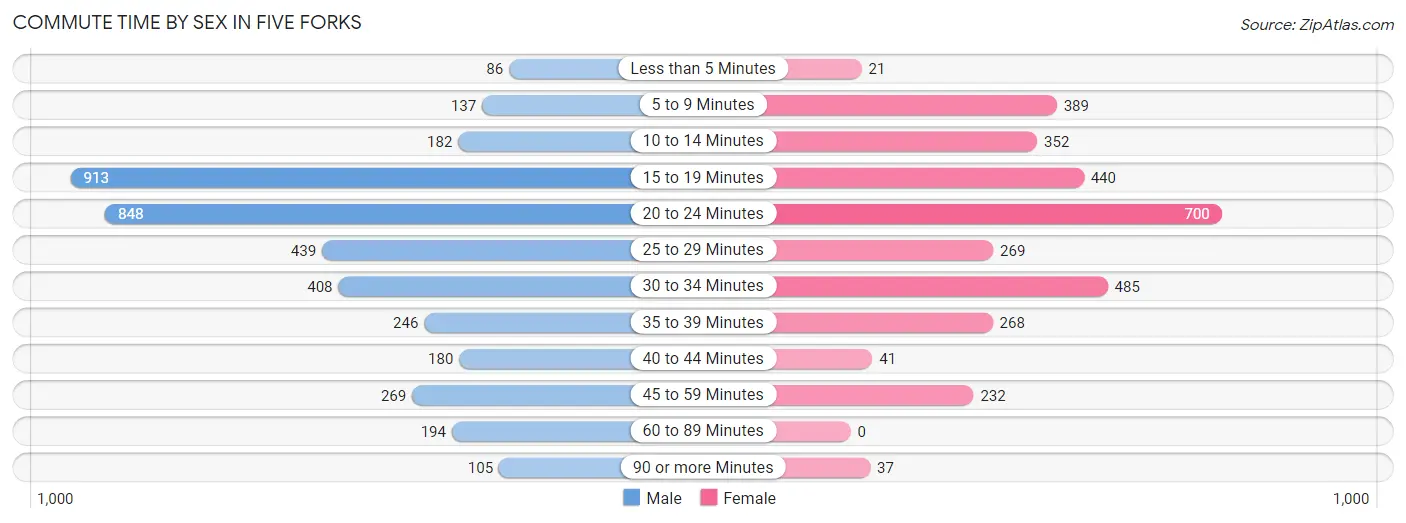
| Commute Time | Male | Female |
| Less than 5 Minutes | 86 (2.1%) | 21 (0.6%) |
| 5 to 9 Minutes | 137 (3.4%) | 389 (12.0%) |
| 10 to 14 Minutes | 182 (4.5%) | 352 (10.9%) |
| 15 to 19 Minutes | 913 (22.8%) | 440 (13.6%) |
| 20 to 24 Minutes | 848 (21.2%) | 700 (21.6%) |
| 25 to 29 Minutes | 439 (11.0%) | 269 (8.3%) |
| 30 to 34 Minutes | 408 (10.2%) | 485 (15.0%) |
| 35 to 39 Minutes | 246 (6.1%) | 268 (8.3%) |
| 40 to 44 Minutes | 180 (4.5%) | 41 (1.3%) |
| 45 to 59 Minutes | 269 (6.7%) | 232 (7.2%) |
| 60 to 89 Minutes | 194 (4.8%) | 0 (0.0%) |
| 90 or more Minutes | 105 (2.6%) | 37 (1.1%) |
Time of Departure to Work by Sex in Five Forks
The most frequent times of departure to work in Five Forks are 7:00 AM to 7:29 AM (995, 24.8%) for males and 7:00 AM to 7:29 AM (648, 20.0%) for females.
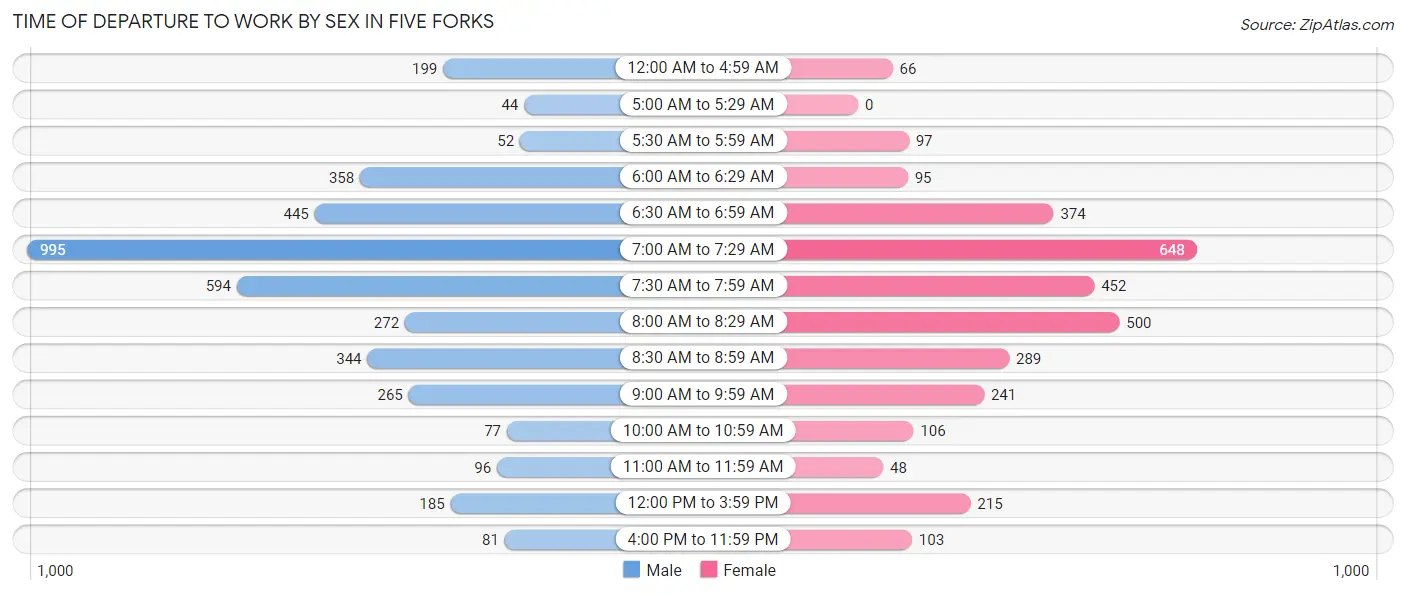
| Time of Departure | Male | Female |
| 12:00 AM to 4:59 AM | 199 (5.0%) | 66 (2.0%) |
| 5:00 AM to 5:29 AM | 44 (1.1%) | 0 (0.0%) |
| 5:30 AM to 5:59 AM | 52 (1.3%) | 97 (3.0%) |
| 6:00 AM to 6:29 AM | 358 (8.9%) | 95 (2.9%) |
| 6:30 AM to 6:59 AM | 445 (11.1%) | 374 (11.6%) |
| 7:00 AM to 7:29 AM | 995 (24.8%) | 648 (20.0%) |
| 7:30 AM to 7:59 AM | 594 (14.8%) | 452 (14.0%) |
| 8:00 AM to 8:29 AM | 272 (6.8%) | 500 (15.5%) |
| 8:30 AM to 8:59 AM | 344 (8.6%) | 289 (8.9%) |
| 9:00 AM to 9:59 AM | 265 (6.6%) | 241 (7.4%) |
| 10:00 AM to 10:59 AM | 77 (1.9%) | 106 (3.3%) |
| 11:00 AM to 11:59 AM | 96 (2.4%) | 48 (1.5%) |
| 12:00 PM to 3:59 PM | 185 (4.6%) | 215 (6.7%) |
| 4:00 PM to 11:59 PM | 81 (2.0%) | 103 (3.2%) |
| Total | 4,007 (100.0%) | 3,234 (100.0%) |
Housing Occupancy in Five Forks
Occupancy by Ownership in Five Forks
Of the total 6,192 dwellings in Five Forks, owner-occupied units account for 5,552 (89.7%), while renter-occupied units make up 640 (10.3%).
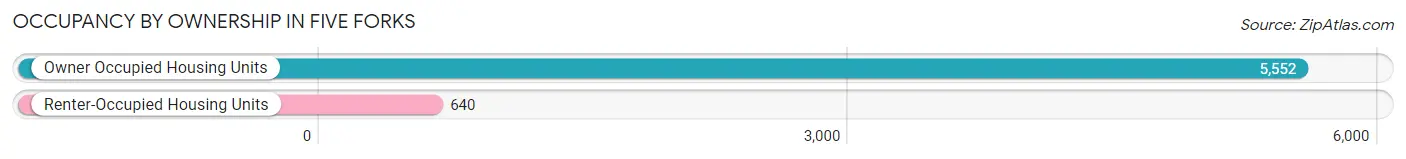
| Occupancy | # Housing Units | % Housing Units |
| Owner Occupied Housing Units | 5,552 | 89.7% |
| Renter-Occupied Housing Units | 640 | 10.3% |
| Total Occupied Housing Units | 6,192 | 100.0% |
Occupancy by Household Size in Five Forks
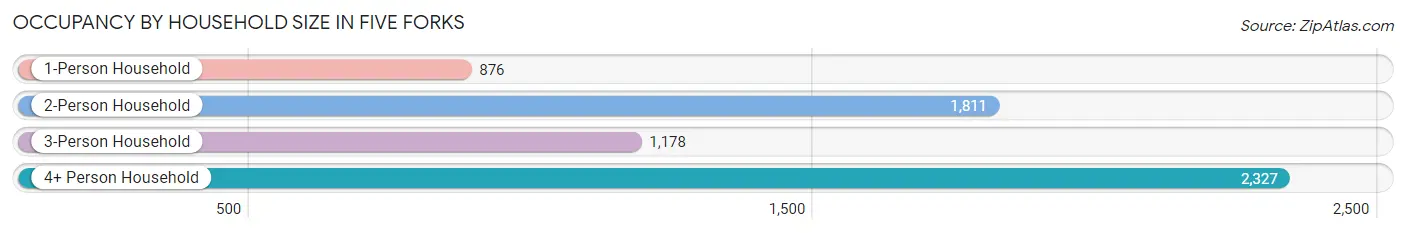
| Household Size | # Housing Units | % Housing Units |
| 1-Person Household | 876 | 14.1% |
| 2-Person Household | 1,811 | 29.2% |
| 3-Person Household | 1,178 | 19.0% |
| 4+ Person Household | 2,327 | 37.6% |
| Total Housing Units | 6,192 | 100.0% |
Occupancy by Ownership by Household Size in Five Forks
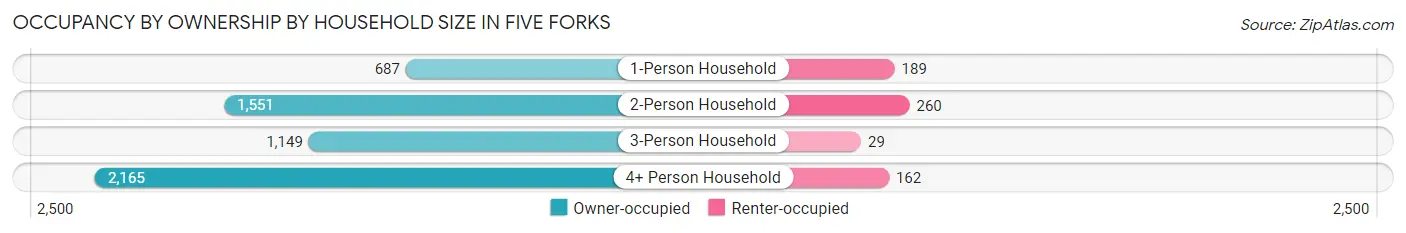
| Household Size | Owner-occupied | Renter-occupied |
| 1-Person Household | 687 (78.4%) | 189 (21.6%) |
| 2-Person Household | 1,551 (85.6%) | 260 (14.4%) |
| 3-Person Household | 1,149 (97.5%) | 29 (2.5%) |
| 4+ Person Household | 2,165 (93.0%) | 162 (7.0%) |
| Total Housing Units | 5,552 (89.7%) | 640 (10.3%) |
Occupancy by Educational Attainment in Five Forks
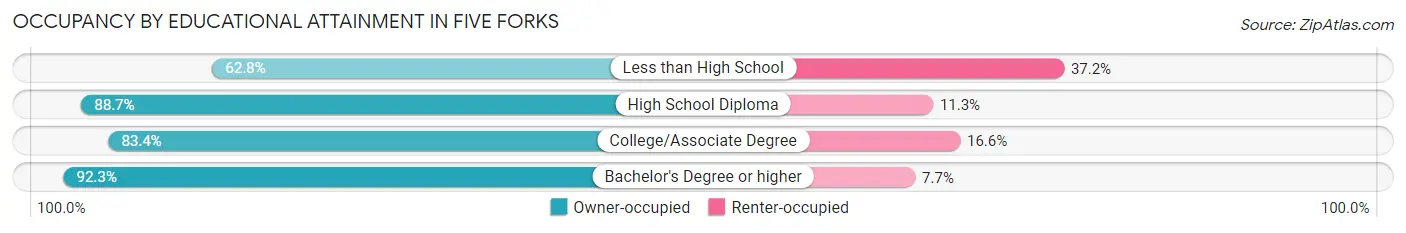
| Household Size | Owner-occupied | Renter-occupied |
| Less than High School | 59 (62.8%) | 35 (37.2%) |
| High School Diploma | 465 (88.7%) | 59 (11.3%) |
| College/Associate Degree | 1,078 (83.4%) | 215 (16.6%) |
| Bachelor's Degree or higher | 3,950 (92.3%) | 331 (7.7%) |
Occupancy by Age of Householder in Five Forks
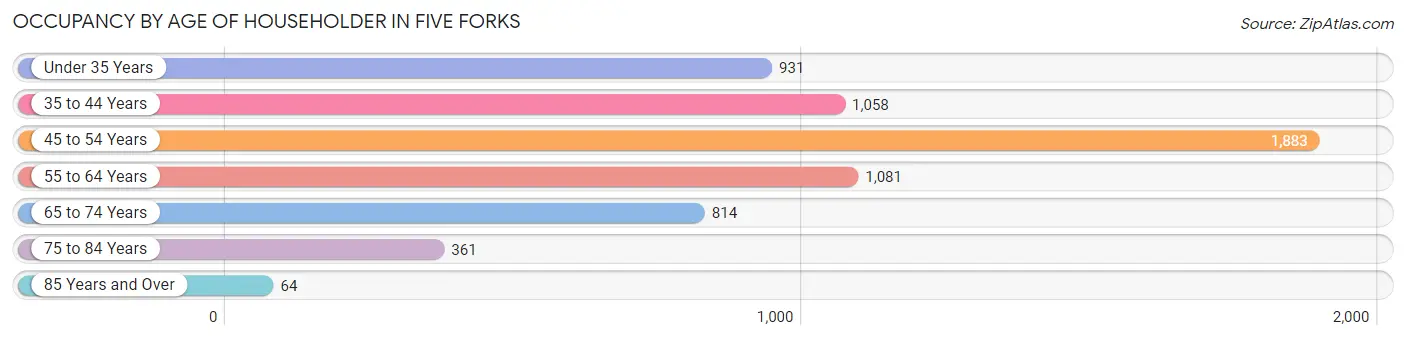
| Age Bracket | # Households | % Households |
| Under 35 Years | 931 | 15.0% |
| 35 to 44 Years | 1,058 | 17.1% |
| 45 to 54 Years | 1,883 | 30.4% |
| 55 to 64 Years | 1,081 | 17.5% |
| 65 to 74 Years | 814 | 13.2% |
| 75 to 84 Years | 361 | 5.8% |
| 85 Years and Over | 64 | 1.0% |
| Total | 6,192 | 100.0% |
Housing Finances in Five Forks
Median Income by Occupancy in Five Forks
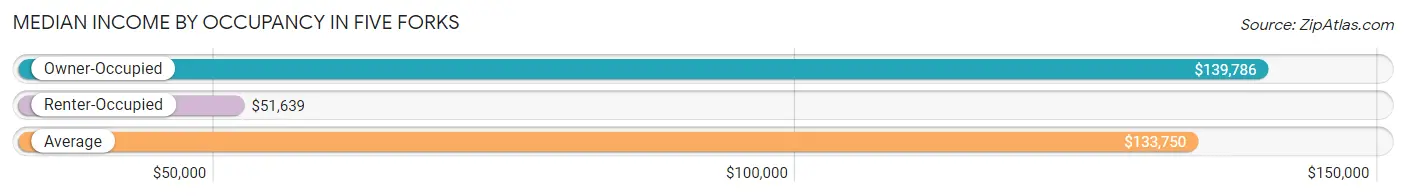
| Occupancy Type | # Households | Median Income |
| Owner-Occupied | 5,552 (89.7%) | $139,786 |
| Renter-Occupied | 640 (10.3%) | $51,639 |
| Average | 6,192 (100.0%) | $133,750 |
Occupancy by Householder Income Bracket in Five Forks
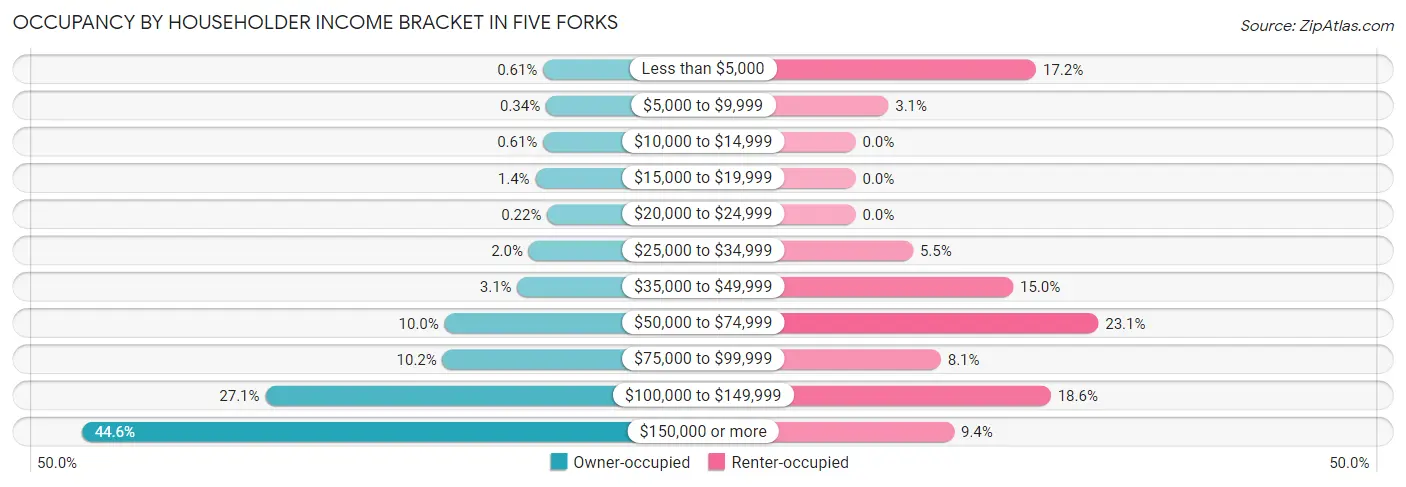
| Income Bracket | Owner-occupied | Renter-occupied |
| Less than $5,000 | 34 (0.6%) | 110 (17.2%) |
| $5,000 to $9,999 | 19 (0.3%) | 20 (3.1%) |
| $10,000 to $14,999 | 34 (0.6%) | 0 (0.0%) |
| $15,000 to $19,999 | 75 (1.3%) | 0 (0.0%) |
| $20,000 to $24,999 | 12 (0.2%) | 0 (0.0%) |
| $25,000 to $34,999 | 110 (2.0%) | 35 (5.5%) |
| $35,000 to $49,999 | 170 (3.1%) | 96 (15.0%) |
| $50,000 to $74,999 | 555 (10.0%) | 148 (23.1%) |
| $75,000 to $99,999 | 566 (10.2%) | 52 (8.1%) |
| $100,000 to $149,999 | 1,503 (27.1%) | 119 (18.6%) |
| $150,000 or more | 2,474 (44.6%) | 60 (9.4%) |
| Total | 5,552 (100.0%) | 640 (100.0%) |
Monthly Housing Cost Tiers in Five Forks
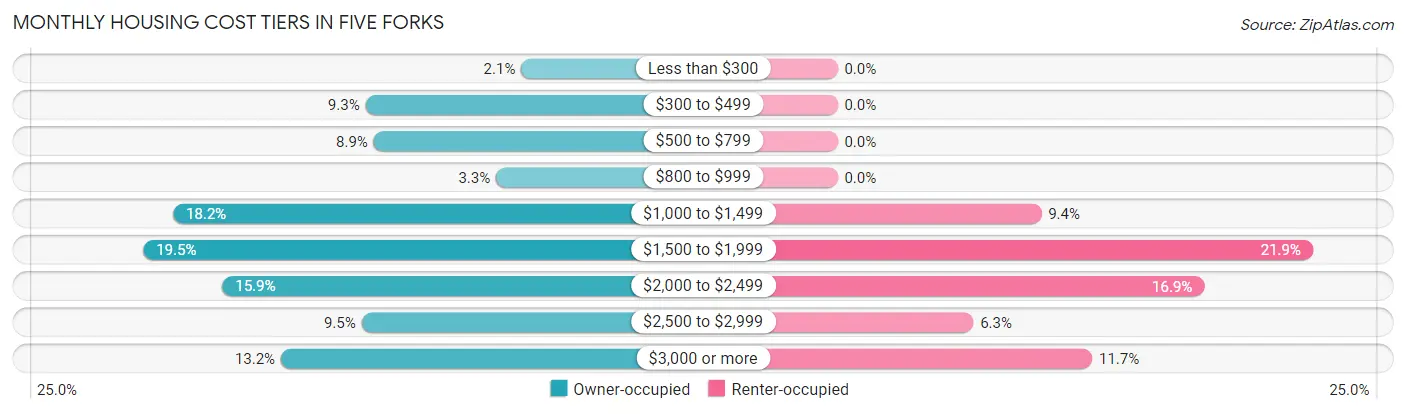
| Monthly Cost | Owner-occupied | Renter-occupied |
| Less than $300 | 119 (2.1%) | 0 (0.0%) |
| $300 to $499 | 517 (9.3%) | 0 (0.0%) |
| $500 to $799 | 496 (8.9%) | 0 (0.0%) |
| $800 to $999 | 183 (3.3%) | 0 (0.0%) |
| $1,000 to $1,499 | 1,009 (18.2%) | 60 (9.4%) |
| $1,500 to $1,999 | 1,085 (19.5%) | 140 (21.9%) |
| $2,000 to $2,499 | 883 (15.9%) | 108 (16.9%) |
| $2,500 to $2,999 | 527 (9.5%) | 40 (6.2%) |
| $3,000 or more | 733 (13.2%) | 75 (11.7%) |
| Total | 5,552 (100.0%) | 640 (100.0%) |
Physical Housing Characteristics in Five Forks
Housing Structures in Five Forks
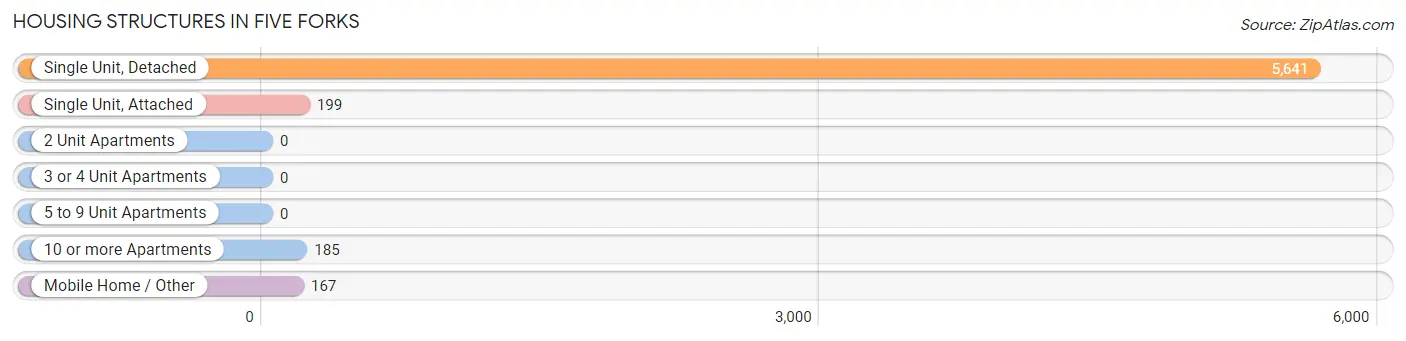
| Structure Type | # Housing Units | % Housing Units |
| Single Unit, Detached | 5,641 | 91.1% |
| Single Unit, Attached | 199 | 3.2% |
| 2 Unit Apartments | 0 | 0.0% |
| 3 or 4 Unit Apartments | 0 | 0.0% |
| 5 to 9 Unit Apartments | 0 | 0.0% |
| 10 or more Apartments | 185 | 3.0% |
| Mobile Home / Other | 167 | 2.7% |
| Total | 6,192 | 100.0% |
Housing Structures by Occupancy in Five Forks
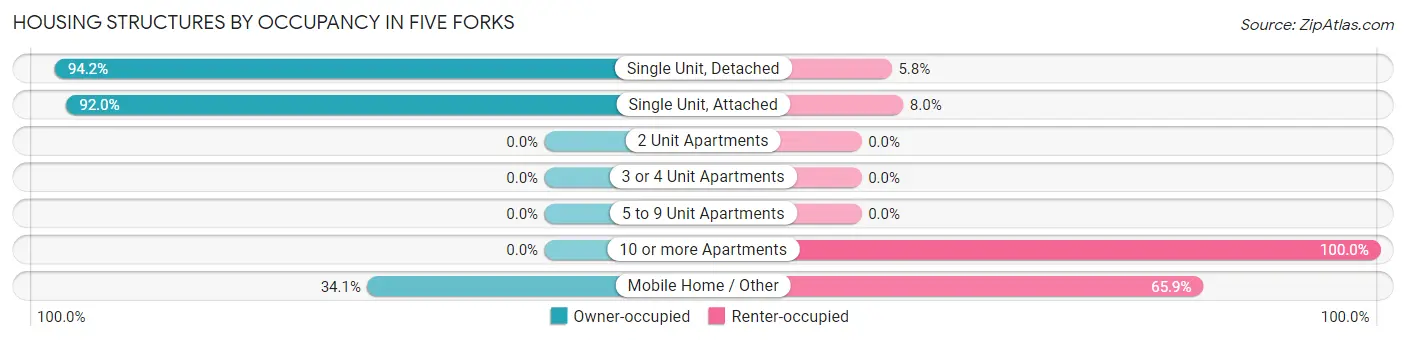
| Structure Type | Owner-occupied | Renter-occupied |
| Single Unit, Detached | 5,312 (94.2%) | 329 (5.8%) |
| Single Unit, Attached | 183 (92.0%) | 16 (8.0%) |
| 2 Unit Apartments | 0 (0.0%) | 0 (0.0%) |
| 3 or 4 Unit Apartments | 0 (0.0%) | 0 (0.0%) |
| 5 to 9 Unit Apartments | 0 (0.0%) | 0 (0.0%) |
| 10 or more Apartments | 0 (0.0%) | 185 (100.0%) |
| Mobile Home / Other | 57 (34.1%) | 110 (65.9%) |
| Total | 5,552 (89.7%) | 640 (10.3%) |
Housing Structures by Number of Rooms in Five Forks
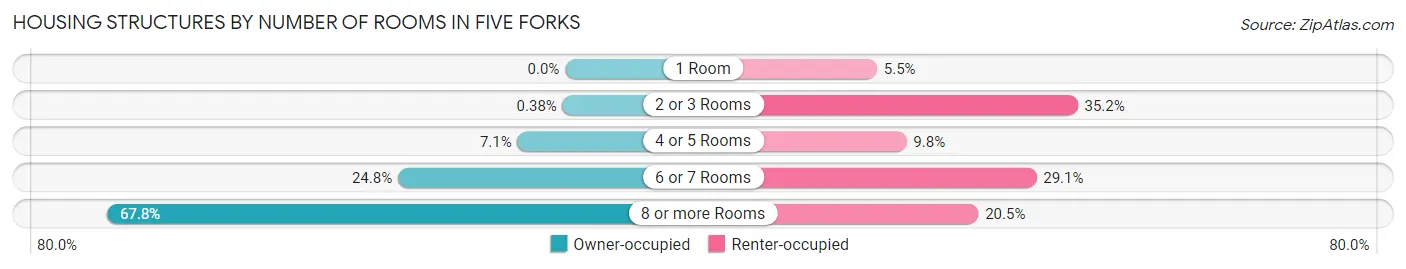
| Number of Rooms | Owner-occupied | Renter-occupied |
| 1 Room | 0 (0.0%) | 35 (5.5%) |
| 2 or 3 Rooms | 21 (0.4%) | 225 (35.2%) |
| 4 or 5 Rooms | 392 (7.1%) | 63 (9.8%) |
| 6 or 7 Rooms | 1,374 (24.7%) | 186 (29.1%) |
| 8 or more Rooms | 3,765 (67.8%) | 131 (20.5%) |
| Total | 5,552 (100.0%) | 640 (100.0%) |
Housing Structure by Heating Type in Five Forks
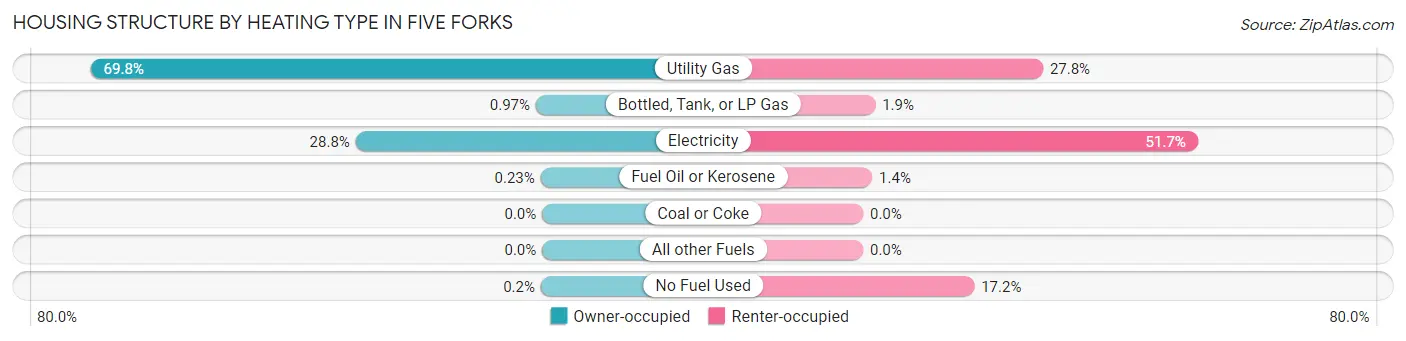
| Heating Type | Owner-occupied | Renter-occupied |
| Utility Gas | 3,874 (69.8%) | 178 (27.8%) |
| Bottled, Tank, or LP Gas | 54 (1.0%) | 12 (1.9%) |
| Electricity | 1,600 (28.8%) | 331 (51.7%) |
| Fuel Oil or Kerosene | 13 (0.2%) | 9 (1.4%) |
| Coal or Coke | 0 (0.0%) | 0 (0.0%) |
| All other Fuels | 0 (0.0%) | 0 (0.0%) |
| No Fuel Used | 11 (0.2%) | 110 (17.2%) |
| Total | 5,552 (100.0%) | 640 (100.0%) |
Household Vehicle Usage in Five Forks
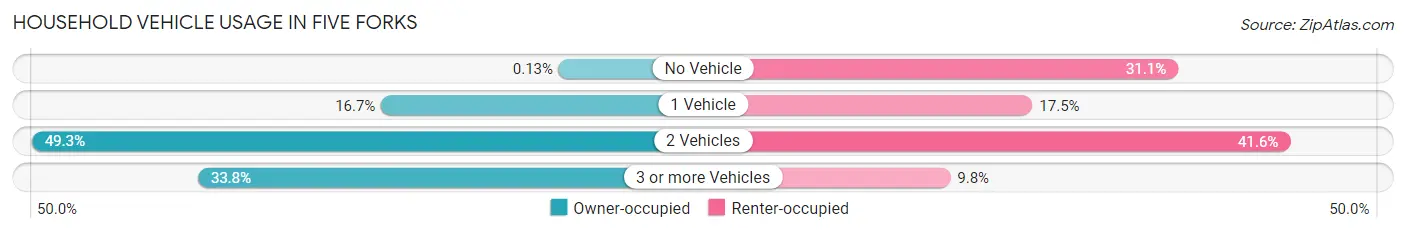
| Vehicles per Household | Owner-occupied | Renter-occupied |
| No Vehicle | 7 (0.1%) | 199 (31.1%) |
| 1 Vehicle | 928 (16.7%) | 112 (17.5%) |
| 2 Vehicles | 2,739 (49.3%) | 266 (41.6%) |
| 3 or more Vehicles | 1,878 (33.8%) | 63 (9.8%) |
| Total | 5,552 (100.0%) | 640 (100.0%) |
Real Estate & Mortgages in Five Forks
Real Estate and Mortgage Overview in Five Forks
| Characteristic | Without Mortgage | With Mortgage |
| Housing Units | 1,408 | 4,144 |
| Median Property Value | $358,200 | $407,300 |
| Median Household Income | $123,864 | $1,828 |
| Monthly Housing Costs | $591 | $733 |
| Real Estate Taxes | $1,869 | $35 |
Property Value by Mortgage Status in Five Forks
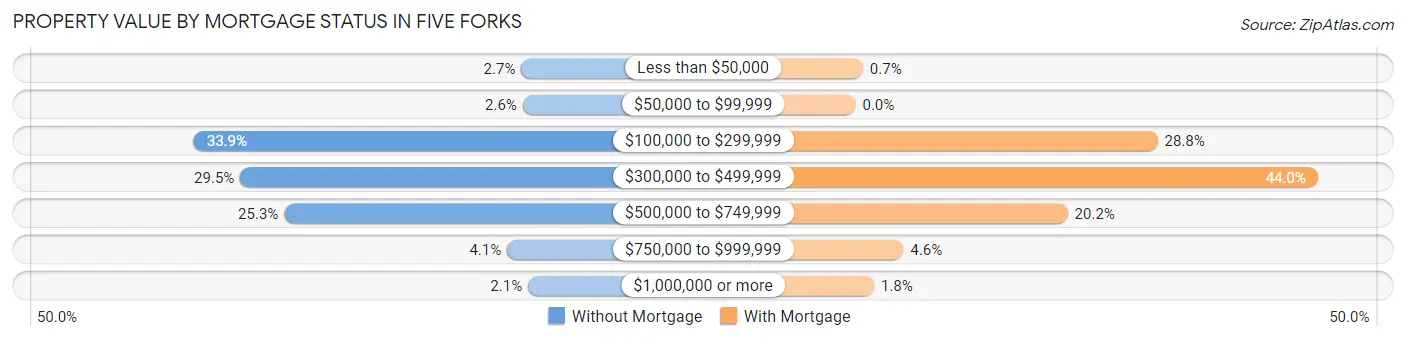
| Property Value | Without Mortgage | With Mortgage |
| Less than $50,000 | 38 (2.7%) | 29 (0.7%) |
| $50,000 to $99,999 | 36 (2.6%) | 0 (0.0%) |
| $100,000 to $299,999 | 477 (33.9%) | 1,192 (28.8%) |
| $300,000 to $499,999 | 415 (29.5%) | 1,824 (44.0%) |
| $500,000 to $749,999 | 356 (25.3%) | 837 (20.2%) |
| $750,000 to $999,999 | 57 (4.1%) | 189 (4.6%) |
| $1,000,000 or more | 29 (2.1%) | 73 (1.8%) |
| Total | 1,408 (100.0%) | 4,144 (100.0%) |
Household Income by Mortgage Status in Five Forks
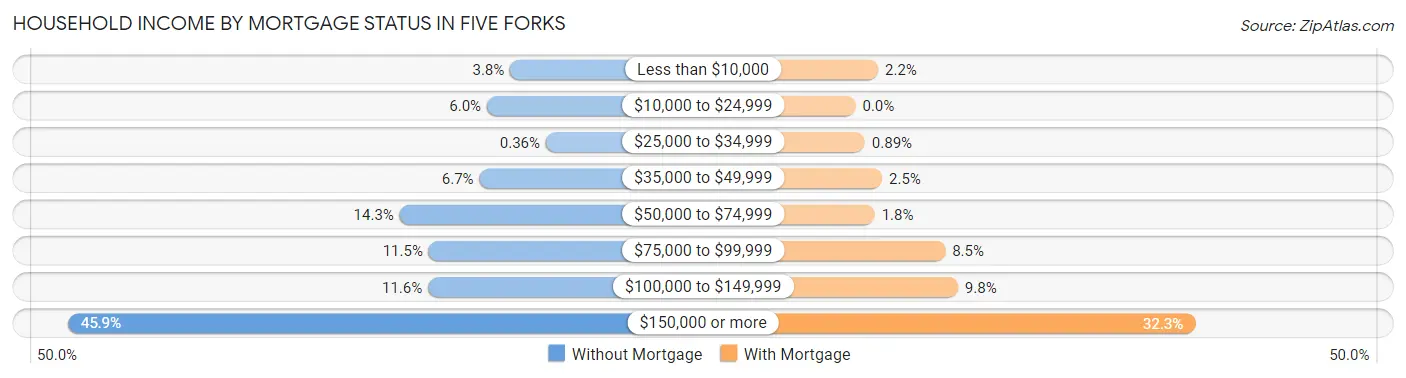
| Household Income | Without Mortgage | With Mortgage |
| Less than $10,000 | 53 (3.8%) | 89 (2.1%) |
| $10,000 to $24,999 | 84 (6.0%) | 0 (0.0%) |
| $25,000 to $34,999 | 5 (0.4%) | 37 (0.9%) |
| $35,000 to $49,999 | 94 (6.7%) | 105 (2.5%) |
| $50,000 to $74,999 | 201 (14.3%) | 76 (1.8%) |
| $75,000 to $99,999 | 162 (11.5%) | 354 (8.5%) |
| $100,000 to $149,999 | 163 (11.6%) | 404 (9.8%) |
| $150,000 or more | 646 (45.9%) | 1,340 (32.3%) |
| Total | 1,408 (100.0%) | 4,144 (100.0%) |
Property Value to Household Income Ratio in Five Forks
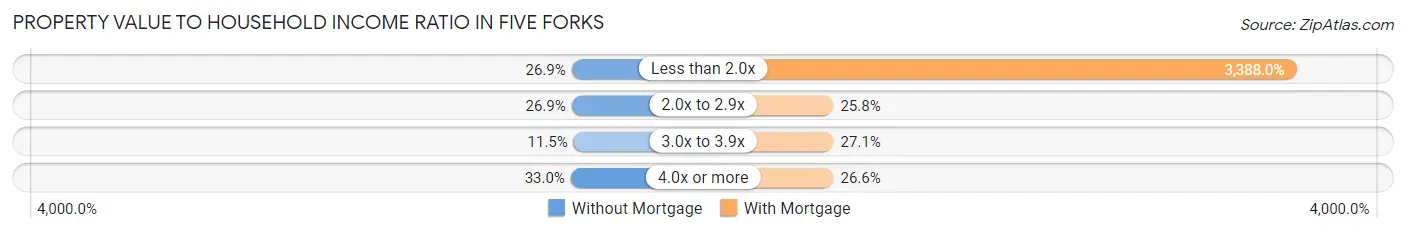
| Value-to-Income Ratio | Without Mortgage | With Mortgage |
| Less than 2.0x | 379 (26.9%) | 140,398 (3,388.0%) |
| 2.0x to 2.9x | 379 (26.9%) | 1,070 (25.8%) |
| 3.0x to 3.9x | 162 (11.5%) | 1,123 (27.1%) |
| 4.0x or more | 465 (33.0%) | 1,101 (26.6%) |
| Total | 1,408 (100.0%) | 4,144 (100.0%) |
Real Estate Taxes by Mortgage Status in Five Forks
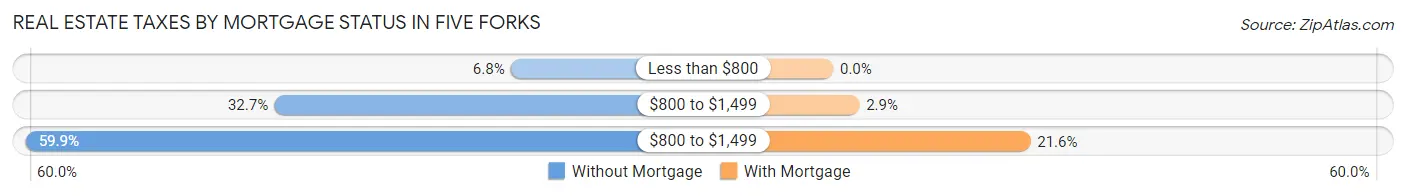
| Property Taxes | Without Mortgage | With Mortgage |
| Less than $800 | 95 (6.8%) | 0 (0.0%) |
| $800 to $1,499 | 460 (32.7%) | 119 (2.9%) |
| $800 to $1,499 | 843 (59.9%) | 896 (21.6%) |
| Total | 1,408 (100.0%) | 4,144 (100.0%) |
Health & Disability in Five Forks
Health Insurance Coverage by Age in Five Forks
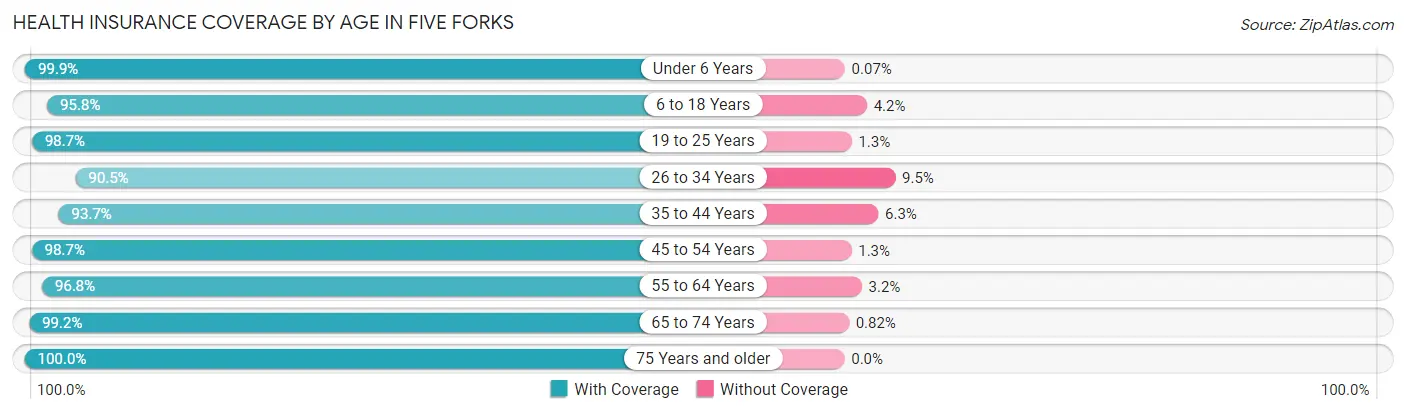
| Age Bracket | With Coverage | Without Coverage |
| Under 6 Years | 1,338 (99.9%) | 1 (0.1%) |
| 6 to 18 Years | 4,237 (95.8%) | 185 (4.2%) |
| 19 to 25 Years | 887 (98.7%) | 12 (1.3%) |
| 26 to 34 Years | 2,054 (90.5%) | 215 (9.5%) |
| 35 to 44 Years | 1,914 (93.7%) | 129 (6.3%) |
| 45 to 54 Years | 3,123 (98.7%) | 41 (1.3%) |
| 55 to 64 Years | 2,220 (96.8%) | 74 (3.2%) |
| 65 to 74 Years | 1,448 (99.2%) | 12 (0.8%) |
| 75 Years and older | 685 (100.0%) | 0 (0.0%) |
| Total | 17,906 (96.4%) | 669 (3.6%) |
Health Insurance Coverage by Citizenship Status in Five Forks
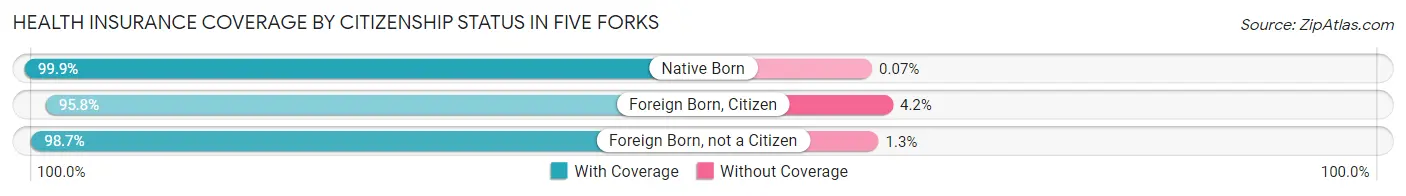
| Citizenship Status | With Coverage | Without Coverage |
| Native Born | 1,338 (99.9%) | 1 (0.1%) |
| Foreign Born, Citizen | 4,237 (95.8%) | 185 (4.2%) |
| Foreign Born, not a Citizen | 887 (98.7%) | 12 (1.3%) |
Health Insurance Coverage by Household Income in Five Forks
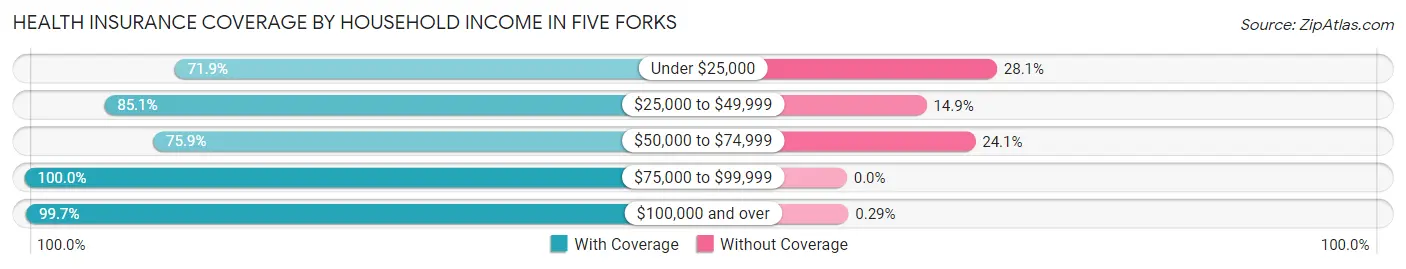
| Household Income | With Coverage | Without Coverage |
| Under $25,000 | 340 (71.9%) | 133 (28.1%) |
| $25,000 to $49,999 | 627 (85.1%) | 110 (14.9%) |
| $50,000 to $74,999 | 1,217 (75.9%) | 386 (24.1%) |
| $75,000 to $99,999 | 1,879 (100.0%) | 0 (0.0%) |
| $100,000 and over | 13,825 (99.7%) | 40 (0.3%) |
Public vs Private Health Insurance Coverage by Age in Five Forks
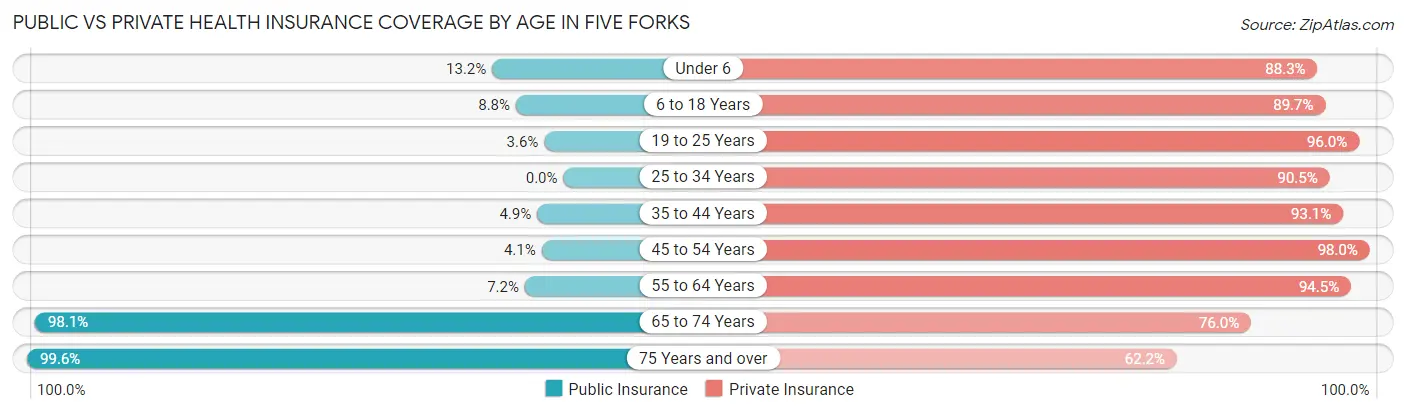
| Age Bracket | Public Insurance | Private Insurance |
| Under 6 | 177 (13.2%) | 1,182 (88.3%) |
| 6 to 18 Years | 390 (8.8%) | 3,968 (89.7%) |
| 19 to 25 Years | 32 (3.6%) | 863 (96.0%) |
| 25 to 34 Years | 0 (0.0%) | 2,054 (90.5%) |
| 35 to 44 Years | 100 (4.9%) | 1,901 (93.0%) |
| 45 to 54 Years | 128 (4.1%) | 3,100 (98.0%) |
| 55 to 64 Years | 164 (7.1%) | 2,168 (94.5%) |
| 65 to 74 Years | 1,432 (98.1%) | 1,109 (76.0%) |
| 75 Years and over | 682 (99.6%) | 426 (62.2%) |
| Total | 3,105 (16.7%) | 16,771 (90.3%) |
Disability Status by Sex by Age in Five Forks
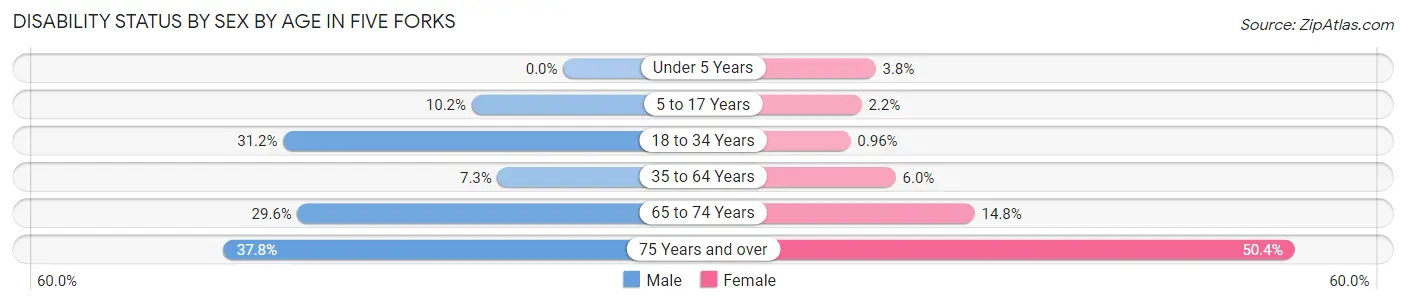
| Age Bracket | Male | Female |
| Under 5 Years | 0 (0.0%) | 18 (3.8%) |
| 5 to 17 Years | 276 (10.2%) | 37 (2.2%) |
| 18 to 34 Years | 530 (31.2%) | 16 (1.0%) |
| 35 to 64 Years | 252 (7.3%) | 243 (6.0%) |
| 65 to 74 Years | 216 (29.6%) | 108 (14.8%) |
| 75 Years and over | 121 (37.8%) | 184 (50.4%) |
Disability Class by Sex by Age in Five Forks
Disability Class: Hearing Difficulty
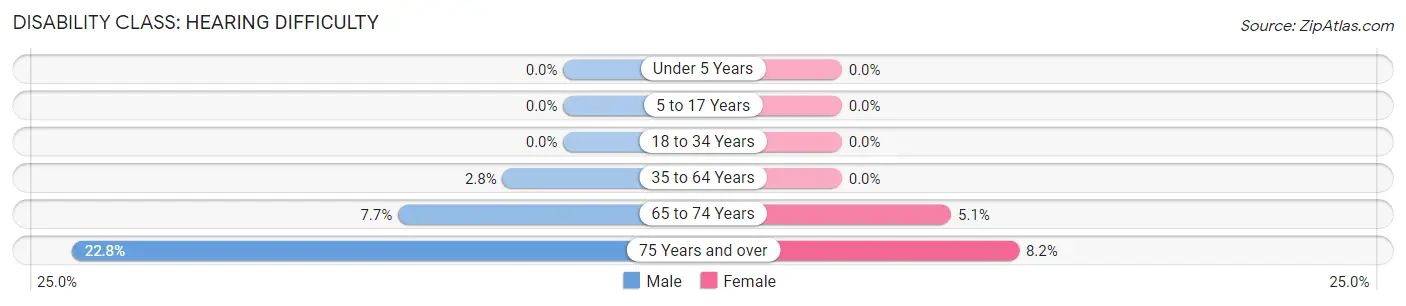
| Age Bracket | Male | Female |
| Under 5 Years | 0 (0.0%) | 0 (0.0%) |
| 5 to 17 Years | 0 (0.0%) | 0 (0.0%) |
| 18 to 34 Years | 0 (0.0%) | 0 (0.0%) |
| 35 to 64 Years | 97 (2.8%) | 0 (0.0%) |
| 65 to 74 Years | 56 (7.7%) | 37 (5.1%) |
| 75 Years and over | 73 (22.8%) | 30 (8.2%) |
Disability Class: Vision Difficulty
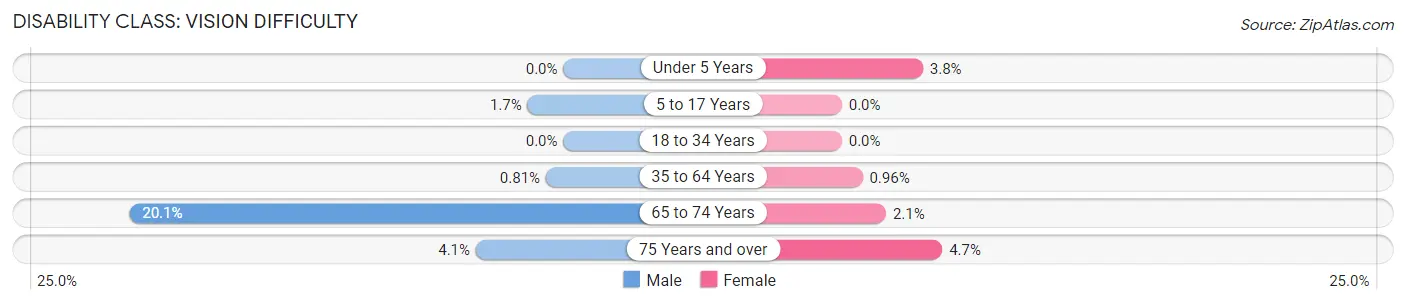
| Age Bracket | Male | Female |
| Under 5 Years | 0 (0.0%) | 18 (3.8%) |
| 5 to 17 Years | 45 (1.7%) | 0 (0.0%) |
| 18 to 34 Years | 0 (0.0%) | 0 (0.0%) |
| 35 to 64 Years | 28 (0.8%) | 39 (1.0%) |
| 65 to 74 Years | 147 (20.1%) | 15 (2.1%) |
| 75 Years and over | 13 (4.1%) | 17 (4.7%) |
Disability Class: Cognitive Difficulty
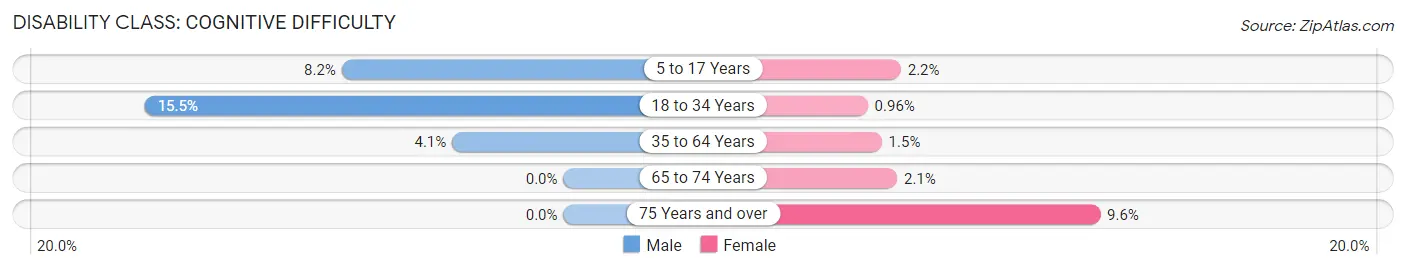
| Age Bracket | Male | Female |
| 5 to 17 Years | 223 (8.2%) | 37 (2.2%) |
| 18 to 34 Years | 264 (15.5%) | 16 (1.0%) |
| 35 to 64 Years | 142 (4.1%) | 60 (1.5%) |
| 65 to 74 Years | 0 (0.0%) | 15 (2.1%) |
| 75 Years and over | 0 (0.0%) | 35 (9.6%) |
Disability Class: Ambulatory Difficulty
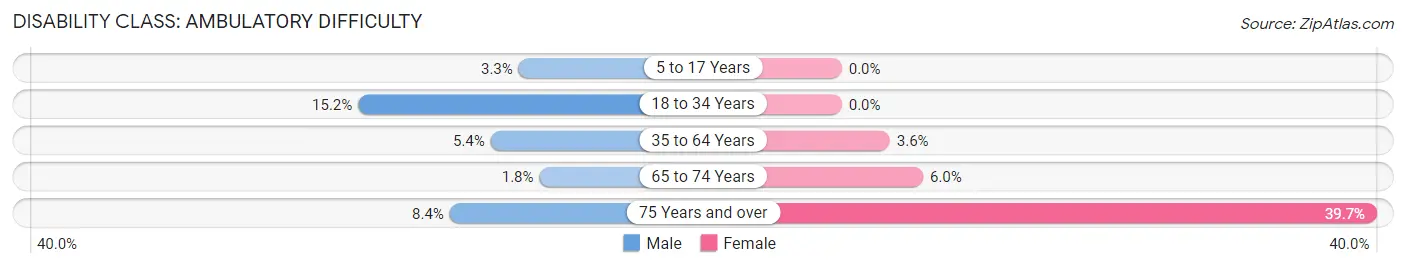
| Age Bracket | Male | Female |
| 5 to 17 Years | 90 (3.3%) | 0 (0.0%) |
| 18 to 34 Years | 259 (15.2%) | 0 (0.0%) |
| 35 to 64 Years | 186 (5.4%) | 145 (3.6%) |
| 65 to 74 Years | 13 (1.8%) | 44 (6.0%) |
| 75 Years and over | 27 (8.4%) | 145 (39.7%) |
Disability Class: Self-Care Difficulty
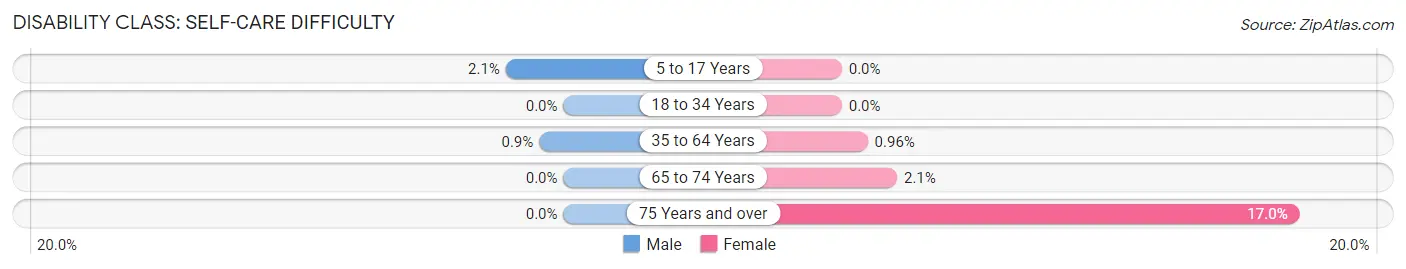
| Age Bracket | Male | Female |
| 5 to 17 Years | 58 (2.1%) | 0 (0.0%) |
| 18 to 34 Years | 0 (0.0%) | 0 (0.0%) |
| 35 to 64 Years | 31 (0.9%) | 39 (1.0%) |
| 65 to 74 Years | 0 (0.0%) | 15 (2.1%) |
| 75 Years and over | 0 (0.0%) | 62 (17.0%) |
Technology Access in Five Forks
Computing Device Access in Five Forks
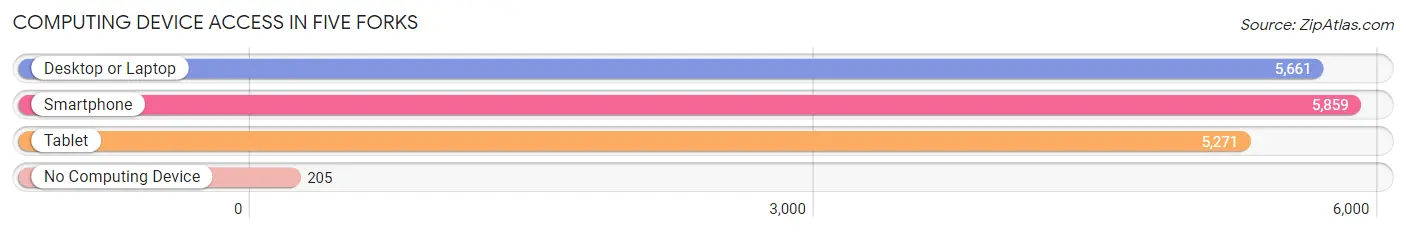
| Device Type | # Households | % Households |
| Desktop or Laptop | 5,661 | 91.4% |
| Smartphone | 5,859 | 94.6% |
| Tablet | 5,271 | 85.1% |
| No Computing Device | 205 | 3.3% |
| Total | 6,192 | 100.0% |
Internet Access in Five Forks
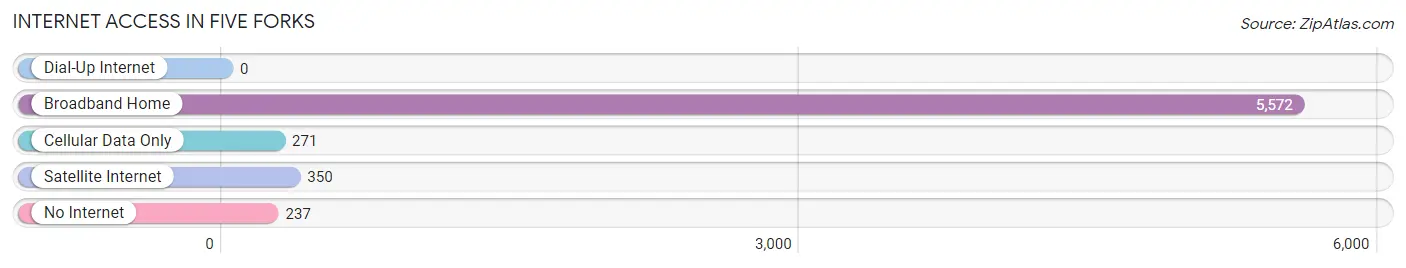
| Internet Type | # Households | % Households |
| Dial-Up Internet | 0 | 0.0% |
| Broadband Home | 5,572 | 90.0% |
| Cellular Data Only | 271 | 4.4% |
| Satellite Internet | 350 | 5.7% |
| No Internet | 237 | 3.8% |
| Total | 6,192 | 100.0% |
Five Forks Summary
Five Forks, South Carolina is a small town located in the Upstate region of the state. It is situated in the foothills of the Blue Ridge Mountains, and is part of the Greenville-Spartanburg-Anderson Combined Statistical Area. The town has a population of approximately 1,500 people, and is located in the northern part of Spartanburg County.
History
Five Forks was first settled in the late 1700s by a group of settlers from North Carolina. The town was named for the five forks of the Tyger River, which runs through the area. The town was incorporated in 1872, and the first post office was established in 1873.
The town was originally a farming community, and the main crops grown were cotton, corn, and tobacco. In the early 1900s, the town began to grow and develop, and the first bank was established in 1906. The town also had a cotton mill, which was built in 1910.
In the 1950s, the town began to experience a decline in population, as many of the residents moved away to larger cities. However, in the late 1990s, the town began to experience a resurgence in population, as people began to move back to the area.
Geography
Five Forks is located in the northern part of Spartanburg County, in the foothills of the Blue Ridge Mountains. The town is situated at an elevation of 890 feet above sea level. The town is located approximately 25 miles from the city of Spartanburg, and is about an hour’s drive from the cities of Greenville and Asheville.
The town is located in a rural area, and is surrounded by forests and rolling hills. The Tyger River runs through the town, and there are several small lakes and ponds in the area. The town is also home to several parks, including the Five Forks Park, which features a playground, picnic area, and walking trails.
Economy
The economy of Five Forks is largely based on agriculture and tourism. The town is home to several farms, which produce a variety of crops, including corn, soybeans, and tobacco. The town is also home to several small businesses, including restaurants, retail stores, and service providers.
The town is also a popular tourist destination, as it is located in a scenic area of the state. The town is home to several attractions, including the Five Forks Park, which features a playground, picnic area, and walking trails. The town is also home to several wineries, which offer tastings and tours.
Demographics
As of the 2010 census, the population of Five Forks was 1,500 people. The town has a median age of 39.7 years, and the median household income is $41,250. The town is predominantly white, with a population that is 94.7% white, 2.7% African American, 0.7% Asian, and 0.7% Hispanic or Latino.
Conclusion
Five Forks, South Carolina is a small town located in the Upstate region of the state. It is situated in the foothills of the Blue Ridge Mountains, and is part of the Greenville-Spartanburg-Anderson Combined Statistical Area. The town has a population of approximately 1,500 people, and is located in the northern part of Spartanburg County. The town has a long history, and was originally a farming community. The economy of the town is largely based on agriculture and tourism, and the town is home to several attractions, including the Five Forks Park. The town is predominantly white, with a population that is 94.7% white, 2.7% African American, 0.7% Asian, and 0.7% Hispanic or Latino.
Common Questions
What is Per Capita Income in Five Forks?
Per Capita income in Five Forks is $53,614.
What is the Median Family Income in Five Forks?
Median Family Income in Five Forks is $145,753.
What is the Median Household income in Five Forks?
Median Household Income in Five Forks is $133,750.
What is Income or Wage Gap in Five Forks?
Income or Wage Gap in Five Forks is 48.5%.
Women in Five Forks earn 51.5 cents for every dollar earned by a man.
What is Family Income Deficit in Five Forks?
Family Income Deficit in Five Forks is $12,672.
Families that are below poverty line in Five Forks earn $12,672 less on average than the poverty threshold level.
What is Inequality or Gini Index in Five Forks?
Inequality or Gini Index in Five Forks is 0.40.
What is the Total Population of Five Forks?
Total Population of Five Forks is 18,592.
What is the Total Male Population of Five Forks?
Total Male Population of Five Forks is 9,609.
What is the Total Female Population of Five Forks?
Total Female Population of Five Forks is 8,983.
What is the Ratio of Males per 100 Females in Five Forks?
There are 106.97 Males per 100 Females in Five Forks.
What is the Ratio of Females per 100 Males in Five Forks?
There are 93.49 Females per 100 Males in Five Forks.
What is the Median Population Age in Five Forks?
Median Population Age in Five Forks is 36.6 Years.
What is the Average Family Size in Five Forks
Average Family Size in Five Forks is 3.3 People.
What is the Average Household Size in Five Forks
Average Household Size in Five Forks is 3.0 People.
How Large is the Labor Force in Five Forks?
There are 8,984 People in the Labor Forcein in Five Forks.
What is the Percentage of People in the Labor Force in Five Forks?
64.7% of People are in the Labor Force in Five Forks.
What is the Unemployment Rate in Five Forks?
Unemployment Rate in Five Forks is 3.5%.