Summit Park, UT Map & Demographics
Summit Park Map
Summit Park Overview
$74,026
PER CAPITA INCOME
$176,333
AVG FAMILY INCOME
$171,408
AVG HOUSEHOLD INCOME
53.0%
WAGE / INCOME GAP [ % ]
47.0¢/ $1
WAGE / INCOME GAP [ $ ]
0.42
INEQUALITY / GINI INDEX
8,708
TOTAL POPULATION
4,386
MALE POPULATION
4,322
FEMALE POPULATION
101.48
MALES / 100 FEMALES
98.54
FEMALES / 100 MALES
41.6
MEDIAN AGE
3.3
AVG FAMILY SIZE
3.1
AVG HOUSEHOLD SIZE
4,955
LABOR FORCE [ PEOPLE ]
71.3%
PERCENT IN LABOR FORCE
3.4%
UNEMPLOYMENT RATE
Income in Summit Park
Income Overview in Summit Park
Per Capita Income in Summit Park is $74,026, while median incomes of families and households are $176,333 and $171,408 respectively.
| Characteristic | Number | Measure |
| Per Capita Income | 8,708 | $74,026 |
| Median Family Income | 2,284 | $176,333 |
| Mean Family Income | 2,284 | $228,060 |
| Median Household Income | 2,785 | $171,408 |
| Mean Household Income | 2,785 | $220,597 |
| Income Deficit | 2,284 | $0 |
| Wage / Income Gap (%) | 8,708 | 53.04% |
| Wage / Income Gap ($) | 8,708 | 46.96¢ per $1 |
| Gini / Inequality Index | 8,708 | 0.42 |
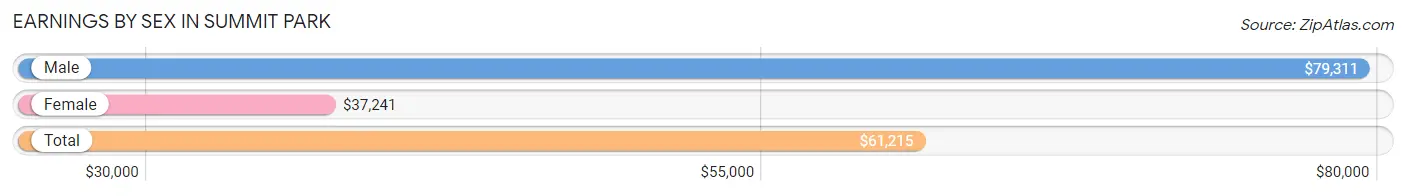
Earnings by Sex in Summit Park
Average Earnings in Summit Park are $61,215, $79,311 for men and $37,241 for women, a difference of 53.0%.
| Sex | Number | Average Earnings |
| Male | 2,817 (53.2%) | $79,311 |
| Female | 2,476 (46.8%) | $37,241 |
| Total | 5,293 (100.0%) | $61,215 |
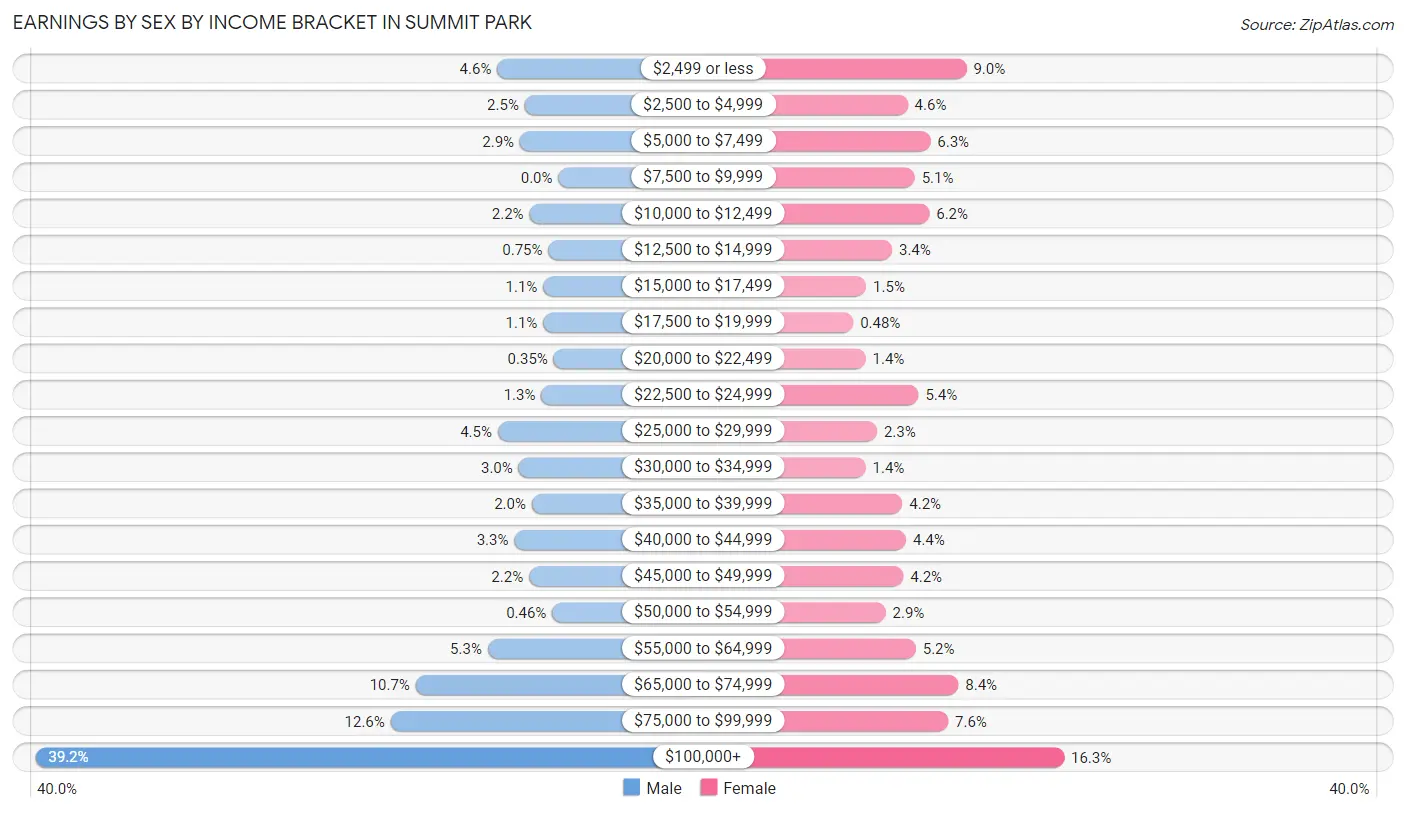
Earnings by Sex by Income Bracket in Summit Park
The most common earnings brackets in Summit Park are $100,000+ for men (1,104 | 39.2%) and $100,000+ for women (403 | 16.3%).
| Income | Male | Female |
| $2,499 or less | 129 (4.6%) | 222 (9.0%) |
| $2,500 to $4,999 | 71 (2.5%) | 113 (4.6%) |
| $5,000 to $7,499 | 81 (2.9%) | 155 (6.3%) |
| $7,500 to $9,999 | 0 (0.0%) | 126 (5.1%) |
| $10,000 to $12,499 | 61 (2.2%) | 153 (6.2%) |
| $12,500 to $14,999 | 21 (0.7%) | 84 (3.4%) |
| $15,000 to $17,499 | 32 (1.1%) | 36 (1.5%) |
| $17,500 to $19,999 | 32 (1.1%) | 12 (0.5%) |
| $20,000 to $22,499 | 10 (0.4%) | 35 (1.4%) |
| $22,500 to $24,999 | 36 (1.3%) | 133 (5.4%) |
| $25,000 to $29,999 | 128 (4.5%) | 56 (2.3%) |
| $30,000 to $34,999 | 84 (3.0%) | 35 (1.4%) |
| $35,000 to $39,999 | 56 (2.0%) | 103 (4.2%) |
| $40,000 to $44,999 | 93 (3.3%) | 110 (4.4%) |
| $45,000 to $49,999 | 62 (2.2%) | 105 (4.2%) |
| $50,000 to $54,999 | 13 (0.5%) | 72 (2.9%) |
| $55,000 to $64,999 | 149 (5.3%) | 128 (5.2%) |
| $65,000 to $74,999 | 301 (10.7%) | 207 (8.4%) |
| $75,000 to $99,999 | 354 (12.6%) | 188 (7.6%) |
| $100,000+ | 1,104 (39.2%) | 403 (16.3%) |
| Total | 2,817 (100.0%) | 2,476 (100.0%) |
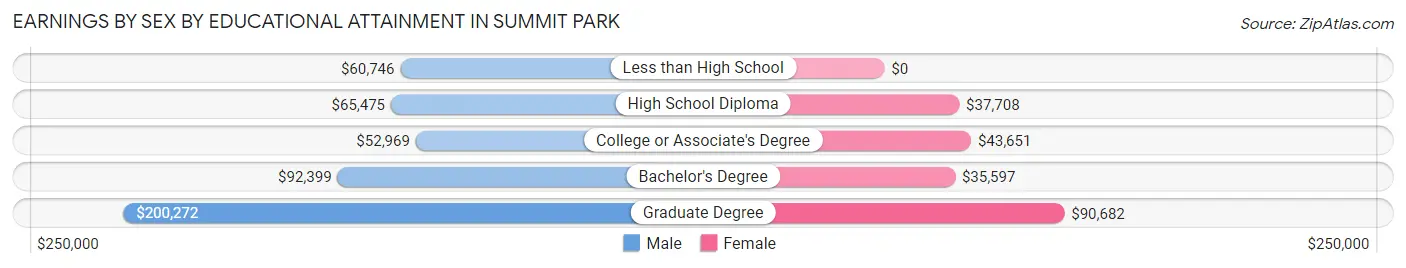
Earnings by Sex by Educational Attainment in Summit Park
Average earnings in Summit Park are $86,336 for men and $47,179 for women, a difference of 45.4%. Men with an educational attainment of graduate degree enjoy the highest average annual earnings of $200,272, while those with college or associate's degree education earn the least with $52,969. Women with an educational attainment of graduate degree earn the most with the average annual earnings of $90,682, while those with bachelor's degree education have the smallest earnings of $35,597.
| Educational Attainment | Male Income | Female Income |
| Less than High School | $60,746 | $0 |
| High School Diploma | $65,475 | $37,708 |
| College or Associate's Degree | $52,969 | $43,651 |
| Bachelor's Degree | $92,399 | $35,597 |
| Graduate Degree | $200,272 | $90,682 |
| Total | $86,336 | $47,179 |
Family Income in Summit Park
Family Income Brackets in Summit Park
According to the Summit Park family income data, there are 1,062 families falling into the $200,000+ income range, which is the most common income bracket and makes up 46.5% of all families.
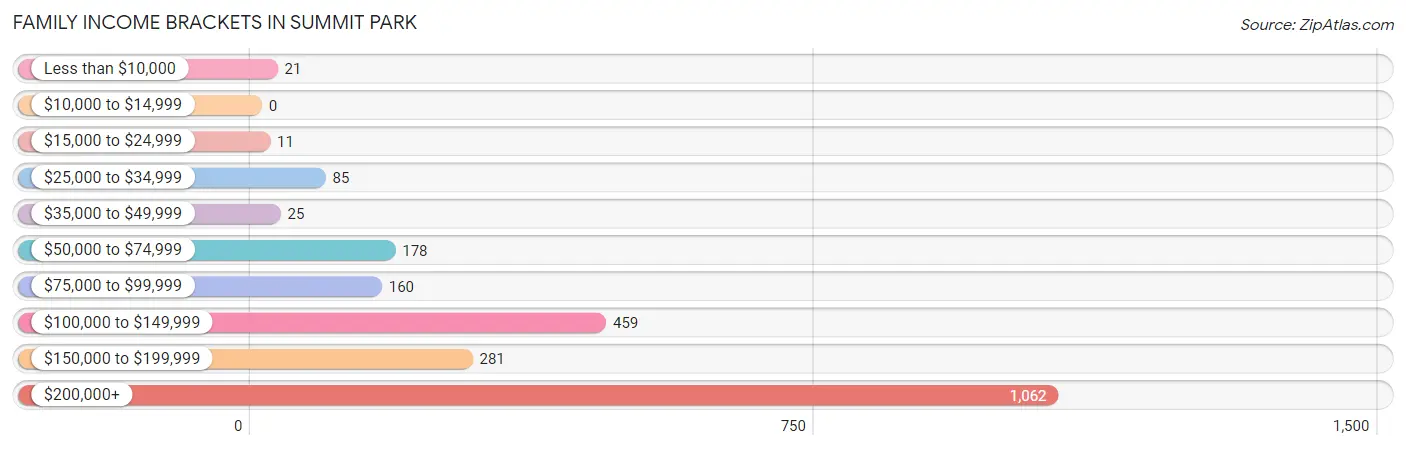
| Income Bracket | # Families | % Families |
| Less than $10,000 | 21 | 0.9% |
| $10,000 to $14,999 | 0 | 0.0% |
| $15,000 to $24,999 | 11 | 0.5% |
| $25,000 to $34,999 | 85 | 3.7% |
| $35,000 to $49,999 | 25 | 1.1% |
| $50,000 to $74,999 | 178 | 7.8% |
| $75,000 to $99,999 | 160 | 7.0% |
| $100,000 to $149,999 | 459 | 20.1% |
| $150,000 to $199,999 | 281 | 12.3% |
| $200,000+ | 1,062 | 46.5% |
Family Income by Famaliy Size in Summit Park
5-person families (153 | 6.7%) account for the highest median family income in Summit Park with $250,001 per family, while 2-person families (1,246 | 54.5%) have the highest median income of $74,219 per family member.
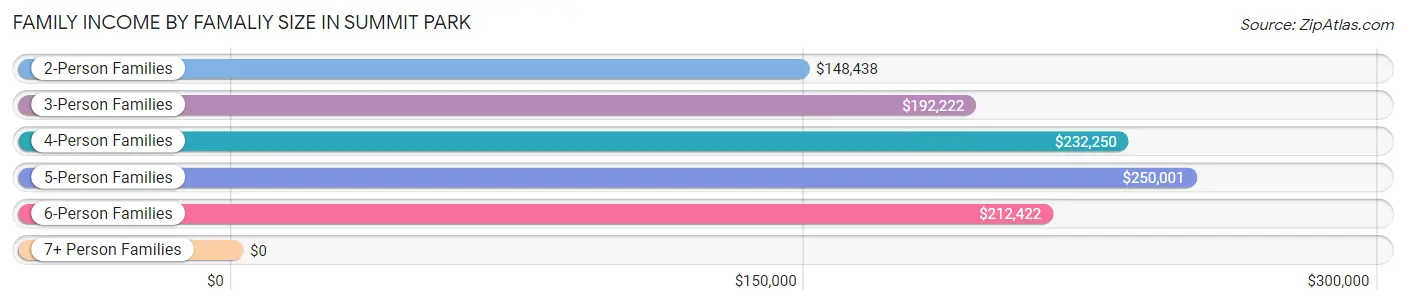
| Income Bracket | # Families | Median Income |
| 2-Person Families | 1,246 (54.5%) | $148,438 |
| 3-Person Families | 360 (15.8%) | $192,222 |
| 4-Person Families | 442 (19.4%) | $232,250 |
| 5-Person Families | 153 (6.7%) | $250,001 |
| 6-Person Families | 77 (3.4%) | $212,422 |
| 7+ Person Families | 6 (0.3%) | $0 |
| Total | 2,284 (100.0%) | $176,333 |
Family Income by Number of Earners in Summit Park
The median family income in Summit Park is $176,333, with families comprising 2 earners (1,118) having the highest median family income of $231,538, while families with no earners (310) have the lowest median family income of $136,158, accounting for 48.9% and 13.6% of families, respectively.
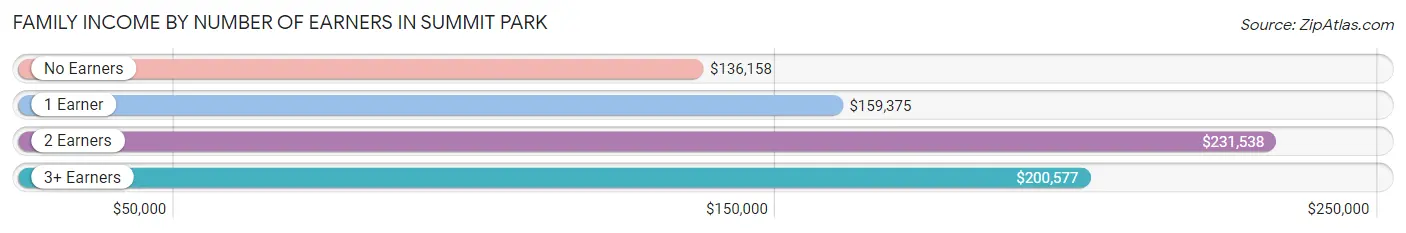
| Number of Earners | # Families | Median Income |
| No Earners | 310 (13.6%) | $136,158 |
| 1 Earner | 618 (27.1%) | $159,375 |
| 2 Earners | 1,118 (48.9%) | $231,538 |
| 3+ Earners | 238 (10.4%) | $200,577 |
| Total | 2,284 (100.0%) | $176,333 |
Household Income in Summit Park
Household Income Brackets in Summit Park
With 1,195 households falling in the category, the $200,000+ income range is the most frequent in Summit Park, accounting for 42.9% of all households. In contrast, only 3 households (0.1%) fall into the $10,000 to $14,999 income bracket, making it the least populous group.
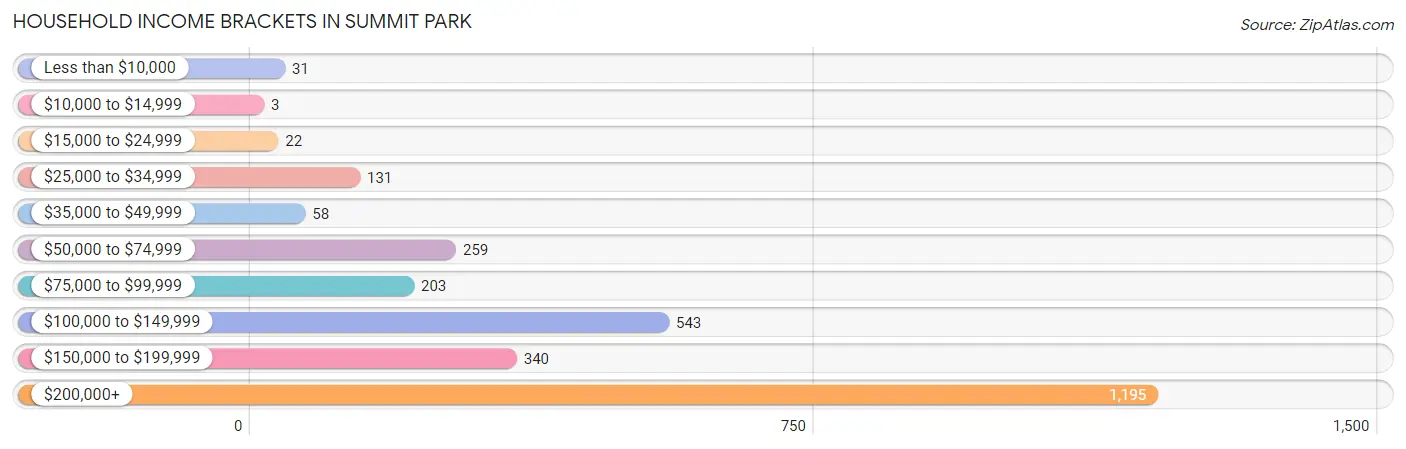
| Income Bracket | # Households | % Households |
| Less than $10,000 | 31 | 1.1% |
| $10,000 to $14,999 | 3 | 0.1% |
| $15,000 to $24,999 | 22 | 0.8% |
| $25,000 to $34,999 | 131 | 4.7% |
| $35,000 to $49,999 | 58 | 2.1% |
| $50,000 to $74,999 | 259 | 9.3% |
| $75,000 to $99,999 | 203 | 7.3% |
| $100,000 to $149,999 | 543 | 19.5% |
| $150,000 to $199,999 | 340 | 12.2% |
| $200,000+ | 1,195 | 42.9% |
Household Income by Householder Age in Summit Park
The median household income in Summit Park is $171,408, with the highest median household income of $214,886 found in the 45 to 64 years age bracket for the primary householder. A total of 1,515 households (54.4%) fall into this category. Meanwhile, the 15 to 24 years age bracket for the primary householder has the lowest median household income of $0, with 24 households (0.9%) in this group.
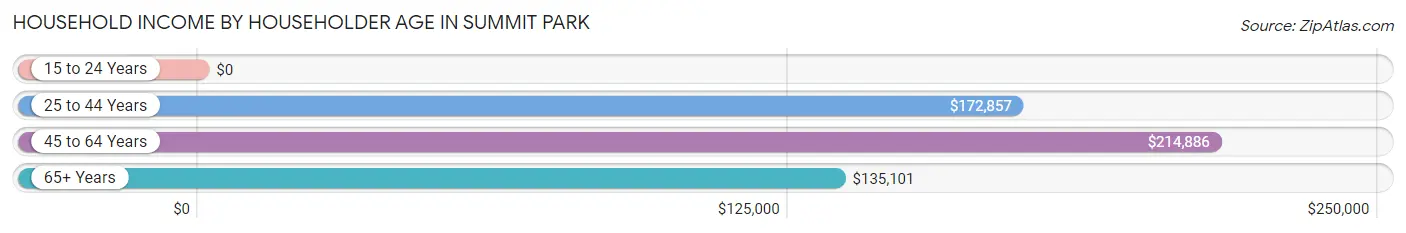
| Income Bracket | # Households | Median Income |
| 15 to 24 Years | 24 (0.9%) | $0 |
| 25 to 44 Years | 634 (22.8%) | $172,857 |
| 45 to 64 Years | 1,515 (54.4%) | $214,886 |
| 65+ Years | 612 (22.0%) | $135,101 |
| Total | 2,785 (100.0%) | $171,408 |
Poverty in Summit Park
Income Below Poverty by Sex and Age in Summit Park
With 2.6% poverty level for males and 4.9% for females among the residents of Summit Park, 16 and 17 year old males and 16 and 17 year old females are the most vulnerable to poverty, with 18 males (18.2%) and 38 females (23.5%) in their respective age groups living below the poverty level.
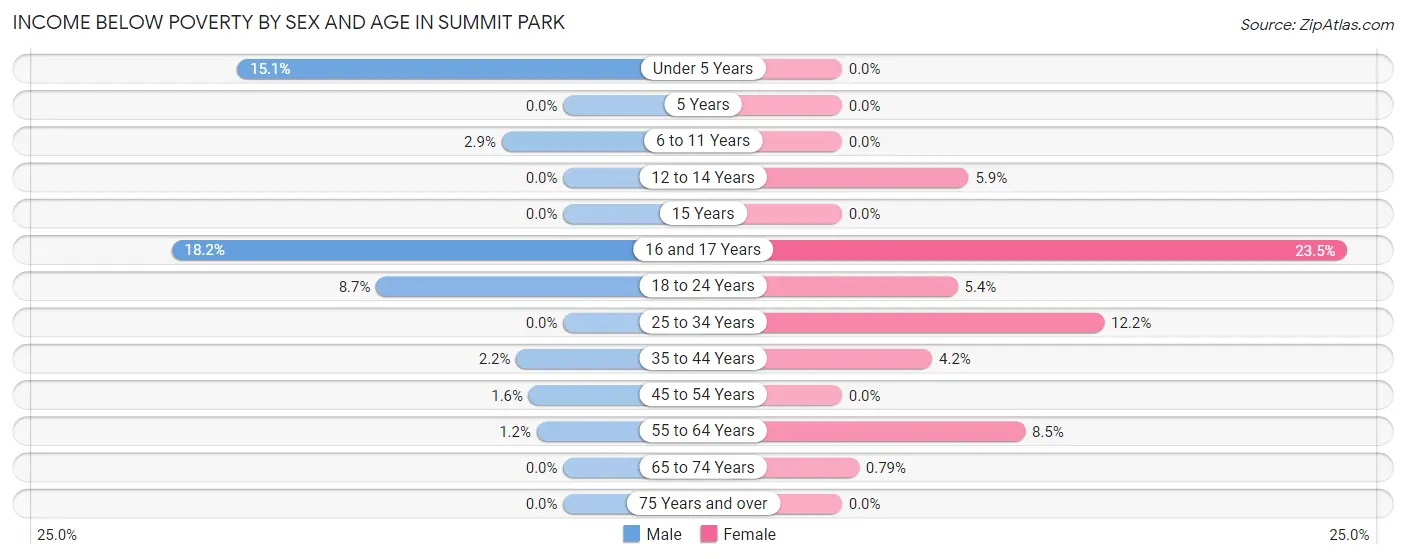
| Age Bracket | Male | Female |
| Under 5 Years | 28 (15.1%) | 0 (0.0%) |
| 5 Years | 0 (0.0%) | 0 (0.0%) |
| 6 to 11 Years | 9 (2.9%) | 0 (0.0%) |
| 12 to 14 Years | 0 (0.0%) | 9 (5.9%) |
| 15 Years | 0 (0.0%) | 0 (0.0%) |
| 16 and 17 Years | 18 (18.2%) | 38 (23.5%) |
| 18 to 24 Years | 29 (8.7%) | 19 (5.4%) |
| 25 to 34 Years | 0 (0.0%) | 51 (12.2%) |
| 35 to 44 Years | 13 (2.2%) | 19 (4.2%) |
| 45 to 54 Years | 11 (1.6%) | 0 (0.0%) |
| 55 to 64 Years | 8 (1.2%) | 72 (8.5%) |
| 65 to 74 Years | 0 (0.0%) | 4 (0.8%) |
| 75 Years and over | 0 (0.0%) | 0 (0.0%) |
| Total | 116 (2.6%) | 212 (4.9%) |
Income Above Poverty by Sex and Age in Summit Park
According to the poverty statistics in Summit Park, males aged 5 years and females aged under 5 years are the age groups that are most secure financially, with 100.0% of males and 100.0% of females in these age groups living above the poverty line.
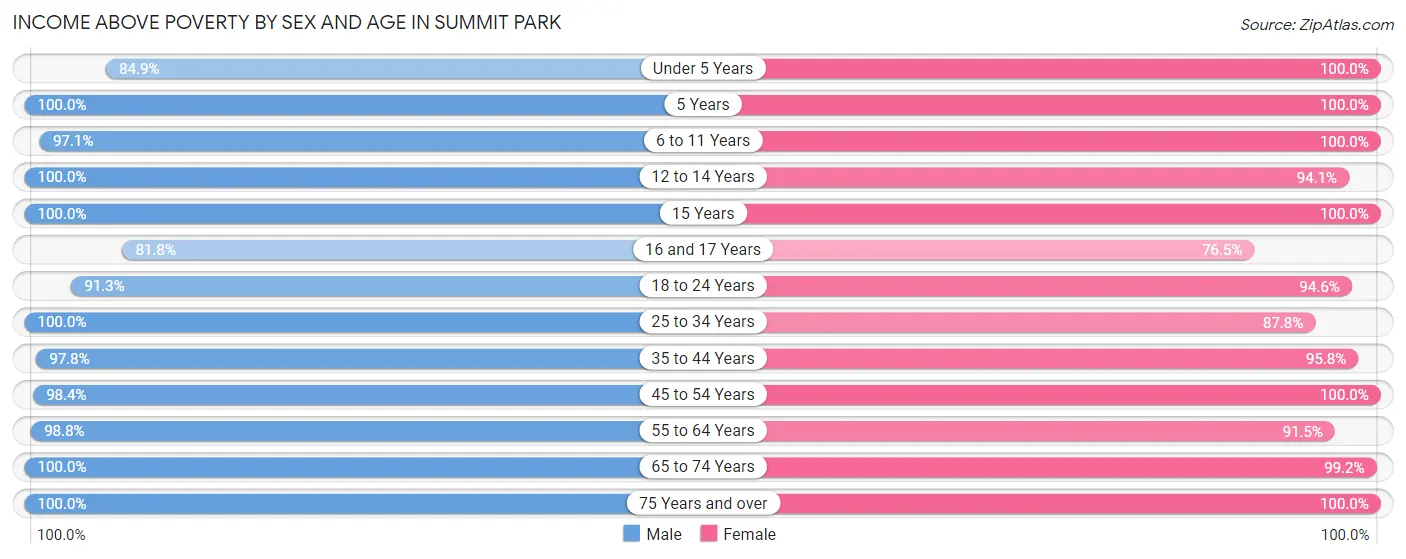
| Age Bracket | Male | Female |
| Under 5 Years | 157 (84.9%) | 154 (100.0%) |
| 5 Years | 40 (100.0%) | 89 (100.0%) |
| 6 to 11 Years | 306 (97.1%) | 411 (100.0%) |
| 12 to 14 Years | 308 (100.0%) | 144 (94.1%) |
| 15 Years | 84 (100.0%) | 20 (100.0%) |
| 16 and 17 Years | 81 (81.8%) | 124 (76.5%) |
| 18 to 24 Years | 305 (91.3%) | 335 (94.6%) |
| 25 to 34 Years | 433 (100.0%) | 368 (87.8%) |
| 35 to 44 Years | 584 (97.8%) | 435 (95.8%) |
| 45 to 54 Years | 677 (98.4%) | 613 (100.0%) |
| 55 to 64 Years | 640 (98.8%) | 775 (91.5%) |
| 65 to 74 Years | 545 (100.0%) | 500 (99.2%) |
| 75 Years and over | 110 (100.0%) | 142 (100.0%) |
| Total | 4,270 (97.4%) | 4,110 (95.1%) |
Income Below Poverty Among Married-Couple Families in Summit Park
The poverty statistics for married-couple families in Summit Park show that 1.6% or 31 of the total 1,927 families live below the poverty line. Families with 1 or 2 children have the highest poverty rate of 4.5%, comprising of 23 families. On the other hand, families with 3 or 4 children have the lowest poverty rate of 0.0%, which includes 0 families.
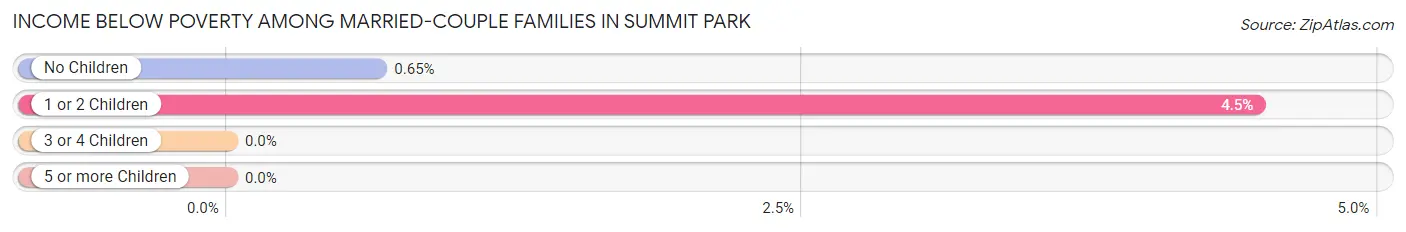
| Children | Above Poverty | Below Poverty |
| No Children | 1,227 (99.4%) | 8 (0.6%) |
| 1 or 2 Children | 492 (95.5%) | 23 (4.5%) |
| 3 or 4 Children | 171 (100.0%) | 0 (0.0%) |
| 5 or more Children | 6 (100.0%) | 0 (0.0%) |
| Total | 1,896 (98.4%) | 31 (1.6%) |
Income Below Poverty Among Single-Parent Households in Summit Park
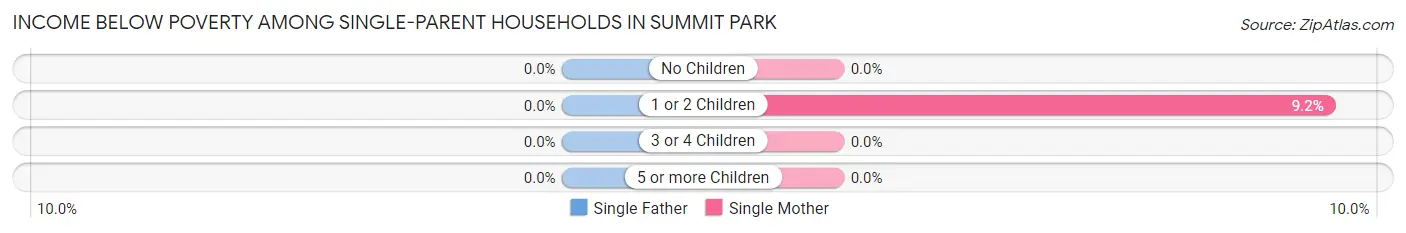
| Children | Single Father | Single Mother |
| No Children | 0 (0.0%) | 0 (0.0%) |
| 1 or 2 Children | 0 (0.0%) | 12 (9.2%) |
| 3 or 4 Children | 0 (0.0%) | 0 (0.0%) |
| 5 or more Children | 0 (0.0%) | 0 (0.0%) |
| Total | 0 (0.0%) | 12 (4.7%) |
Income Below Poverty Among Married-Couple vs Single-Parent Households in Summit Park
The poverty data for Summit Park shows that 31 of the married-couple family households (1.6%) and 12 of the single-parent households (3.4%) are living below the poverty level. Within the married-couple family households, those with 1 or 2 children have the highest poverty rate, with 23 households (4.5%) falling below the poverty line. Among the single-parent households, those with 1 or 2 children have the highest poverty rate, with 12 household (5.8%) living below poverty.
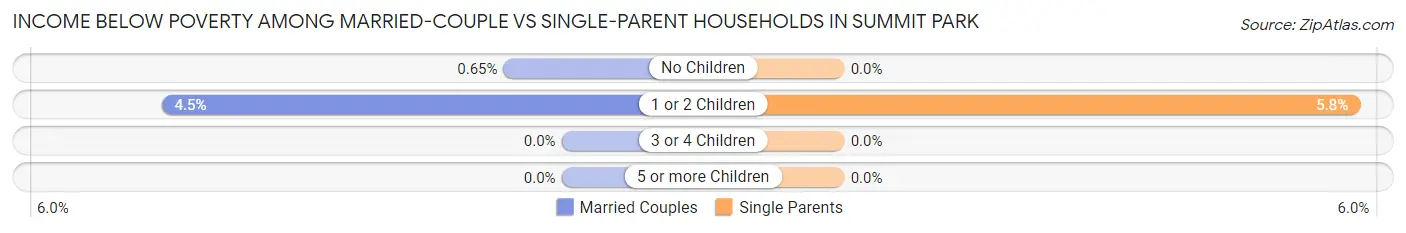
| Children | Married-Couple Families | Single-Parent Households |
| No Children | 8 (0.6%) | 0 (0.0%) |
| 1 or 2 Children | 23 (4.5%) | 12 (5.8%) |
| 3 or 4 Children | 0 (0.0%) | 0 (0.0%) |
| 5 or more Children | 0 (0.0%) | 0 (0.0%) |
| Total | 31 (1.6%) | 12 (3.4%) |
Race in Summit Park
The most populous races in Summit Park are White / Caucasian (7,894 | 90.6%), Hispanic or Latino (632 | 7.3%), and Two or more Races (378 | 4.3%).
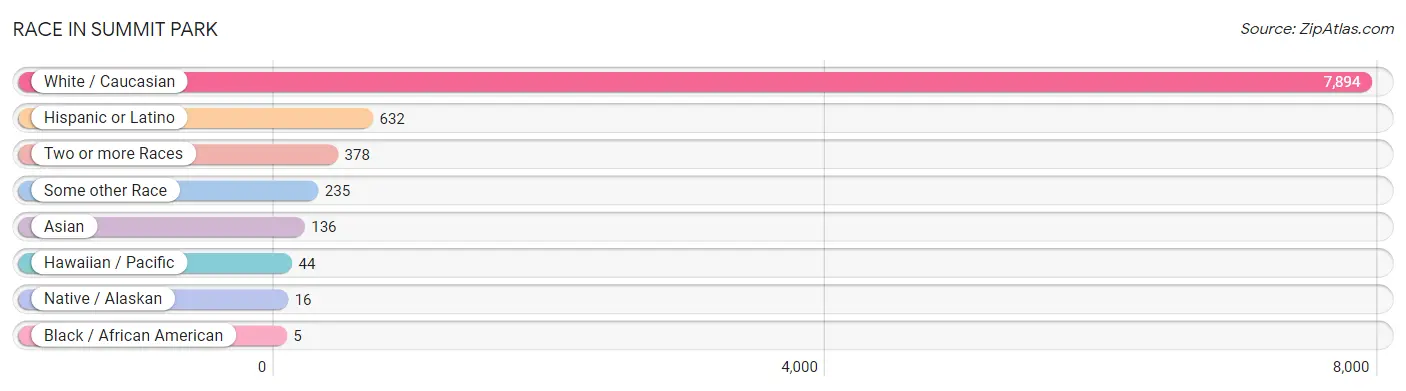
| Race | # Population | % Population |
| Asian | 136 | 1.6% |
| Black / African American | 5 | 0.1% |
| Hawaiian / Pacific | 44 | 0.5% |
| Hispanic or Latino | 632 | 7.3% |
| Native / Alaskan | 16 | 0.2% |
| White / Caucasian | 7,894 | 90.6% |
| Two or more Races | 378 | 4.3% |
| Some other Race | 235 | 2.7% |
| Total | 8,708 | 100.0% |
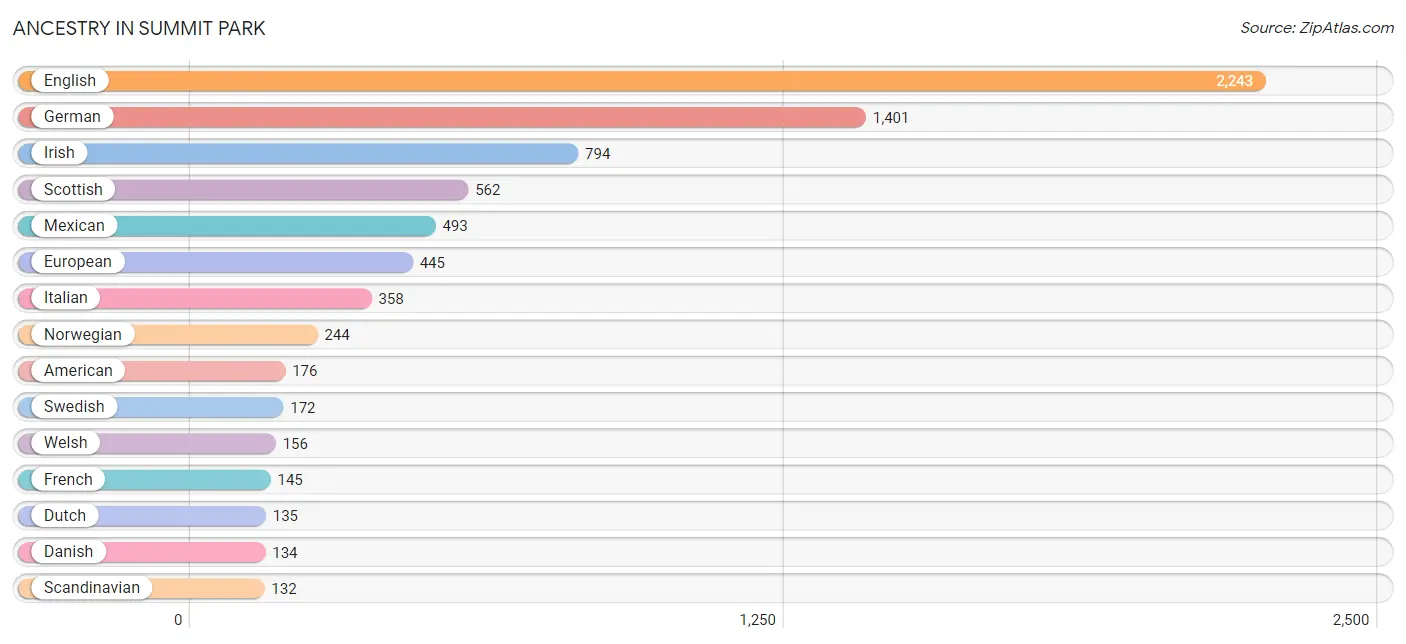
Ancestry in Summit Park
The most populous ancestries reported in Summit Park are English (2,243 | 25.8%), German (1,401 | 16.1%), Irish (794 | 9.1%), Scottish (562 | 6.5%), and Mexican (493 | 5.7%), together accounting for 63.1% of all Summit Park residents.
| Ancestry | # Population | % Population |
| American | 176 | 2.0% |
| Arab | 32 | 0.4% |
| Australian | 29 | 0.3% |
| Austrian | 20 | 0.2% |
| Belgian | 8 | 0.1% |
| Bhutanese | 16 | 0.2% |
| British | 128 | 1.5% |
| Bulgarian | 6 | 0.1% |
| Canadian | 46 | 0.5% |
| Central American Indian | 16 | 0.2% |
| Cherokee | 114 | 1.3% |
| Choctaw | 24 | 0.3% |
| Colombian | 15 | 0.2% |
| Croatian | 12 | 0.1% |
| Czech | 45 | 0.5% |
| Czechoslovakian | 6 | 0.1% |
| Danish | 134 | 1.5% |
| Dutch | 135 | 1.5% |
| Eastern European | 43 | 0.5% |
| English | 2,243 | 25.8% |
| Estonian | 48 | 0.5% |
| European | 445 | 5.1% |
| Finnish | 84 | 1.0% |
| French | 145 | 1.7% |
| French Canadian | 2 | 0.0% |
| German | 1,401 | 16.1% |
| Greek | 62 | 0.7% |
| Guamanian / Chamorro | 44 | 0.5% |
| Haitian | 5 | 0.1% |
| Hungarian | 41 | 0.5% |
| Indian (Asian) | 44 | 0.5% |
| Irish | 794 | 9.1% |
| Italian | 358 | 4.1% |
| Korean | 23 | 0.3% |
| Latvian | 5 | 0.1% |
| Lithuanian | 9 | 0.1% |
| Mexican | 493 | 5.7% |
| Mexican American Indian | 16 | 0.2% |
| Northern European | 75 | 0.9% |
| Norwegian | 244 | 2.8% |
| Pakistani | 38 | 0.4% |
| Palestinian | 32 | 0.4% |
| Peruvian | 5 | 0.1% |
| Polish | 116 | 1.3% |
| Portuguese | 34 | 0.4% |
| Russian | 42 | 0.5% |
| Scandinavian | 132 | 1.5% |
| Scotch-Irish | 42 | 0.5% |
| Scottish | 562 | 6.5% |
| Serbian | 54 | 0.6% |
| Slovak | 8 | 0.1% |
| South American | 103 | 1.2% |
| Spaniard | 33 | 0.4% |
| Sri Lankan | 28 | 0.3% |
| Swedish | 172 | 2.0% |
| Swiss | 131 | 1.5% |
| Thai | 6 | 0.1% |
| Venezuelan | 83 | 0.9% |
| Welsh | 156 | 1.8% | View All 59 Rows |
Immigrants in Summit Park
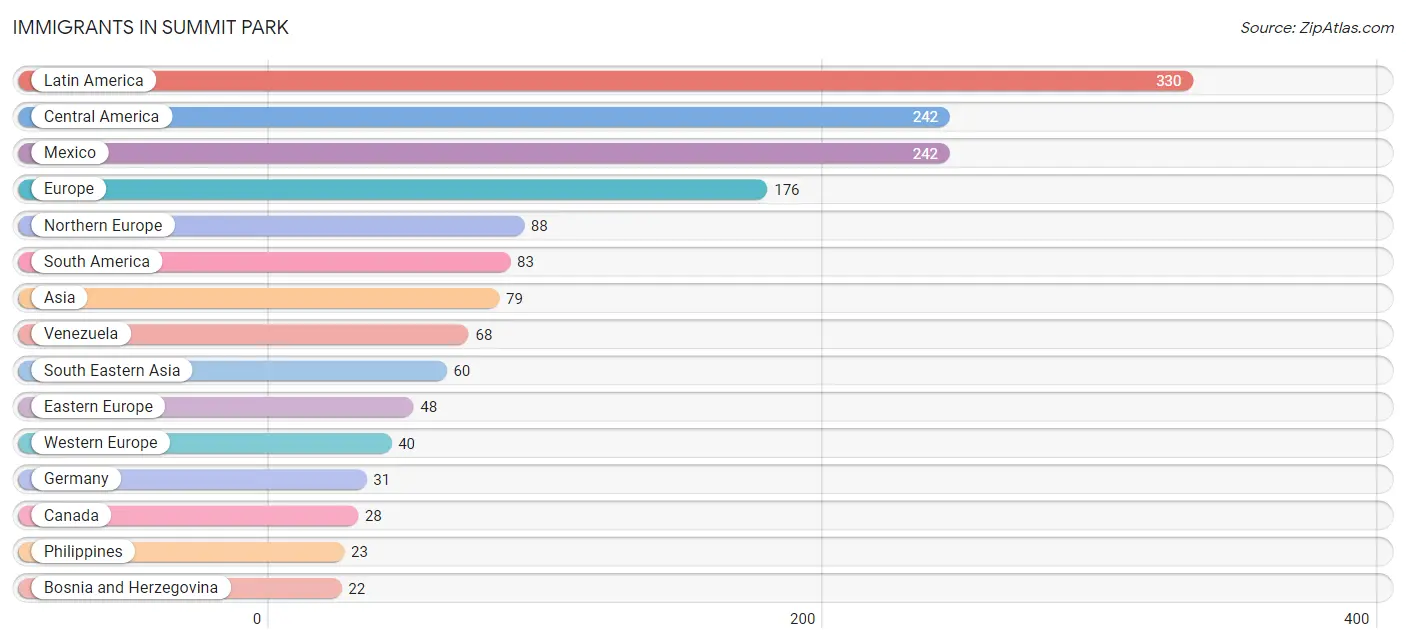
The most numerous immigrant groups reported in Summit Park came from Latin America (330 | 3.8%), Central America (242 | 2.8%), Mexico (242 | 2.8%), Europe (176 | 2.0%), and Northern Europe (88 | 1.0%), together accounting for 12.4% of all Summit Park residents.
| Immigration Origin | # Population | % Population |
| Africa | 7 | 0.1% |
| Asia | 79 | 0.9% |
| Australia | 6 | 0.1% |
| Bosnia and Herzegovina | 22 | 0.3% |
| Bulgaria | 6 | 0.1% |
| Canada | 28 | 0.3% |
| Caribbean | 5 | 0.1% |
| Central America | 242 | 2.8% |
| Colombia | 15 | 0.2% |
| Eastern Asia | 7 | 0.1% |
| Eastern Europe | 48 | 0.5% |
| England | 10 | 0.1% |
| Europe | 176 | 2.0% |
| Germany | 31 | 0.4% |
| Haiti | 5 | 0.1% |
| India | 6 | 0.1% |
| Japan | 7 | 0.1% |
| Laos | 15 | 0.2% |
| Latin America | 330 | 3.8% |
| Mexico | 242 | 2.8% |
| Netherlands | 9 | 0.1% |
| Northern Europe | 88 | 1.0% |
| Oceania | 6 | 0.1% |
| Philippines | 23 | 0.3% |
| Russia | 20 | 0.2% |
| South Africa | 7 | 0.1% |
| South America | 83 | 0.9% |
| South Central Asia | 6 | 0.1% |
| South Eastern Asia | 60 | 0.7% |
| Sweden | 3 | 0.0% |
| Thailand | 22 | 0.3% |
| Venezuela | 68 | 0.8% |
| Western Asia | 6 | 0.1% |
| Western Europe | 40 | 0.5% | View All 34 Rows |
Sex and Age in Summit Park
Sex and Age in Summit Park
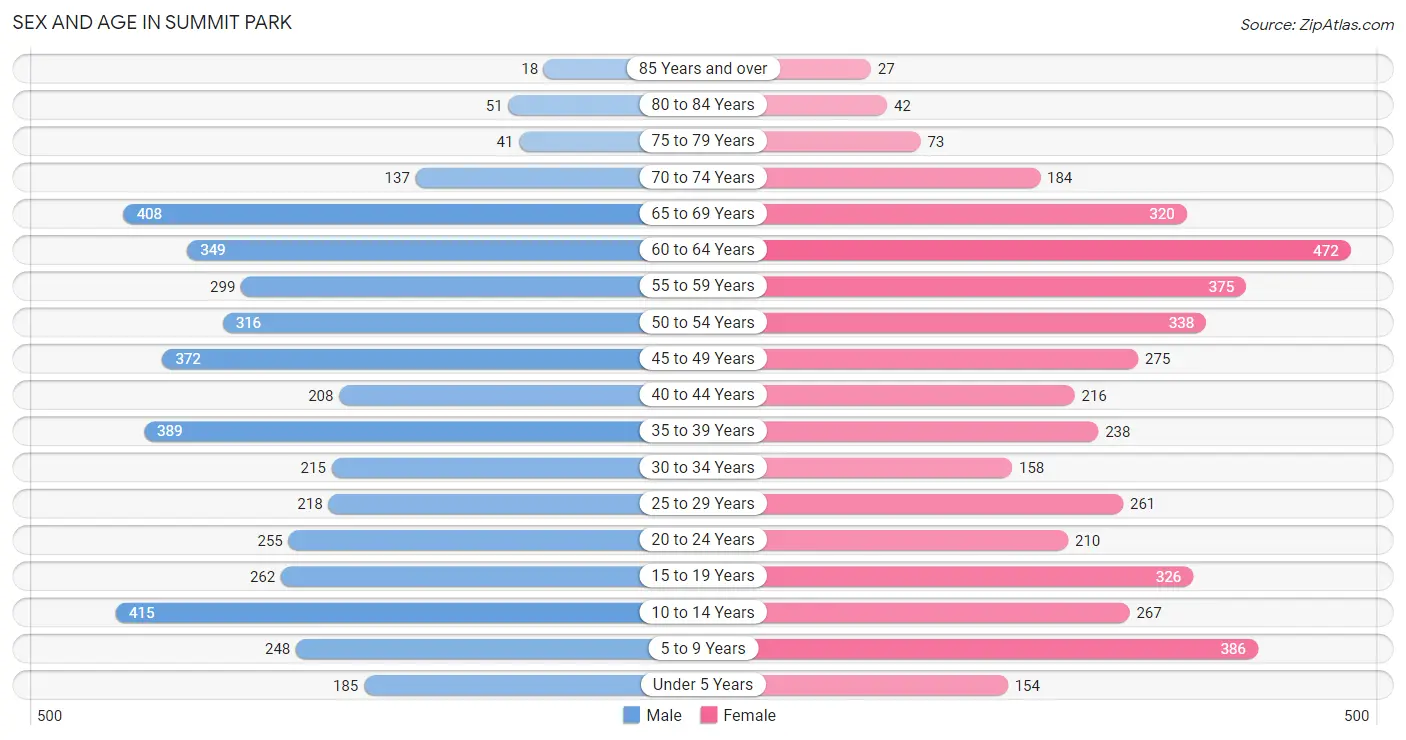
The most populous age groups in Summit Park are 10 to 14 Years (415 | 9.5%) for men and 60 to 64 Years (472 | 10.9%) for women.
| Age Bracket | Male | Female |
| Under 5 Years | 185 (4.2%) | 154 (3.6%) |
| 5 to 9 Years | 248 (5.7%) | 386 (8.9%) |
| 10 to 14 Years | 415 (9.5%) | 267 (6.2%) |
| 15 to 19 Years | 262 (6.0%) | 326 (7.5%) |
| 20 to 24 Years | 255 (5.8%) | 210 (4.9%) |
| 25 to 29 Years | 218 (5.0%) | 261 (6.0%) |
| 30 to 34 Years | 215 (4.9%) | 158 (3.7%) |
| 35 to 39 Years | 389 (8.9%) | 238 (5.5%) |
| 40 to 44 Years | 208 (4.7%) | 216 (5.0%) |
| 45 to 49 Years | 372 (8.5%) | 275 (6.4%) |
| 50 to 54 Years | 316 (7.2%) | 338 (7.8%) |
| 55 to 59 Years | 299 (6.8%) | 375 (8.7%) |
| 60 to 64 Years | 349 (8.0%) | 472 (10.9%) |
| 65 to 69 Years | 408 (9.3%) | 320 (7.4%) |
| 70 to 74 Years | 137 (3.1%) | 184 (4.3%) |
| 75 to 79 Years | 41 (0.9%) | 73 (1.7%) |
| 80 to 84 Years | 51 (1.2%) | 42 (1.0%) |
| 85 Years and over | 18 (0.4%) | 27 (0.6%) |
| Total | 4,386 (100.0%) | 4,322 (100.0%) |
Families and Households in Summit Park
Median Family Size in Summit Park
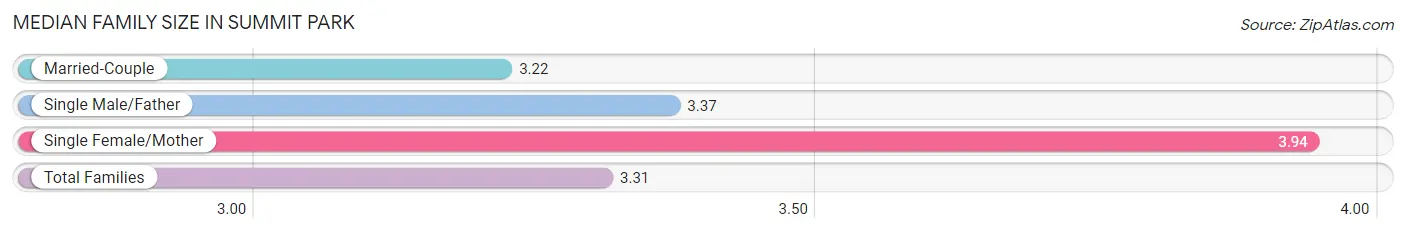
The median family size in Summit Park is 3.31 persons per family, with single female/mother families (255 | 11.2%) accounting for the largest median family size of 3.94 persons per family. On the other hand, married-couple families (1,927 | 84.4%) represent the smallest median family size with 3.22 persons per family.
| Family Type | # Families | Family Size |
| Married-Couple | 1,927 (84.4%) | 3.22 |
| Single Male/Father | 102 (4.5%) | 3.37 |
| Single Female/Mother | 255 (11.2%) | 3.94 |
| Total Families | 2,284 (100.0%) | 3.31 |
Median Household Size in Summit Park
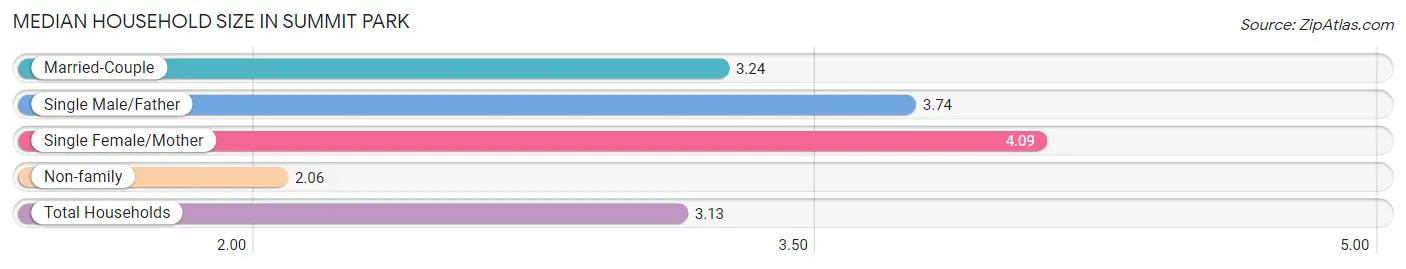
The median household size in Summit Park is 3.13 persons per household, with single female/mother households (255 | 9.2%) accounting for the largest median household size of 4.09 persons per household. non-family households (501 | 18.0%) represent the smallest median household size with 2.06 persons per household.
| Household Type | # Households | Household Size |
| Married-Couple | 1,927 (69.2%) | 3.24 |
| Single Male/Father | 102 (3.7%) | 3.74 |
| Single Female/Mother | 255 (9.2%) | 4.09 |
| Non-family | 501 (18.0%) | 2.06 |
| Total Households | 2,785 (100.0%) | 3.13 |
Household Size by Marriage Status in Summit Park
Out of a total of 2,785 households in Summit Park, 2,284 (82.0%) are family households, while 501 (18.0%) are nonfamily households. The most numerous type of family households are 2-person households, comprising 1,172, and the most common type of nonfamily households are 1-person households, comprising 292.
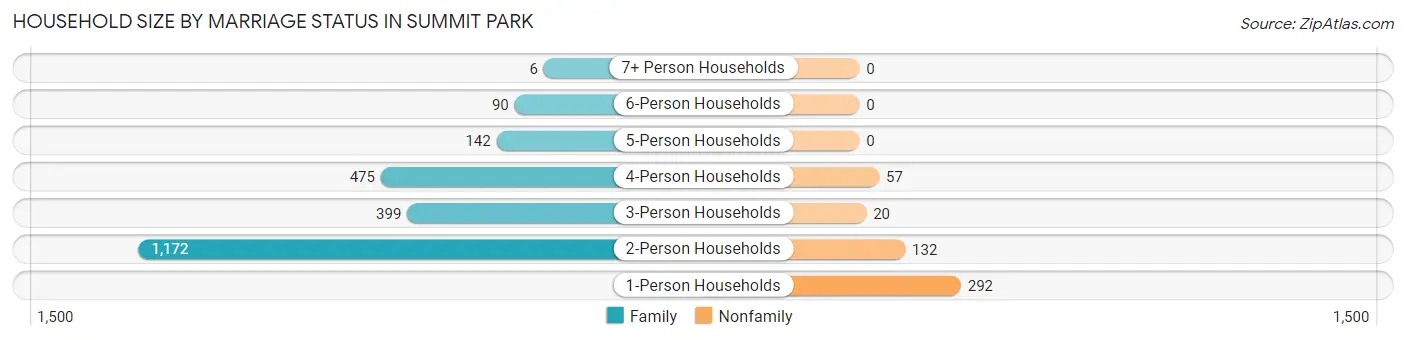
| Household Size | Family Households | Nonfamily Households |
| 1-Person Households | - | 292 (10.5%) |
| 2-Person Households | 1,172 (42.1%) | 132 (4.7%) |
| 3-Person Households | 399 (14.3%) | 20 (0.7%) |
| 4-Person Households | 475 (17.1%) | 57 (2.1%) |
| 5-Person Households | 142 (5.1%) | 0 (0.0%) |
| 6-Person Households | 90 (3.2%) | 0 (0.0%) |
| 7+ Person Households | 6 (0.2%) | 0 (0.0%) |
| Total | 2,284 (82.0%) | 501 (18.0%) |
Female Fertility in Summit Park
Fertility by Age in Summit Park
Average fertility rate in Summit Park is 30.0 births per 1,000 women. Women in the age bracket of 20 to 34 years have the highest fertility rate with 79.0 births per 1,000 women. Women in the age bracket of 20 to 34 years acount for 96.2% of all women with births.
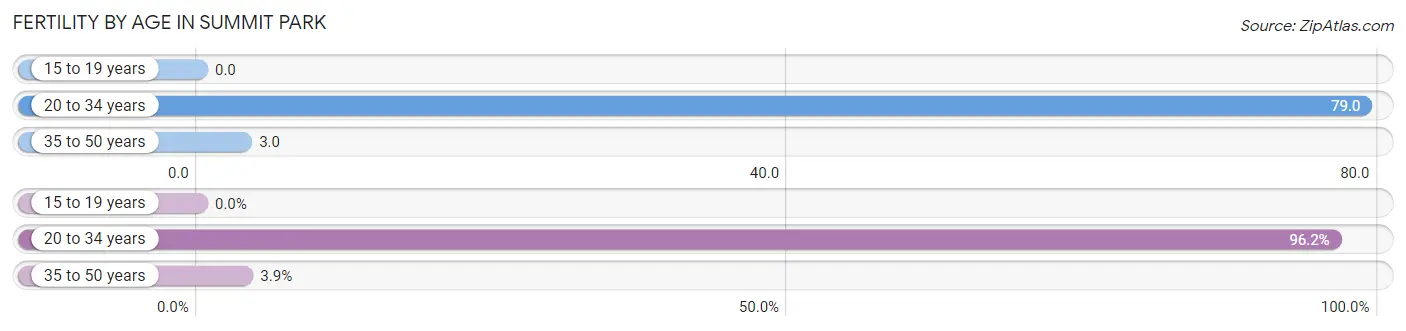
| Age Bracket | Women with Births | Births / 1,000 Women |
| 15 to 19 years | 0 (0.0%) | 0.0 |
| 20 to 34 years | 50 (96.2%) | 79.0 |
| 35 to 50 years | 2 (3.8%) | 3.0 |
| Total | 52 (100.0%) | 30.0 |
Fertility by Age by Marriage Status in Summit Park
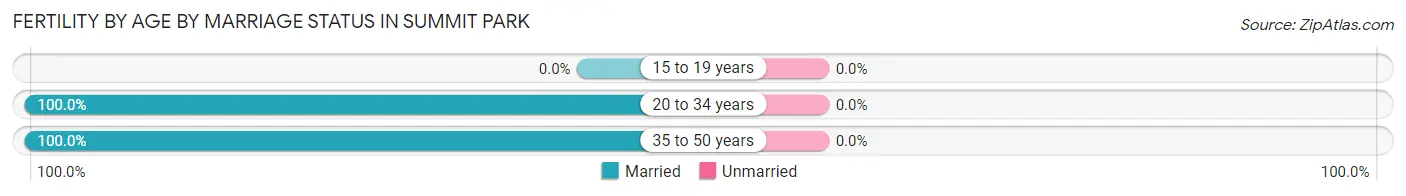
| Age Bracket | Married | Unmarried |
| 15 to 19 years | 0 (0.0%) | 0 (0.0%) |
| 20 to 34 years | 50 (100.0%) | 0 (0.0%) |
| 35 to 50 years | 2 (100.0%) | 0 (0.0%) |
| Total | 52 (100.0%) | 0 (0.0%) |
Fertility by Education in Summit Park
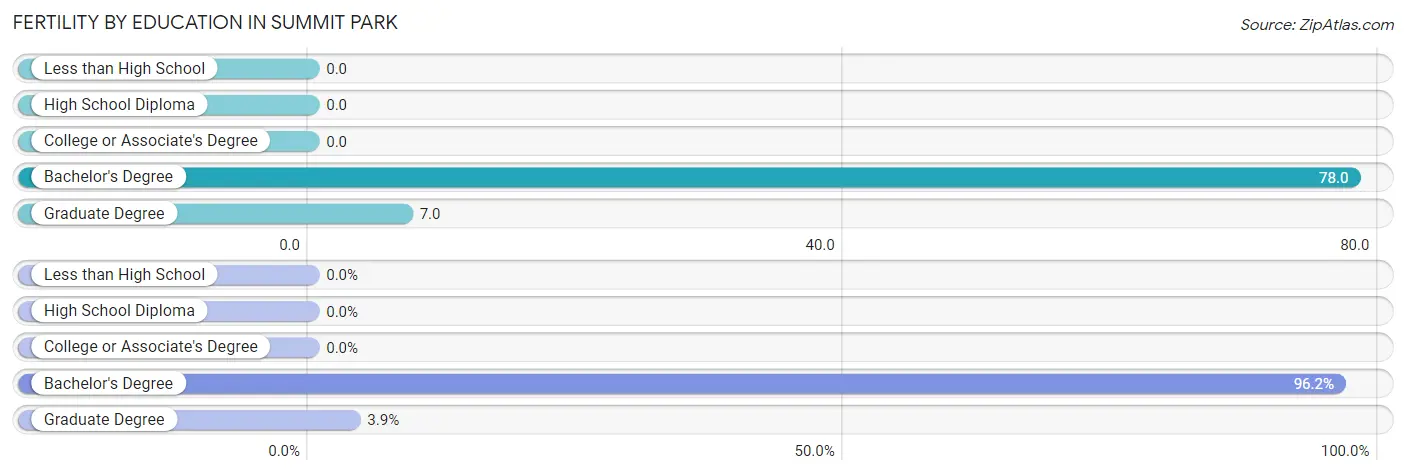
| Educational Attainment | Women with Births | Births / 1,000 Women |
| Less than High School | 0 (0.0%) | 0.0 |
| High School Diploma | 0 (0.0%) | 0.0 |
| College or Associate's Degree | 0 (0.0%) | 0.0 |
| Bachelor's Degree | 50 (96.2%) | 78.0 |
| Graduate Degree | 2 (3.8%) | 7.0 |
| Total | 52 (100.0%) | 30.0 |
Fertility by Education by Marriage Status in Summit Park
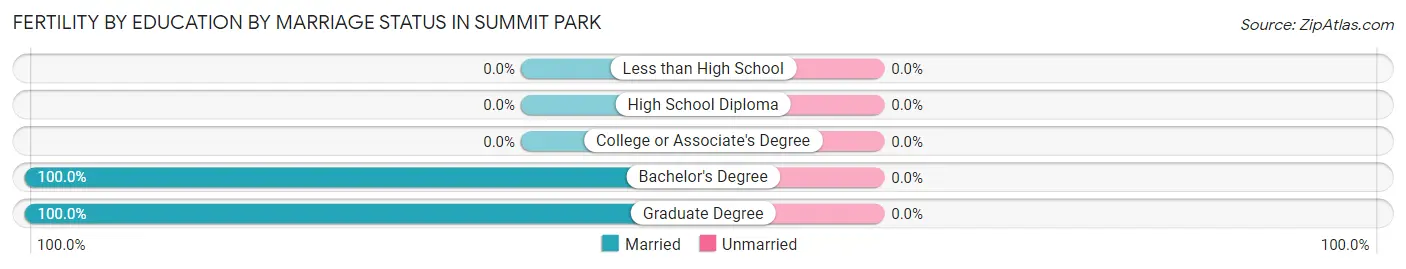
| Educational Attainment | Married | Unmarried |
| Less than High School | 0 (0.0%) | 0 (0.0%) |
| High School Diploma | 0 (0.0%) | 0 (0.0%) |
| College or Associate's Degree | 0 (0.0%) | 0 (0.0%) |
| Bachelor's Degree | 50 (100.0%) | 0 (0.0%) |
| Graduate Degree | 2 (100.0%) | 0 (0.0%) |
| Total | 52 (100.0%) | 0 (0.0%) |
Employment Characteristics in Summit Park
Employment by Class of Employer in Summit Park
Among the 4,744 employed individuals in Summit Park, private company employees (3,079 | 64.9%), not-for-profit organizations (557 | 11.7%), and self-employed (not incorporated) (301 | 6.3%) make up the most common classes of employment.
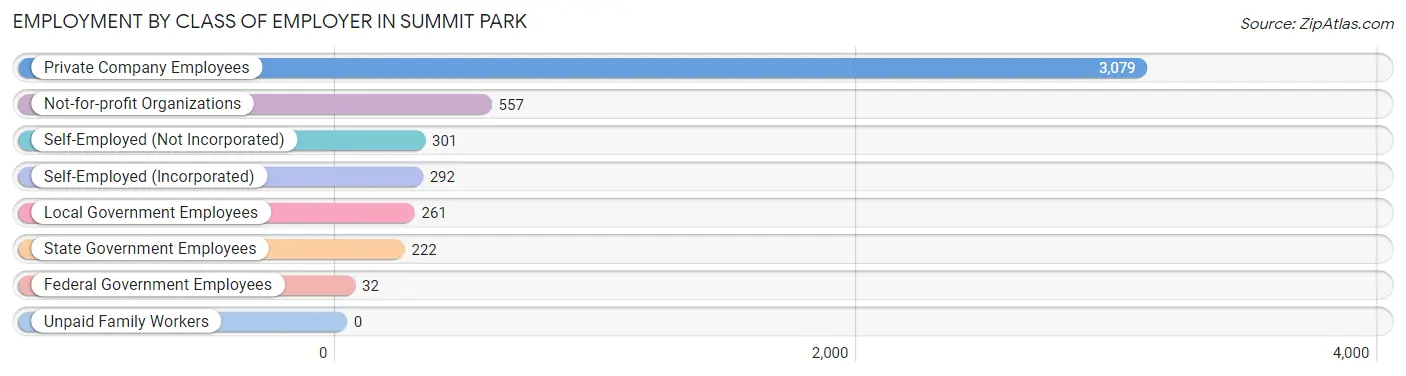
| Employer Class | # Employees | % Employees |
| Private Company Employees | 3,079 | 64.9% |
| Self-Employed (Incorporated) | 292 | 6.2% |
| Self-Employed (Not Incorporated) | 301 | 6.3% |
| Not-for-profit Organizations | 557 | 11.7% |
| Local Government Employees | 261 | 5.5% |
| State Government Employees | 222 | 4.7% |
| Federal Government Employees | 32 | 0.7% |
| Unpaid Family Workers | 0 | 0.0% |
| Total | 4,744 | 100.0% |
Employment Status by Age in Summit Park
According to the labor force statistics for Summit Park, out of the total population over 16 years of age (6,949), 71.3% or 4,955 individuals are in the labor force, with 3.4% or 168 of them unemployed. The age group with the highest labor force participation rate is 25 to 29 years, with 91.4% or 438 individuals in the labor force. Within the labor force, the 25 to 29 years age range has the highest percentage of unemployed individuals, with 18.3% or 80 of them being unemployed.
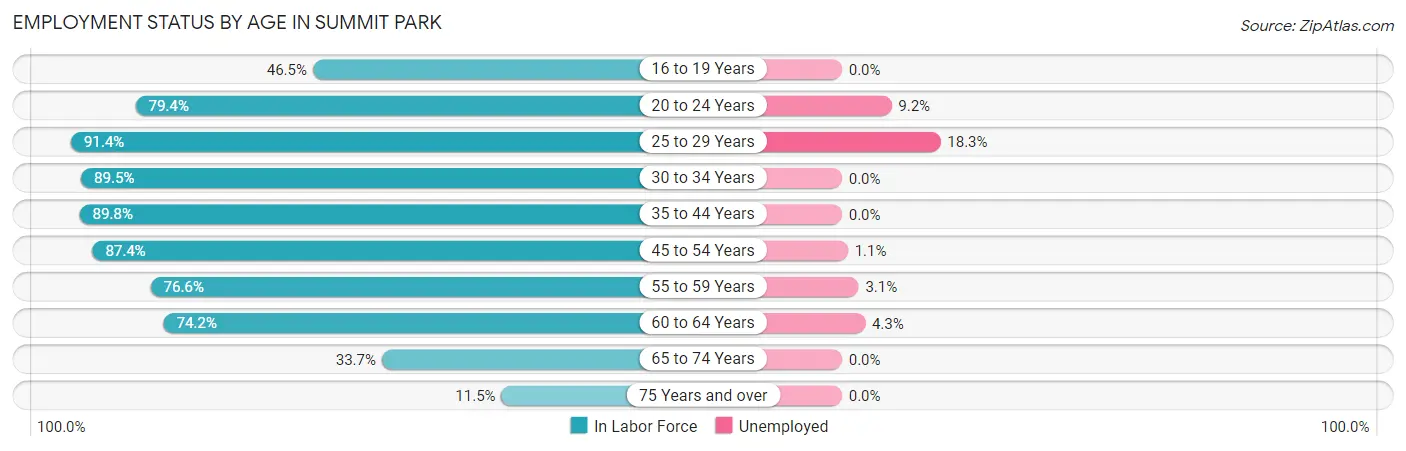
| Age Bracket | In Labor Force | Unemployed |
| 16 to 19 Years | 225 (46.5%) | 0 (0.0%) |
| 20 to 24 Years | 369 (79.4%) | 34 (9.2%) |
| 25 to 29 Years | 438 (91.4%) | 80 (18.3%) |
| 30 to 34 Years | 334 (89.5%) | 0 (0.0%) |
| 35 to 44 Years | 944 (89.8%) | 0 (0.0%) |
| 45 to 54 Years | 1,137 (87.4%) | 13 (1.1%) |
| 55 to 59 Years | 516 (76.6%) | 16 (3.1%) |
| 60 to 64 Years | 609 (74.2%) | 26 (4.3%) |
| 65 to 74 Years | 354 (33.7%) | 0 (0.0%) |
| 75 Years and over | 29 (11.5%) | 0 (0.0%) |
| Total | 4,955 (71.3%) | 168 (3.4%) |
Employment Status by Educational Attainment in Summit Park
According to labor force statistics for Summit Park, 84.7% of individuals (3,980) out of the total population between 25 and 64 years of age (4,699) are in the labor force, with 3.4% or 135 of them being unemployed. The group with the highest labor force participation rate are those with the educational attainment of bachelor's degree or higher, with 87.2% or 2,858 individuals in the labor force. Within the labor force, individuals with bachelor's degree or higher education have the highest percentage of unemployment, with 4.4% or 126 of them being unemployed.
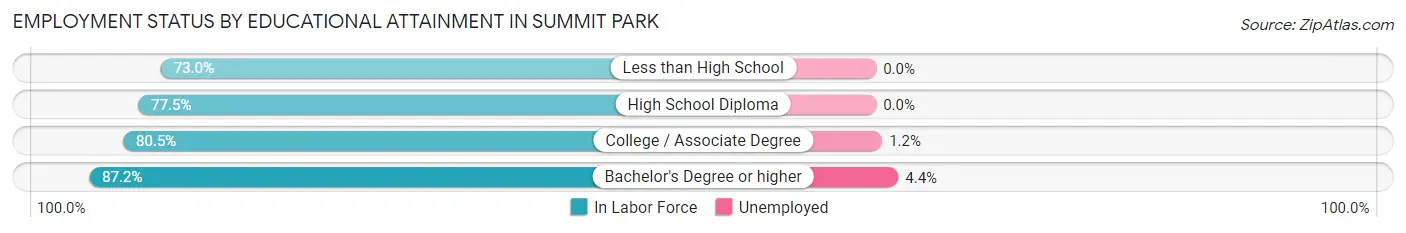
| Educational Attainment | In Labor Force | Unemployed |
| Less than High School | 92 (73.0%) | 0 (0.0%) |
| High School Diploma | 382 (77.5%) | 0 (0.0%) |
| College / Associate Degree | 646 (80.5%) | 10 (1.2%) |
| Bachelor's Degree or higher | 2,858 (87.2%) | 144 (4.4%) |
| Total | 3,980 (84.7%) | 160 (3.4%) |
Employment Occupations by Sex in Summit Park
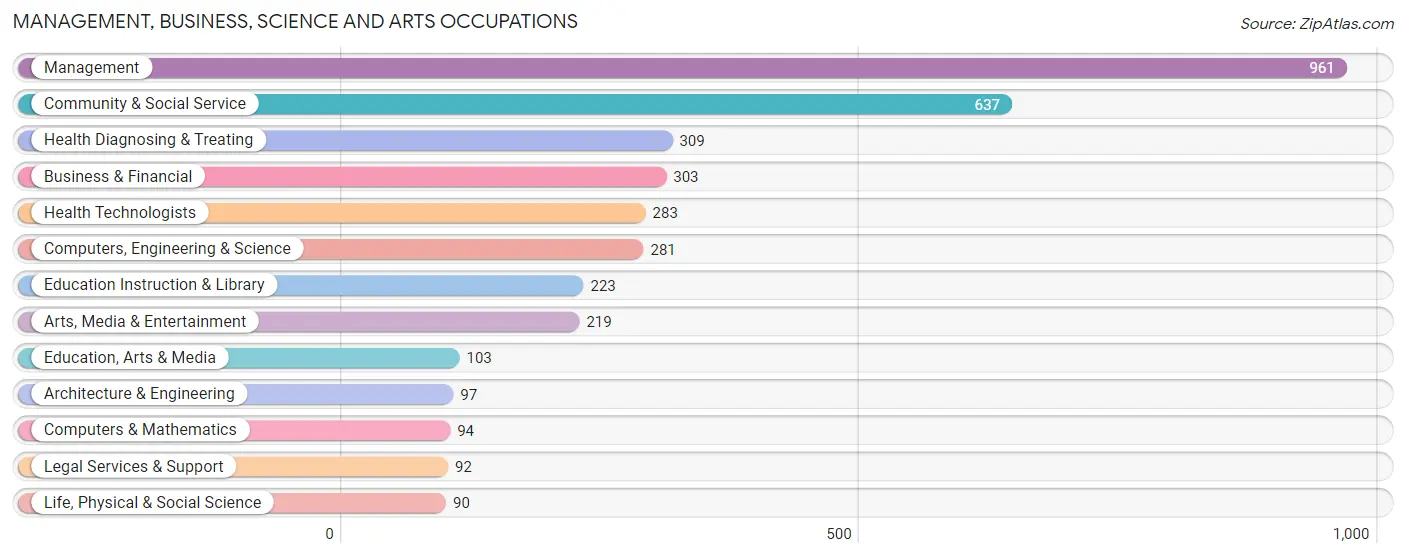
Management, Business, Science and Arts Occupations
The most common Management, Business, Science and Arts occupations in Summit Park are Management (961 | 20.1%), Community & Social Service (637 | 13.3%), Health Diagnosing & Treating (309 | 6.5%), Business & Financial (303 | 6.3%), and Health Technologists (283 | 5.9%).
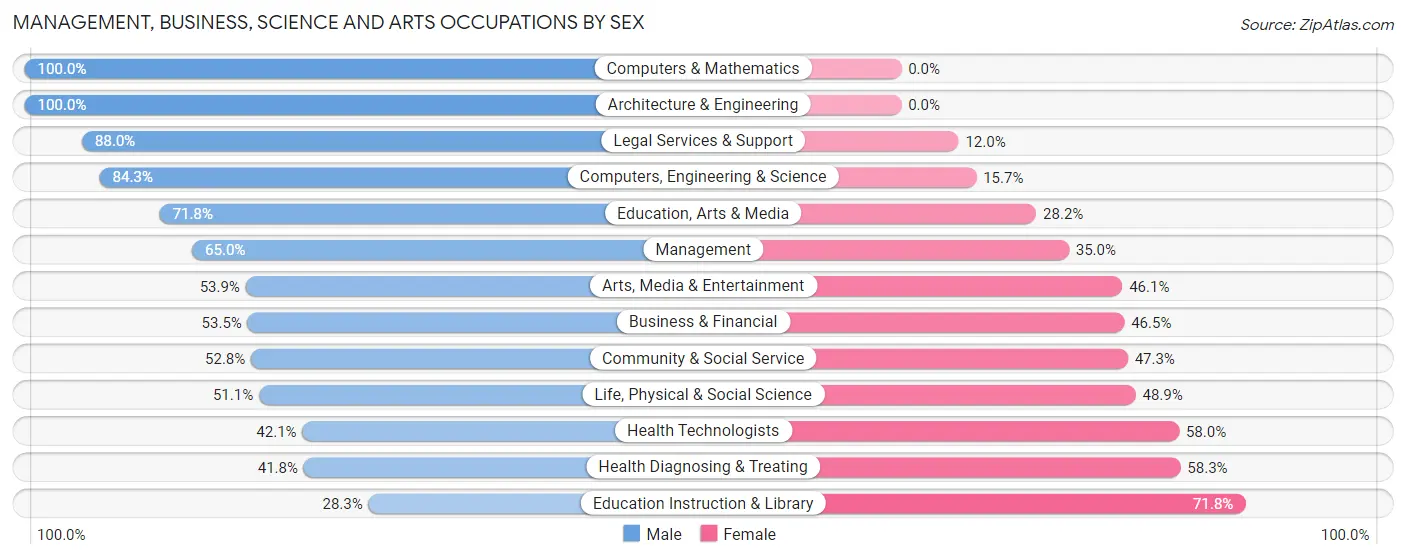
Management, Business, Science and Arts Occupations by Sex
Within the Management, Business, Science and Arts occupations in Summit Park, the most male-oriented occupations are Computers & Mathematics (100.0%), Architecture & Engineering (100.0%), and Legal Services & Support (88.0%), while the most female-oriented occupations are Education Instruction & Library (71.8%), Health Diagnosing & Treating (58.3%), and Health Technologists (58.0%).
| Occupation | Male | Female |
| Management | 625 (65.0%) | 336 (35.0%) |
| Business & Financial | 162 (53.5%) | 141 (46.5%) |
| Computers, Engineering & Science | 237 (84.3%) | 44 (15.7%) |
| Computers & Mathematics | 94 (100.0%) | 0 (0.0%) |
| Architecture & Engineering | 97 (100.0%) | 0 (0.0%) |
| Life, Physical & Social Science | 46 (51.1%) | 44 (48.9%) |
| Community & Social Service | 336 (52.7%) | 301 (47.2%) |
| Education, Arts & Media | 74 (71.8%) | 29 (28.2%) |
| Legal Services & Support | 81 (88.0%) | 11 (12.0%) |
| Education Instruction & Library | 63 (28.2%) | 160 (71.8%) |
| Arts, Media & Entertainment | 118 (53.9%) | 101 (46.1%) |
| Health Diagnosing & Treating | 129 (41.7%) | 180 (58.3%) |
| Health Technologists | 119 (42.0%) | 164 (58.0%) |
| Total (Category) | 1,489 (59.8%) | 1,002 (40.2%) |
| Total (Overall) | 2,588 (54.1%) | 2,198 (45.9%) |
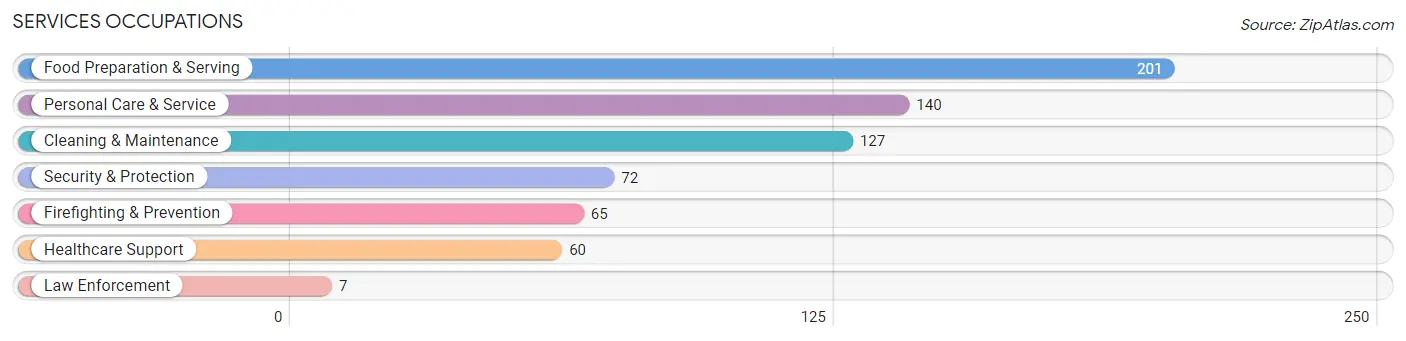
Services Occupations
The most common Services occupations in Summit Park are Food Preparation & Serving (201 | 4.2%), Personal Care & Service (140 | 2.9%), Cleaning & Maintenance (127 | 2.6%), Security & Protection (72 | 1.5%), and Firefighting & Prevention (65 | 1.4%).
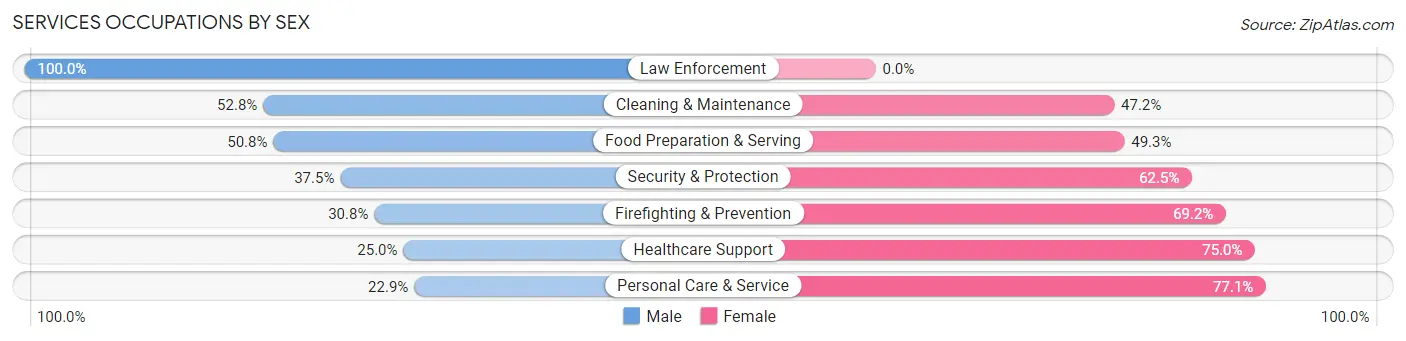
Services Occupations by Sex
Within the Services occupations in Summit Park, the most male-oriented occupations are Law Enforcement (100.0%), Cleaning & Maintenance (52.8%), and Food Preparation & Serving (50.7%), while the most female-oriented occupations are Personal Care & Service (77.1%), Healthcare Support (75.0%), and Firefighting & Prevention (69.2%).
| Occupation | Male | Female |
| Healthcare Support | 15 (25.0%) | 45 (75.0%) |
| Security & Protection | 27 (37.5%) | 45 (62.5%) |
| Firefighting & Prevention | 20 (30.8%) | 45 (69.2%) |
| Law Enforcement | 7 (100.0%) | 0 (0.0%) |
| Food Preparation & Serving | 102 (50.7%) | 99 (49.2%) |
| Cleaning & Maintenance | 67 (52.8%) | 60 (47.2%) |
| Personal Care & Service | 32 (22.9%) | 108 (77.1%) |
| Total (Category) | 243 (40.5%) | 357 (59.5%) |
| Total (Overall) | 2,588 (54.1%) | 2,198 (45.9%) |
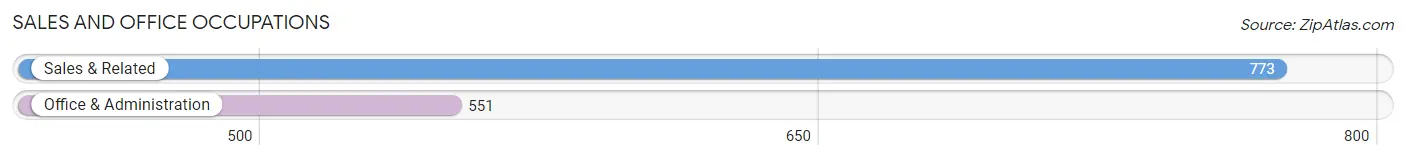
Sales and Office Occupations
The most common Sales and Office occupations in Summit Park are Sales & Related (773 | 16.2%), and Office & Administration (551 | 11.5%).
Sales and Office Occupations by Sex
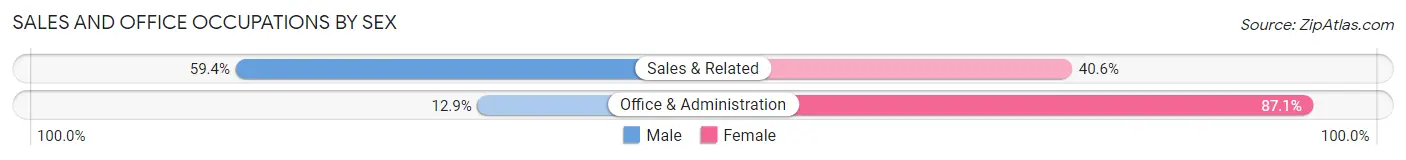
| Occupation | Male | Female |
| Sales & Related | 459 (59.4%) | 314 (40.6%) |
| Office & Administration | 71 (12.9%) | 480 (87.1%) |
| Total (Category) | 530 (40.0%) | 794 (60.0%) |
| Total (Overall) | 2,588 (54.1%) | 2,198 (45.9%) |
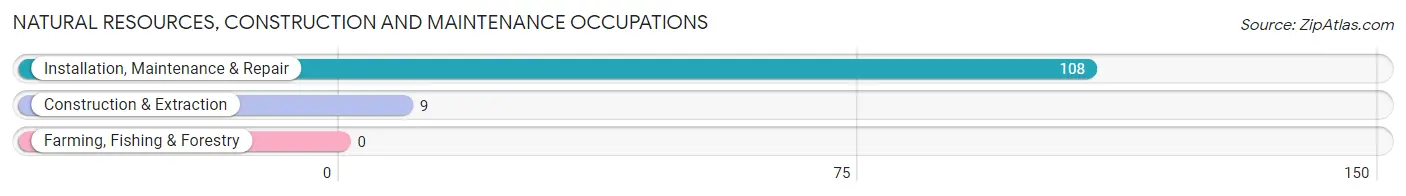
Natural Resources, Construction and Maintenance Occupations
The most common Natural Resources, Construction and Maintenance occupations in Summit Park are Installation, Maintenance & Repair (108 | 2.3%), and Construction & Extraction (9 | 0.2%).
Natural Resources, Construction and Maintenance Occupations by Sex
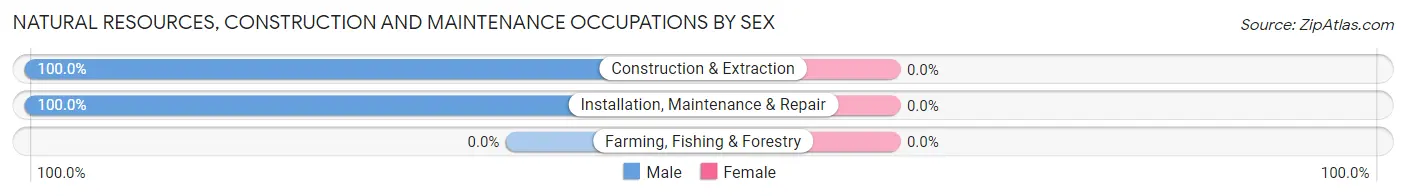
| Occupation | Male | Female |
| Farming, Fishing & Forestry | 0 (0.0%) | 0 (0.0%) |
| Construction & Extraction | 9 (100.0%) | 0 (0.0%) |
| Installation, Maintenance & Repair | 108 (100.0%) | 0 (0.0%) |
| Total (Category) | 117 (100.0%) | 0 (0.0%) |
| Total (Overall) | 2,588 (54.1%) | 2,198 (45.9%) |
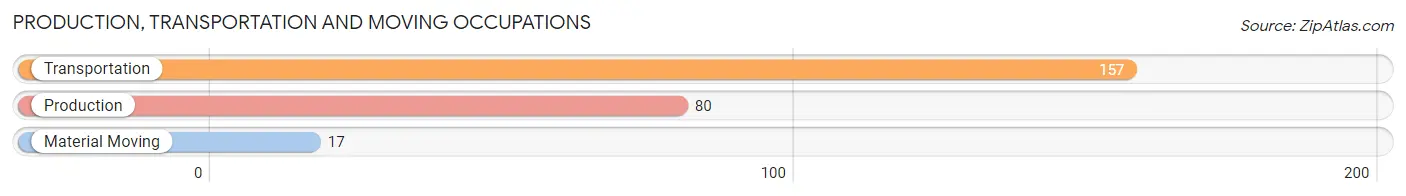
Production, Transportation and Moving Occupations
The most common Production, Transportation and Moving occupations in Summit Park are Transportation (157 | 3.3%), Production (80 | 1.7%), and Material Moving (17 | 0.4%).
Production, Transportation and Moving Occupations by Sex
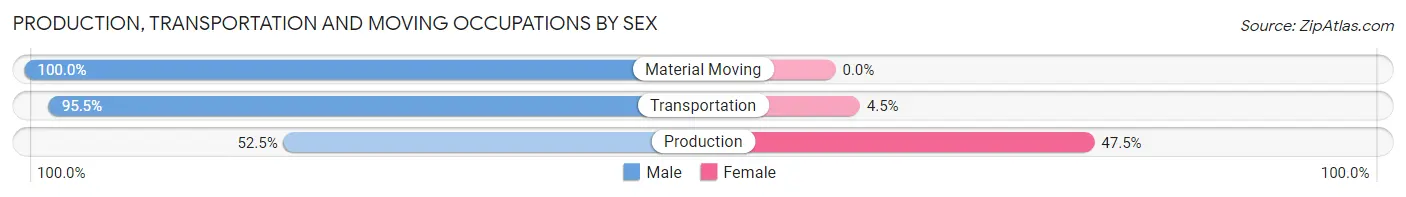
| Occupation | Male | Female |
| Production | 42 (52.5%) | 38 (47.5%) |
| Transportation | 150 (95.5%) | 7 (4.5%) |
| Material Moving | 17 (100.0%) | 0 (0.0%) |
| Total (Category) | 209 (82.3%) | 45 (17.7%) |
| Total (Overall) | 2,588 (54.1%) | 2,198 (45.9%) |
Employment Industries by Sex in Summit Park
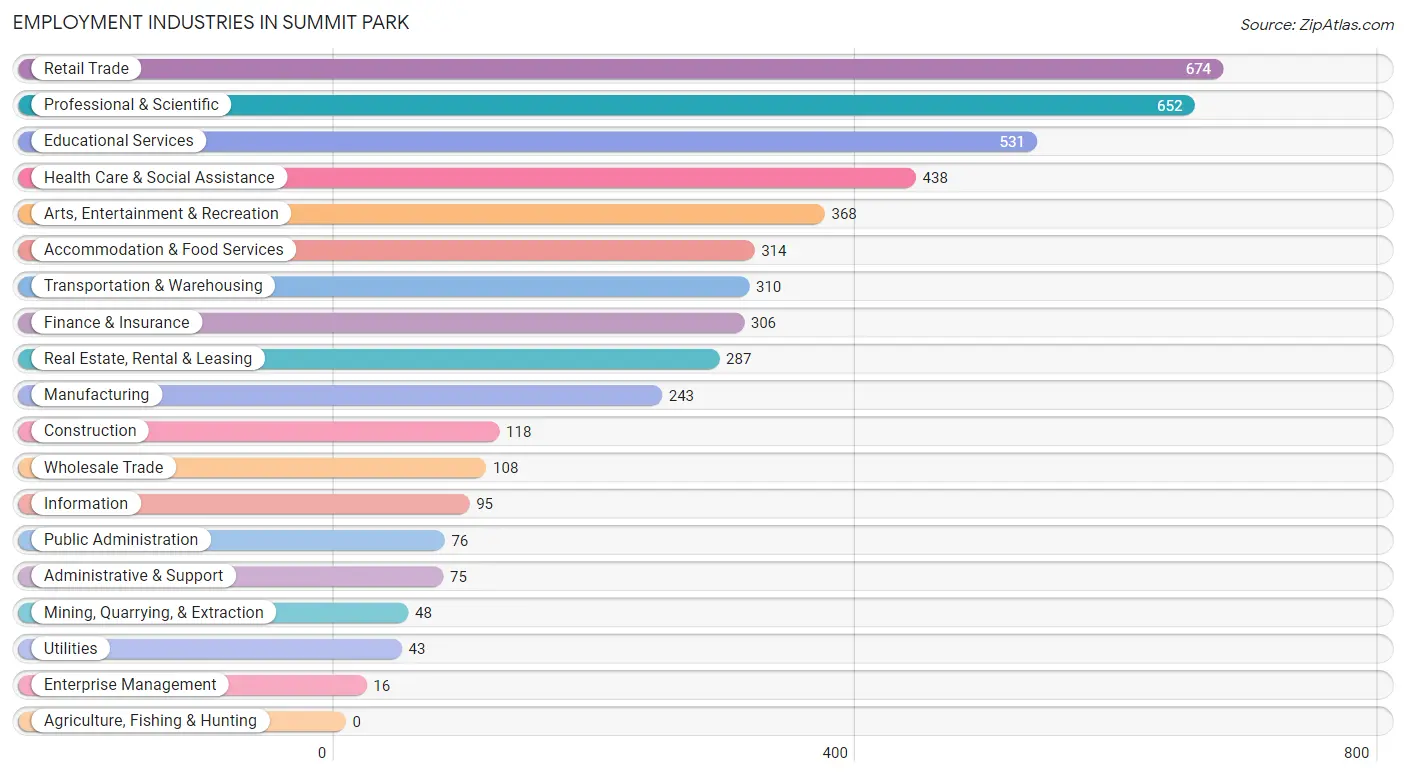
Employment Industries in Summit Park
The major employment industries in Summit Park include Retail Trade (674 | 14.1%), Professional & Scientific (652 | 13.6%), Educational Services (531 | 11.1%), Health Care & Social Assistance (438 | 9.1%), and Arts, Entertainment & Recreation (368 | 7.7%).
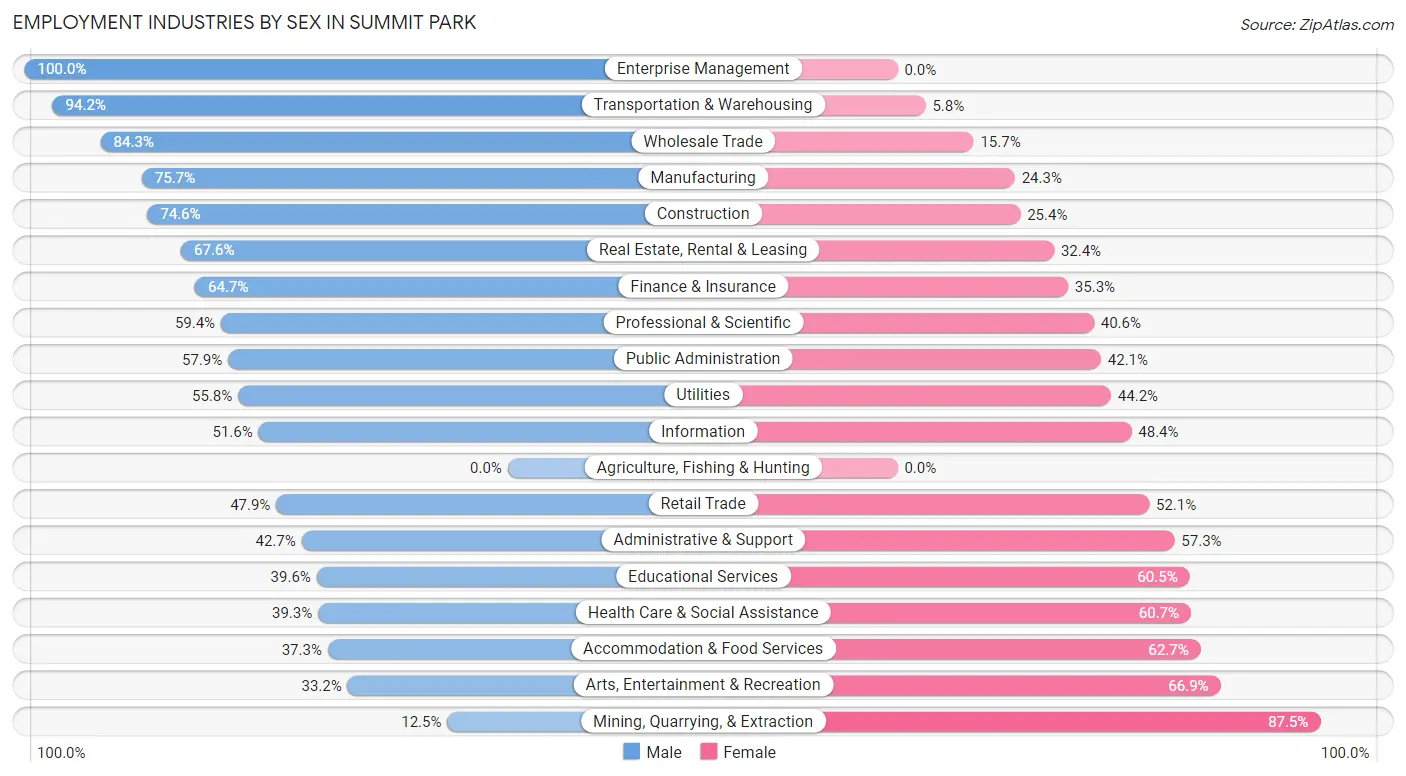
Employment Industries by Sex in Summit Park
The Summit Park industries that see more men than women are Enterprise Management (100.0%), Transportation & Warehousing (94.2%), and Wholesale Trade (84.3%), whereas the industries that tend to have a higher number of women are Mining, Quarrying, & Extraction (87.5%), Arts, Entertainment & Recreation (66.8%), and Accommodation & Food Services (62.7%).
| Industry | Male | Female |
| Agriculture, Fishing & Hunting | 0 (0.0%) | 0 (0.0%) |
| Mining, Quarrying, & Extraction | 6 (12.5%) | 42 (87.5%) |
| Construction | 88 (74.6%) | 30 (25.4%) |
| Manufacturing | 184 (75.7%) | 59 (24.3%) |
| Wholesale Trade | 91 (84.3%) | 17 (15.7%) |
| Retail Trade | 323 (47.9%) | 351 (52.1%) |
| Transportation & Warehousing | 292 (94.2%) | 18 (5.8%) |
| Utilities | 24 (55.8%) | 19 (44.2%) |
| Information | 49 (51.6%) | 46 (48.4%) |
| Finance & Insurance | 198 (64.7%) | 108 (35.3%) |
| Real Estate, Rental & Leasing | 194 (67.6%) | 93 (32.4%) |
| Professional & Scientific | 387 (59.4%) | 265 (40.6%) |
| Enterprise Management | 16 (100.0%) | 0 (0.0%) |
| Administrative & Support | 32 (42.7%) | 43 (57.3%) |
| Educational Services | 210 (39.6%) | 321 (60.5%) |
| Health Care & Social Assistance | 172 (39.3%) | 266 (60.7%) |
| Arts, Entertainment & Recreation | 122 (33.2%) | 246 (66.8%) |
| Accommodation & Food Services | 117 (37.3%) | 197 (62.7%) |
| Public Administration | 44 (57.9%) | 32 (42.1%) |
| Total | 2,588 (54.1%) | 2,198 (45.9%) |
Education in Summit Park
School Enrollment in Summit Park
The most common levels of schooling among the 2,317 students in Summit Park are high school (660 | 28.5%), elementary school (487 | 21.0%), and middle school (485 | 20.9%).
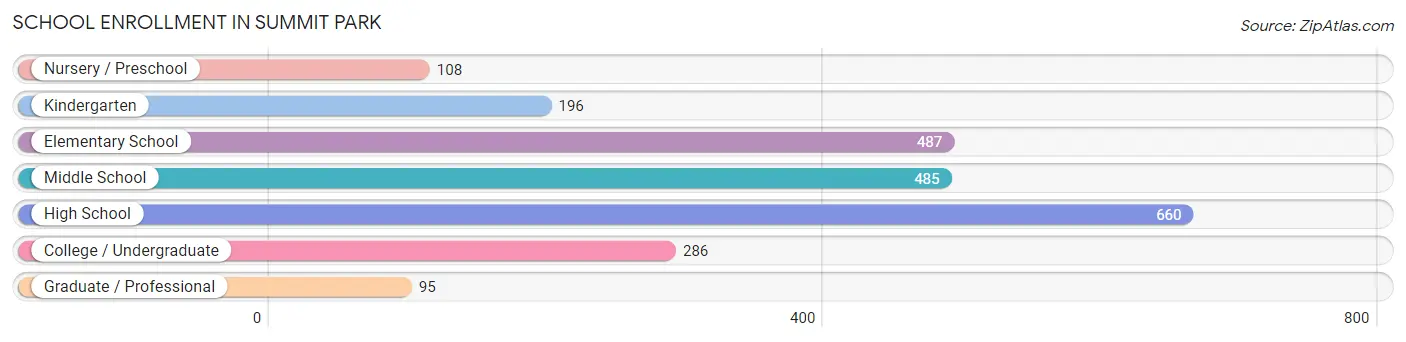
| School Level | # Students | % Students |
| Nursery / Preschool | 108 | 4.7% |
| Kindergarten | 196 | 8.5% |
| Elementary School | 487 | 21.0% |
| Middle School | 485 | 20.9% |
| High School | 660 | 28.5% |
| College / Undergraduate | 286 | 12.3% |
| Graduate / Professional | 95 | 4.1% |
| Total | 2,317 | 100.0% |
School Enrollment by Age by Funding Source in Summit Park
Out of a total of 2,317 students who are enrolled in schools in Summit Park, 338 (14.6%) attend a private institution, while the remaining 1,979 (85.4%) are enrolled in public schools. The age group of 25 to 34 year olds has the highest likelihood of being enrolled in private schools, with 46 (53.5% in the age bracket) enrolled. Conversely, the age group of 10 to 14 year olds has the lowest likelihood of being enrolled in a private school, with 676 (99.1% in the age bracket) attending a public institution.
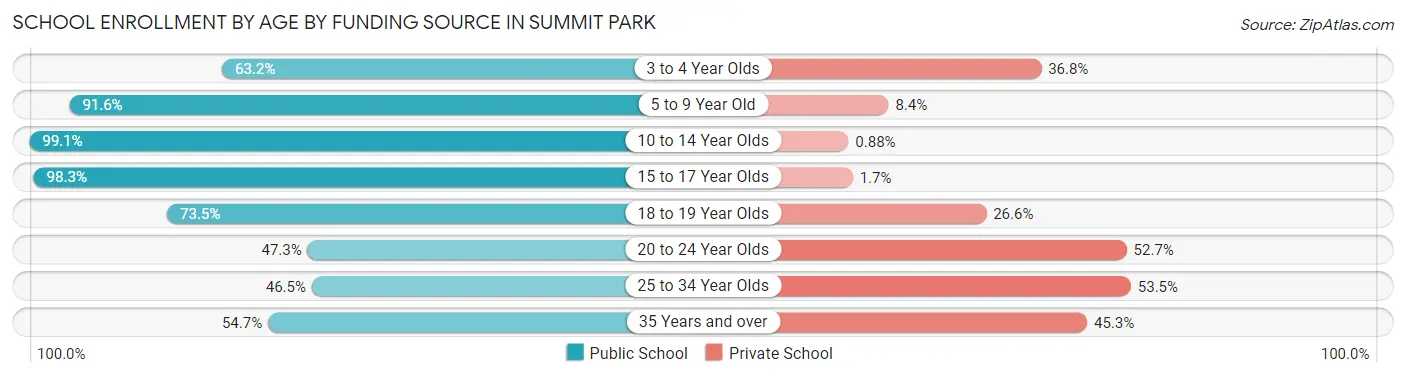
| Age Bracket | Public School | Private School |
| 3 to 4 Year Olds | 67 (63.2%) | 39 (36.8%) |
| 5 to 9 Year Old | 581 (91.6%) | 53 (8.4%) |
| 10 to 14 Year Olds | 676 (99.1%) | 6 (0.9%) |
| 15 to 17 Year Olds | 348 (98.3%) | 6 (1.7%) |
| 18 to 19 Year Olds | 130 (73.5%) | 47 (26.6%) |
| 20 to 24 Year Olds | 96 (47.3%) | 107 (52.7%) |
| 25 to 34 Year Olds | 40 (46.5%) | 46 (53.5%) |
| 35 Years and over | 41 (54.7%) | 34 (45.3%) |
| Total | 1,979 (85.4%) | 338 (14.6%) |
Educational Attainment by Field of Study in Summit Park
Business (864 | 19.6%), arts & humanities (498 | 11.3%), engineering (438 | 9.9%), science & technology (377 | 8.6%), and social sciences (353 | 8.0%) are the most common fields of study among 4,408 individuals in Summit Park who have obtained a bachelor's degree or higher.
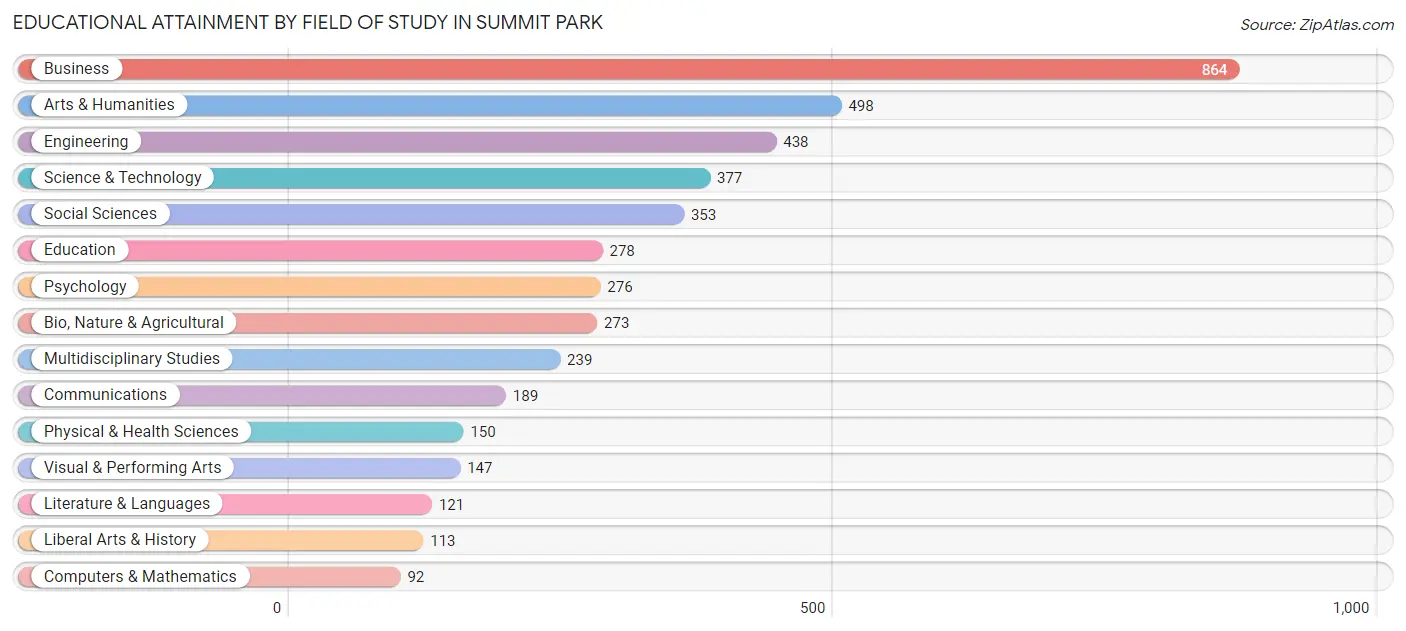
| Field of Study | # Graduates | % Graduates |
| Computers & Mathematics | 92 | 2.1% |
| Bio, Nature & Agricultural | 273 | 6.2% |
| Physical & Health Sciences | 150 | 3.4% |
| Psychology | 276 | 6.3% |
| Social Sciences | 353 | 8.0% |
| Engineering | 438 | 9.9% |
| Multidisciplinary Studies | 239 | 5.4% |
| Science & Technology | 377 | 8.6% |
| Business | 864 | 19.6% |
| Education | 278 | 6.3% |
| Literature & Languages | 121 | 2.8% |
| Liberal Arts & History | 113 | 2.6% |
| Visual & Performing Arts | 147 | 3.3% |
| Communications | 189 | 4.3% |
| Arts & Humanities | 498 | 11.3% |
| Total | 4,408 | 100.0% |
Transportation & Commute in Summit Park
Vehicle Availability by Sex in Summit Park
The most prevalent vehicle ownership categories in Summit Park are males with 2 vehicles (1,074, accounting for 42.0%) and females with 2 vehicles (1,065, making up 49.1%).
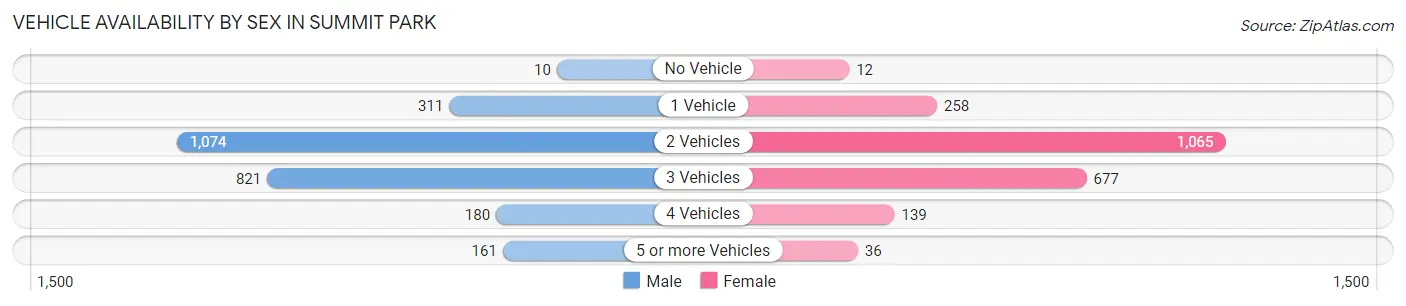
| Vehicles Available | Male | Female |
| No Vehicle | 10 (0.4%) | 12 (0.5%) |
| 1 Vehicle | 311 (12.2%) | 258 (11.8%) |
| 2 Vehicles | 1,074 (42.0%) | 1,065 (48.7%) |
| 3 Vehicles | 821 (32.1%) | 677 (31.0%) |
| 4 Vehicles | 180 (7.0%) | 139 (6.4%) |
| 5 or more Vehicles | 161 (6.3%) | 36 (1.7%) |
| Total | 2,557 (100.0%) | 2,187 (100.0%) |
Commute Time in Summit Park
The most frequently occuring commute durations in Summit Park are 30 to 34 minutes (788 commuters, 20.7%), 20 to 24 minutes (685 commuters, 18.0%), and 15 to 19 minutes (473 commuters, 12.4%).
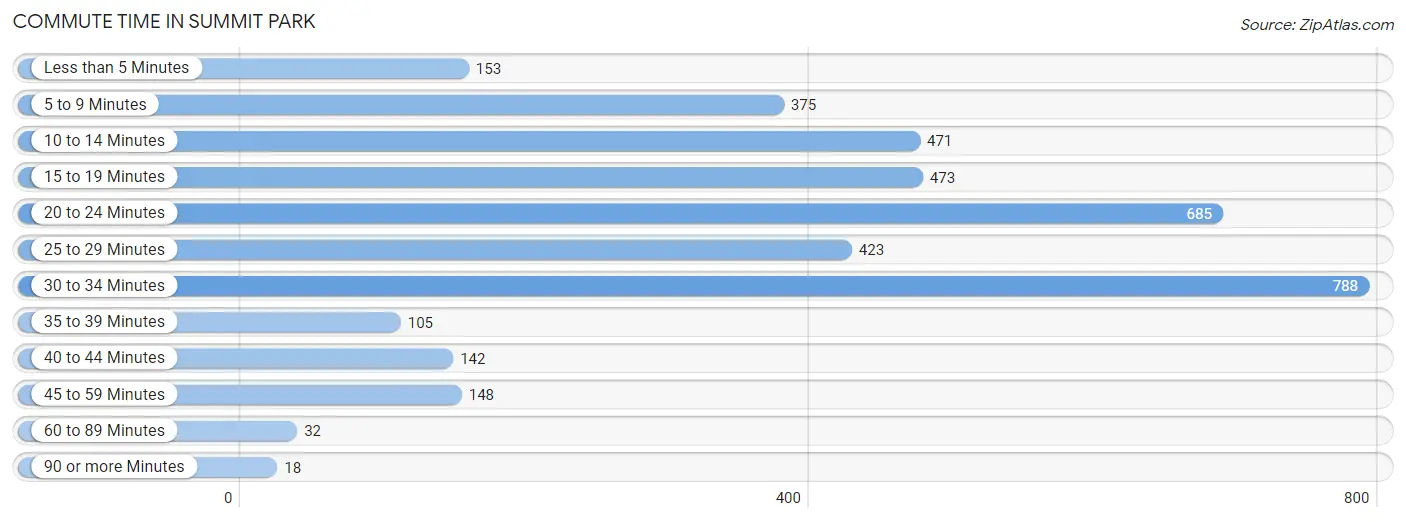
| Commute Time | # Commuters | % Commuters |
| Less than 5 Minutes | 153 | 4.0% |
| 5 to 9 Minutes | 375 | 9.8% |
| 10 to 14 Minutes | 471 | 12.3% |
| 15 to 19 Minutes | 473 | 12.4% |
| 20 to 24 Minutes | 685 | 18.0% |
| 25 to 29 Minutes | 423 | 11.1% |
| 30 to 34 Minutes | 788 | 20.7% |
| 35 to 39 Minutes | 105 | 2.8% |
| 40 to 44 Minutes | 142 | 3.7% |
| 45 to 59 Minutes | 148 | 3.9% |
| 60 to 89 Minutes | 32 | 0.8% |
| 90 or more Minutes | 18 | 0.5% |
Commute Time by Sex in Summit Park
The most common commute times in Summit Park are 30 to 34 minutes (430 commuters, 21.5%) for males and 20 to 24 minutes (425 commuters, 23.4%) for females.
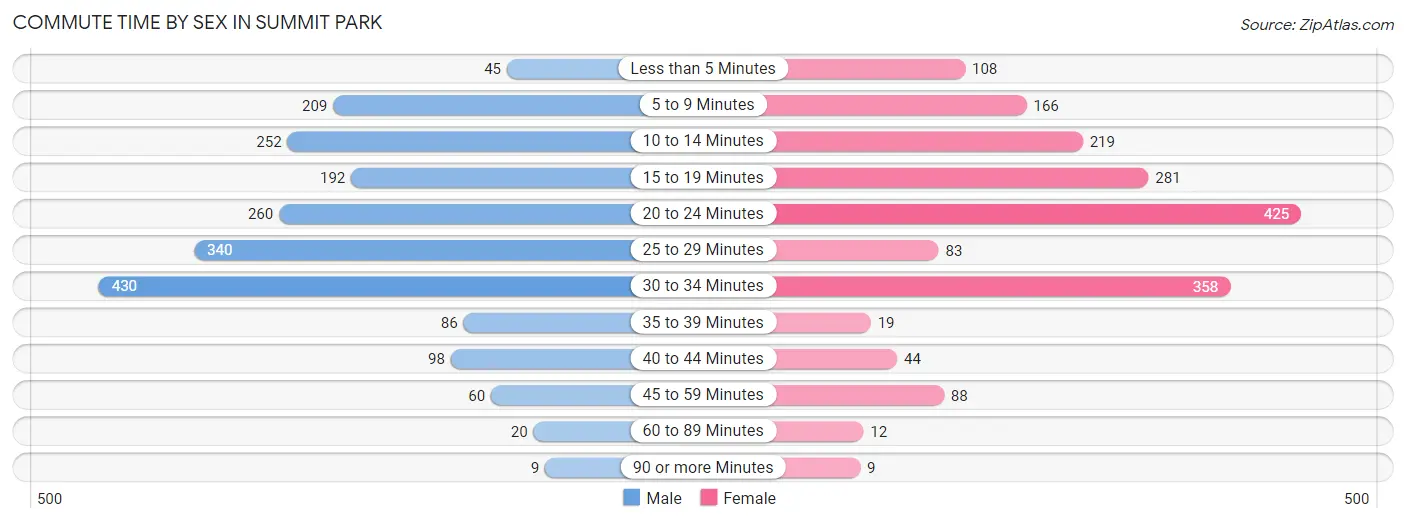
| Commute Time | Male | Female |
| Less than 5 Minutes | 45 (2.2%) | 108 (6.0%) |
| 5 to 9 Minutes | 209 (10.4%) | 166 (9.2%) |
| 10 to 14 Minutes | 252 (12.6%) | 219 (12.1%) |
| 15 to 19 Minutes | 192 (9.6%) | 281 (15.5%) |
| 20 to 24 Minutes | 260 (13.0%) | 425 (23.4%) |
| 25 to 29 Minutes | 340 (17.0%) | 83 (4.6%) |
| 30 to 34 Minutes | 430 (21.5%) | 358 (19.8%) |
| 35 to 39 Minutes | 86 (4.3%) | 19 (1.1%) |
| 40 to 44 Minutes | 98 (4.9%) | 44 (2.4%) |
| 45 to 59 Minutes | 60 (3.0%) | 88 (4.9%) |
| 60 to 89 Minutes | 20 (1.0%) | 12 (0.7%) |
| 90 or more Minutes | 9 (0.4%) | 9 (0.5%) |
Time of Departure to Work by Sex in Summit Park
The most frequent times of departure to work in Summit Park are 7:00 AM to 7:29 AM (374, 18.7%) for males and 7:30 AM to 7:59 AM (403, 22.2%) for females.
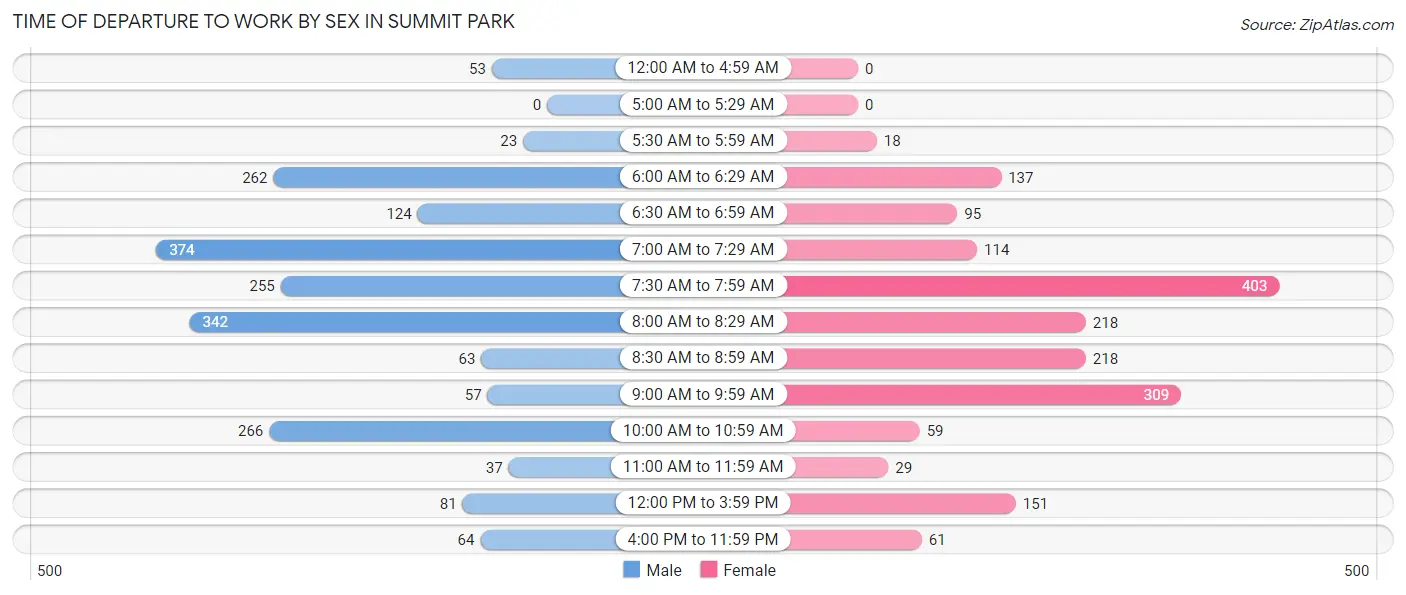
| Time of Departure | Male | Female |
| 12:00 AM to 4:59 AM | 53 (2.6%) | 0 (0.0%) |
| 5:00 AM to 5:29 AM | 0 (0.0%) | 0 (0.0%) |
| 5:30 AM to 5:59 AM | 23 (1.1%) | 18 (1.0%) |
| 6:00 AM to 6:29 AM | 262 (13.1%) | 137 (7.6%) |
| 6:30 AM to 6:59 AM | 124 (6.2%) | 95 (5.2%) |
| 7:00 AM to 7:29 AM | 374 (18.7%) | 114 (6.3%) |
| 7:30 AM to 7:59 AM | 255 (12.7%) | 403 (22.2%) |
| 8:00 AM to 8:29 AM | 342 (17.1%) | 218 (12.0%) |
| 8:30 AM to 8:59 AM | 63 (3.2%) | 218 (12.0%) |
| 9:00 AM to 9:59 AM | 57 (2.9%) | 309 (17.1%) |
| 10:00 AM to 10:59 AM | 266 (13.3%) | 59 (3.3%) |
| 11:00 AM to 11:59 AM | 37 (1.8%) | 29 (1.6%) |
| 12:00 PM to 3:59 PM | 81 (4.1%) | 151 (8.3%) |
| 4:00 PM to 11:59 PM | 64 (3.2%) | 61 (3.4%) |
| Total | 2,001 (100.0%) | 1,812 (100.0%) |
Housing Occupancy in Summit Park
Occupancy by Ownership in Summit Park
Of the total 2,785 dwellings in Summit Park, owner-occupied units account for 2,350 (84.4%), while renter-occupied units make up 435 (15.6%).
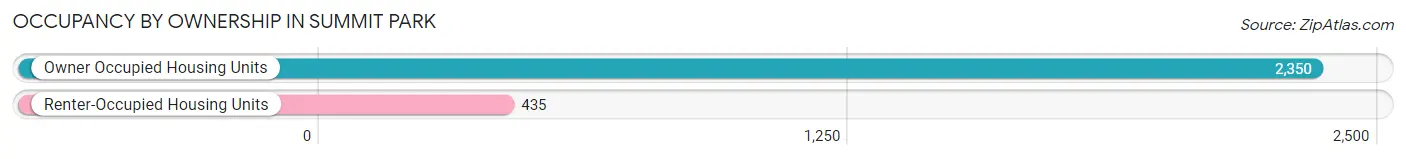
| Occupancy | # Housing Units | % Housing Units |
| Owner Occupied Housing Units | 2,350 | 84.4% |
| Renter-Occupied Housing Units | 435 | 15.6% |
| Total Occupied Housing Units | 2,785 | 100.0% |
Occupancy by Household Size in Summit Park
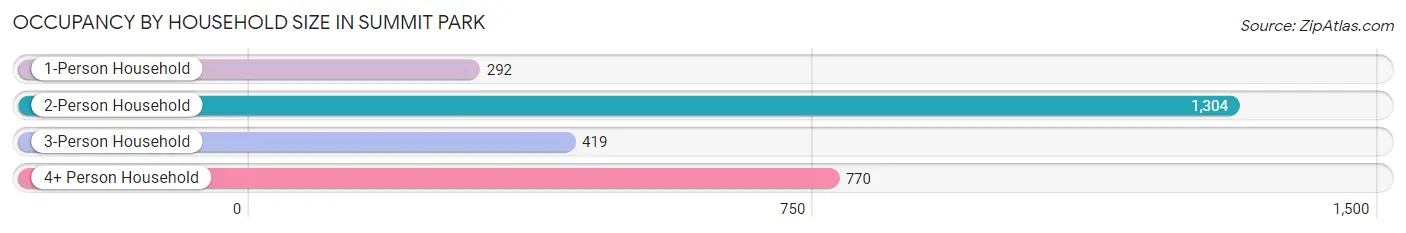
| Household Size | # Housing Units | % Housing Units |
| 1-Person Household | 292 | 10.5% |
| 2-Person Household | 1,304 | 46.8% |
| 3-Person Household | 419 | 15.0% |
| 4+ Person Household | 770 | 27.7% |
| Total Housing Units | 2,785 | 100.0% |
Occupancy by Ownership by Household Size in Summit Park
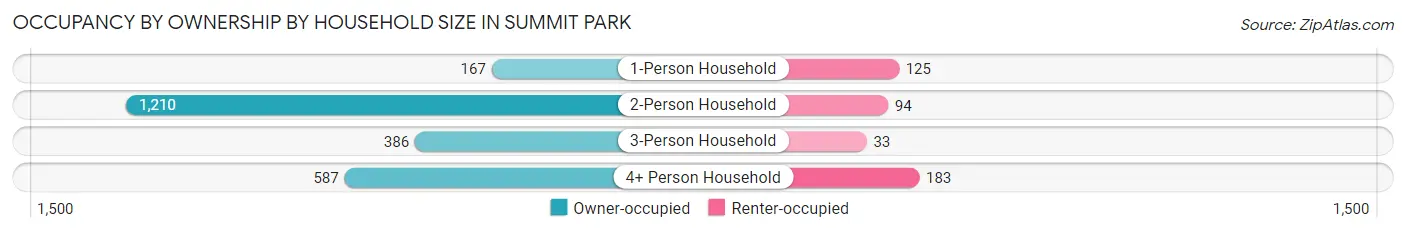
| Household Size | Owner-occupied | Renter-occupied |
| 1-Person Household | 167 (57.2%) | 125 (42.8%) |
| 2-Person Household | 1,210 (92.8%) | 94 (7.2%) |
| 3-Person Household | 386 (92.1%) | 33 (7.9%) |
| 4+ Person Household | 587 (76.2%) | 183 (23.8%) |
| Total Housing Units | 2,350 (84.4%) | 435 (15.6%) |
Occupancy by Educational Attainment in Summit Park
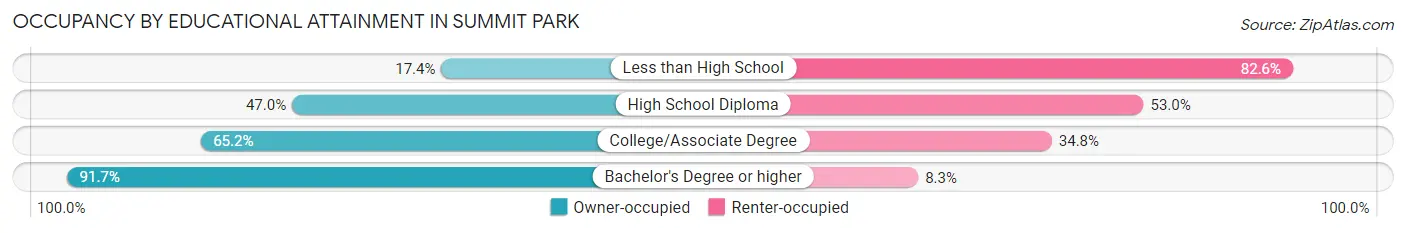
| Household Size | Owner-occupied | Renter-occupied |
| Less than High School | 8 (17.4%) | 38 (82.6%) |
| High School Diploma | 78 (47.0%) | 88 (53.0%) |
| College/Associate Degree | 232 (65.2%) | 124 (34.8%) |
| Bachelor's Degree or higher | 2,032 (91.7%) | 185 (8.3%) |
Occupancy by Age of Householder in Summit Park
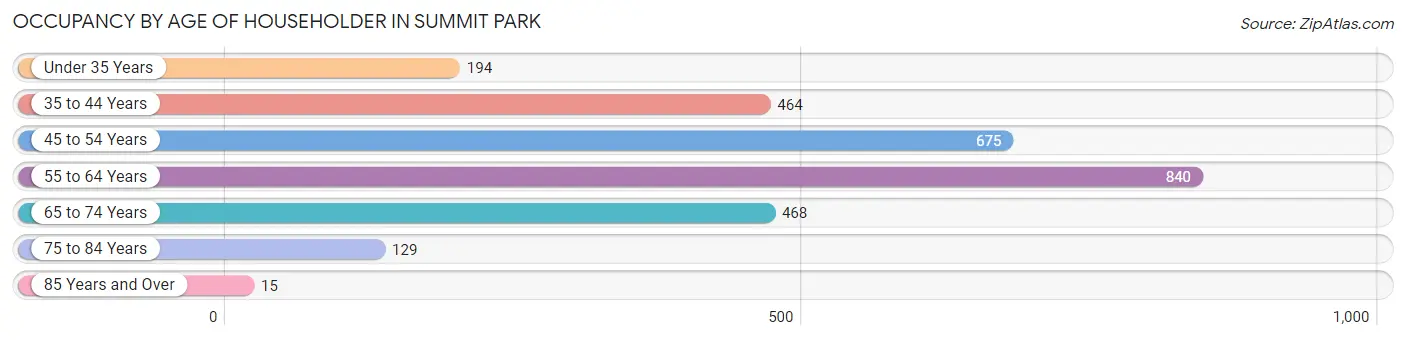
| Age Bracket | # Households | % Households |
| Under 35 Years | 194 | 7.0% |
| 35 to 44 Years | 464 | 16.7% |
| 45 to 54 Years | 675 | 24.2% |
| 55 to 64 Years | 840 | 30.2% |
| 65 to 74 Years | 468 | 16.8% |
| 75 to 84 Years | 129 | 4.6% |
| 85 Years and Over | 15 | 0.5% |
| Total | 2,785 | 100.0% |
Housing Finances in Summit Park
Median Income by Occupancy in Summit Park
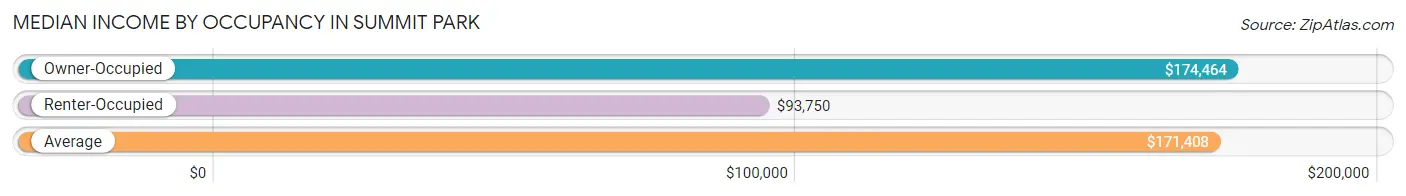
| Occupancy Type | # Households | Median Income |
| Owner-Occupied | 2,350 (84.4%) | $174,464 |
| Renter-Occupied | 435 (15.6%) | $93,750 |
| Average | 2,785 (100.0%) | $171,408 |
Occupancy by Householder Income Bracket in Summit Park
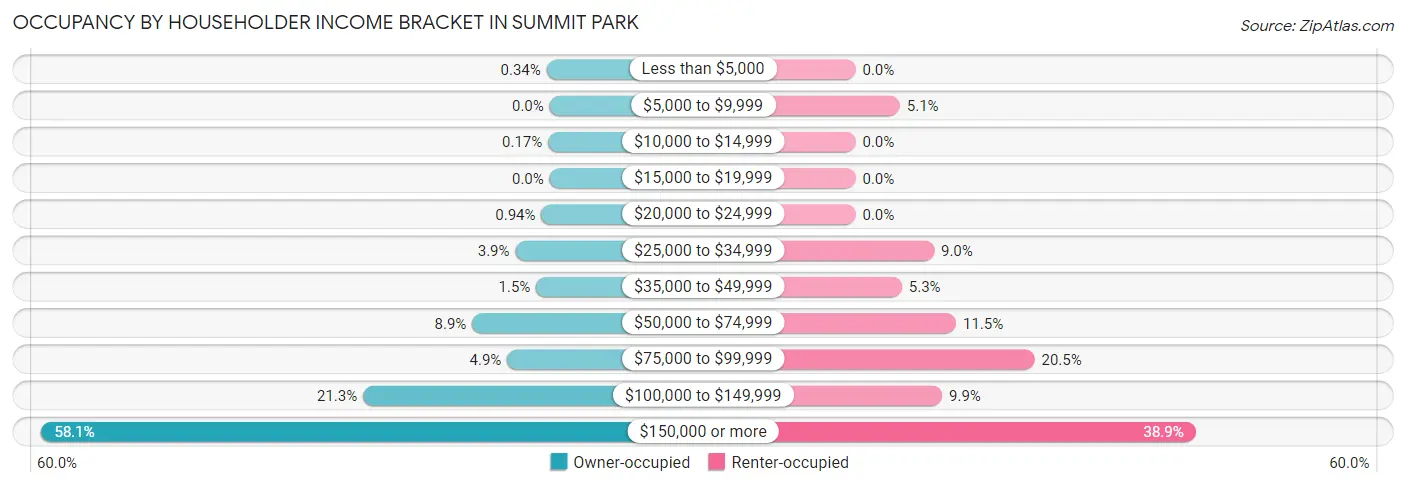
| Income Bracket | Owner-occupied | Renter-occupied |
| Less than $5,000 | 8 (0.3%) | 0 (0.0%) |
| $5,000 to $9,999 | 0 (0.0%) | 22 (5.1%) |
| $10,000 to $14,999 | 4 (0.2%) | 0 (0.0%) |
| $15,000 to $19,999 | 0 (0.0%) | 0 (0.0%) |
| $20,000 to $24,999 | 22 (0.9%) | 0 (0.0%) |
| $25,000 to $34,999 | 92 (3.9%) | 39 (9.0%) |
| $35,000 to $49,999 | 36 (1.5%) | 23 (5.3%) |
| $50,000 to $74,999 | 208 (8.8%) | 50 (11.5%) |
| $75,000 to $99,999 | 114 (4.9%) | 89 (20.5%) |
| $100,000 to $149,999 | 501 (21.3%) | 43 (9.9%) |
| $150,000 or more | 1,365 (58.1%) | 169 (38.9%) |
| Total | 2,350 (100.0%) | 435 (100.0%) |
Monthly Housing Cost Tiers in Summit Park
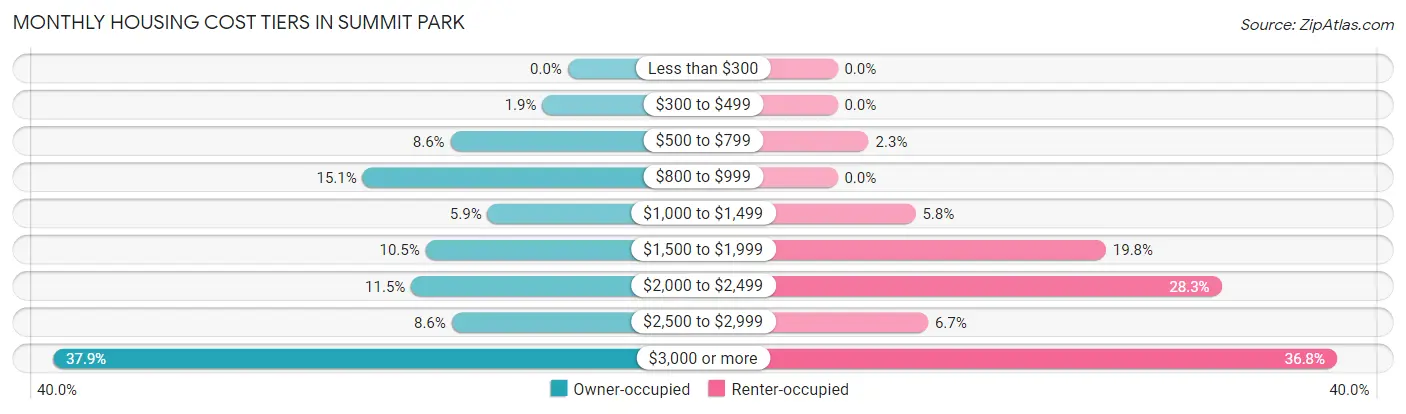
| Monthly Cost | Owner-occupied | Renter-occupied |
| Less than $300 | 0 (0.0%) | 0 (0.0%) |
| $300 to $499 | 44 (1.9%) | 0 (0.0%) |
| $500 to $799 | 203 (8.6%) | 10 (2.3%) |
| $800 to $999 | 355 (15.1%) | 0 (0.0%) |
| $1,000 to $1,499 | 139 (5.9%) | 25 (5.8%) |
| $1,500 to $1,999 | 246 (10.5%) | 86 (19.8%) |
| $2,000 to $2,499 | 271 (11.5%) | 123 (28.3%) |
| $2,500 to $2,999 | 201 (8.6%) | 29 (6.7%) |
| $3,000 or more | 891 (37.9%) | 160 (36.8%) |
| Total | 2,350 (100.0%) | 435 (100.0%) |
Physical Housing Characteristics in Summit Park
Housing Structures in Summit Park
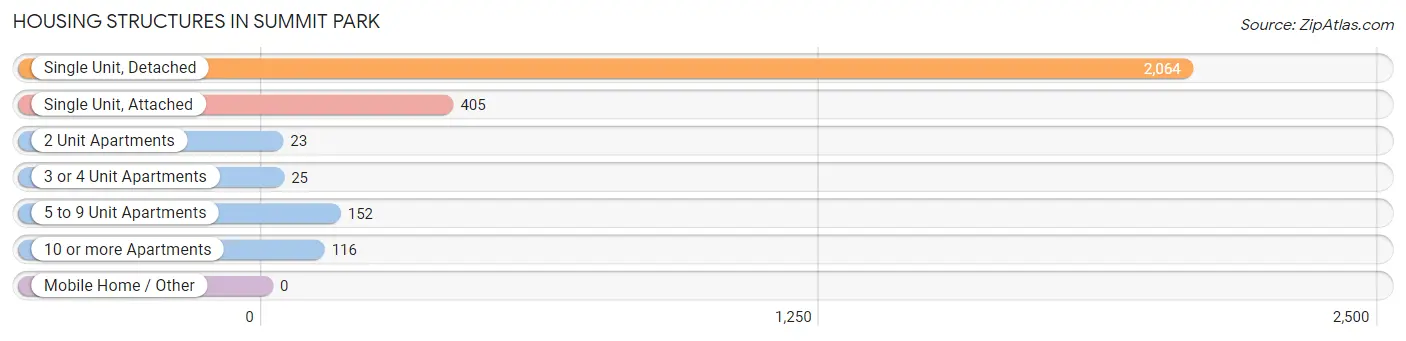
| Structure Type | # Housing Units | % Housing Units |
| Single Unit, Detached | 2,064 | 74.1% |
| Single Unit, Attached | 405 | 14.5% |
| 2 Unit Apartments | 23 | 0.8% |
| 3 or 4 Unit Apartments | 25 | 0.9% |
| 5 to 9 Unit Apartments | 152 | 5.5% |
| 10 or more Apartments | 116 | 4.2% |
| Mobile Home / Other | 0 | 0.0% |
| Total | 2,785 | 100.0% |
Housing Structures by Occupancy in Summit Park
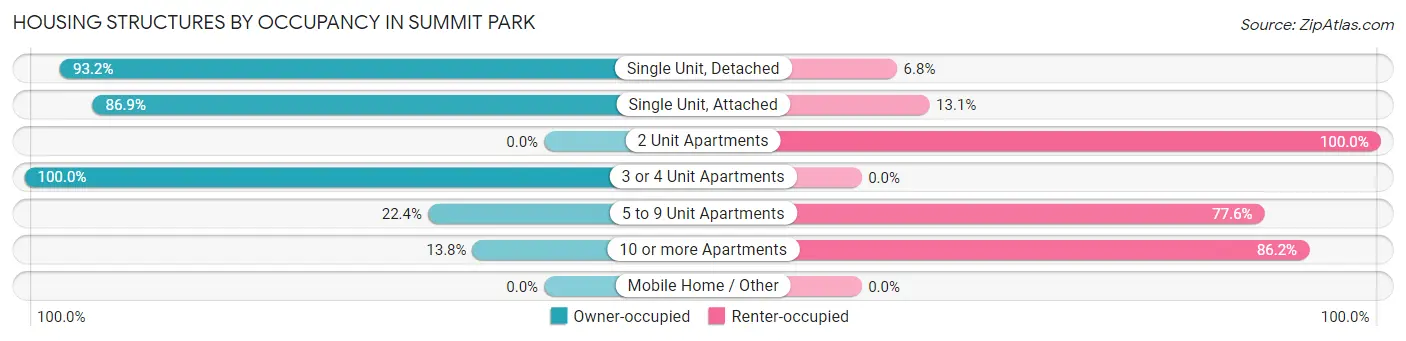
| Structure Type | Owner-occupied | Renter-occupied |
| Single Unit, Detached | 1,923 (93.2%) | 141 (6.8%) |
| Single Unit, Attached | 352 (86.9%) | 53 (13.1%) |
| 2 Unit Apartments | 0 (0.0%) | 23 (100.0%) |
| 3 or 4 Unit Apartments | 25 (100.0%) | 0 (0.0%) |
| 5 to 9 Unit Apartments | 34 (22.4%) | 118 (77.6%) |
| 10 or more Apartments | 16 (13.8%) | 100 (86.2%) |
| Mobile Home / Other | 0 (0.0%) | 0 (0.0%) |
| Total | 2,350 (84.4%) | 435 (15.6%) |
Housing Structures by Number of Rooms in Summit Park
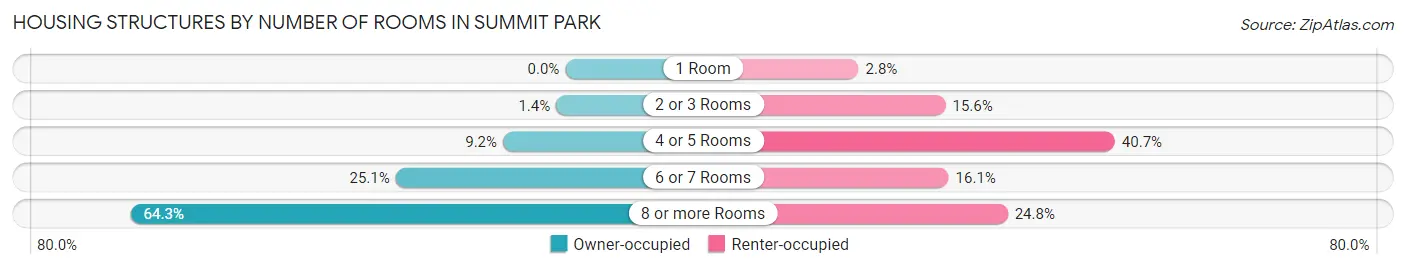
| Number of Rooms | Owner-occupied | Renter-occupied |
| 1 Room | 0 (0.0%) | 12 (2.8%) |
| 2 or 3 Rooms | 32 (1.4%) | 68 (15.6%) |
| 4 or 5 Rooms | 217 (9.2%) | 177 (40.7%) |
| 6 or 7 Rooms | 590 (25.1%) | 70 (16.1%) |
| 8 or more Rooms | 1,511 (64.3%) | 108 (24.8%) |
| Total | 2,350 (100.0%) | 435 (100.0%) |
Housing Structure by Heating Type in Summit Park
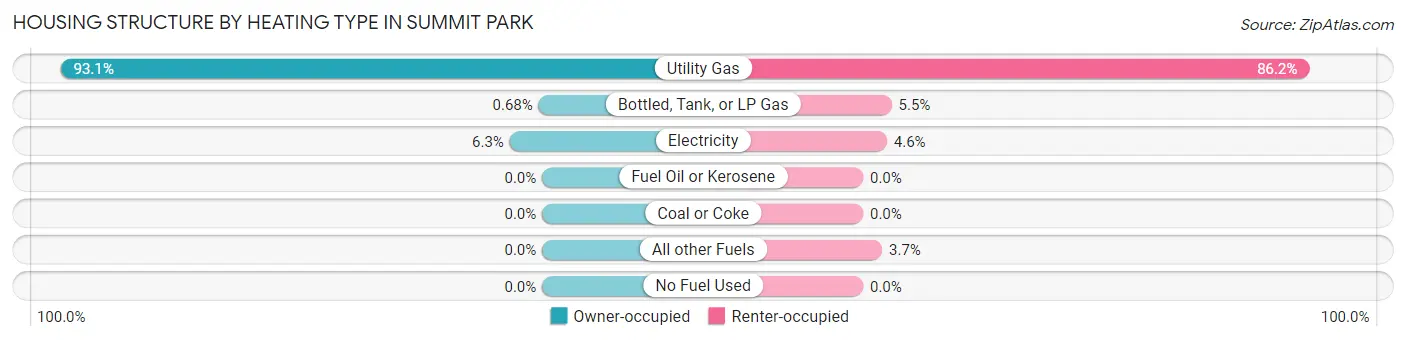
| Heating Type | Owner-occupied | Renter-occupied |
| Utility Gas | 2,187 (93.1%) | 375 (86.2%) |
| Bottled, Tank, or LP Gas | 16 (0.7%) | 24 (5.5%) |
| Electricity | 147 (6.3%) | 20 (4.6%) |
| Fuel Oil or Kerosene | 0 (0.0%) | 0 (0.0%) |
| Coal or Coke | 0 (0.0%) | 0 (0.0%) |
| All other Fuels | 0 (0.0%) | 16 (3.7%) |
| No Fuel Used | 0 (0.0%) | 0 (0.0%) |
| Total | 2,350 (100.0%) | 435 (100.0%) |
Household Vehicle Usage in Summit Park
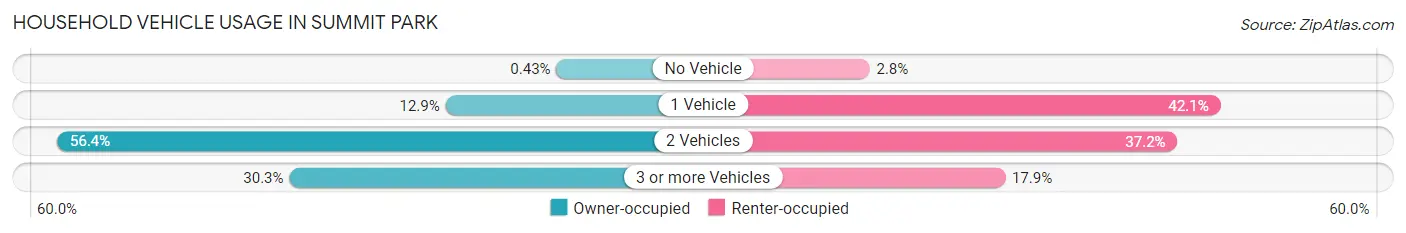
| Vehicles per Household | Owner-occupied | Renter-occupied |
| No Vehicle | 10 (0.4%) | 12 (2.8%) |
| 1 Vehicle | 302 (12.9%) | 183 (42.1%) |
| 2 Vehicles | 1,325 (56.4%) | 162 (37.2%) |
| 3 or more Vehicles | 713 (30.3%) | 78 (17.9%) |
| Total | 2,350 (100.0%) | 435 (100.0%) |
Real Estate & Mortgages in Summit Park
Real Estate and Mortgage Overview in Summit Park
| Characteristic | Without Mortgage | With Mortgage |
| Housing Units | 610 | 1,740 |
| Median Property Value | $1,018,500 | $982,900 |
| Median Household Income | $136,946 | $1,113 |
| Monthly Housing Costs | $878 | $891 |
| Real Estate Taxes | $3,504 | $0 |
Property Value by Mortgage Status in Summit Park
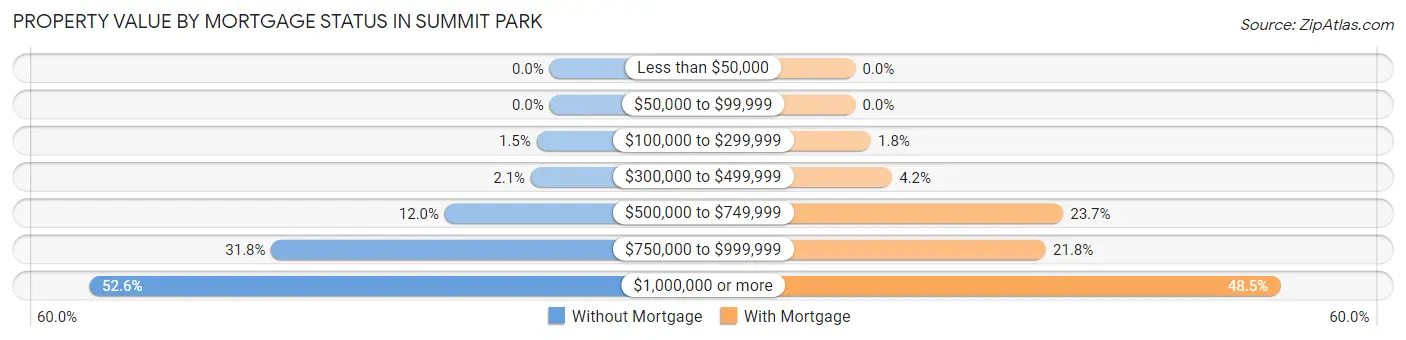
| Property Value | Without Mortgage | With Mortgage |
| Less than $50,000 | 0 (0.0%) | 0 (0.0%) |
| $50,000 to $99,999 | 0 (0.0%) | 0 (0.0%) |
| $100,000 to $299,999 | 9 (1.5%) | 31 (1.8%) |
| $300,000 to $499,999 | 13 (2.1%) | 73 (4.2%) |
| $500,000 to $749,999 | 73 (12.0%) | 413 (23.7%) |
| $750,000 to $999,999 | 194 (31.8%) | 379 (21.8%) |
| $1,000,000 or more | 321 (52.6%) | 844 (48.5%) |
| Total | 610 (100.0%) | 1,740 (100.0%) |
Household Income by Mortgage Status in Summit Park
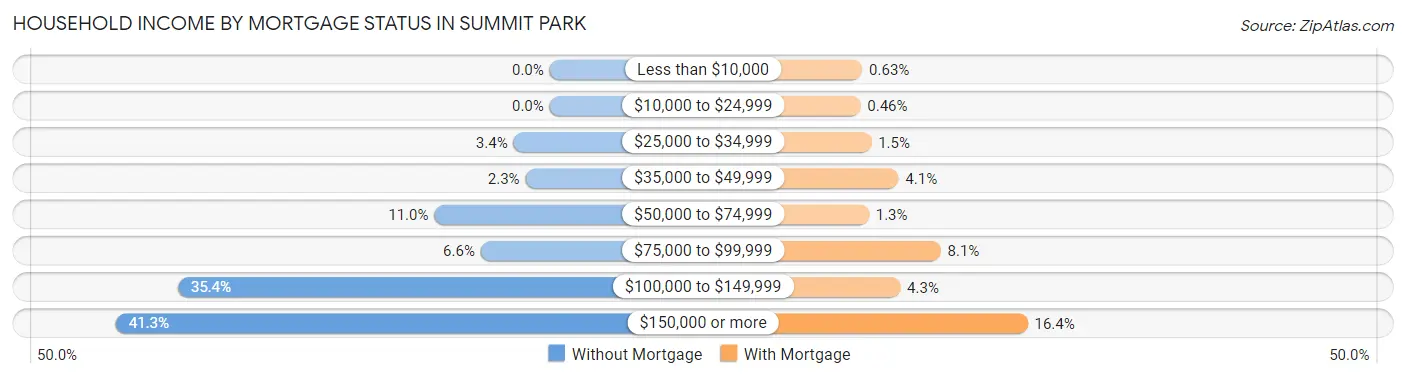
| Household Income | Without Mortgage | With Mortgage |
| Less than $10,000 | 0 (0.0%) | 11 (0.6%) |
| $10,000 to $24,999 | 0 (0.0%) | 8 (0.5%) |
| $25,000 to $34,999 | 21 (3.4%) | 26 (1.5%) |
| $35,000 to $49,999 | 14 (2.3%) | 71 (4.1%) |
| $50,000 to $74,999 | 67 (11.0%) | 22 (1.3%) |
| $75,000 to $99,999 | 40 (6.6%) | 141 (8.1%) |
| $100,000 to $149,999 | 216 (35.4%) | 74 (4.3%) |
| $150,000 or more | 252 (41.3%) | 285 (16.4%) |
| Total | 610 (100.0%) | 1,740 (100.0%) |
Property Value to Household Income Ratio in Summit Park
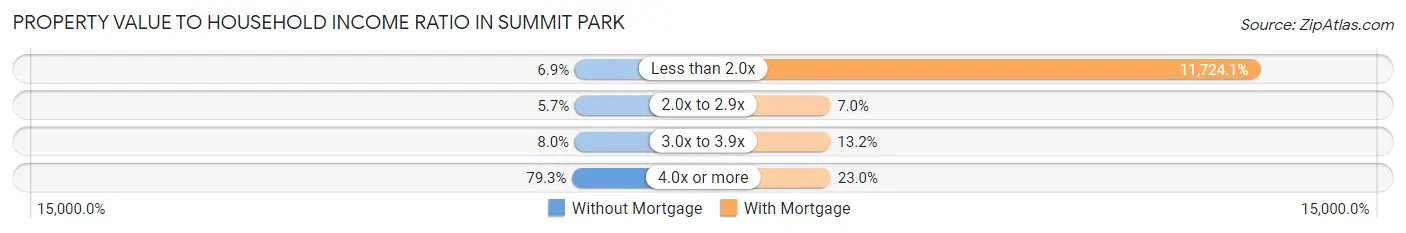
| Value-to-Income Ratio | Without Mortgage | With Mortgage |
| Less than 2.0x | 42 (6.9%) | 204,000 (11,724.1%) |
| 2.0x to 2.9x | 35 (5.7%) | 121 (7.0%) |
| 3.0x to 3.9x | 49 (8.0%) | 230 (13.2%) |
| 4.0x or more | 484 (79.3%) | 400 (23.0%) |
| Total | 610 (100.0%) | 1,740 (100.0%) |
Real Estate Taxes by Mortgage Status in Summit Park
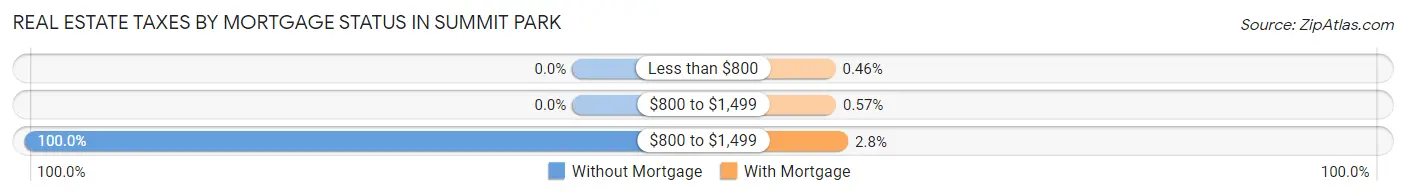
| Property Taxes | Without Mortgage | With Mortgage |
| Less than $800 | 0 (0.0%) | 8 (0.5%) |
| $800 to $1,499 | 0 (0.0%) | 10 (0.6%) |
| $800 to $1,499 | 610 (100.0%) | 48 (2.8%) |
| Total | 610 (100.0%) | 1,740 (100.0%) |
Health & Disability in Summit Park
Health Insurance Coverage by Age in Summit Park
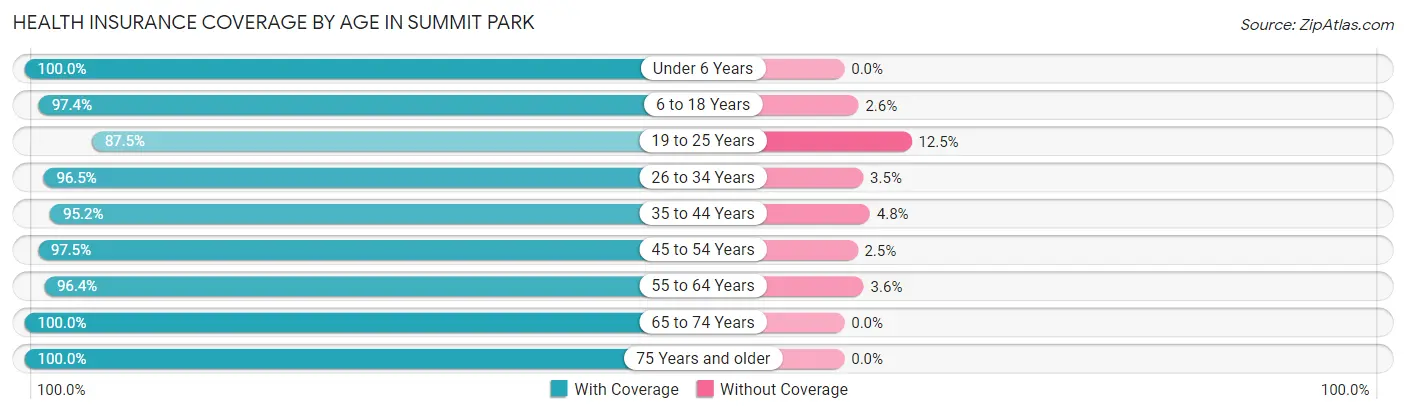
| Age Bracket | With Coverage | Without Coverage |
| Under 6 Years | 468 (100.0%) | 0 (0.0%) |
| 6 to 18 Years | 1,658 (97.4%) | 45 (2.6%) |
| 19 to 25 Years | 594 (87.5%) | 85 (12.5%) |
| 26 to 34 Years | 685 (96.5%) | 25 (3.5%) |
| 35 to 44 Years | 1,001 (95.2%) | 50 (4.8%) |
| 45 to 54 Years | 1,269 (97.5%) | 32 (2.5%) |
| 55 to 64 Years | 1,441 (96.4%) | 54 (3.6%) |
| 65 to 74 Years | 1,049 (100.0%) | 0 (0.0%) |
| 75 Years and older | 252 (100.0%) | 0 (0.0%) |
| Total | 8,417 (96.7%) | 291 (3.3%) |
Health Insurance Coverage by Citizenship Status in Summit Park
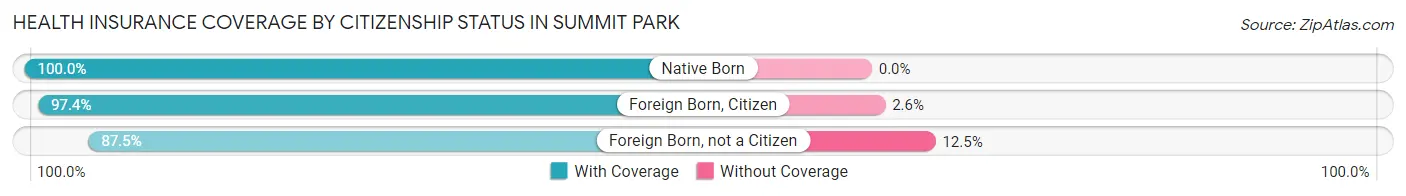
| Citizenship Status | With Coverage | Without Coverage |
| Native Born | 468 (100.0%) | 0 (0.0%) |
| Foreign Born, Citizen | 1,658 (97.4%) | 45 (2.6%) |
| Foreign Born, not a Citizen | 594 (87.5%) | 85 (12.5%) |
Health Insurance Coverage by Household Income in Summit Park
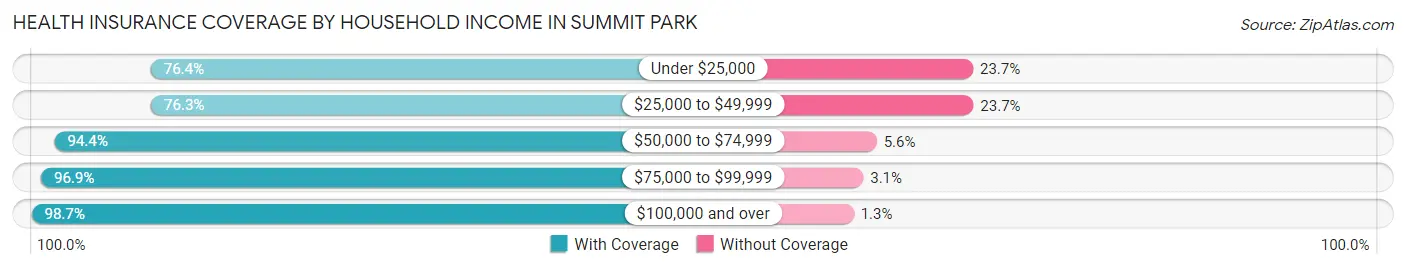
| Household Income | With Coverage | Without Coverage |
| Under $25,000 | 155 (76.3%) | 48 (23.6%) |
| $25,000 to $49,999 | 312 (76.3%) | 97 (23.7%) |
| $50,000 to $74,999 | 690 (94.4%) | 41 (5.6%) |
| $75,000 to $99,999 | 501 (96.9%) | 16 (3.1%) |
| $100,000 and over | 6,759 (98.7%) | 89 (1.3%) |
Public vs Private Health Insurance Coverage by Age in Summit Park
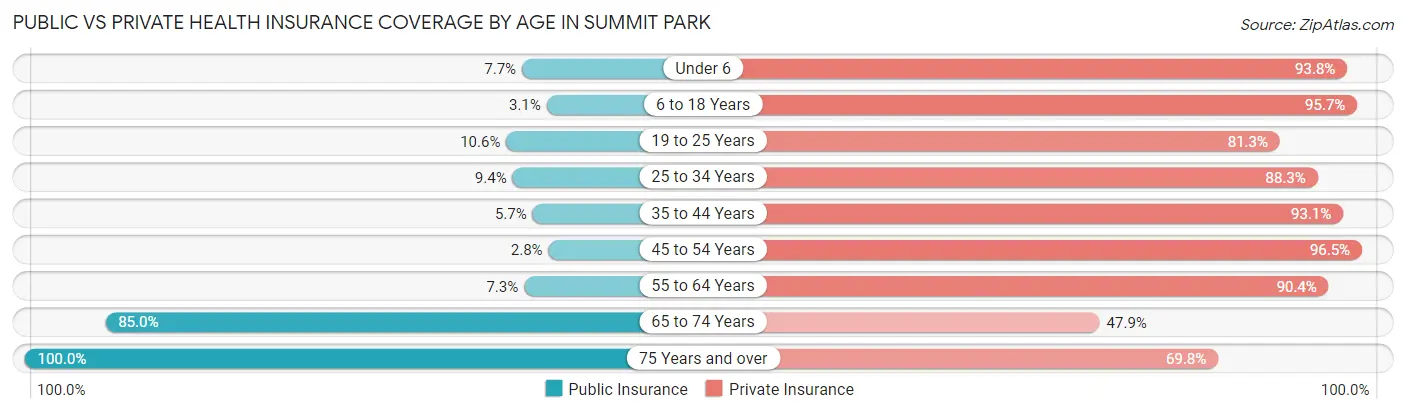
| Age Bracket | Public Insurance | Private Insurance |
| Under 6 | 36 (7.7%) | 439 (93.8%) |
| 6 to 18 Years | 53 (3.1%) | 1,629 (95.7%) |
| 19 to 25 Years | 72 (10.6%) | 552 (81.3%) |
| 25 to 34 Years | 67 (9.4%) | 627 (88.3%) |
| 35 to 44 Years | 60 (5.7%) | 978 (93.0%) |
| 45 to 54 Years | 36 (2.8%) | 1,256 (96.5%) |
| 55 to 64 Years | 109 (7.3%) | 1,351 (90.4%) |
| 65 to 74 Years | 892 (85.0%) | 502 (47.9%) |
| 75 Years and over | 252 (100.0%) | 176 (69.8%) |
| Total | 1,577 (18.1%) | 7,510 (86.2%) |
Disability Status by Sex by Age in Summit Park
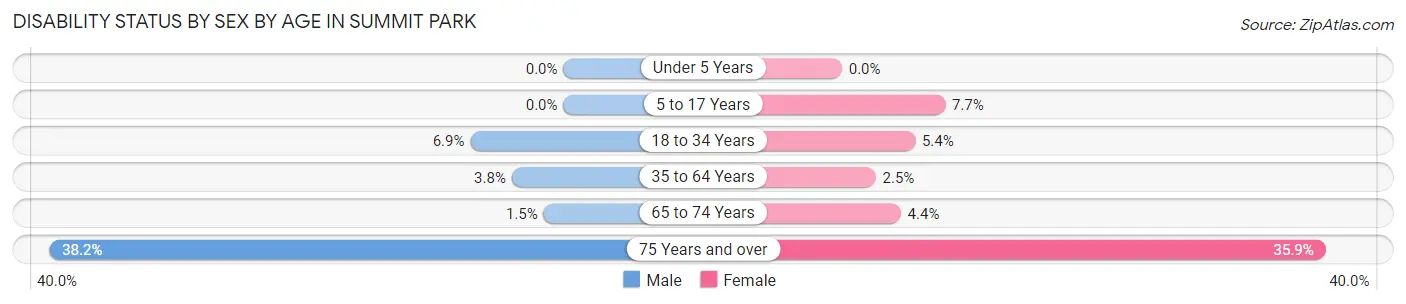
| Age Bracket | Male | Female |
| Under 5 Years | 0 (0.0%) | 0 (0.0%) |
| 5 to 17 Years | 0 (0.0%) | 64 (7.7%) |
| 18 to 34 Years | 53 (6.9%) | 42 (5.4%) |
| 35 to 64 Years | 74 (3.8%) | 48 (2.5%) |
| 65 to 74 Years | 8 (1.5%) | 22 (4.4%) |
| 75 Years and over | 42 (38.2%) | 51 (35.9%) |
Disability Class by Sex by Age in Summit Park
Disability Class: Hearing Difficulty
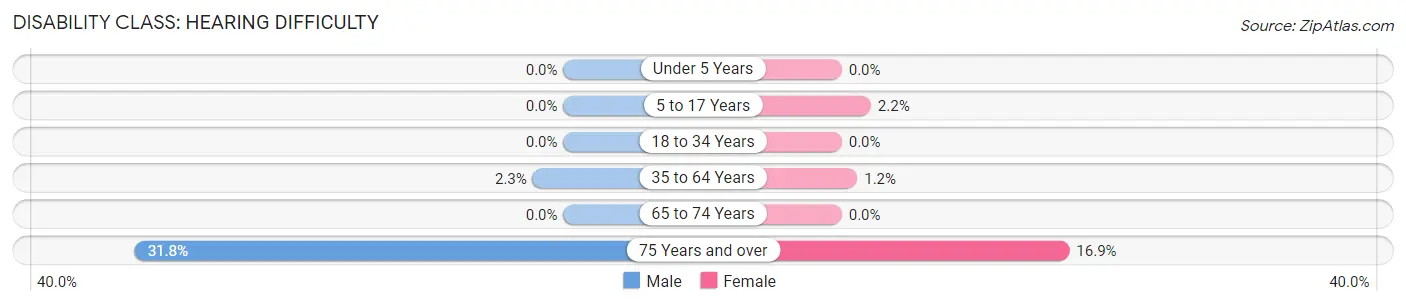
| Age Bracket | Male | Female |
| Under 5 Years | 0 (0.0%) | 0 (0.0%) |
| 5 to 17 Years | 0 (0.0%) | 18 (2.2%) |
| 18 to 34 Years | 0 (0.0%) | 0 (0.0%) |
| 35 to 64 Years | 44 (2.3%) | 22 (1.1%) |
| 65 to 74 Years | 0 (0.0%) | 0 (0.0%) |
| 75 Years and over | 35 (31.8%) | 24 (16.9%) |
Disability Class: Vision Difficulty
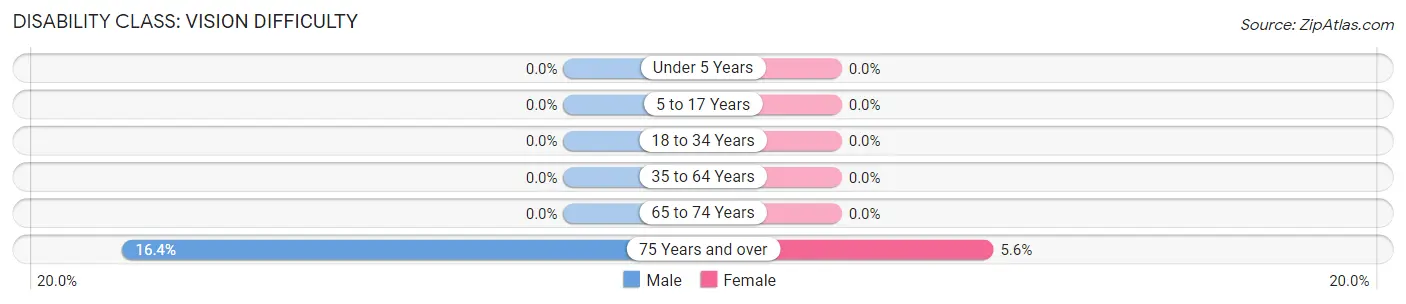
| Age Bracket | Male | Female |
| Under 5 Years | 0 (0.0%) | 0 (0.0%) |
| 5 to 17 Years | 0 (0.0%) | 0 (0.0%) |
| 18 to 34 Years | 0 (0.0%) | 0 (0.0%) |
| 35 to 64 Years | 0 (0.0%) | 0 (0.0%) |
| 65 to 74 Years | 0 (0.0%) | 0 (0.0%) |
| 75 Years and over | 18 (16.4%) | 8 (5.6%) |
Disability Class: Cognitive Difficulty
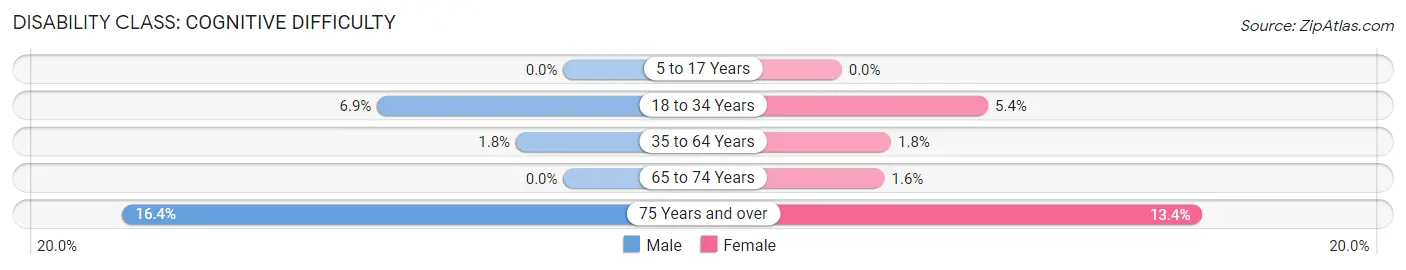
| Age Bracket | Male | Female |
| 5 to 17 Years | 0 (0.0%) | 0 (0.0%) |
| 18 to 34 Years | 53 (6.9%) | 42 (5.4%) |
| 35 to 64 Years | 34 (1.8%) | 35 (1.8%) |
| 65 to 74 Years | 0 (0.0%) | 8 (1.6%) |
| 75 Years and over | 18 (16.4%) | 19 (13.4%) |
Disability Class: Ambulatory Difficulty
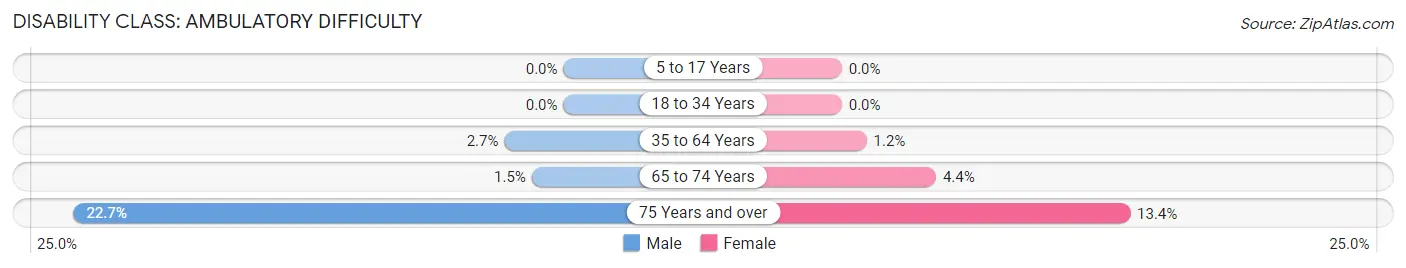
| Age Bracket | Male | Female |
| 5 to 17 Years | 0 (0.0%) | 0 (0.0%) |
| 18 to 34 Years | 0 (0.0%) | 0 (0.0%) |
| 35 to 64 Years | 53 (2.7%) | 22 (1.1%) |
| 65 to 74 Years | 8 (1.5%) | 22 (4.4%) |
| 75 Years and over | 25 (22.7%) | 19 (13.4%) |
Disability Class: Self-Care Difficulty
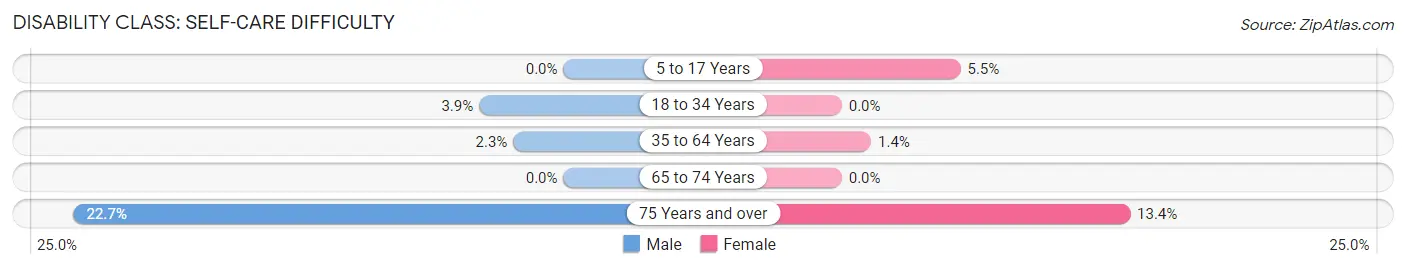
| Age Bracket | Male | Female |
| 5 to 17 Years | 0 (0.0%) | 46 (5.5%) |
| 18 to 34 Years | 30 (3.9%) | 0 (0.0%) |
| 35 to 64 Years | 45 (2.3%) | 26 (1.4%) |
| 65 to 74 Years | 0 (0.0%) | 0 (0.0%) |
| 75 Years and over | 25 (22.7%) | 19 (13.4%) |
Technology Access in Summit Park
Computing Device Access in Summit Park
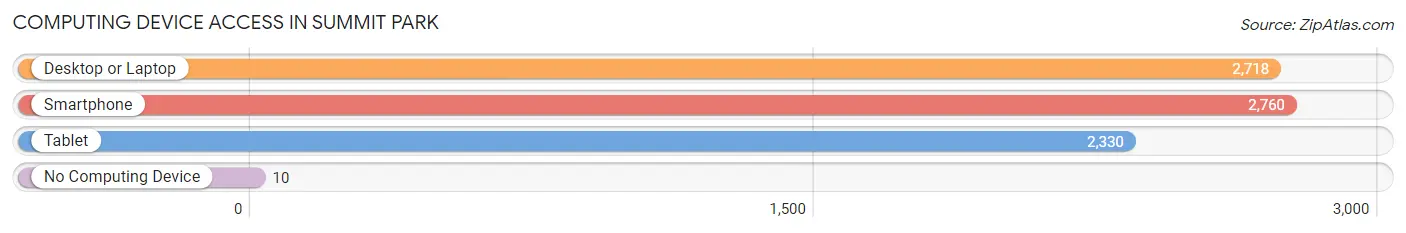
| Device Type | # Households | % Households |
| Desktop or Laptop | 2,718 | 97.6% |
| Smartphone | 2,760 | 99.1% |
| Tablet | 2,330 | 83.7% |
| No Computing Device | 10 | 0.4% |
| Total | 2,785 | 100.0% |
Internet Access in Summit Park
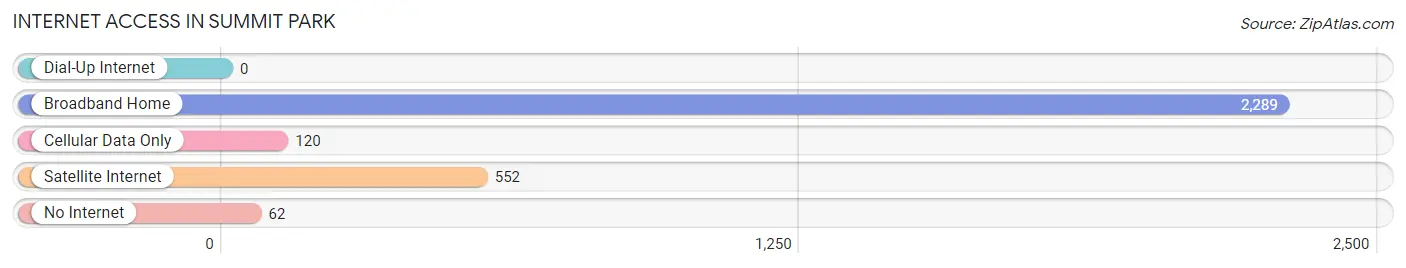
| Internet Type | # Households | % Households |
| Dial-Up Internet | 0 | 0.0% |
| Broadband Home | 2,289 | 82.2% |
| Cellular Data Only | 120 | 4.3% |
| Satellite Internet | 552 | 19.8% |
| No Internet | 62 | 2.2% |
| Total | 2,785 | 100.0% |
Summit Park Summary
Summit Park is a small unincorporated community located in the Wasatch Mountains of Summit County, Utah. It is situated at an elevation of 8,000 feet, making it one of the highest elevation communities in the state. The community is located approximately 20 miles east of Park City and 30 miles southeast of Salt Lake City.
History
The area that is now Summit Park was first settled in the late 1800s by miners and loggers. The first permanent settlers arrived in the early 1900s and the community was officially established in 1912. The town was named after the nearby summit of the Wasatch Mountains.
In the early 1900s, the area was primarily used for logging and mining. The first sawmill was built in the area in 1912 and the first mine was opened in 1915. The mining industry was the primary source of income for the community until the 1950s when the mines began to close.
In the 1950s, the area began to transition from a mining and logging community to a recreational area. The first ski resort in the area, Park City Mountain Resort, opened in 1963 and the area began to attract more visitors.
Geography
Summit Park is located in the Wasatch Mountains of Summit County, Utah. It is situated at an elevation of 8,000 feet, making it one of the highest elevation communities in the state. The area is surrounded by mountains and is home to several ski resorts, including Park City Mountain Resort, Deer Valley Resort, and The Canyons.
The area is known for its scenic beauty and is home to several hiking trails, including the popular Wasatch Crest Trail. The area is also home to several lakes, including Jordanelle Reservoir and Echo Reservoir.
Economy
The economy of Summit Park is primarily driven by tourism. The area is home to several ski resorts, including Park City Mountain Resort, Deer Valley Resort, and The Canyons. These resorts attract thousands of visitors each year and provide employment opportunities for the local population.
In addition to the ski resorts, the area is also home to several restaurants, bars, and shops. These businesses provide additional employment opportunities for the local population.
Demographics
As of the 2010 census, the population of Summit Park was 1,845. The racial makeup of the town was 94.3% White, 0.7% African American, 0.3% Native American, 0.7% Asian, 0.1% Pacific Islander, 1.2% from other races, and 2.9% from two or more races. Hispanic or Latino of any race were 4.2% of the population.
The median household income in Summit Park was $68,750, and the median family income was $76,250. The per capita income for the town was $35,945. About 8.2% of families and 10.2% of the population were below the poverty line, including 11.3% of those under age 18 and 8.2% of those age 65 or over.
Common Questions
What is Per Capita Income in Summit Park?
Per Capita income in Summit Park is $74,026.
What is the Median Family Income in Summit Park?
Median Family Income in Summit Park is $176,333.
What is the Median Household income in Summit Park?
Median Household Income in Summit Park is $171,408.
What is Income or Wage Gap in Summit Park?
Income or Wage Gap in Summit Park is 53.0%.
Women in Summit Park earn 47.0 cents for every dollar earned by a man.
What is Inequality or Gini Index in Summit Park?
Inequality or Gini Index in Summit Park is 0.42.
What is the Total Population of Summit Park?
Total Population of Summit Park is 8,708.
What is the Total Male Population of Summit Park?
Total Male Population of Summit Park is 4,386.
What is the Total Female Population of Summit Park?
Total Female Population of Summit Park is 4,322.
What is the Ratio of Males per 100 Females in Summit Park?
There are 101.48 Males per 100 Females in Summit Park.
What is the Ratio of Females per 100 Males in Summit Park?
There are 98.54 Females per 100 Males in Summit Park.
What is the Median Population Age in Summit Park?
Median Population Age in Summit Park is 41.6 Years.
What is the Average Family Size in Summit Park
Average Family Size in Summit Park is 3.3 People.
What is the Average Household Size in Summit Park
Average Household Size in Summit Park is 3.1 People.
How Large is the Labor Force in Summit Park?
There are 4,955 People in the Labor Forcein in Summit Park.
What is the Percentage of People in the Labor Force in Summit Park?
71.3% of People are in the Labor Force in Summit Park.
What is the Unemployment Rate in Summit Park?
Unemployment Rate in Summit Park is 3.4%.