Arden, DE Map & Demographics
Arden Map
Arden Overview
$49,135
PER CAPITA INCOME
$74,620
AVG HOUSEHOLD INCOME
0.45
INEQUALITY / GINI INDEX
652
TOTAL POPULATION
301
MALE POPULATION
351
FEMALE POPULATION
85.75
MALES / 100 FEMALES
116.61
FEMALES / 100 MALES
58.0
MEDIAN AGE
2.9
AVG FAMILY SIZE
2.4
AVG HOUSEHOLD SIZE
313
LABOR FORCE [ PEOPLE ]
52.7%
PERCENT IN LABOR FORCE
4.5%
UNEMPLOYMENT RATE
Income in Arden
Income Overview in Arden
| Characteristic | Number | Measure |
| Per Capita Income | 652 | $49,135 |
| Median Family Income | 179 | $0 |
| Mean Family Income | 179 | $135,941 |
| Median Household Income | 277 | $74,620 |
| Mean Household Income | 277 | $112,295 |
| Income Deficit | 179 | $0 |
| Wage / Income Gap (%) | 652 | 0.00% |
| Wage / Income Gap ($) | 652 | 100.00¢ per $1 |
| Gini / Inequality Index | 652 | 0.45 |
Earnings by Sex in Arden
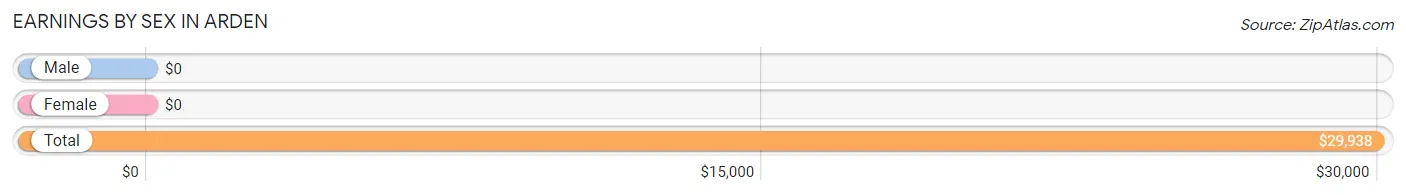
| Sex | Number | Average Earnings |
| Male | 216 (51.7%) | $0 |
| Female | 202 (48.3%) | $0 |
| Total | 418 (100.0%) | $29,938 |
Earnings by Sex by Income Bracket in Arden
The most common earnings brackets in Arden are $100,000+ for men (72 | 33.3%) and $2,499 or less for women (90 | 44.6%).
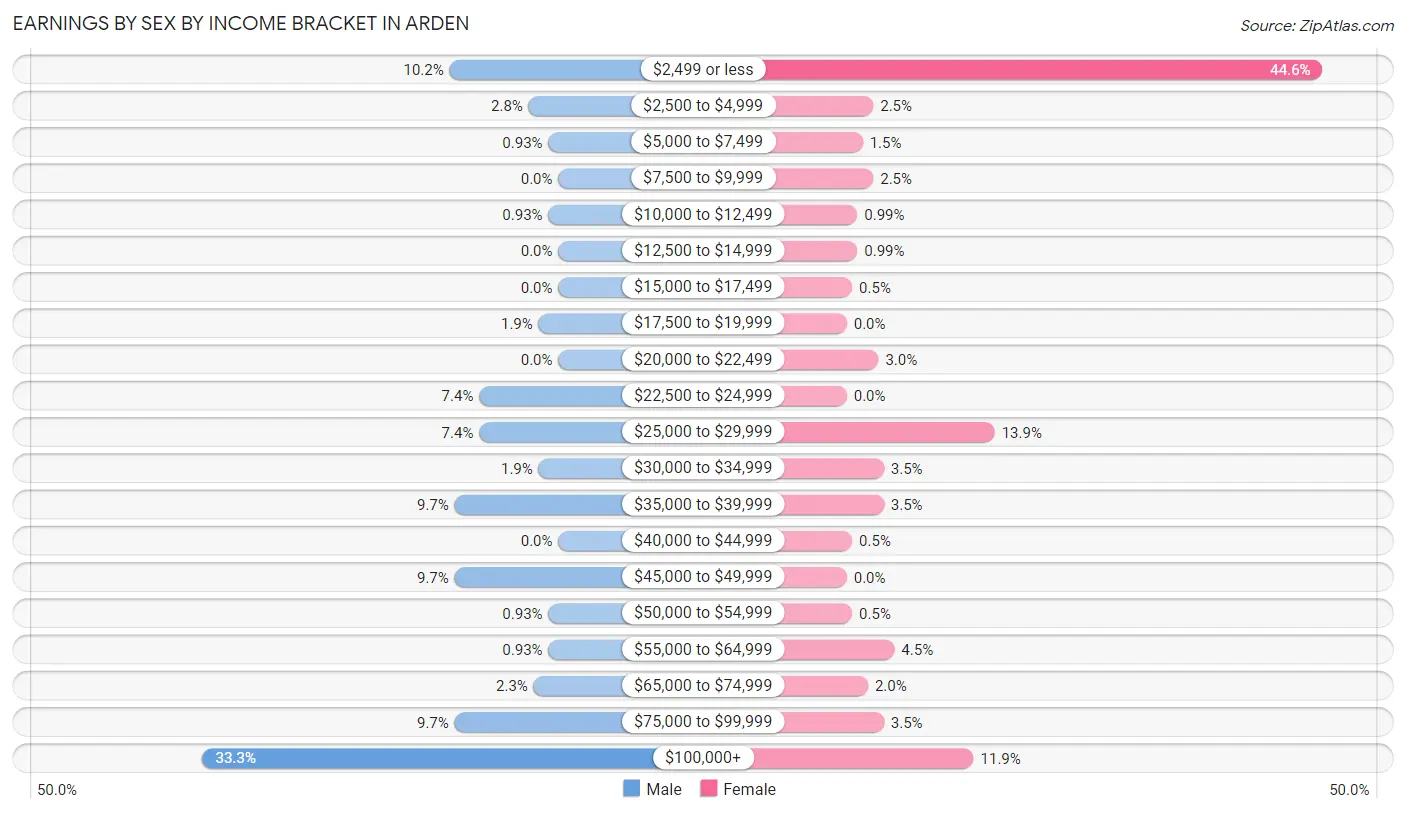
| Income | Male | Female |
| $2,499 or less | 22 (10.2%) | 90 (44.6%) |
| $2,500 to $4,999 | 6 (2.8%) | 5 (2.5%) |
| $5,000 to $7,499 | 2 (0.9%) | 3 (1.5%) |
| $7,500 to $9,999 | 0 (0.0%) | 5 (2.5%) |
| $10,000 to $12,499 | 2 (0.9%) | 2 (1.0%) |
| $12,500 to $14,999 | 0 (0.0%) | 2 (1.0%) |
| $15,000 to $17,499 | 0 (0.0%) | 1 (0.5%) |
| $17,500 to $19,999 | 4 (1.8%) | 0 (0.0%) |
| $20,000 to $22,499 | 0 (0.0%) | 6 (3.0%) |
| $22,500 to $24,999 | 16 (7.4%) | 0 (0.0%) |
| $25,000 to $29,999 | 16 (7.4%) | 28 (13.9%) |
| $30,000 to $34,999 | 4 (1.8%) | 7 (3.5%) |
| $35,000 to $39,999 | 21 (9.7%) | 7 (3.5%) |
| $40,000 to $44,999 | 0 (0.0%) | 1 (0.5%) |
| $45,000 to $49,999 | 21 (9.7%) | 0 (0.0%) |
| $50,000 to $54,999 | 2 (0.9%) | 1 (0.5%) |
| $55,000 to $64,999 | 2 (0.9%) | 9 (4.5%) |
| $65,000 to $74,999 | 5 (2.3%) | 4 (2.0%) |
| $75,000 to $99,999 | 21 (9.7%) | 7 (3.5%) |
| $100,000+ | 72 (33.3%) | 24 (11.9%) |
| Total | 216 (100.0%) | 202 (100.0%) |
Earnings by Sex by Educational Attainment in Arden
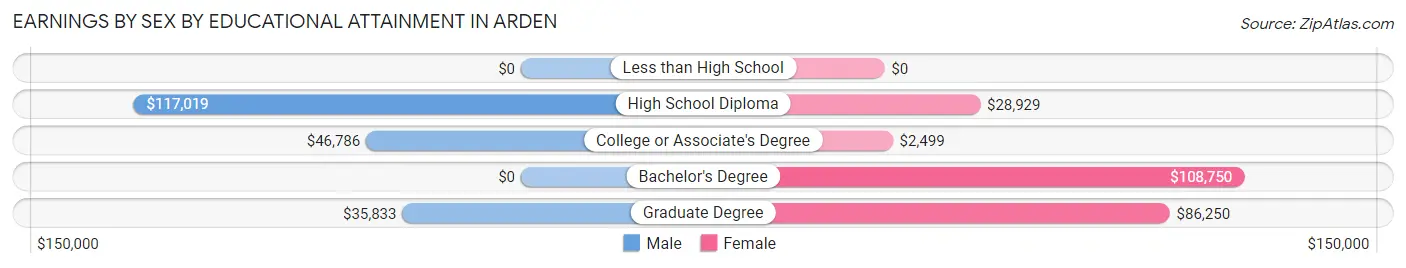
| Educational Attainment | Male Income | Female Income |
| Less than High School | - | - |
| High School Diploma | $117,019 | $28,929 |
| College or Associate's Degree | $46,786 | $2,499 |
| Bachelor's Degree | - | - |
| Graduate Degree | $35,833 | $86,250 |
| Total | - | - |
Family Income in Arden
Family Income Brackets in Arden
According to the Arden family income data, there are 57 families falling into the $150,000 to $199,999 income range, which is the most common income bracket and makes up 31.8% of all families.
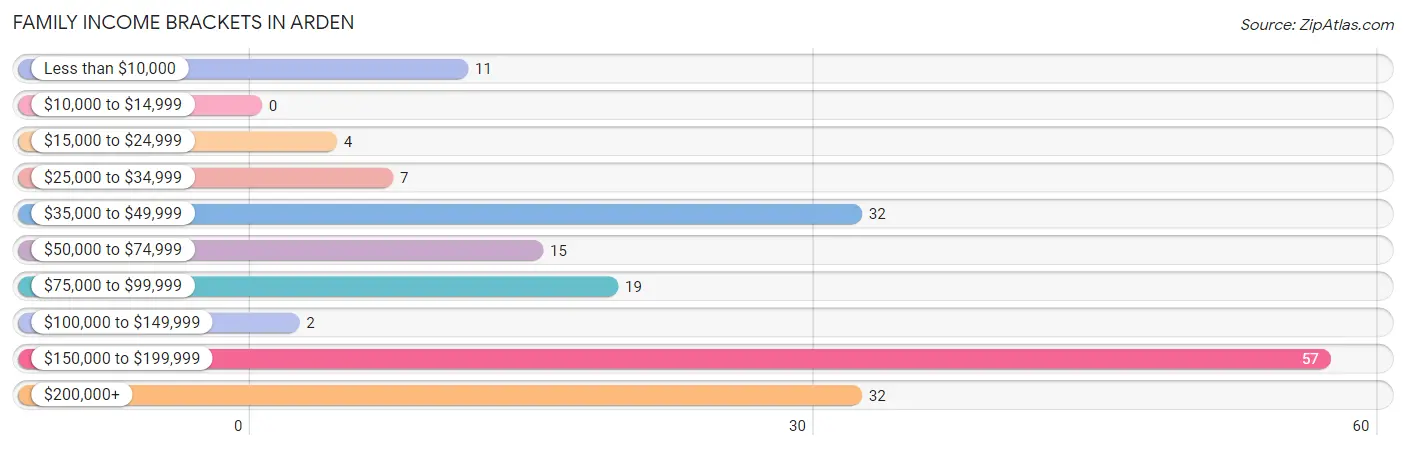
| Income Bracket | # Families | % Families |
| Less than $10,000 | 11 | 6.1% |
| $10,000 to $14,999 | 0 | 0.0% |
| $15,000 to $24,999 | 4 | 2.2% |
| $25,000 to $34,999 | 7 | 3.9% |
| $35,000 to $49,999 | 32 | 17.9% |
| $50,000 to $74,999 | 15 | 8.4% |
| $75,000 to $99,999 | 19 | 10.6% |
| $100,000 to $149,999 | 2 | 1.1% |
| $150,000 to $199,999 | 57 | 31.8% |
| $200,000+ | 32 | 17.9% |
Family Income by Famaliy Size in Arden
3-person families (52 | 29.0%) account for the highest median family income in Arden with $198,636 per family, while 3-person families (52 | 29.0%) have the highest median income of $66,212 per family member.
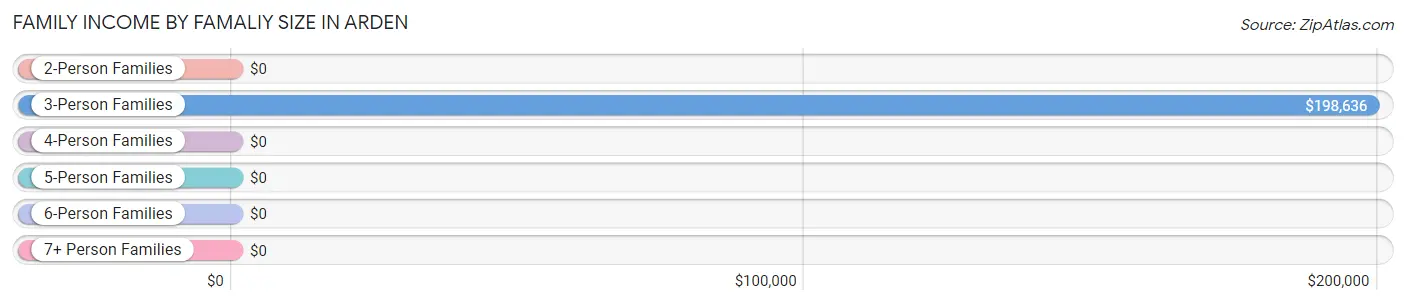
| Income Bracket | # Families | Median Income |
| 2-Person Families | 68 (38.0%) | $0 |
| 3-Person Families | 52 (29.0%) | $198,636 |
| 4-Person Families | 51 (28.5%) | $0 |
| 5-Person Families | 8 (4.5%) | $0 |
| 6-Person Families | 0 (0.0%) | $0 |
| 7+ Person Families | 0 (0.0%) | $0 |
| Total | 179 (100.0%) | $0 |
Family Income by Number of Earners in Arden
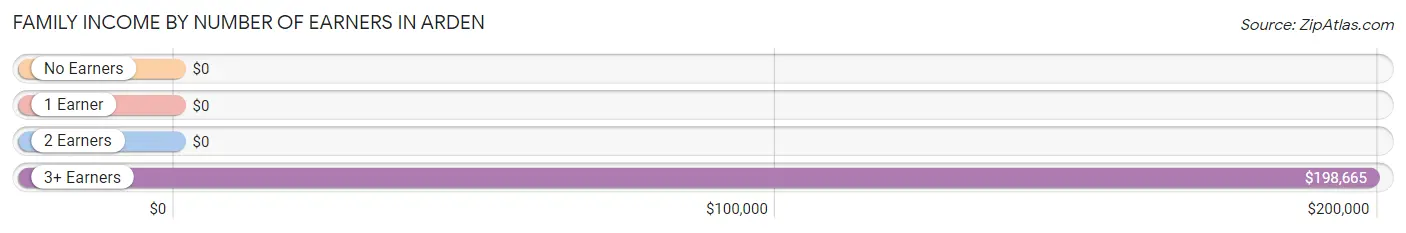
| Number of Earners | # Families | Median Income |
| No Earners | 18 (10.1%) | $0 |
| 1 Earner | 26 (14.5%) | $0 |
| 2 Earners | 80 (44.7%) | $0 |
| 3+ Earners | 55 (30.7%) | $198,665 |
| Total | 179 (100.0%) | $0 |
Household Income in Arden
Household Income Brackets in Arden
With 60 households falling in the category, the $150,000 to $199,999 income range is the most frequent in Arden, accounting for 21.7% of all households. In contrast, only 1 households (0.4%) fall into the $10,000 to $14,999 income bracket, making it the least populous group.
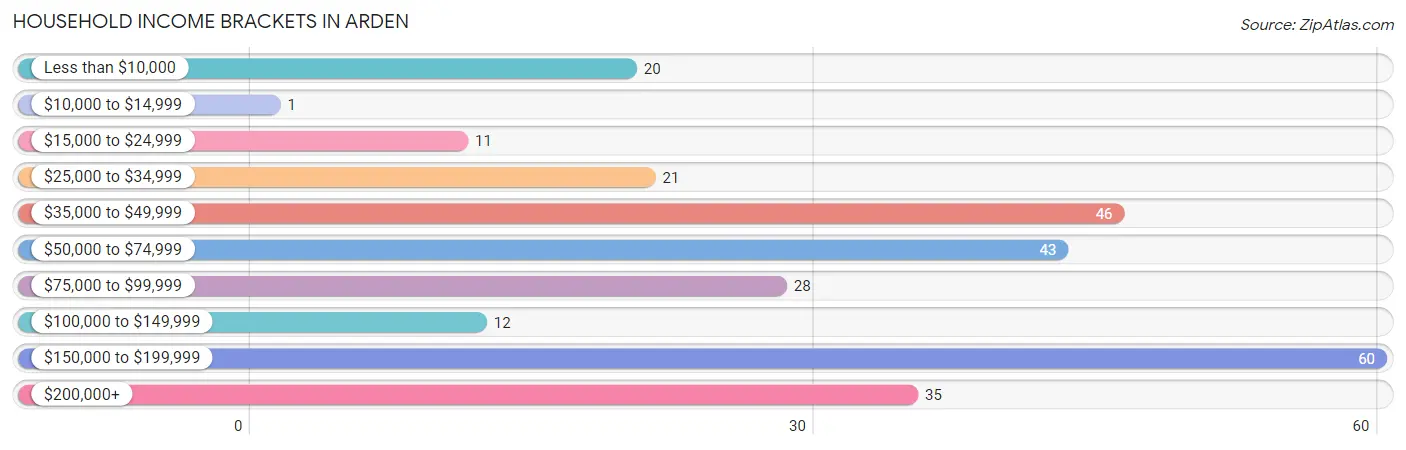
| Income Bracket | # Households | % Households |
| Less than $10,000 | 20 | 7.2% |
| $10,000 to $14,999 | 1 | 0.4% |
| $15,000 to $24,999 | 11 | 4.0% |
| $25,000 to $34,999 | 21 | 7.6% |
| $35,000 to $49,999 | 46 | 16.6% |
| $50,000 to $74,999 | 43 | 15.5% |
| $75,000 to $99,999 | 28 | 10.1% |
| $100,000 to $149,999 | 12 | 4.3% |
| $150,000 to $199,999 | 60 | 21.7% |
| $200,000+ | 35 | 12.6% |
Household Income by Householder Age in Arden
The median household income in Arden is $74,620, with the highest median household income of $86,250 found in the 25 to 44 years age bracket for the primary householder. A total of 56 households (20.2%) fall into this category.
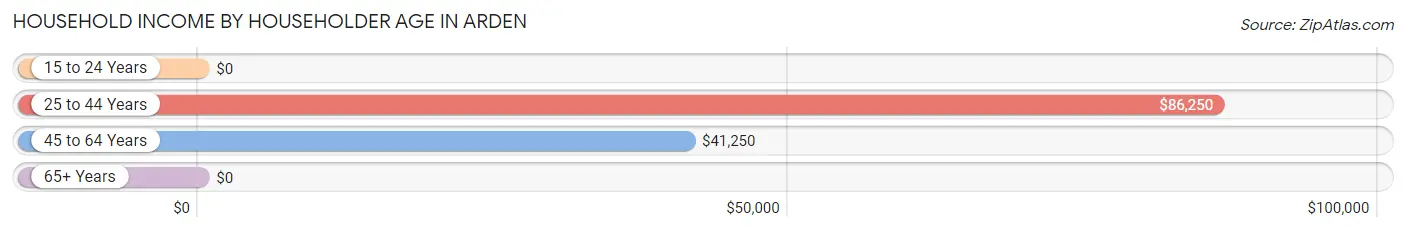
| Income Bracket | # Households | Median Income |
| 15 to 24 Years | 0 (0.0%) | $0 |
| 25 to 44 Years | 56 (20.2%) | $86,250 |
| 45 to 64 Years | 104 (37.6%) | $41,250 |
| 65+ Years | 117 (42.2%) | $0 |
| Total | 277 (100.0%) | $74,620 |
Poverty in Arden
Income Below Poverty by Sex and Age in Arden
With 2.4% poverty level for males and 9.1% for females among the residents of Arden, 6 to 11 year old males and 18 to 24 year old females are the most vulnerable to poverty, with 6 males (100.0%) and 10 females (43.5%) in their respective age groups living below the poverty level.
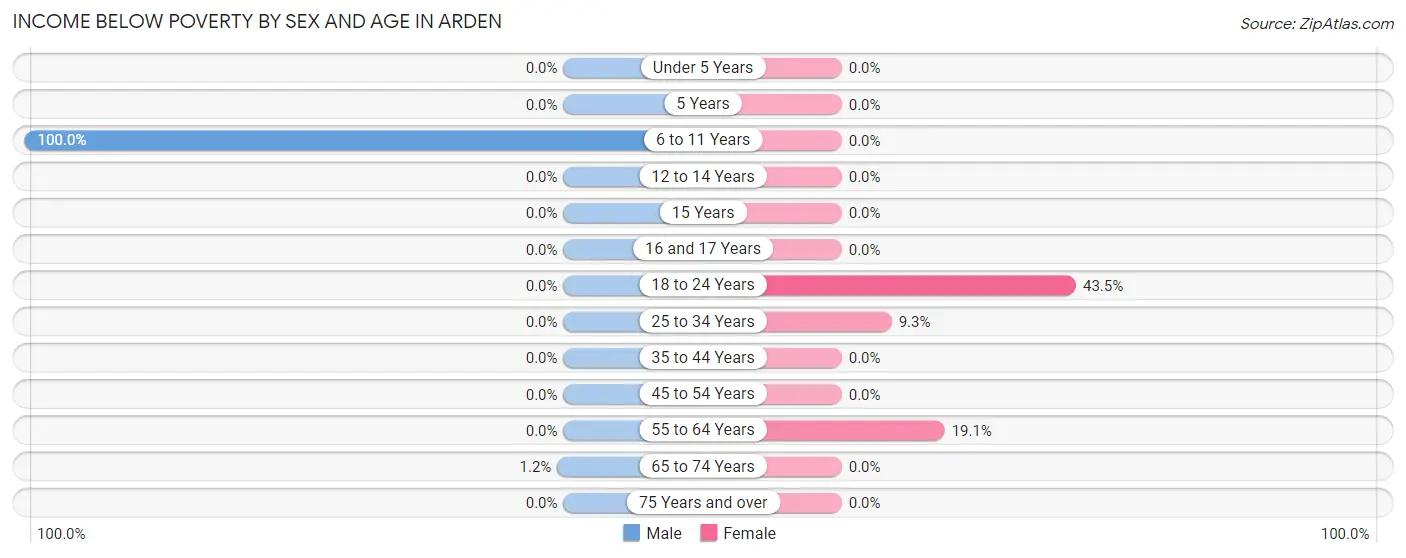
| Age Bracket | Male | Female |
| Under 5 Years | 0 (0.0%) | 0 (0.0%) |
| 5 Years | 0 (0.0%) | 0 (0.0%) |
| 6 to 11 Years | 6 (100.0%) | 0 (0.0%) |
| 12 to 14 Years | 0 (0.0%) | 0 (0.0%) |
| 15 Years | 0 (0.0%) | 0 (0.0%) |
| 16 and 17 Years | 0 (0.0%) | 0 (0.0%) |
| 18 to 24 Years | 0 (0.0%) | 10 (43.5%) |
| 25 to 34 Years | 0 (0.0%) | 5 (9.3%) |
| 35 to 44 Years | 0 (0.0%) | 0 (0.0%) |
| 45 to 54 Years | 0 (0.0%) | 0 (0.0%) |
| 55 to 64 Years | 0 (0.0%) | 17 (19.1%) |
| 65 to 74 Years | 1 (1.1%) | 0 (0.0%) |
| 75 Years and over | 0 (0.0%) | 0 (0.0%) |
| Total | 7 (2.4%) | 32 (9.1%) |
Income Above Poverty by Sex and Age in Arden
According to the poverty statistics in Arden, males aged under 5 years and females aged 6 to 11 years are the age groups that are most secure financially, with 100.0% of males and 100.0% of females in these age groups living above the poverty line.
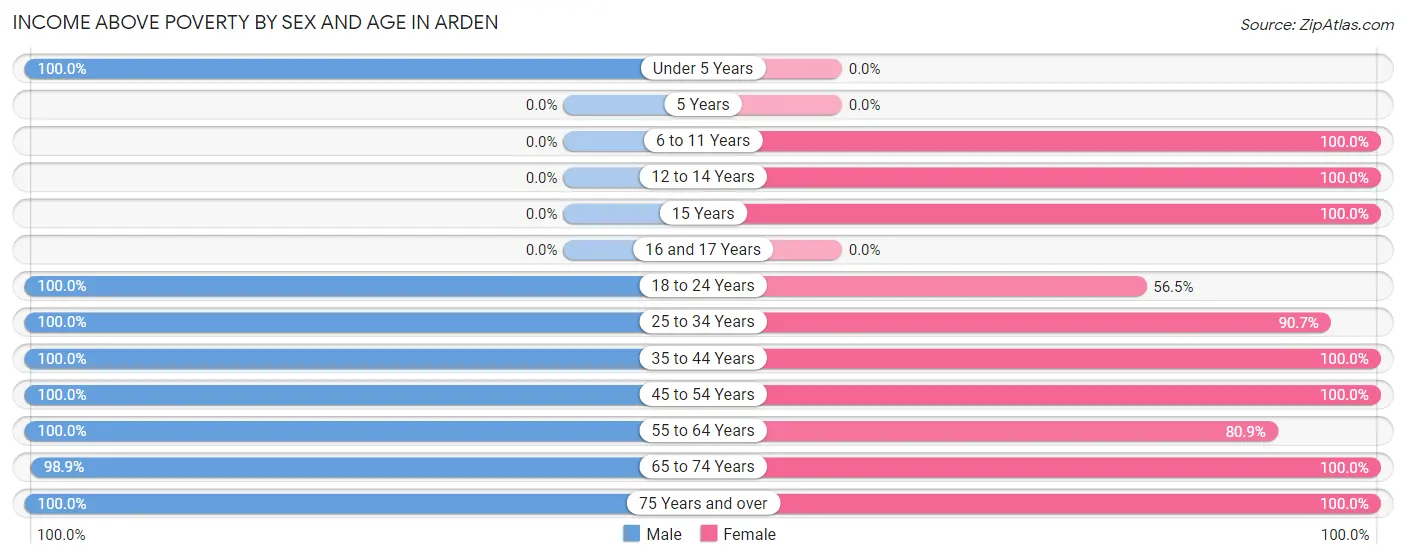
| Age Bracket | Male | Female |
| Under 5 Years | 11 (100.0%) | 0 (0.0%) |
| 5 Years | 0 (0.0%) | 0 (0.0%) |
| 6 to 11 Years | 0 (0.0%) | 12 (100.0%) |
| 12 to 14 Years | 0 (0.0%) | 7 (100.0%) |
| 15 Years | 0 (0.0%) | 9 (100.0%) |
| 16 and 17 Years | 0 (0.0%) | 0 (0.0%) |
| 18 to 24 Years | 33 (100.0%) | 13 (56.5%) |
| 25 to 34 Years | 38 (100.0%) | 49 (90.7%) |
| 35 to 44 Years | 36 (100.0%) | 34 (100.0%) |
| 45 to 54 Years | 27 (100.0%) | 14 (100.0%) |
| 55 to 64 Years | 33 (100.0%) | 72 (80.9%) |
| 65 to 74 Years | 86 (98.9%) | 92 (100.0%) |
| 75 Years and over | 17 (100.0%) | 17 (100.0%) |
| Total | 281 (97.6%) | 319 (90.9%) |
Income Below Poverty Among Married-Couple Families in Arden
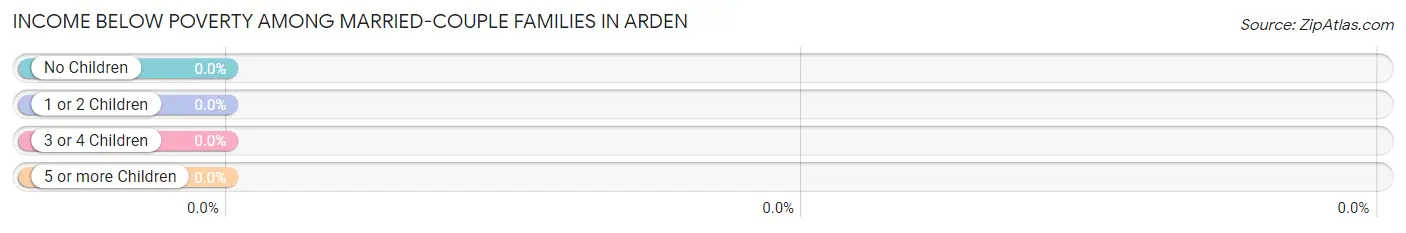
| Children | Above Poverty | Below Poverty |
| No Children | 106 (100.0%) | 0 (0.0%) |
| 1 or 2 Children | 10 (100.0%) | 0 (0.0%) |
| 3 or 4 Children | 0 (0.0%) | 0 (0.0%) |
| 5 or more Children | 0 (0.0%) | 0 (0.0%) |
| Total | 116 (100.0%) | 0 (0.0%) |
Income Below Poverty Among Single-Parent Households in Arden
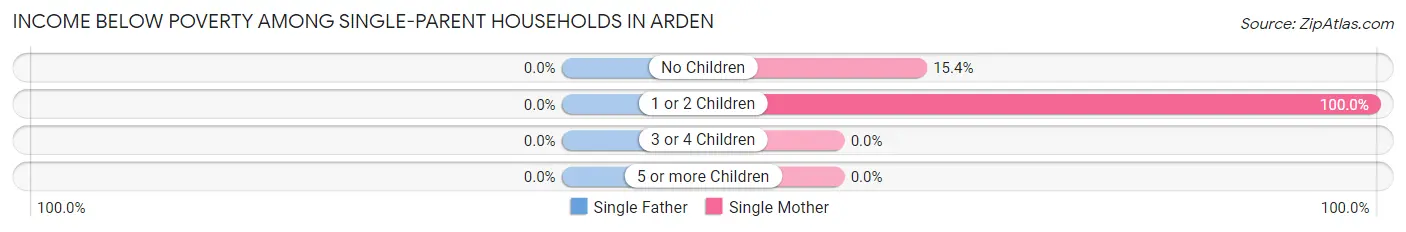
| Children | Single Father | Single Mother |
| No Children | 0 (0.0%) | 6 (15.4%) |
| 1 or 2 Children | 0 (0.0%) | 5 (100.0%) |
| 3 or 4 Children | 0 (0.0%) | 0 (0.0%) |
| 5 or more Children | 0 (0.0%) | 0 (0.0%) |
| Total | 0 (0.0%) | 11 (25.0%) |
Income Below Poverty Among Married-Couple vs Single-Parent Households in Arden
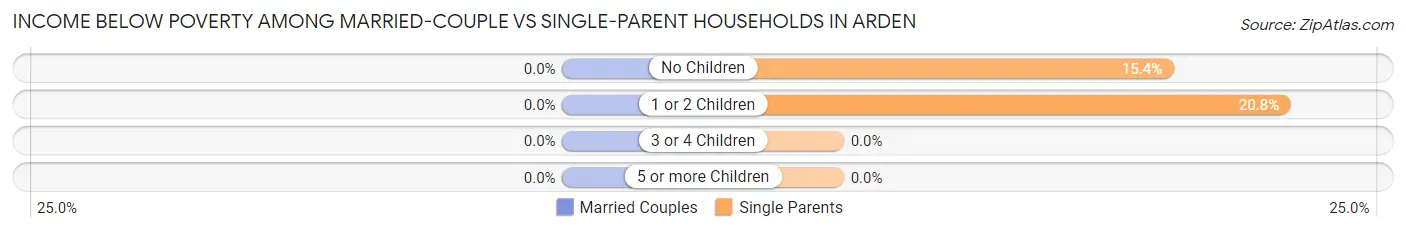
| Children | Married-Couple Families | Single-Parent Households |
| No Children | 0 (0.0%) | 6 (15.4%) |
| 1 or 2 Children | 0 (0.0%) | 5 (20.8%) |
| 3 or 4 Children | 0 (0.0%) | 0 (0.0%) |
| 5 or more Children | 0 (0.0%) | 0 (0.0%) |
| Total | 0 (0.0%) | 11 (17.5%) |
Race in Arden
The most populous races in Arden are White / Caucasian (571 | 87.6%), Hispanic or Latino (52 | 8.0%), and Native / Alaskan (42 | 6.4%).
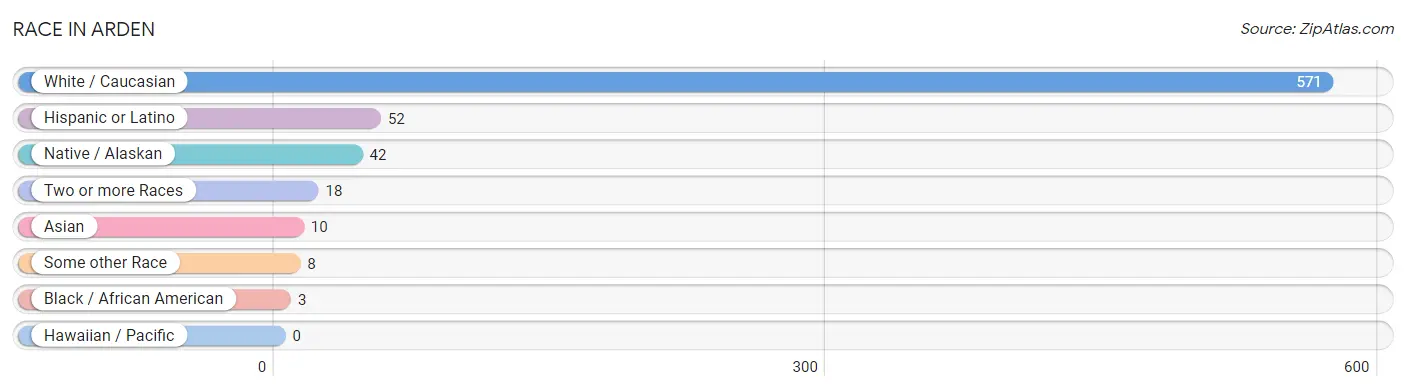
| Race | # Population | % Population |
| Asian | 10 | 1.5% |
| Black / African American | 3 | 0.5% |
| Hawaiian / Pacific | 0 | 0.0% |
| Hispanic or Latino | 52 | 8.0% |
| Native / Alaskan | 42 | 6.4% |
| White / Caucasian | 571 | 87.6% |
| Two or more Races | 18 | 2.8% |
| Some other Race | 8 | 1.2% |
| Total | 652 | 100.0% |
Ancestry in Arden
The most populous ancestries reported in Arden are Irish (269 | 41.3%), English (169 | 25.9%), German (158 | 24.2%), South American (47 | 7.2%), and Bolivian (42 | 6.4%), together accounting for 105.1% of all Arden residents.
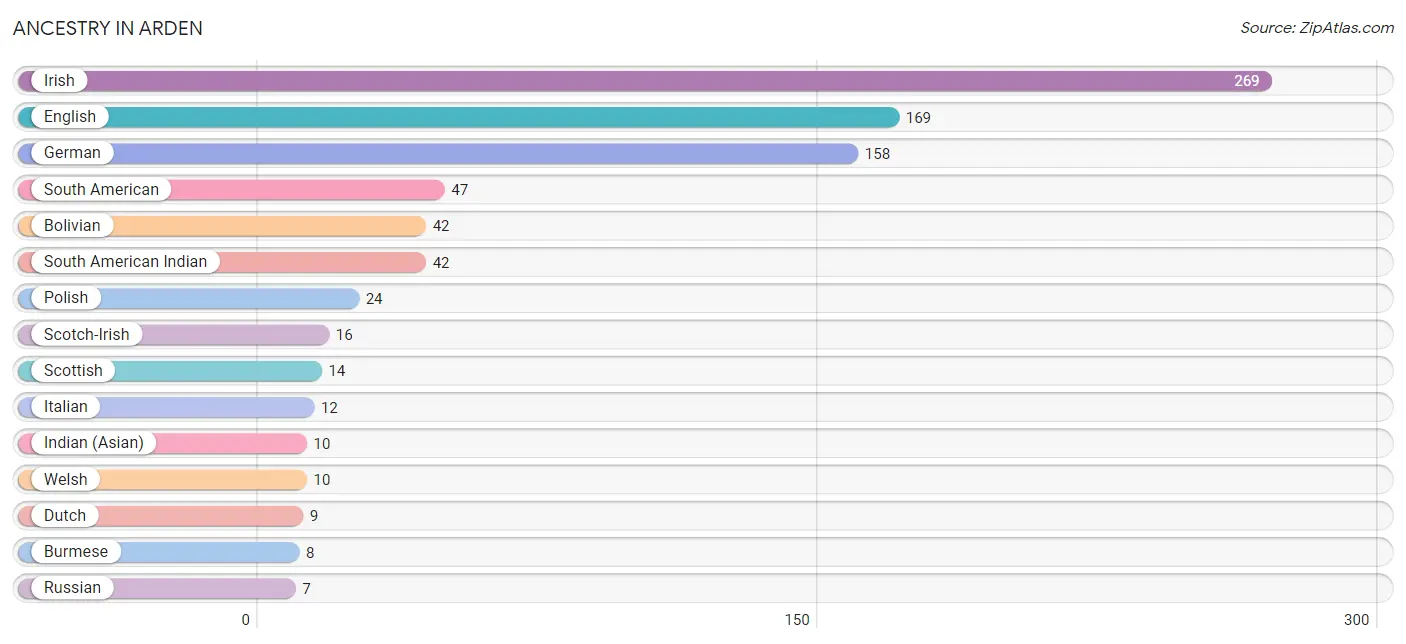
| Ancestry | # Population | % Population |
| American | 4 | 0.6% |
| Armenian | 1 | 0.2% |
| Bolivian | 42 | 6.4% |
| British | 6 | 0.9% |
| Burmese | 8 | 1.2% |
| Canadian | 2 | 0.3% |
| Colombian | 5 | 0.8% |
| Czech | 1 | 0.2% |
| Danish | 4 | 0.6% |
| Dutch | 9 | 1.4% |
| English | 169 | 25.9% |
| French | 4 | 0.6% |
| German | 158 | 24.2% |
| Hungarian | 6 | 0.9% |
| Indian (Asian) | 10 | 1.5% |
| Irish | 269 | 41.3% |
| Italian | 12 | 1.8% |
| Korean | 1 | 0.2% |
| Lithuanian | 6 | 0.9% |
| Northern European | 3 | 0.5% |
| Norwegian | 4 | 0.6% |
| Pennsylvania German | 2 | 0.3% |
| Polish | 24 | 3.7% |
| Portuguese | 5 | 0.8% |
| Russian | 7 | 1.1% |
| Scandinavian | 2 | 0.3% |
| Scotch-Irish | 16 | 2.5% |
| Scottish | 14 | 2.1% |
| South American | 47 | 7.2% |
| South American Indian | 42 | 6.4% |
| Swedish | 2 | 0.3% |
| Ukrainian | 1 | 0.2% |
| Welsh | 10 | 1.5% | View All 33 Rows |
Immigrants in Arden
The most numerous immigrant groups reported in Arden came from Bolivia (42 | 6.4%), Latin America (42 | 6.4%), South America (42 | 6.4%), Asia (10 | 1.5%), and China (10 | 1.5%), together accounting for 22.4% of all Arden residents.
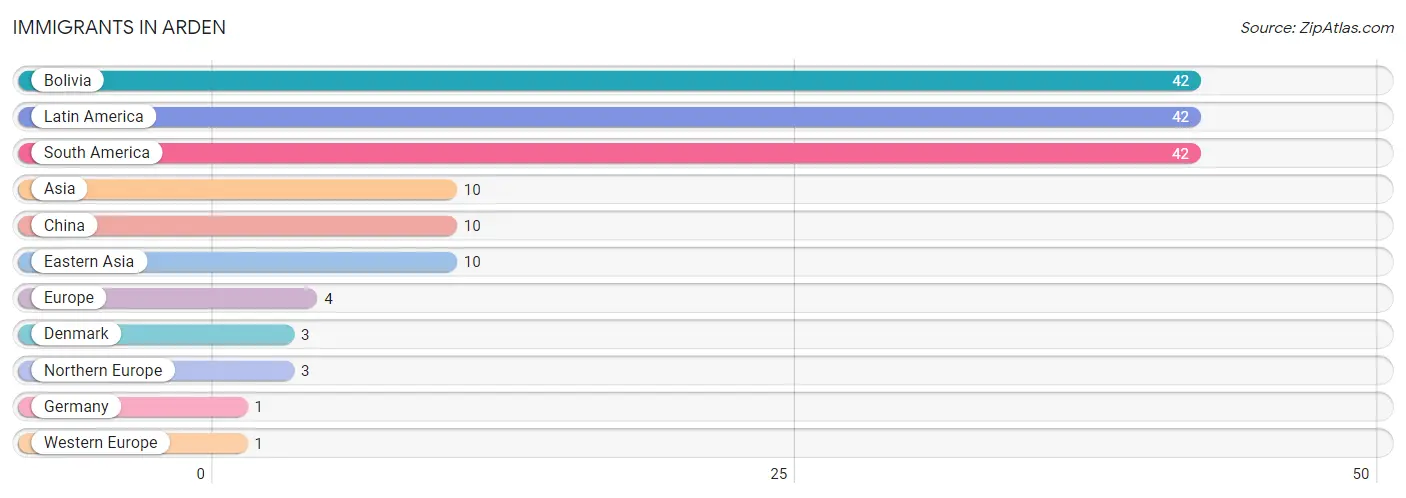
| Immigration Origin | # Population | % Population |
| Asia | 10 | 1.5% |
| Bolivia | 42 | 6.4% |
| China | 10 | 1.5% |
| Denmark | 3 | 0.5% |
| Eastern Asia | 10 | 1.5% |
| Europe | 4 | 0.6% |
| Germany | 1 | 0.2% |
| Latin America | 42 | 6.4% |
| Northern Europe | 3 | 0.5% |
| South America | 42 | 6.4% |
| Western Europe | 1 | 0.2% | View All 11 Rows |
Sex and Age in Arden
Sex and Age in Arden
The most populous age groups in Arden are 65 to 69 Years (68 | 22.6%) for men and 65 to 69 Years (81 | 23.1%) for women.
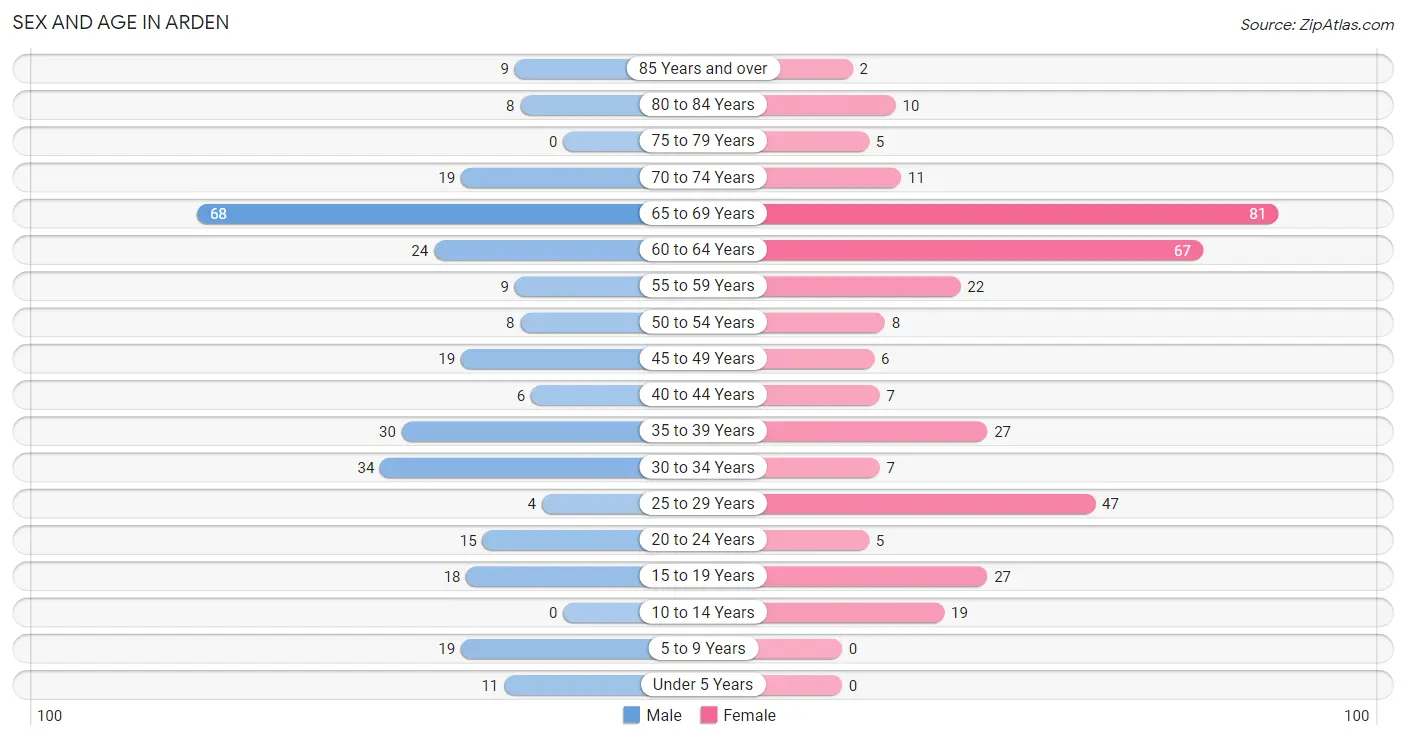
| Age Bracket | Male | Female |
| Under 5 Years | 11 (3.6%) | 0 (0.0%) |
| 5 to 9 Years | 19 (6.3%) | 0 (0.0%) |
| 10 to 14 Years | 0 (0.0%) | 19 (5.4%) |
| 15 to 19 Years | 18 (6.0%) | 27 (7.7%) |
| 20 to 24 Years | 15 (5.0%) | 5 (1.4%) |
| 25 to 29 Years | 4 (1.3%) | 47 (13.4%) |
| 30 to 34 Years | 34 (11.3%) | 7 (2.0%) |
| 35 to 39 Years | 30 (10.0%) | 27 (7.7%) |
| 40 to 44 Years | 6 (2.0%) | 7 (2.0%) |
| 45 to 49 Years | 19 (6.3%) | 6 (1.7%) |
| 50 to 54 Years | 8 (2.7%) | 8 (2.3%) |
| 55 to 59 Years | 9 (3.0%) | 22 (6.3%) |
| 60 to 64 Years | 24 (8.0%) | 67 (19.1%) |
| 65 to 69 Years | 68 (22.6%) | 81 (23.1%) |
| 70 to 74 Years | 19 (6.3%) | 11 (3.1%) |
| 75 to 79 Years | 0 (0.0%) | 5 (1.4%) |
| 80 to 84 Years | 8 (2.7%) | 10 (2.9%) |
| 85 Years and over | 9 (3.0%) | 2 (0.6%) |
| Total | 301 (100.0%) | 351 (100.0%) |
Families and Households in Arden
Median Family Size in Arden
The median family size in Arden is 2.87 persons per family, with single male/father families (19 | 10.6%) accounting for the largest median family size of 5.05 persons per family. On the other hand, single female/mother families (44 | 24.6%) represent the smallest median family size with 2.59 persons per family.
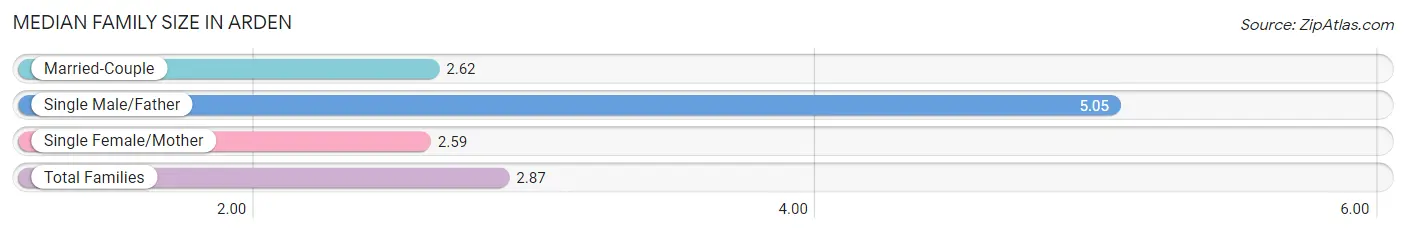
| Family Type | # Families | Family Size |
| Married-Couple | 116 (64.8%) | 2.62 |
| Single Male/Father | 19 (10.6%) | 5.05 |
| Single Female/Mother | 44 (24.6%) | 2.59 |
| Total Families | 179 (100.0%) | 2.87 |
Median Household Size in Arden
The median household size in Arden is 2.35 persons per household, with single male/father households (19 | 6.9%) accounting for the largest median household size of 5.74 persons per household. non-family households (98 | 35.4%) represent the smallest median household size with 1.24 persons per household.
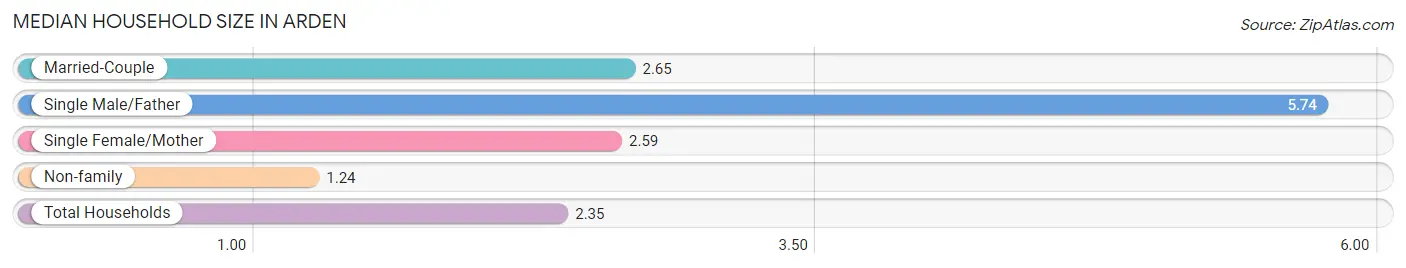
| Household Type | # Households | Household Size |
| Married-Couple | 116 (41.9%) | 2.65 |
| Single Male/Father | 19 (6.9%) | 5.74 |
| Single Female/Mother | 44 (15.9%) | 2.59 |
| Non-family | 98 (35.4%) | 1.24 |
| Total Households | 277 (100.0%) | 2.35 |
Household Size by Marriage Status in Arden
Out of a total of 277 households in Arden, 179 (64.6%) are family households, while 98 (35.4%) are nonfamily households. The most numerous type of family households are 2-person households, comprising 68, and the most common type of nonfamily households are 1-person households, comprising 76.
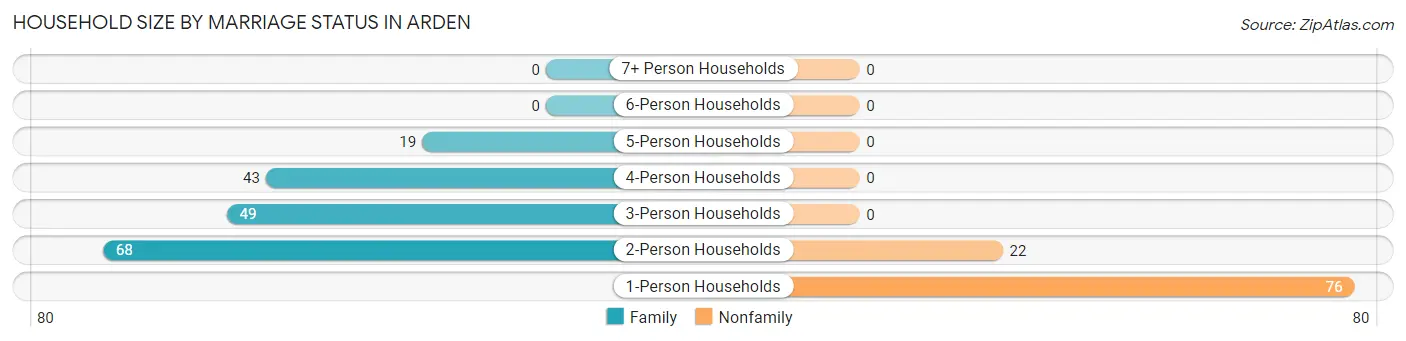
| Household Size | Family Households | Nonfamily Households |
| 1-Person Households | - | 76 (27.4%) |
| 2-Person Households | 68 (24.5%) | 22 (7.9%) |
| 3-Person Households | 49 (17.7%) | 0 (0.0%) |
| 4-Person Households | 43 (15.5%) | 0 (0.0%) |
| 5-Person Households | 19 (6.9%) | 0 (0.0%) |
| 6-Person Households | 0 (0.0%) | 0 (0.0%) |
| 7+ Person Households | 0 (0.0%) | 0 (0.0%) |
| Total | 179 (64.6%) | 98 (35.4%) |
Female Fertility in Arden
Fertility by Age in Arden
| Age Bracket | Women with Births | Births / 1,000 Women |
| 15 to 19 years | 0 (0.0%) | 0.0 |
| 20 to 34 years | 0 (0.0%) | 0.0 |
| 35 to 50 years | 0 (0.0%) | 0.0 |
| Total | 0 (0.0%) | 0.0 |
Fertility by Age by Marriage Status in Arden
| Age Bracket | Married | Unmarried |
| 15 to 19 years | 0 (0.0%) | 0 (0.0%) |
| 20 to 34 years | 0 (0.0%) | 0 (0.0%) |
| 35 to 50 years | 0 (0.0%) | 0 (0.0%) |
| Total | 0 (0.0%) | 0 (0.0%) |
Fertility by Education in Arden
| Educational Attainment | Women with Births | Births / 1,000 Women |
| Less than High School | 0 (0.0%) | 0.0 |
| High School Diploma | 0 (0.0%) | 0.0 |
| College or Associate's Degree | 0 (0.0%) | 0.0 |
| Bachelor's Degree | 0 (0.0%) | 0.0 |
| Graduate Degree | 0 (0.0%) | 0.0 |
| Total | 0 (0.0%) | 0.0 |
Fertility by Education by Marriage Status in Arden
| Educational Attainment | Married | Unmarried |
| Less than High School | 0 (0.0%) | 0 (0.0%) |
| High School Diploma | 0 (0.0%) | 0 (0.0%) |
| College or Associate's Degree | 0 (0.0%) | 0 (0.0%) |
| Bachelor's Degree | 0 (0.0%) | 0 (0.0%) |
| Graduate Degree | 0 (0.0%) | 0 (0.0%) |
| Total | 0 (0.0%) | 0 (0.0%) |
Employment Characteristics in Arden
Employment by Class of Employer in Arden
Among the 292 employed individuals in Arden, private company employees (192 | 65.7%), self-employed (not incorporated) (34 | 11.6%), and state government employees (30 | 10.3%) make up the most common classes of employment.
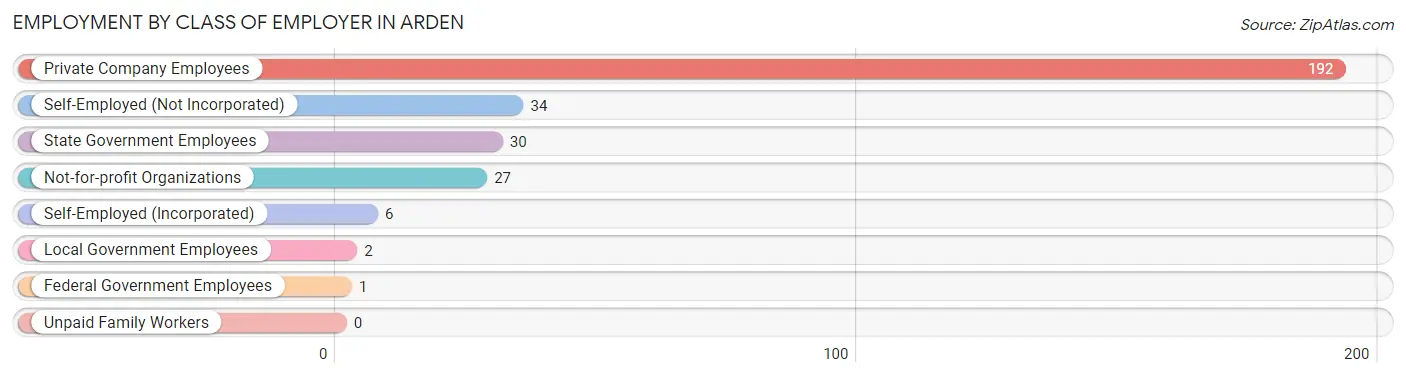
| Employer Class | # Employees | % Employees |
| Private Company Employees | 192 | 65.7% |
| Self-Employed (Incorporated) | 6 | 2.1% |
| Self-Employed (Not Incorporated) | 34 | 11.6% |
| Not-for-profit Organizations | 27 | 9.2% |
| Local Government Employees | 2 | 0.7% |
| State Government Employees | 30 | 10.3% |
| Federal Government Employees | 1 | 0.3% |
| Unpaid Family Workers | 0 | 0.0% |
| Total | 292 | 100.0% |
Employment Status by Age in Arden
According to the labor force statistics for Arden, out of the total population over 16 years of age (594), 52.7% or 313 individuals are in the labor force, with 4.5% or 14 of them unemployed. The age group with the highest labor force participation rate is 30 to 34 years, with 100.0% or 41 individuals in the labor force. Within the labor force, the 35 to 44 years age range has the highest percentage of unemployed individuals, with 23.7% or 14 of them being unemployed.
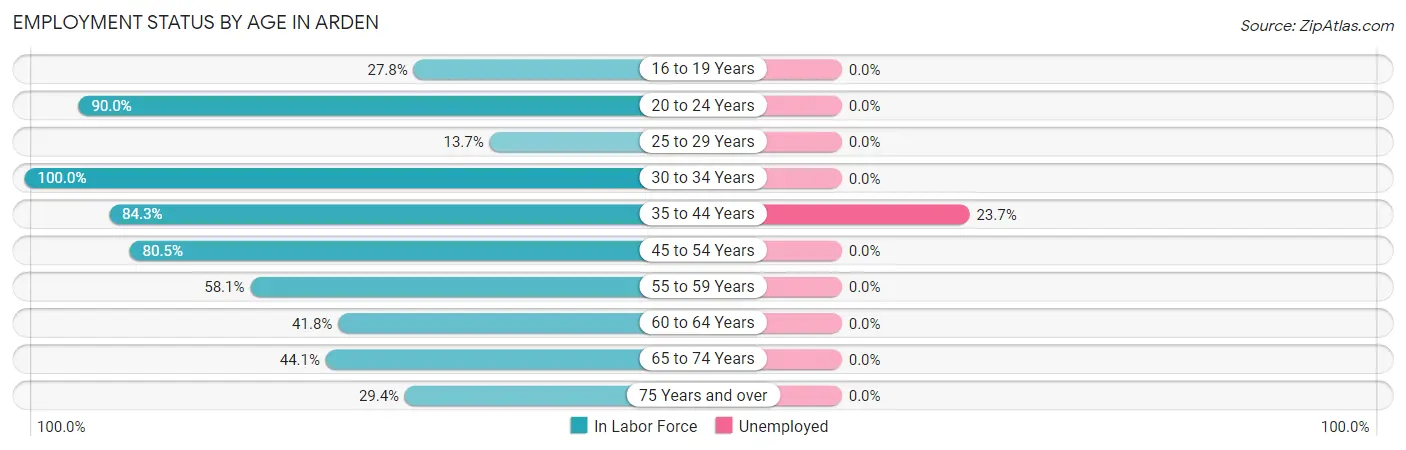
| Age Bracket | In Labor Force | Unemployed |
| 16 to 19 Years | 10 (27.8%) | 0 (0.0%) |
| 20 to 24 Years | 18 (90.0%) | 0 (0.0%) |
| 25 to 29 Years | 7 (13.7%) | 0 (0.0%) |
| 30 to 34 Years | 41 (100.0%) | 0 (0.0%) |
| 35 to 44 Years | 59 (84.3%) | 14 (23.7%) |
| 45 to 54 Years | 33 (80.5%) | 0 (0.0%) |
| 55 to 59 Years | 18 (58.1%) | 0 (0.0%) |
| 60 to 64 Years | 38 (41.8%) | 0 (0.0%) |
| 65 to 74 Years | 79 (44.1%) | 0 (0.0%) |
| 75 Years and over | 10 (29.4%) | 0 (0.0%) |
| Total | 313 (52.7%) | 14 (4.5%) |
Employment Status by Educational Attainment in Arden
According to labor force statistics for Arden, 60.3% of individuals (196) out of the total population between 25 and 64 years of age (325) are in the labor force, with 7.1% or 14 of them being unemployed. The group with the highest labor force participation rate are those with the educational attainment of high school diploma, with 81.2% or 69 individuals in the labor force. Within the labor force, individuals with college / associate degree education have the highest percentage of unemployment, with 35.9% or 14 of them being unemployed.
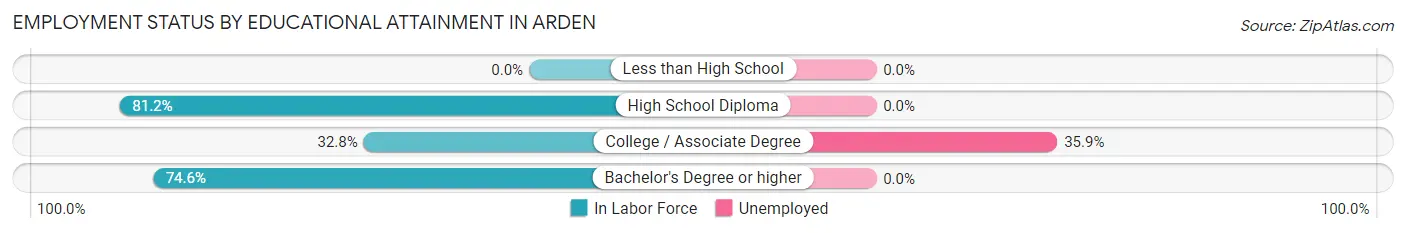
| Educational Attainment | In Labor Force | Unemployed |
| Less than High School | 0 (0.0%) | 0 (0.0%) |
| High School Diploma | 69 (81.2%) | 0 (0.0%) |
| College / Associate Degree | 39 (32.8%) | 43 (35.9%) |
| Bachelor's Degree or higher | 88 (74.6%) | 0 (0.0%) |
| Total | 196 (60.3%) | 23 (7.1%) |
Employment Occupations by Sex in Arden
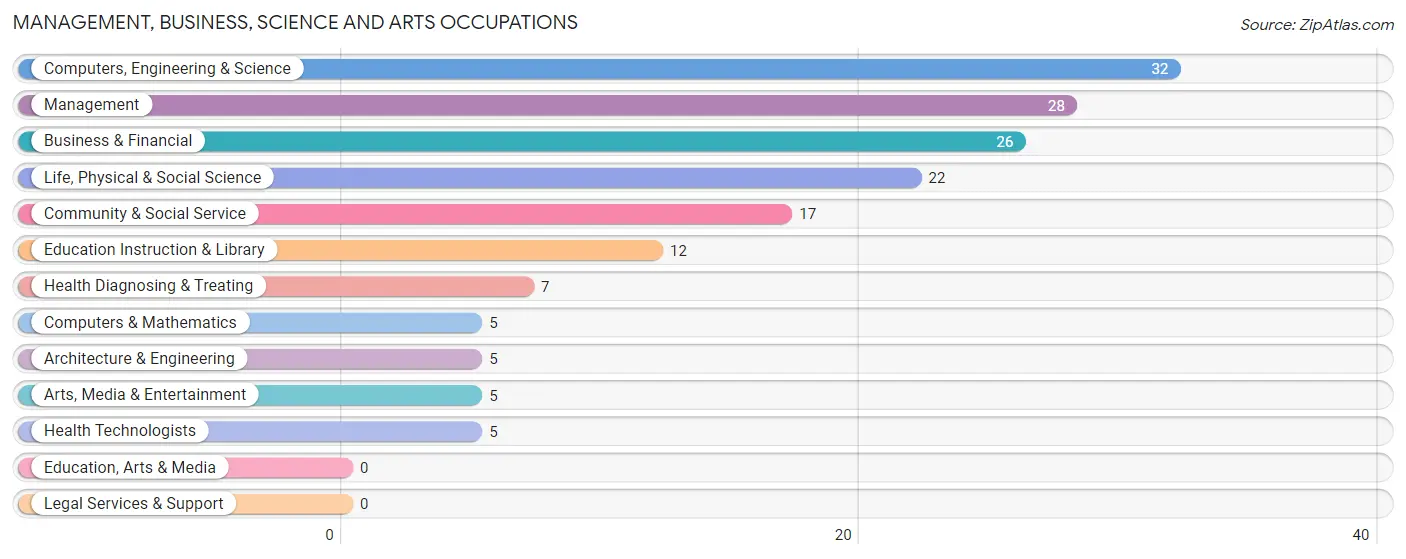
Management, Business, Science and Arts Occupations
The most common Management, Business, Science and Arts occupations in Arden are Computers, Engineering & Science (32 | 10.7%), Management (28 | 9.4%), Business & Financial (26 | 8.7%), Life, Physical & Social Science (22 | 7.4%), and Community & Social Service (17 | 5.7%).
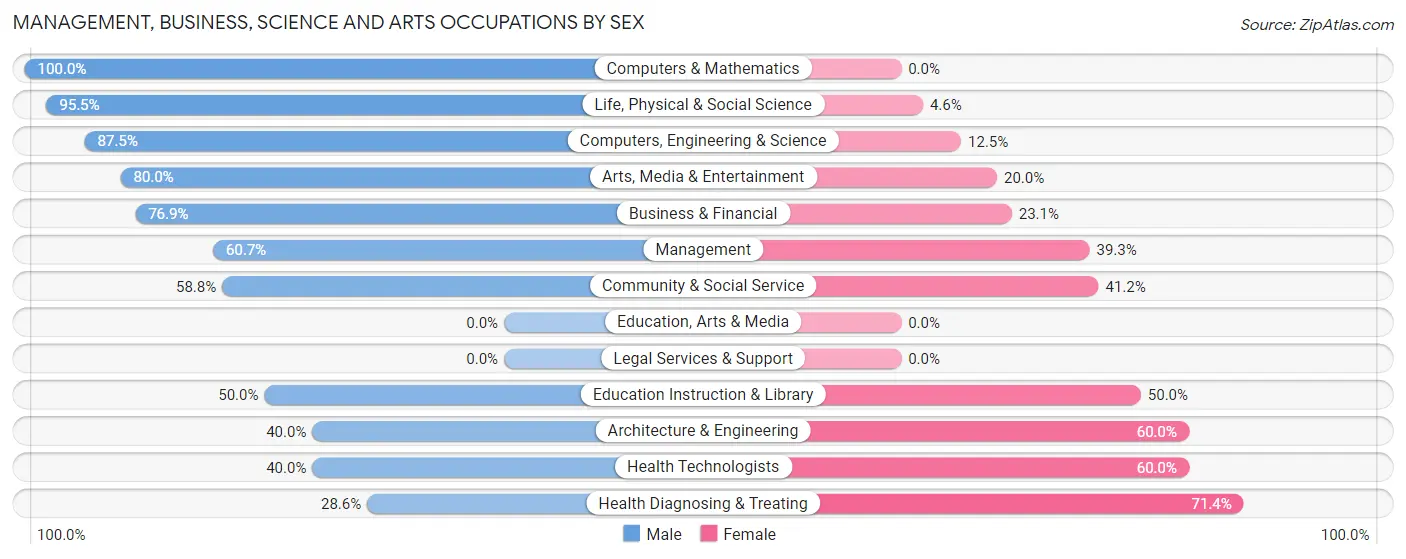
Management, Business, Science and Arts Occupations by Sex
Within the Management, Business, Science and Arts occupations in Arden, the most male-oriented occupations are Computers & Mathematics (100.0%), Life, Physical & Social Science (95.5%), and Computers, Engineering & Science (87.5%), while the most female-oriented occupations are Health Diagnosing & Treating (71.4%), Architecture & Engineering (60.0%), and Health Technologists (60.0%).
| Occupation | Male | Female |
| Management | 17 (60.7%) | 11 (39.3%) |
| Business & Financial | 20 (76.9%) | 6 (23.1%) |
| Computers, Engineering & Science | 28 (87.5%) | 4 (12.5%) |
| Computers & Mathematics | 5 (100.0%) | 0 (0.0%) |
| Architecture & Engineering | 2 (40.0%) | 3 (60.0%) |
| Life, Physical & Social Science | 21 (95.5%) | 1 (4.5%) |
| Community & Social Service | 10 (58.8%) | 7 (41.2%) |
| Education, Arts & Media | 0 (0.0%) | 0 (0.0%) |
| Legal Services & Support | 0 (0.0%) | 0 (0.0%) |
| Education Instruction & Library | 6 (50.0%) | 6 (50.0%) |
| Arts, Media & Entertainment | 4 (80.0%) | 1 (20.0%) |
| Health Diagnosing & Treating | 2 (28.6%) | 5 (71.4%) |
| Health Technologists | 2 (40.0%) | 3 (60.0%) |
| Total (Category) | 77 (70.0%) | 33 (30.0%) |
| Total (Overall) | 210 (70.2%) | 89 (29.8%) |
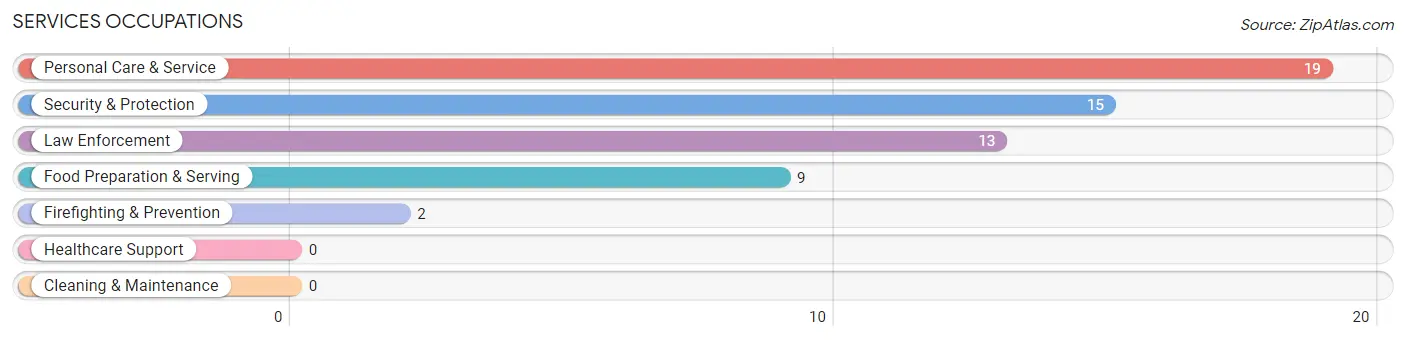
Services Occupations
The most common Services occupations in Arden are Personal Care & Service (19 | 6.4%), Security & Protection (15 | 5.0%), Law Enforcement (13 | 4.3%), Food Preparation & Serving (9 | 3.0%), and Firefighting & Prevention (2 | 0.7%).
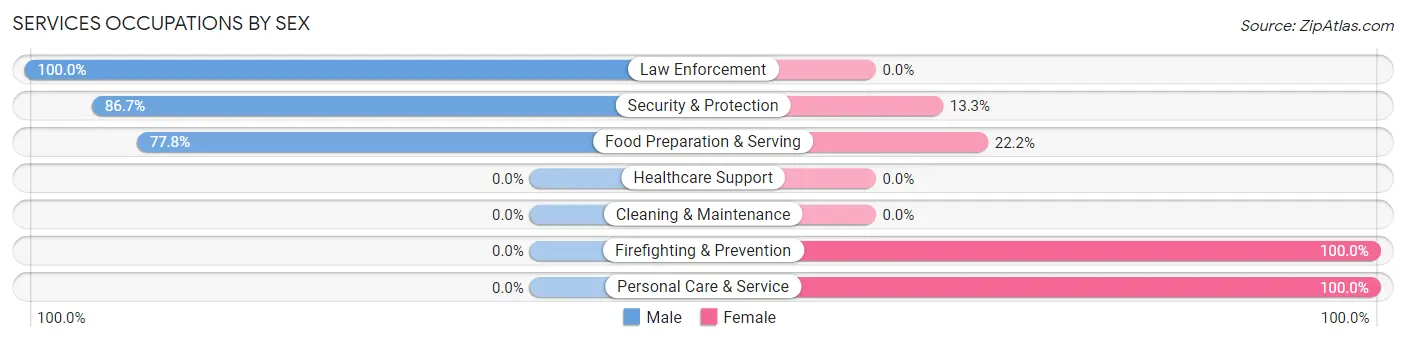
Services Occupations by Sex
Within the Services occupations in Arden, the most male-oriented occupations are Law Enforcement (100.0%), Security & Protection (86.7%), and Food Preparation & Serving (77.8%), while the most female-oriented occupations are Firefighting & Prevention (100.0%), Personal Care & Service (100.0%), and Food Preparation & Serving (22.2%).
| Occupation | Male | Female |
| Healthcare Support | 0 (0.0%) | 0 (0.0%) |
| Security & Protection | 13 (86.7%) | 2 (13.3%) |
| Firefighting & Prevention | 0 (0.0%) | 2 (100.0%) |
| Law Enforcement | 13 (100.0%) | 0 (0.0%) |
| Food Preparation & Serving | 7 (77.8%) | 2 (22.2%) |
| Cleaning & Maintenance | 0 (0.0%) | 0 (0.0%) |
| Personal Care & Service | 0 (0.0%) | 19 (100.0%) |
| Total (Category) | 20 (46.5%) | 23 (53.5%) |
| Total (Overall) | 210 (70.2%) | 89 (29.8%) |
Sales and Office Occupations
The most common Sales and Office occupations in Arden are Sales & Related (76 | 25.4%), and Office & Administration (14 | 4.7%).
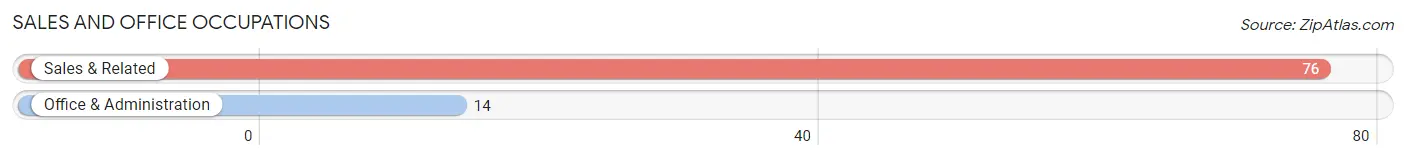
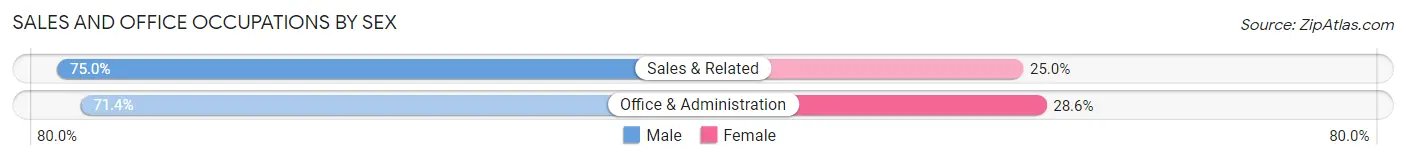
Sales and Office Occupations by Sex
| Occupation | Male | Female |
| Sales & Related | 57 (75.0%) | 19 (25.0%) |
| Office & Administration | 10 (71.4%) | 4 (28.6%) |
| Total (Category) | 67 (74.4%) | 23 (25.6%) |
| Total (Overall) | 210 (70.2%) | 89 (29.8%) |
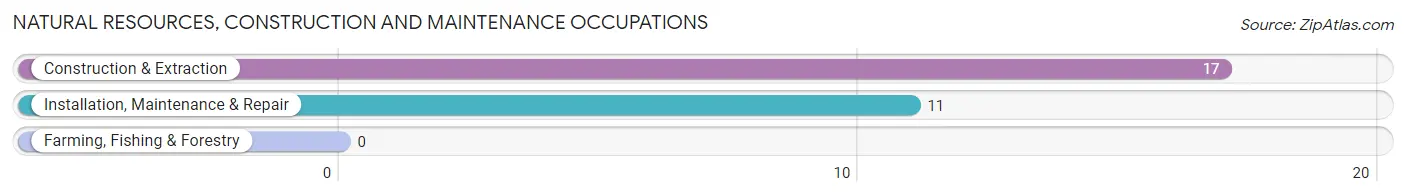
Natural Resources, Construction and Maintenance Occupations
The most common Natural Resources, Construction and Maintenance occupations in Arden are Construction & Extraction (17 | 5.7%), and Installation, Maintenance & Repair (11 | 3.7%).
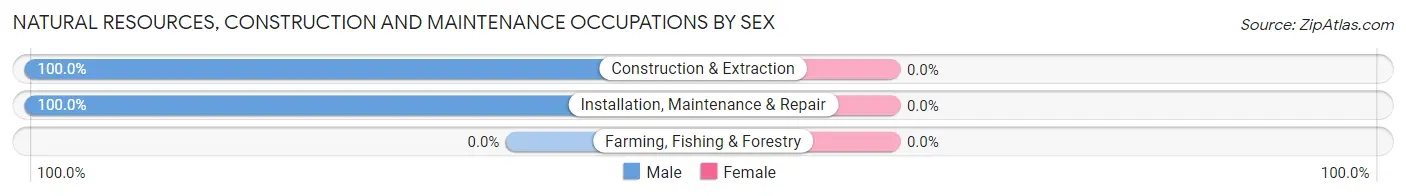
Natural Resources, Construction and Maintenance Occupations by Sex
| Occupation | Male | Female |
| Farming, Fishing & Forestry | 0 (0.0%) | 0 (0.0%) |
| Construction & Extraction | 17 (100.0%) | 0 (0.0%) |
| Installation, Maintenance & Repair | 11 (100.0%) | 0 (0.0%) |
| Total (Category) | 28 (100.0%) | 0 (0.0%) |
| Total (Overall) | 210 (70.2%) | 89 (29.8%) |
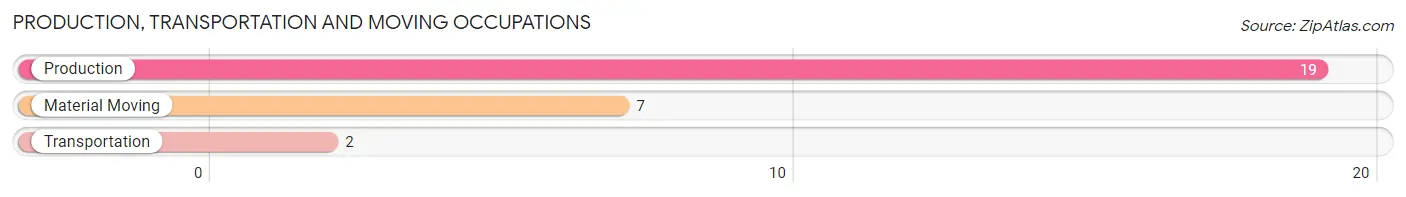
Production, Transportation and Moving Occupations
The most common Production, Transportation and Moving occupations in Arden are Production (19 | 6.4%), Material Moving (7 | 2.3%), and Transportation (2 | 0.7%).
Production, Transportation and Moving Occupations by Sex
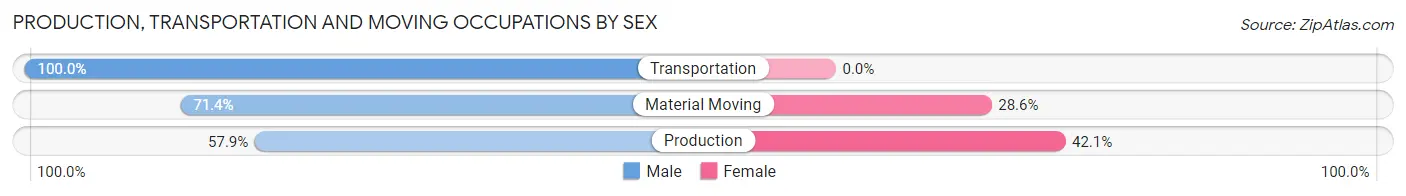
| Occupation | Male | Female |
| Production | 11 (57.9%) | 8 (42.1%) |
| Transportation | 2 (100.0%) | 0 (0.0%) |
| Material Moving | 5 (71.4%) | 2 (28.6%) |
| Total (Category) | 18 (64.3%) | 10 (35.7%) |
| Total (Overall) | 210 (70.2%) | 89 (29.8%) |
Employment Industries by Sex in Arden
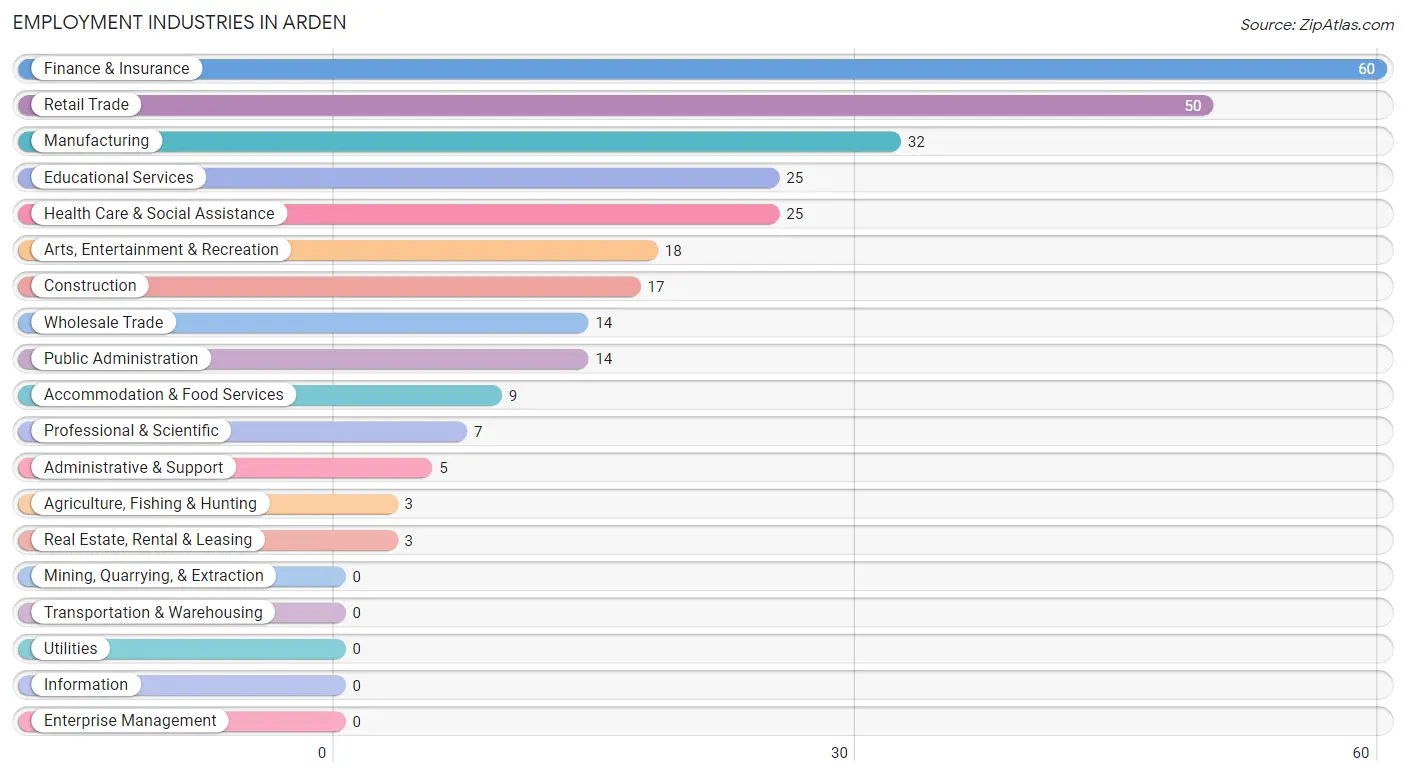
Employment Industries in Arden
The major employment industries in Arden include Finance & Insurance (60 | 20.1%), Retail Trade (50 | 16.7%), Manufacturing (32 | 10.7%), Educational Services (25 | 8.4%), and Health Care & Social Assistance (25 | 8.4%).
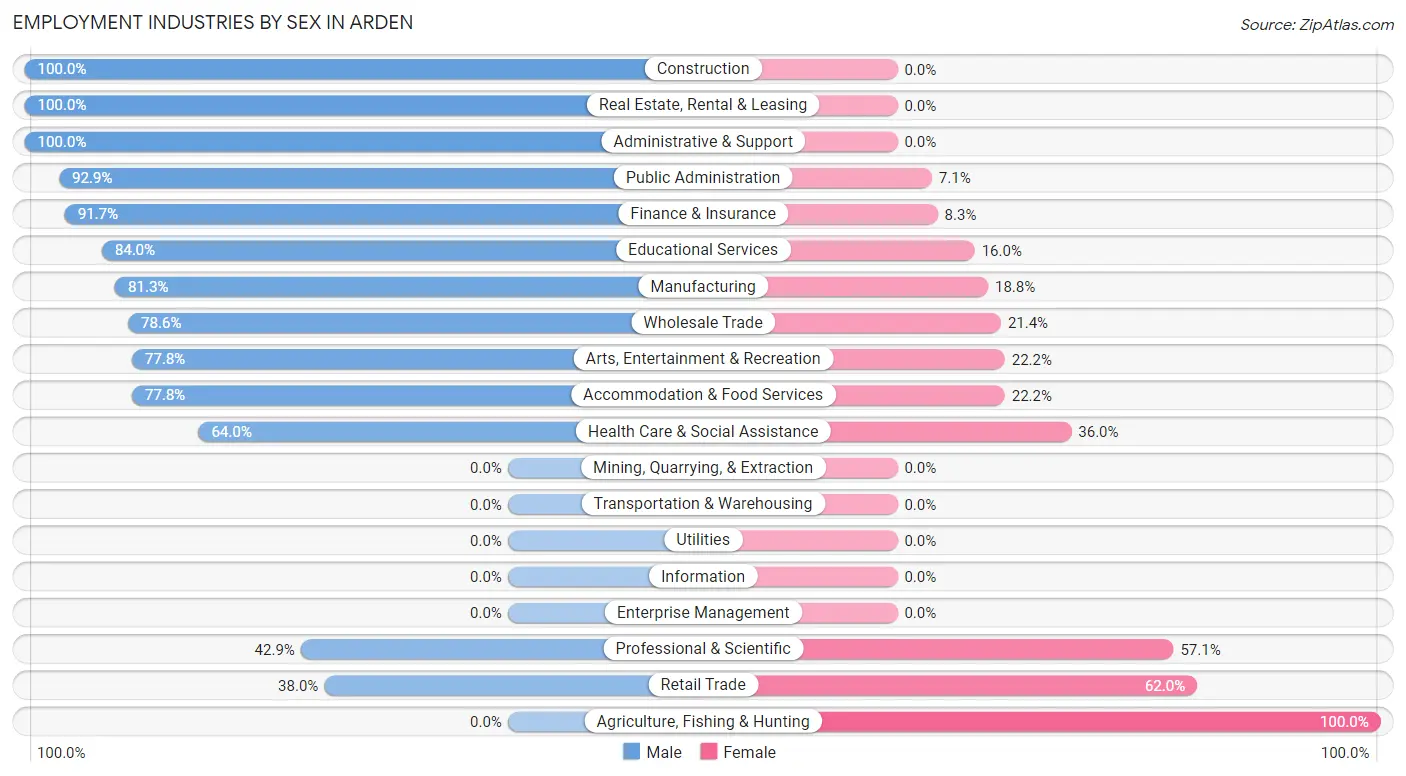
Employment Industries by Sex in Arden
The Arden industries that see more men than women are Construction (100.0%), Real Estate, Rental & Leasing (100.0%), and Administrative & Support (100.0%), whereas the industries that tend to have a higher number of women are Agriculture, Fishing & Hunting (100.0%), Retail Trade (62.0%), and Professional & Scientific (57.1%).
| Industry | Male | Female |
| Agriculture, Fishing & Hunting | 0 (0.0%) | 3 (100.0%) |
| Mining, Quarrying, & Extraction | 0 (0.0%) | 0 (0.0%) |
| Construction | 17 (100.0%) | 0 (0.0%) |
| Manufacturing | 26 (81.2%) | 6 (18.8%) |
| Wholesale Trade | 11 (78.6%) | 3 (21.4%) |
| Retail Trade | 19 (38.0%) | 31 (62.0%) |
| Transportation & Warehousing | 0 (0.0%) | 0 (0.0%) |
| Utilities | 0 (0.0%) | 0 (0.0%) |
| Information | 0 (0.0%) | 0 (0.0%) |
| Finance & Insurance | 55 (91.7%) | 5 (8.3%) |
| Real Estate, Rental & Leasing | 3 (100.0%) | 0 (0.0%) |
| Professional & Scientific | 3 (42.9%) | 4 (57.1%) |
| Enterprise Management | 0 (0.0%) | 0 (0.0%) |
| Administrative & Support | 5 (100.0%) | 0 (0.0%) |
| Educational Services | 21 (84.0%) | 4 (16.0%) |
| Health Care & Social Assistance | 16 (64.0%) | 9 (36.0%) |
| Arts, Entertainment & Recreation | 14 (77.8%) | 4 (22.2%) |
| Accommodation & Food Services | 7 (77.8%) | 2 (22.2%) |
| Public Administration | 13 (92.9%) | 1 (7.1%) |
| Total | 210 (70.2%) | 89 (29.8%) |
Education in Arden
School Enrollment in Arden
The most common levels of schooling among the 82 students in Arden are college / undergraduate (26 | 31.7%), elementary school (22 | 26.8%), and high school (19 | 23.2%).
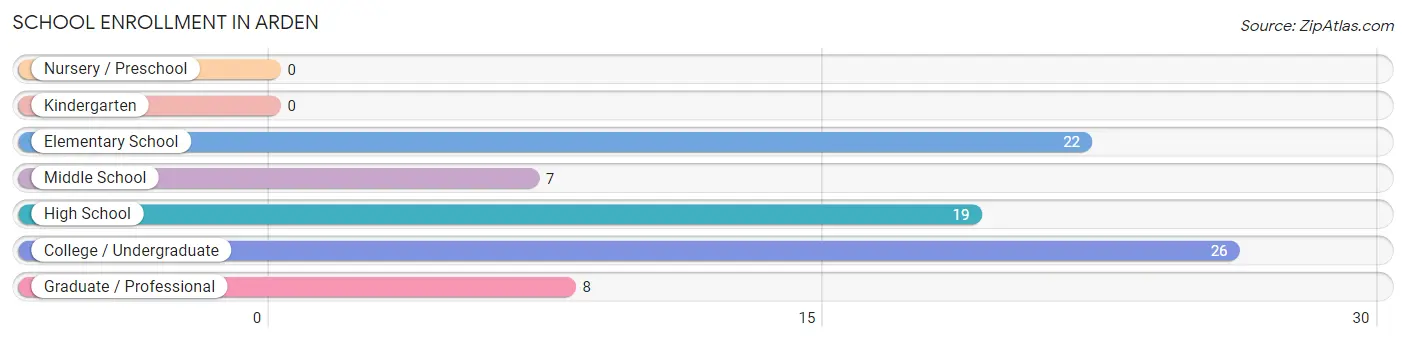
| School Level | # Students | % Students |
| Nursery / Preschool | 0 | 0.0% |
| Kindergarten | 0 | 0.0% |
| Elementary School | 22 | 26.8% |
| Middle School | 7 | 8.5% |
| High School | 19 | 23.2% |
| College / Undergraduate | 26 | 31.7% |
| Graduate / Professional | 8 | 9.8% |
| Total | 82 | 100.0% |
School Enrollment by Age by Funding Source in Arden
Out of a total of 82 students who are enrolled in schools in Arden, 36 (43.9%) attend a private institution, while the remaining 46 (56.1%) are enrolled in public schools. The age group of 18 to 19 year olds has the highest likelihood of being enrolled in private schools, with 18 (64.3% in the age bracket) enrolled. Conversely, the age group of 15 to 17 year olds has the lowest likelihood of being enrolled in a private school, with 9 (100.0% in the age bracket) attending a public institution.
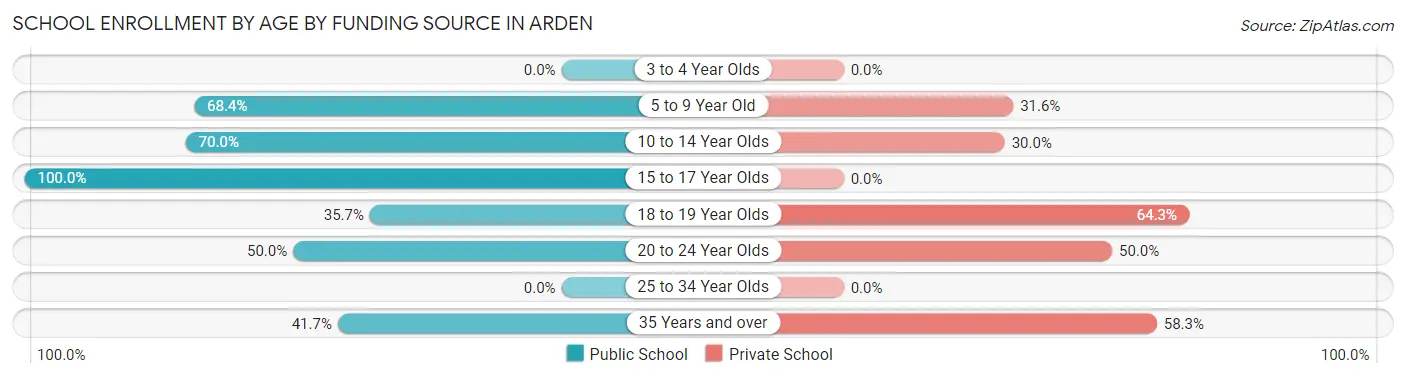
| Age Bracket | Public School | Private School |
| 3 to 4 Year Olds | 0 (0.0%) | 0 (0.0%) |
| 5 to 9 Year Old | 13 (68.4%) | 6 (31.6%) |
| 10 to 14 Year Olds | 7 (70.0%) | 3 (30.0%) |
| 15 to 17 Year Olds | 9 (100.0%) | 0 (0.0%) |
| 18 to 19 Year Olds | 10 (35.7%) | 18 (64.3%) |
| 20 to 24 Year Olds | 2 (50.0%) | 2 (50.0%) |
| 25 to 34 Year Olds | 0 (0.0%) | 0 (0.0%) |
| 35 Years and over | 5 (41.7%) | 7 (58.3%) |
| Total | 46 (56.1%) | 36 (43.9%) |
Educational Attainment by Field of Study in Arden
Visual & performing arts (30 | 14.9%), physical & health sciences (29 | 14.4%), engineering (21 | 10.4%), social sciences (18 | 9.0%), and science & technology (15 | 7.5%) are the most common fields of study among 201 individuals in Arden who have obtained a bachelor's degree or higher.
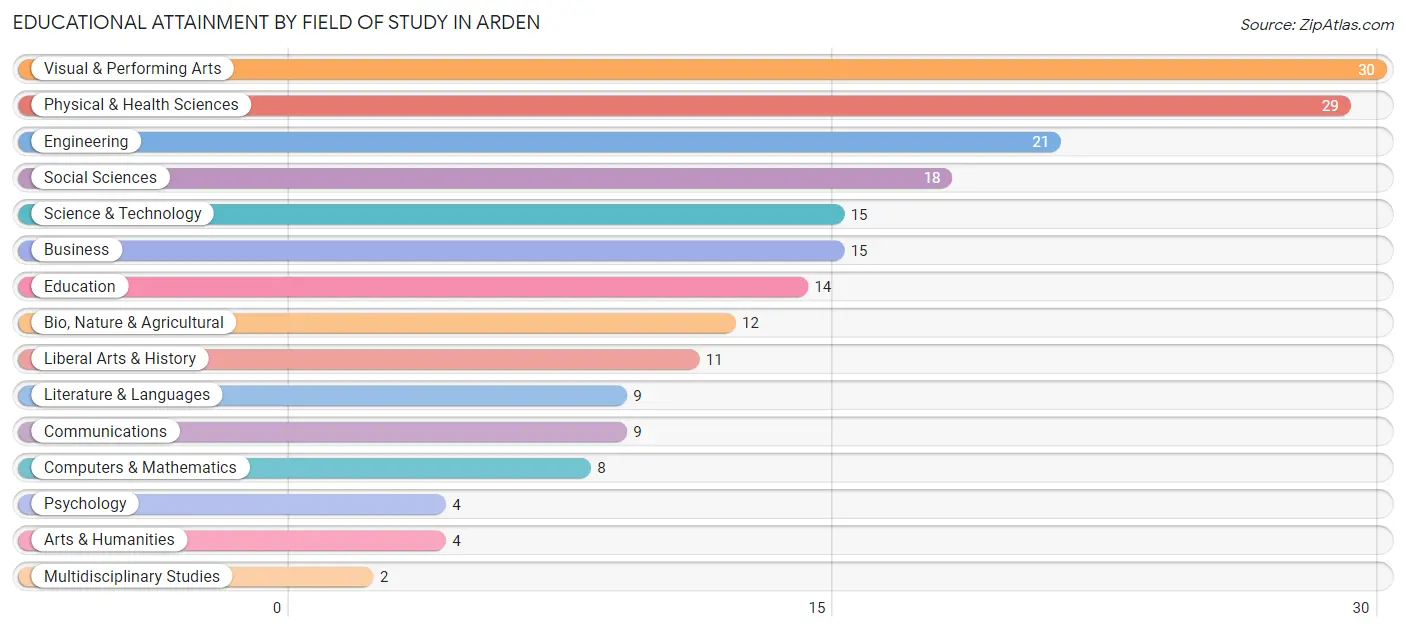
| Field of Study | # Graduates | % Graduates |
| Computers & Mathematics | 8 | 4.0% |
| Bio, Nature & Agricultural | 12 | 6.0% |
| Physical & Health Sciences | 29 | 14.4% |
| Psychology | 4 | 2.0% |
| Social Sciences | 18 | 9.0% |
| Engineering | 21 | 10.4% |
| Multidisciplinary Studies | 2 | 1.0% |
| Science & Technology | 15 | 7.5% |
| Business | 15 | 7.5% |
| Education | 14 | 7.0% |
| Literature & Languages | 9 | 4.5% |
| Liberal Arts & History | 11 | 5.5% |
| Visual & Performing Arts | 30 | 14.9% |
| Communications | 9 | 4.5% |
| Arts & Humanities | 4 | 2.0% |
| Total | 201 | 100.0% |
Transportation & Commute in Arden
Vehicle Availability by Sex in Arden
The most prevalent vehicle ownership categories in Arden are males with 2 vehicles (86, accounting for 40.9%) and females with 2 vehicles (39, making up 104.9%).
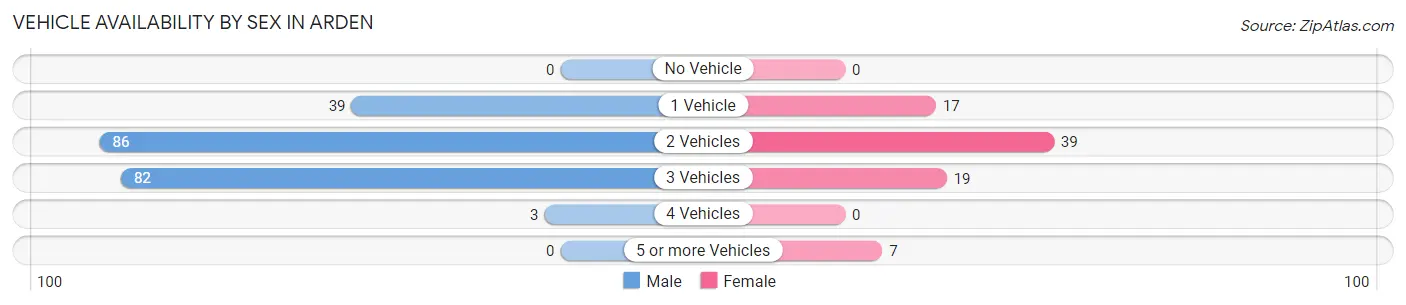
| Vehicles Available | Male | Female |
| No Vehicle | 0 (0.0%) | 0 (0.0%) |
| 1 Vehicle | 39 (18.6%) | 17 (20.7%) |
| 2 Vehicles | 86 (40.9%) | 39 (47.6%) |
| 3 Vehicles | 82 (39.1%) | 19 (23.2%) |
| 4 Vehicles | 3 (1.4%) | 0 (0.0%) |
| 5 or more Vehicles | 0 (0.0%) | 7 (8.5%) |
| Total | 210 (100.0%) | 82 (100.0%) |
Commute Time in Arden
The most frequently occuring commute durations in Arden are 10 to 14 minutes (74 commuters, 28.7%), 15 to 19 minutes (48 commuters, 18.6%), and 5 to 9 minutes (38 commuters, 14.7%).
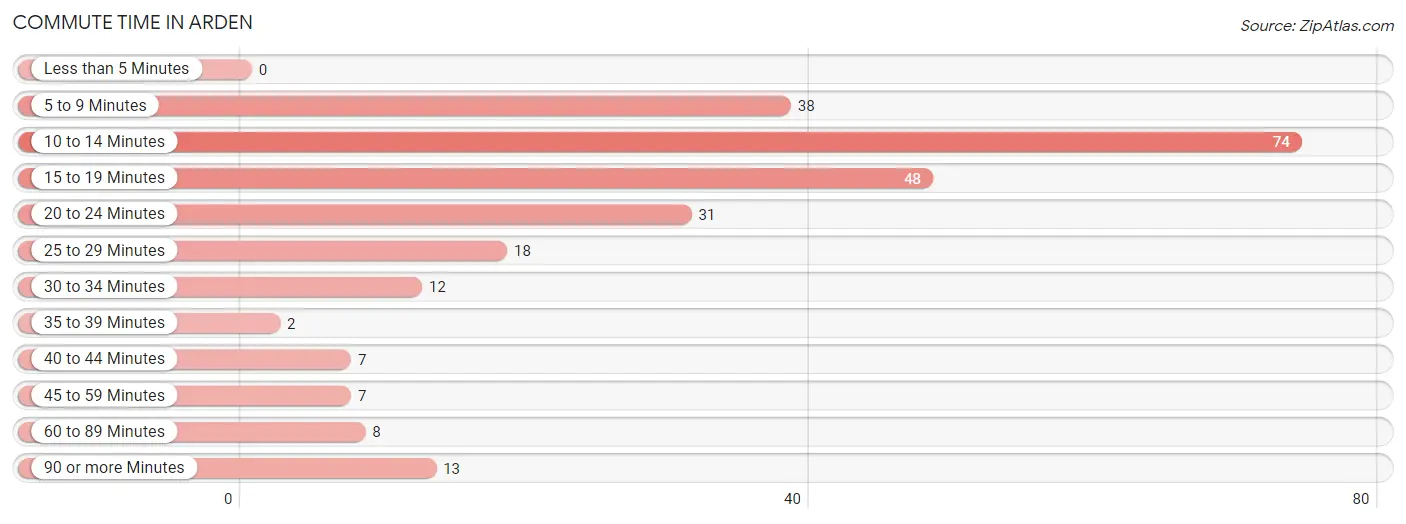
| Commute Time | # Commuters | % Commuters |
| Less than 5 Minutes | 0 | 0.0% |
| 5 to 9 Minutes | 38 | 14.7% |
| 10 to 14 Minutes | 74 | 28.7% |
| 15 to 19 Minutes | 48 | 18.6% |
| 20 to 24 Minutes | 31 | 12.0% |
| 25 to 29 Minutes | 18 | 7.0% |
| 30 to 34 Minutes | 12 | 4.6% |
| 35 to 39 Minutes | 2 | 0.8% |
| 40 to 44 Minutes | 7 | 2.7% |
| 45 to 59 Minutes | 7 | 2.7% |
| 60 to 89 Minutes | 8 | 3.1% |
| 90 or more Minutes | 13 | 5.0% |
Commute Time by Sex in Arden
The most common commute times in Arden are 10 to 14 minutes (71 commuters, 37.2%) for males and 15 to 19 minutes (18 commuters, 26.9%) for females.
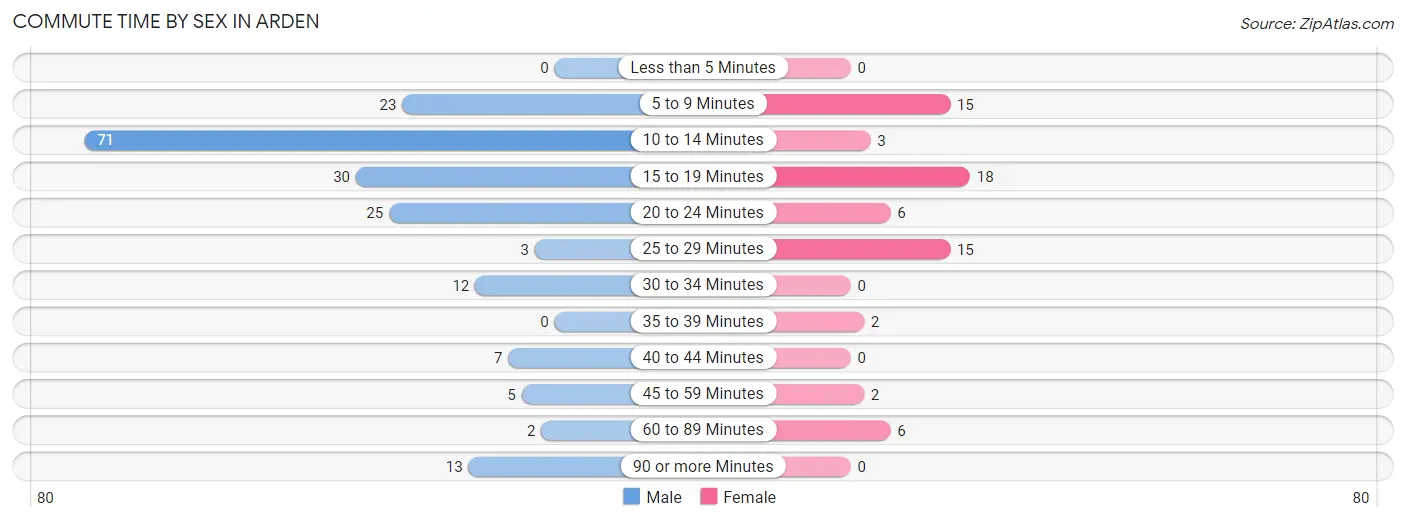
| Commute Time | Male | Female |
| Less than 5 Minutes | 0 (0.0%) | 0 (0.0%) |
| 5 to 9 Minutes | 23 (12.0%) | 15 (22.4%) |
| 10 to 14 Minutes | 71 (37.2%) | 3 (4.5%) |
| 15 to 19 Minutes | 30 (15.7%) | 18 (26.9%) |
| 20 to 24 Minutes | 25 (13.1%) | 6 (9.0%) |
| 25 to 29 Minutes | 3 (1.6%) | 15 (22.4%) |
| 30 to 34 Minutes | 12 (6.3%) | 0 (0.0%) |
| 35 to 39 Minutes | 0 (0.0%) | 2 (3.0%) |
| 40 to 44 Minutes | 7 (3.7%) | 0 (0.0%) |
| 45 to 59 Minutes | 5 (2.6%) | 2 (3.0%) |
| 60 to 89 Minutes | 2 (1.1%) | 6 (9.0%) |
| 90 or more Minutes | 13 (6.8%) | 0 (0.0%) |
Time of Departure to Work by Sex in Arden
The most frequent times of departure to work in Arden are 7:30 AM to 7:59 AM (103, 53.9%) for males and 9:00 AM to 9:59 AM (23, 34.3%) for females.
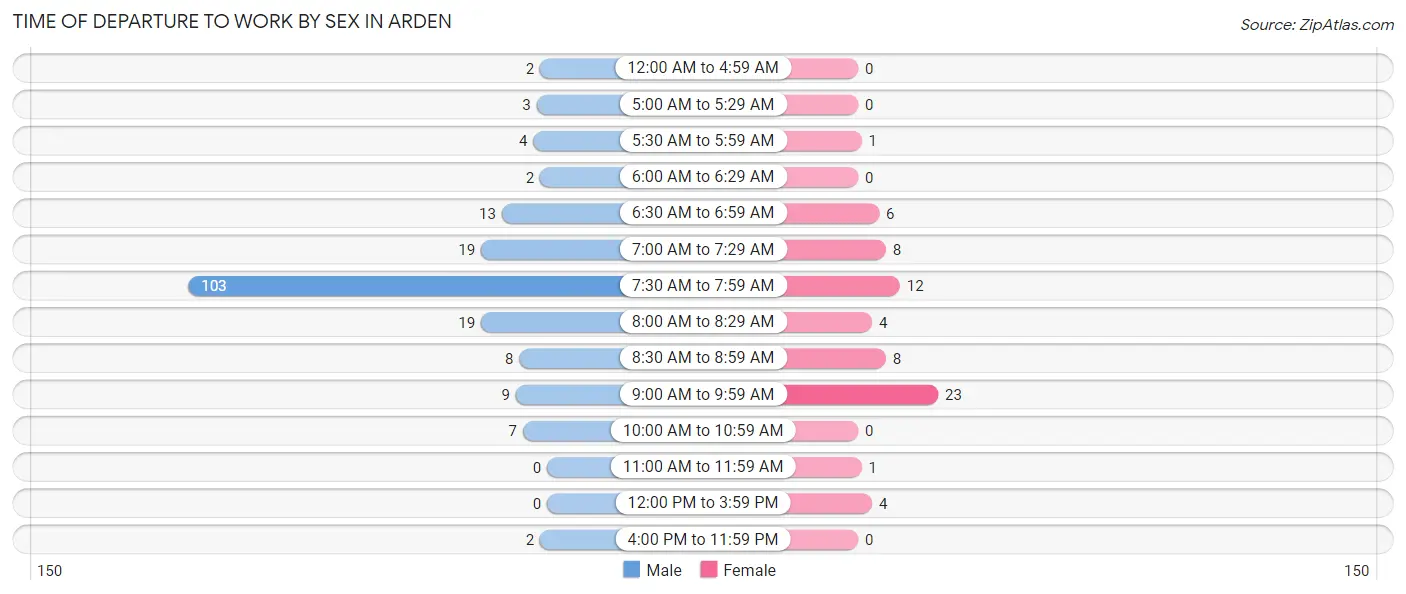
| Time of Departure | Male | Female |
| 12:00 AM to 4:59 AM | 2 (1.1%) | 0 (0.0%) |
| 5:00 AM to 5:29 AM | 3 (1.6%) | 0 (0.0%) |
| 5:30 AM to 5:59 AM | 4 (2.1%) | 1 (1.5%) |
| 6:00 AM to 6:29 AM | 2 (1.1%) | 0 (0.0%) |
| 6:30 AM to 6:59 AM | 13 (6.8%) | 6 (9.0%) |
| 7:00 AM to 7:29 AM | 19 (10.0%) | 8 (11.9%) |
| 7:30 AM to 7:59 AM | 103 (53.9%) | 12 (17.9%) |
| 8:00 AM to 8:29 AM | 19 (10.0%) | 4 (6.0%) |
| 8:30 AM to 8:59 AM | 8 (4.2%) | 8 (11.9%) |
| 9:00 AM to 9:59 AM | 9 (4.7%) | 23 (34.3%) |
| 10:00 AM to 10:59 AM | 7 (3.7%) | 0 (0.0%) |
| 11:00 AM to 11:59 AM | 0 (0.0%) | 1 (1.5%) |
| 12:00 PM to 3:59 PM | 0 (0.0%) | 4 (6.0%) |
| 4:00 PM to 11:59 PM | 2 (1.1%) | 0 (0.0%) |
| Total | 191 (100.0%) | 67 (100.0%) |
Housing Occupancy in Arden
Occupancy by Ownership in Arden
Of the total 277 dwellings in Arden, owner-occupied units account for 193 (69.7%), while renter-occupied units make up 84 (30.3%).
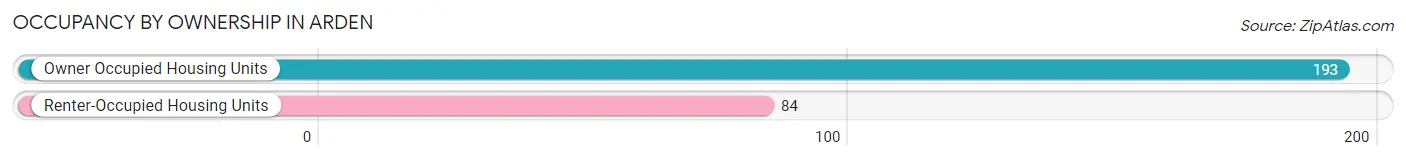
| Occupancy | # Housing Units | % Housing Units |
| Owner Occupied Housing Units | 193 | 69.7% |
| Renter-Occupied Housing Units | 84 | 30.3% |
| Total Occupied Housing Units | 277 | 100.0% |
Occupancy by Household Size in Arden
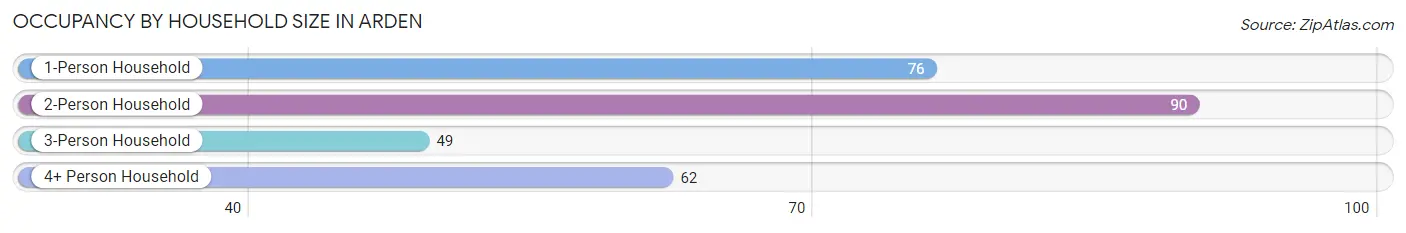
| Household Size | # Housing Units | % Housing Units |
| 1-Person Household | 76 | 27.4% |
| 2-Person Household | 90 | 32.5% |
| 3-Person Household | 49 | 17.7% |
| 4+ Person Household | 62 | 22.4% |
| Total Housing Units | 277 | 100.0% |
Occupancy by Ownership by Household Size in Arden
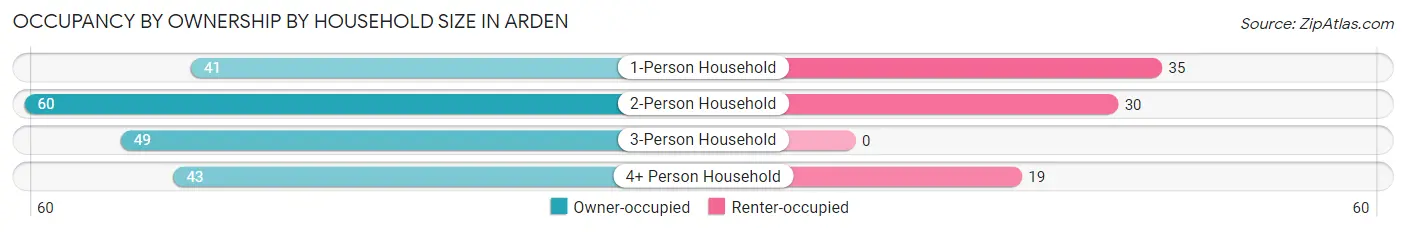
| Household Size | Owner-occupied | Renter-occupied |
| 1-Person Household | 41 (53.9%) | 35 (46.1%) |
| 2-Person Household | 60 (66.7%) | 30 (33.3%) |
| 3-Person Household | 49 (100.0%) | 0 (0.0%) |
| 4+ Person Household | 43 (69.4%) | 19 (30.6%) |
| Total Housing Units | 193 (69.7%) | 84 (30.3%) |
Occupancy by Educational Attainment in Arden
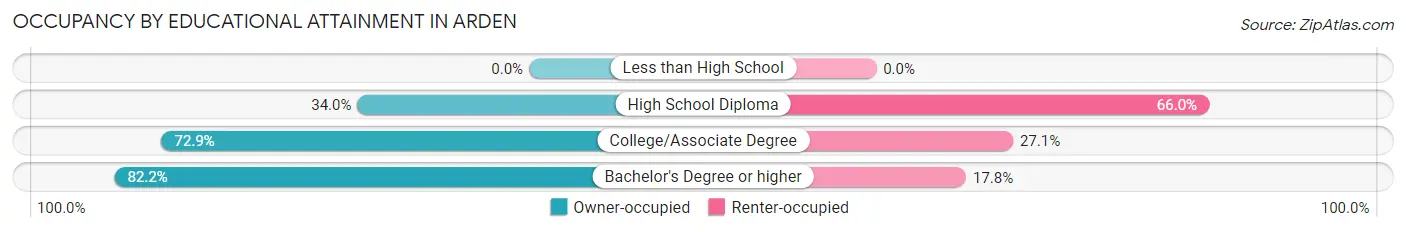
| Household Size | Owner-occupied | Renter-occupied |
| Less than High School | 0 (0.0%) | 0 (0.0%) |
| High School Diploma | 16 (34.0%) | 31 (66.0%) |
| College/Associate Degree | 94 (72.9%) | 35 (27.1%) |
| Bachelor's Degree or higher | 83 (82.2%) | 18 (17.8%) |
Occupancy by Age of Householder in Arden
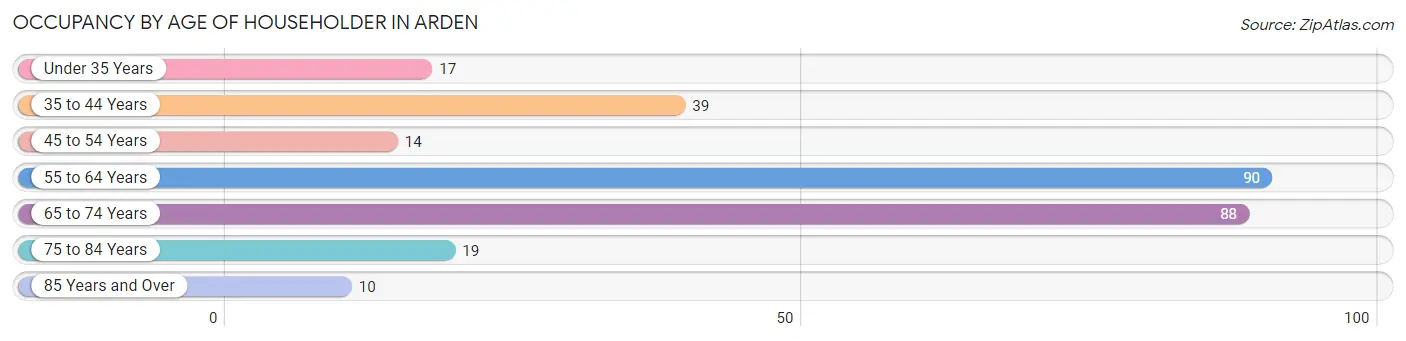
| Age Bracket | # Households | % Households |
| Under 35 Years | 17 | 6.1% |
| 35 to 44 Years | 39 | 14.1% |
| 45 to 54 Years | 14 | 5.1% |
| 55 to 64 Years | 90 | 32.5% |
| 65 to 74 Years | 88 | 31.8% |
| 75 to 84 Years | 19 | 6.9% |
| 85 Years and Over | 10 | 3.6% |
| Total | 277 | 100.0% |
Housing Finances in Arden
Median Income by Occupancy in Arden
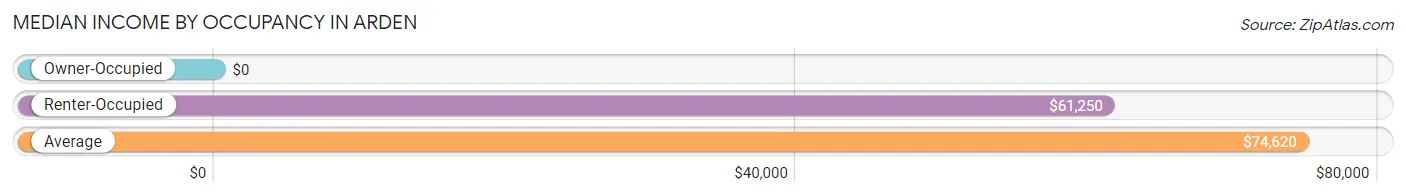
| Occupancy Type | # Households | Median Income |
| Owner-Occupied | 193 (69.7%) | $0 |
| Renter-Occupied | 84 (30.3%) | $61,250 |
| Average | 277 (100.0%) | $74,620 |
Occupancy by Householder Income Bracket in Arden
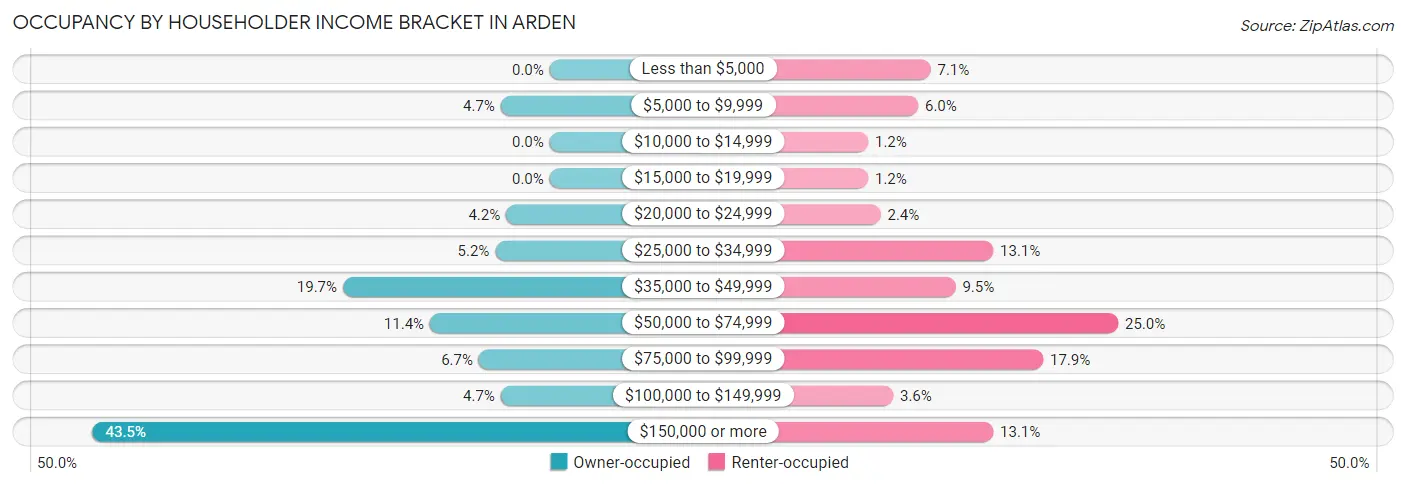
| Income Bracket | Owner-occupied | Renter-occupied |
| Less than $5,000 | 0 (0.0%) | 6 (7.1%) |
| $5,000 to $9,999 | 9 (4.7%) | 5 (5.9%) |
| $10,000 to $14,999 | 0 (0.0%) | 1 (1.2%) |
| $15,000 to $19,999 | 0 (0.0%) | 1 (1.2%) |
| $20,000 to $24,999 | 8 (4.2%) | 2 (2.4%) |
| $25,000 to $34,999 | 10 (5.2%) | 11 (13.1%) |
| $35,000 to $49,999 | 38 (19.7%) | 8 (9.5%) |
| $50,000 to $74,999 | 22 (11.4%) | 21 (25.0%) |
| $75,000 to $99,999 | 13 (6.7%) | 15 (17.9%) |
| $100,000 to $149,999 | 9 (4.7%) | 3 (3.6%) |
| $150,000 or more | 84 (43.5%) | 11 (13.1%) |
| Total | 193 (100.0%) | 84 (100.0%) |
Monthly Housing Cost Tiers in Arden
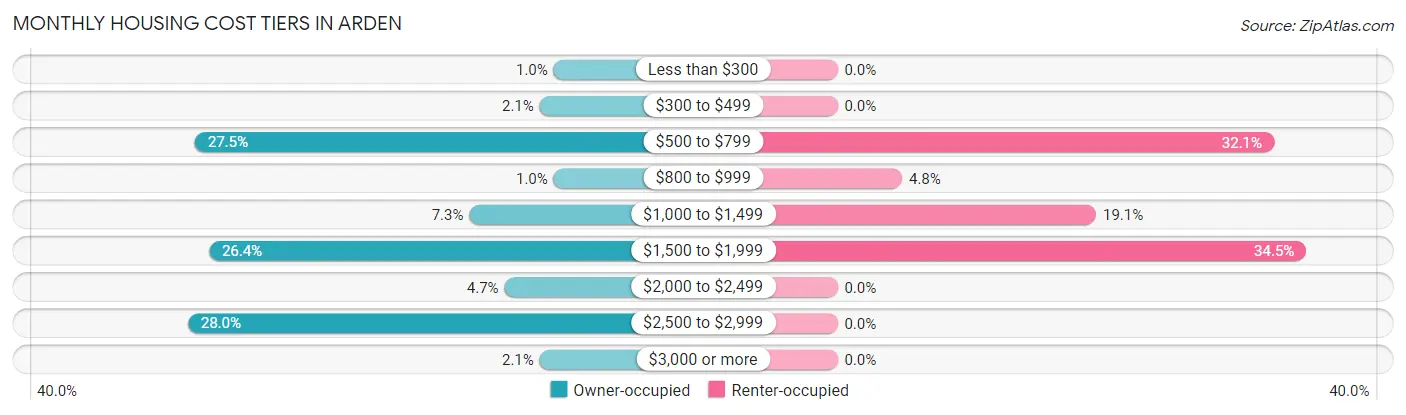
| Monthly Cost | Owner-occupied | Renter-occupied |
| Less than $300 | 2 (1.0%) | 0 (0.0%) |
| $300 to $499 | 4 (2.1%) | 0 (0.0%) |
| $500 to $799 | 53 (27.5%) | 27 (32.1%) |
| $800 to $999 | 2 (1.0%) | 4 (4.8%) |
| $1,000 to $1,499 | 14 (7.2%) | 16 (19.1%) |
| $1,500 to $1,999 | 51 (26.4%) | 29 (34.5%) |
| $2,000 to $2,499 | 9 (4.7%) | 0 (0.0%) |
| $2,500 to $2,999 | 54 (28.0%) | 0 (0.0%) |
| $3,000 or more | 4 (2.1%) | 0 (0.0%) |
| Total | 193 (100.0%) | 84 (100.0%) |
Physical Housing Characteristics in Arden
Housing Structures in Arden
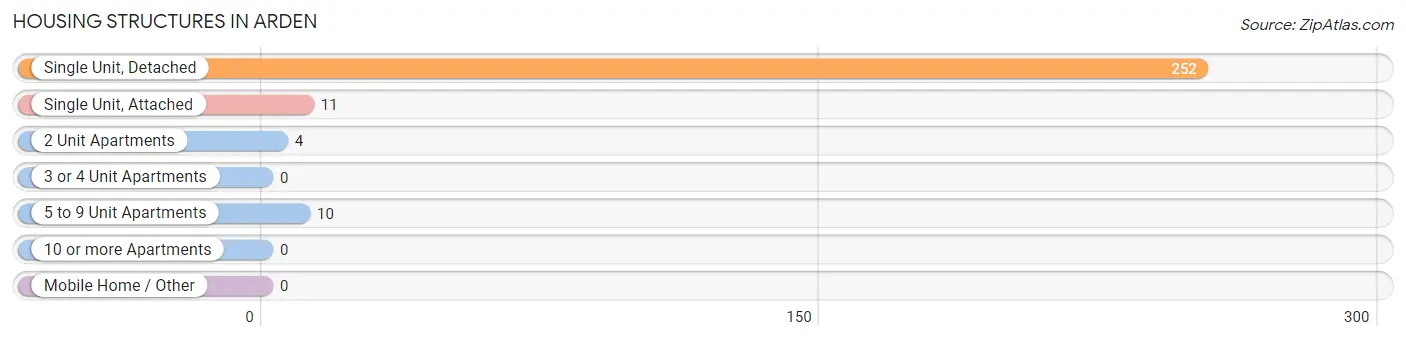
| Structure Type | # Housing Units | % Housing Units |
| Single Unit, Detached | 252 | 91.0% |
| Single Unit, Attached | 11 | 4.0% |
| 2 Unit Apartments | 4 | 1.4% |
| 3 or 4 Unit Apartments | 0 | 0.0% |
| 5 to 9 Unit Apartments | 10 | 3.6% |
| 10 or more Apartments | 0 | 0.0% |
| Mobile Home / Other | 0 | 0.0% |
| Total | 277 | 100.0% |
Housing Structures by Occupancy in Arden
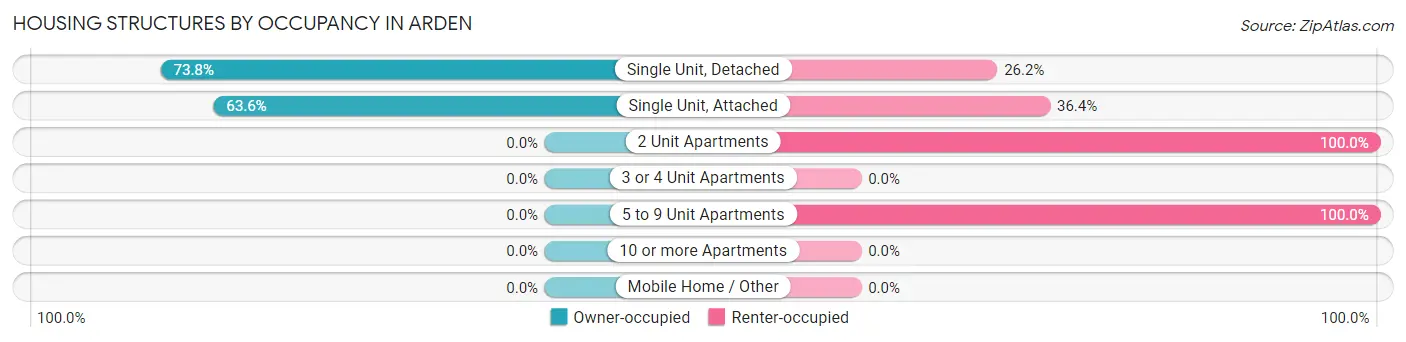
| Structure Type | Owner-occupied | Renter-occupied |
| Single Unit, Detached | 186 (73.8%) | 66 (26.2%) |
| Single Unit, Attached | 7 (63.6%) | 4 (36.4%) |
| 2 Unit Apartments | 0 (0.0%) | 4 (100.0%) |
| 3 or 4 Unit Apartments | 0 (0.0%) | 0 (0.0%) |
| 5 to 9 Unit Apartments | 0 (0.0%) | 10 (100.0%) |
| 10 or more Apartments | 0 (0.0%) | 0 (0.0%) |
| Mobile Home / Other | 0 (0.0%) | 0 (0.0%) |
| Total | 193 (69.7%) | 84 (30.3%) |
Housing Structures by Number of Rooms in Arden
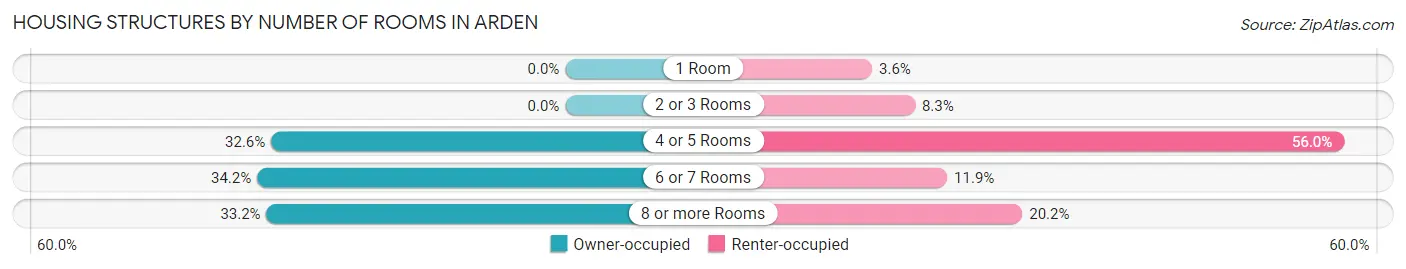
| Number of Rooms | Owner-occupied | Renter-occupied |
| 1 Room | 0 (0.0%) | 3 (3.6%) |
| 2 or 3 Rooms | 0 (0.0%) | 7 (8.3%) |
| 4 or 5 Rooms | 63 (32.6%) | 47 (55.9%) |
| 6 or 7 Rooms | 66 (34.2%) | 10 (11.9%) |
| 8 or more Rooms | 64 (33.2%) | 17 (20.2%) |
| Total | 193 (100.0%) | 84 (100.0%) |
Housing Structure by Heating Type in Arden
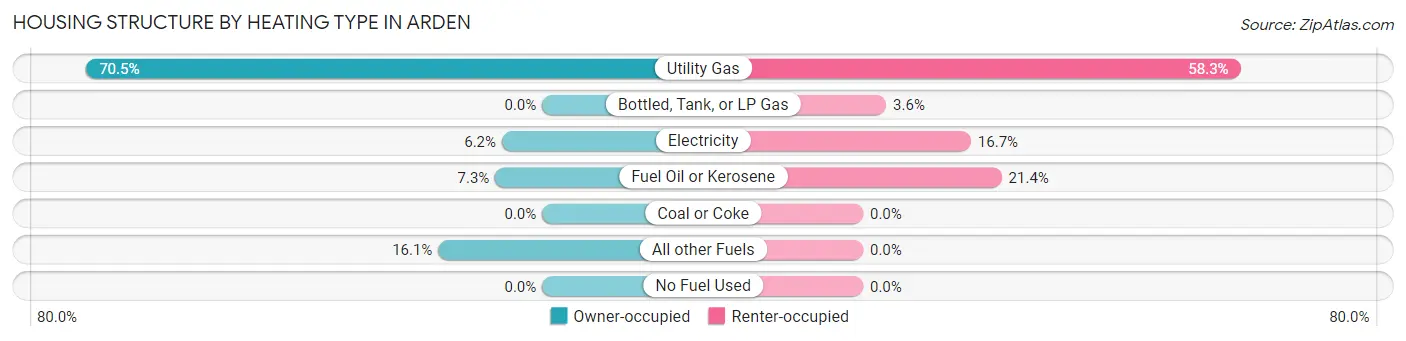
| Heating Type | Owner-occupied | Renter-occupied |
| Utility Gas | 136 (70.5%) | 49 (58.3%) |
| Bottled, Tank, or LP Gas | 0 (0.0%) | 3 (3.6%) |
| Electricity | 12 (6.2%) | 14 (16.7%) |
| Fuel Oil or Kerosene | 14 (7.2%) | 18 (21.4%) |
| Coal or Coke | 0 (0.0%) | 0 (0.0%) |
| All other Fuels | 31 (16.1%) | 0 (0.0%) |
| No Fuel Used | 0 (0.0%) | 0 (0.0%) |
| Total | 193 (100.0%) | 84 (100.0%) |
Household Vehicle Usage in Arden
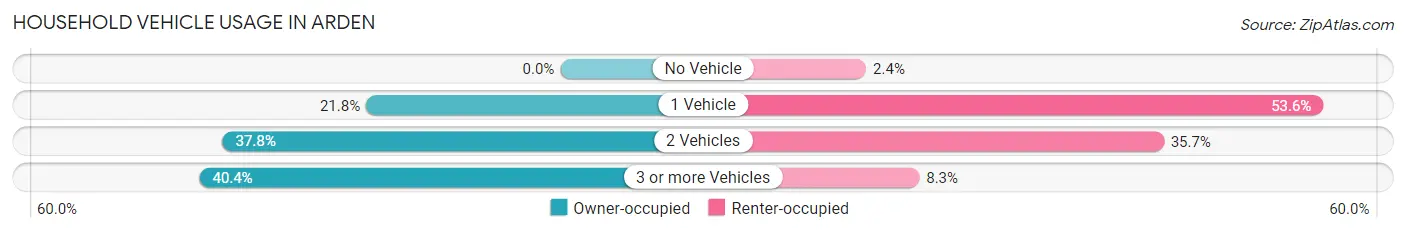
| Vehicles per Household | Owner-occupied | Renter-occupied |
| No Vehicle | 0 (0.0%) | 2 (2.4%) |
| 1 Vehicle | 42 (21.8%) | 45 (53.6%) |
| 2 Vehicles | 73 (37.8%) | 30 (35.7%) |
| 3 or more Vehicles | 78 (40.4%) | 7 (8.3%) |
| Total | 193 (100.0%) | 84 (100.0%) |
Real Estate & Mortgages in Arden
Real Estate and Mortgage Overview in Arden
| Characteristic | Without Mortgage | With Mortgage |
| Housing Units | 67 | 126 |
| Median Property Value | $458,900 | $488,600 |
| Median Household Income | $77,031 | $61 |
| Monthly Housing Costs | $630 | $4 |
| Real Estate Taxes | $3,450 | $2 |
Property Value by Mortgage Status in Arden
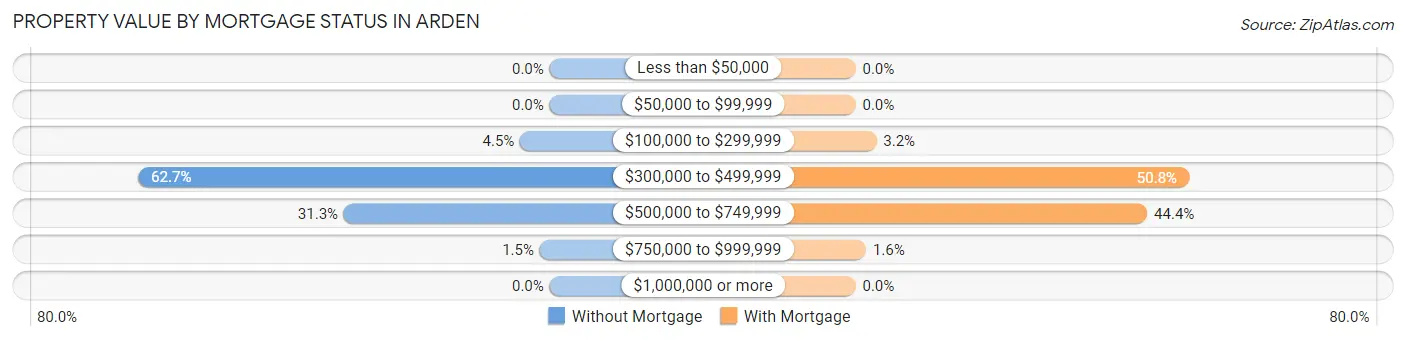
| Property Value | Without Mortgage | With Mortgage |
| Less than $50,000 | 0 (0.0%) | 0 (0.0%) |
| $50,000 to $99,999 | 0 (0.0%) | 0 (0.0%) |
| $100,000 to $299,999 | 3 (4.5%) | 4 (3.2%) |
| $300,000 to $499,999 | 42 (62.7%) | 64 (50.8%) |
| $500,000 to $749,999 | 21 (31.3%) | 56 (44.4%) |
| $750,000 to $999,999 | 1 (1.5%) | 2 (1.6%) |
| $1,000,000 or more | 0 (0.0%) | 0 (0.0%) |
| Total | 67 (100.0%) | 126 (100.0%) |
Household Income by Mortgage Status in Arden
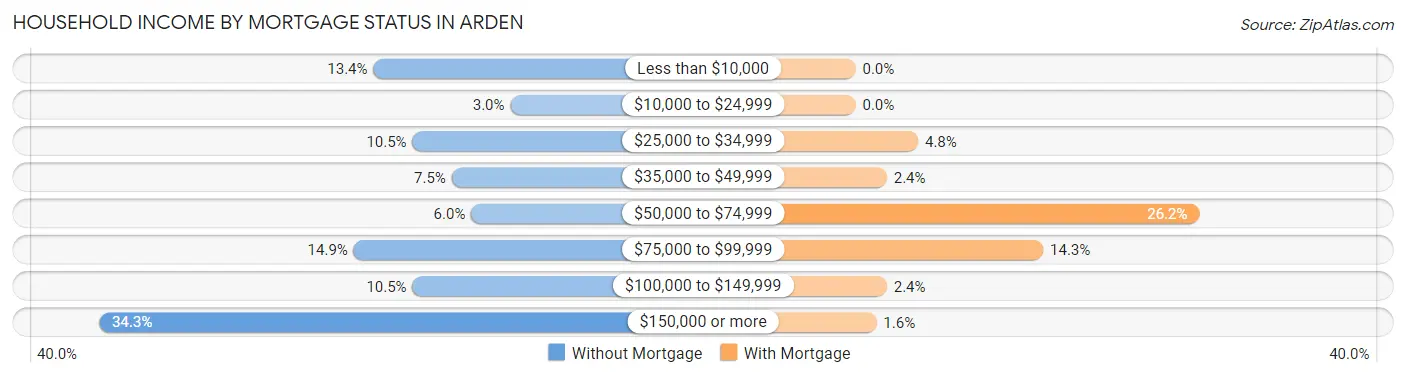
| Household Income | Without Mortgage | With Mortgage |
| Less than $10,000 | 9 (13.4%) | 0 (0.0%) |
| $10,000 to $24,999 | 2 (3.0%) | 0 (0.0%) |
| $25,000 to $34,999 | 7 (10.4%) | 6 (4.8%) |
| $35,000 to $49,999 | 5 (7.5%) | 3 (2.4%) |
| $50,000 to $74,999 | 4 (6.0%) | 33 (26.2%) |
| $75,000 to $99,999 | 10 (14.9%) | 18 (14.3%) |
| $100,000 to $149,999 | 7 (10.4%) | 3 (2.4%) |
| $150,000 or more | 23 (34.3%) | 2 (1.6%) |
| Total | 67 (100.0%) | 126 (100.0%) |
Property Value to Household Income Ratio in Arden
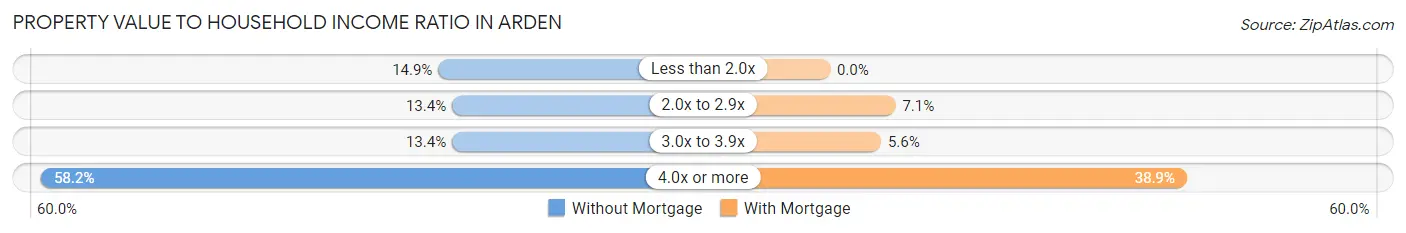
| Value-to-Income Ratio | Without Mortgage | With Mortgage |
| Less than 2.0x | 10 (14.9%) | 0 (0.0%) |
| 2.0x to 2.9x | 9 (13.4%) | 9 (7.1%) |
| 3.0x to 3.9x | 9 (13.4%) | 7 (5.6%) |
| 4.0x or more | 39 (58.2%) | 49 (38.9%) |
| Total | 67 (100.0%) | 126 (100.0%) |
Real Estate Taxes by Mortgage Status in Arden
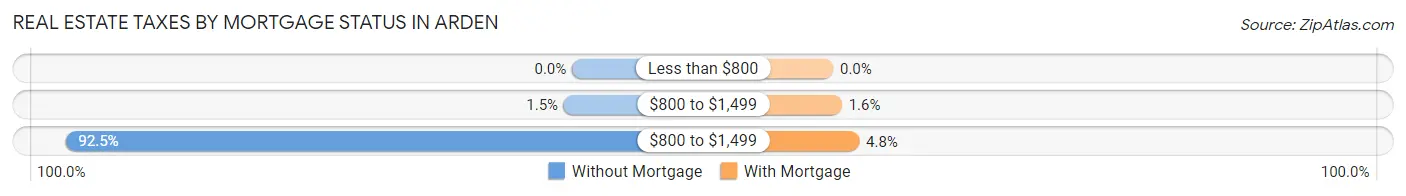
| Property Taxes | Without Mortgage | With Mortgage |
| Less than $800 | 0 (0.0%) | 0 (0.0%) |
| $800 to $1,499 | 1 (1.5%) | 2 (1.6%) |
| $800 to $1,499 | 62 (92.5%) | 6 (4.8%) |
| Total | 67 (100.0%) | 126 (100.0%) |
Health & Disability in Arden
Health Insurance Coverage by Age in Arden
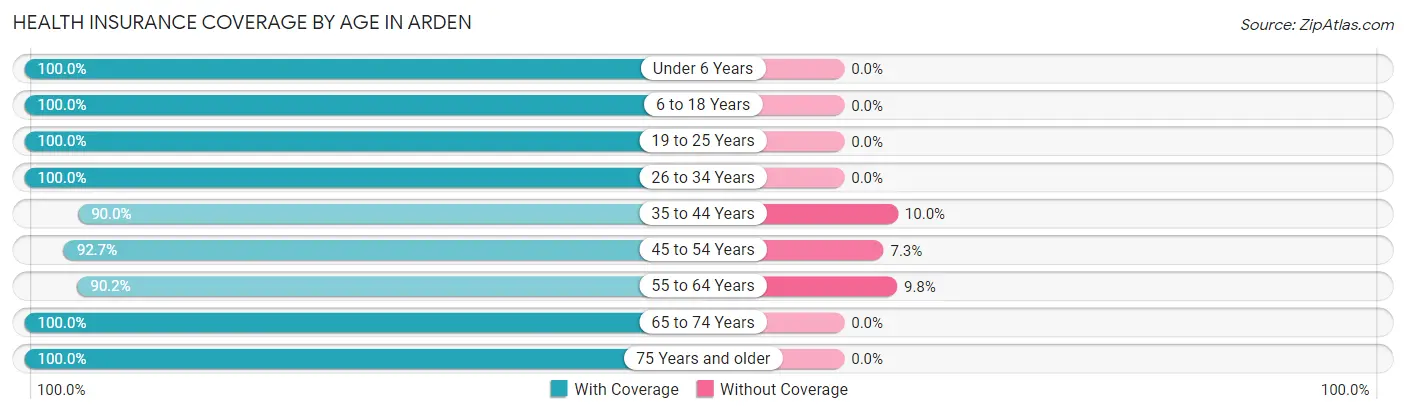
| Age Bracket | With Coverage | Without Coverage |
| Under 6 Years | 11 (100.0%) | 0 (0.0%) |
| 6 to 18 Years | 57 (100.0%) | 0 (0.0%) |
| 19 to 25 Years | 46 (100.0%) | 0 (0.0%) |
| 26 to 34 Years | 92 (100.0%) | 0 (0.0%) |
| 35 to 44 Years | 63 (90.0%) | 7 (10.0%) |
| 45 to 54 Years | 38 (92.7%) | 3 (7.3%) |
| 55 to 64 Years | 110 (90.2%) | 12 (9.8%) |
| 65 to 74 Years | 179 (100.0%) | 0 (0.0%) |
| 75 Years and older | 34 (100.0%) | 0 (0.0%) |
| Total | 630 (96.6%) | 22 (3.4%) |
Health Insurance Coverage by Citizenship Status in Arden
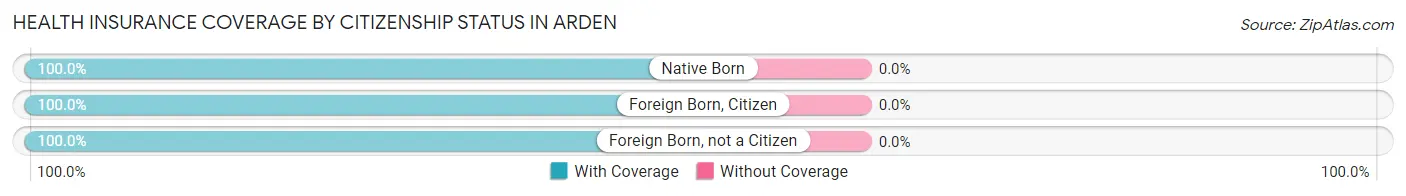
| Citizenship Status | With Coverage | Without Coverage |
| Native Born | 11 (100.0%) | 0 (0.0%) |
| Foreign Born, Citizen | 57 (100.0%) | 0 (0.0%) |
| Foreign Born, not a Citizen | 46 (100.0%) | 0 (0.0%) |
Health Insurance Coverage by Household Income in Arden
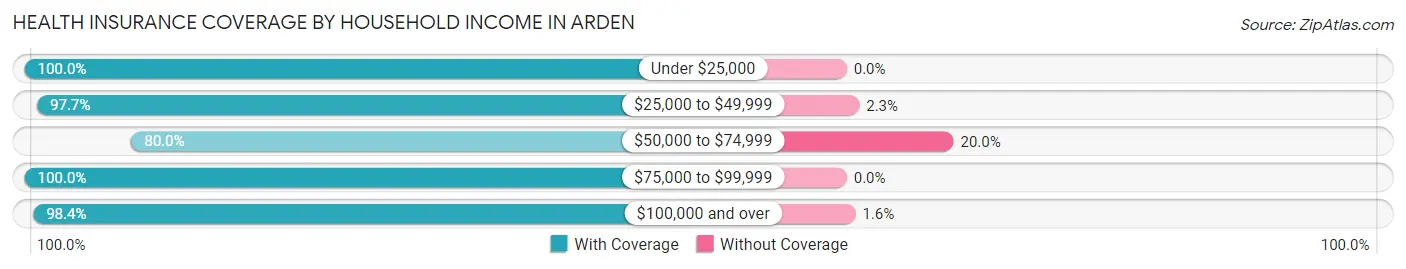
| Household Income | With Coverage | Without Coverage |
| Under $25,000 | 51 (100.0%) | 0 (0.0%) |
| $25,000 to $49,999 | 125 (97.7%) | 3 (2.3%) |
| $50,000 to $74,999 | 56 (80.0%) | 14 (20.0%) |
| $75,000 to $99,999 | 95 (100.0%) | 0 (0.0%) |
| $100,000 and over | 303 (98.4%) | 5 (1.6%) |
Public vs Private Health Insurance Coverage by Age in Arden
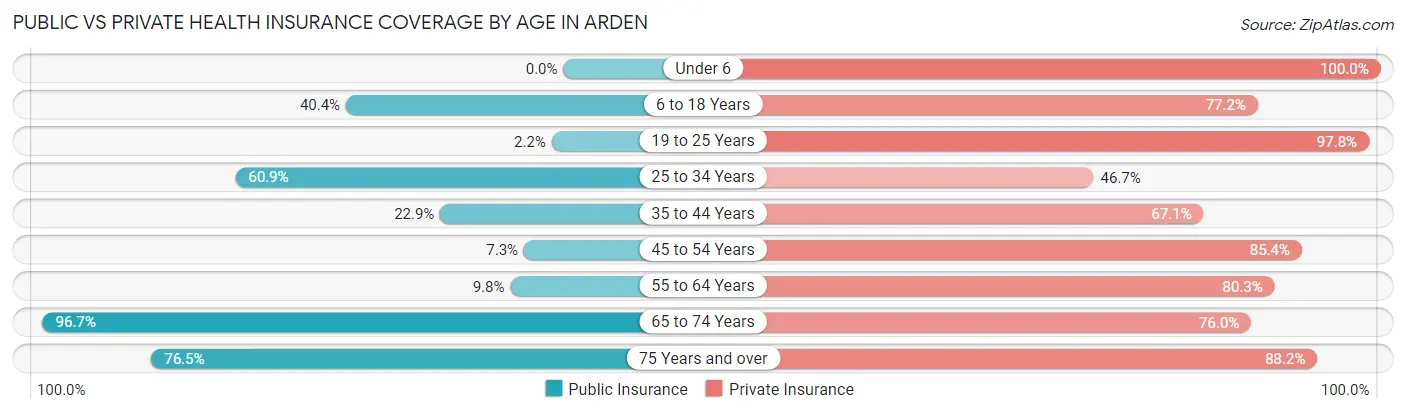
| Age Bracket | Public Insurance | Private Insurance |
| Under 6 | 0 (0.0%) | 11 (100.0%) |
| 6 to 18 Years | 23 (40.4%) | 44 (77.2%) |
| 19 to 25 Years | 1 (2.2%) | 45 (97.8%) |
| 25 to 34 Years | 56 (60.9%) | 43 (46.7%) |
| 35 to 44 Years | 16 (22.9%) | 47 (67.1%) |
| 45 to 54 Years | 3 (7.3%) | 35 (85.4%) |
| 55 to 64 Years | 12 (9.8%) | 98 (80.3%) |
| 65 to 74 Years | 173 (96.7%) | 136 (76.0%) |
| 75 Years and over | 26 (76.5%) | 30 (88.2%) |
| Total | 310 (47.5%) | 489 (75.0%) |
Disability Status by Sex by Age in Arden
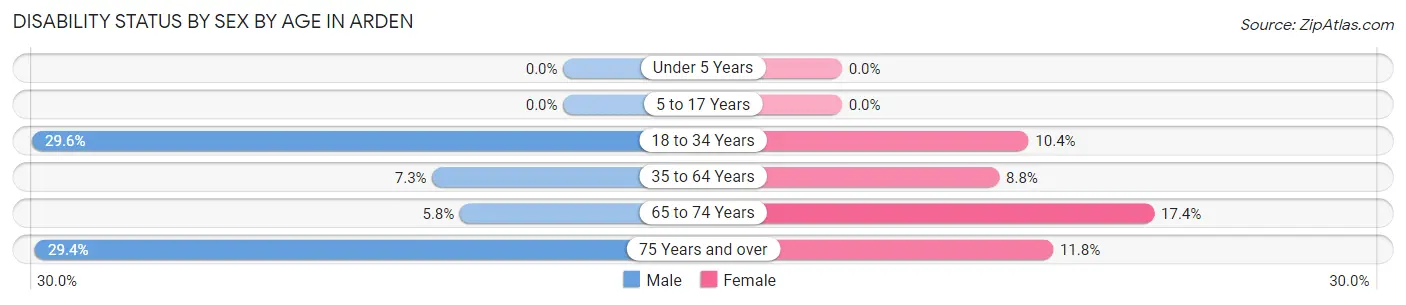
| Age Bracket | Male | Female |
| Under 5 Years | 0 (0.0%) | 0 (0.0%) |
| 5 to 17 Years | 0 (0.0%) | 0 (0.0%) |
| 18 to 34 Years | 21 (29.6%) | 8 (10.4%) |
| 35 to 64 Years | 7 (7.3%) | 12 (8.8%) |
| 65 to 74 Years | 5 (5.8%) | 16 (17.4%) |
| 75 Years and over | 5 (29.4%) | 2 (11.8%) |
Disability Class by Sex by Age in Arden
Disability Class: Hearing Difficulty
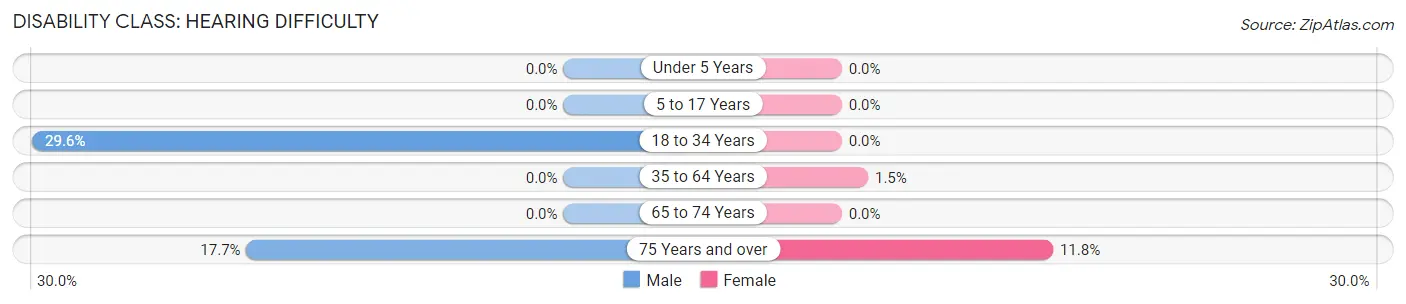
| Age Bracket | Male | Female |
| Under 5 Years | 0 (0.0%) | 0 (0.0%) |
| 5 to 17 Years | 0 (0.0%) | 0 (0.0%) |
| 18 to 34 Years | 21 (29.6%) | 0 (0.0%) |
| 35 to 64 Years | 0 (0.0%) | 2 (1.5%) |
| 65 to 74 Years | 0 (0.0%) | 0 (0.0%) |
| 75 Years and over | 3 (17.6%) | 2 (11.8%) |
Disability Class: Vision Difficulty
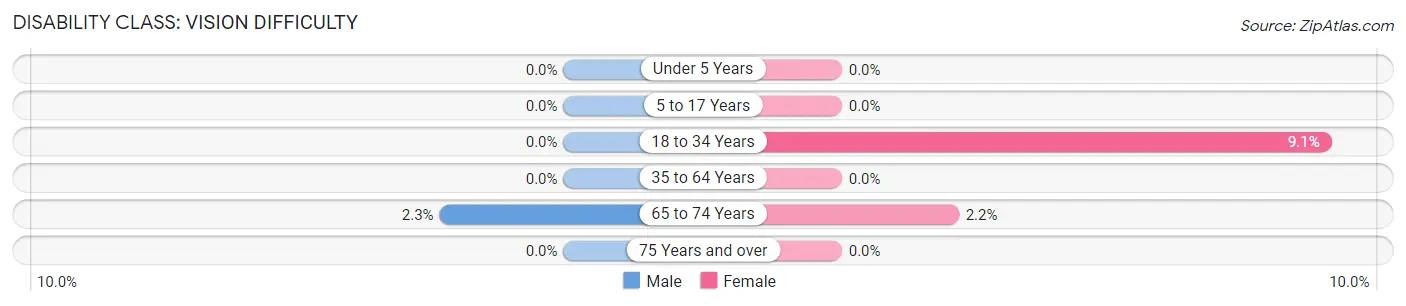
| Age Bracket | Male | Female |
| Under 5 Years | 0 (0.0%) | 0 (0.0%) |
| 5 to 17 Years | 0 (0.0%) | 0 (0.0%) |
| 18 to 34 Years | 0 (0.0%) | 7 (9.1%) |
| 35 to 64 Years | 0 (0.0%) | 0 (0.0%) |
| 65 to 74 Years | 2 (2.3%) | 2 (2.2%) |
| 75 Years and over | 0 (0.0%) | 0 (0.0%) |
Disability Class: Cognitive Difficulty
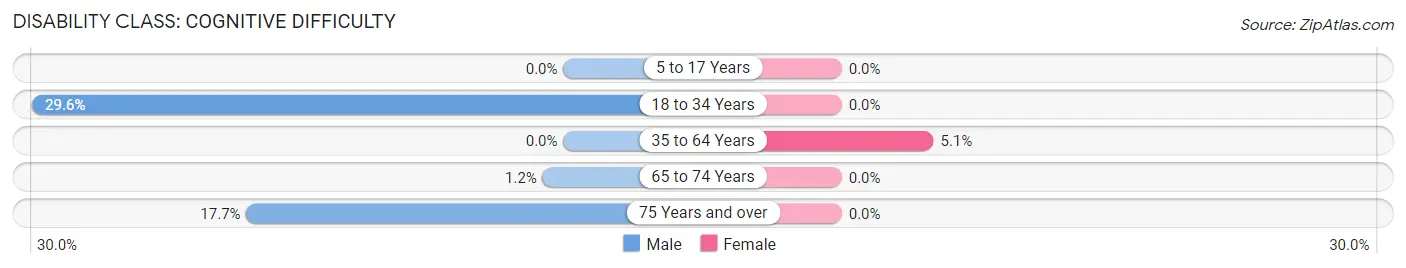
| Age Bracket | Male | Female |
| 5 to 17 Years | 0 (0.0%) | 0 (0.0%) |
| 18 to 34 Years | 21 (29.6%) | 0 (0.0%) |
| 35 to 64 Years | 0 (0.0%) | 7 (5.1%) |
| 65 to 74 Years | 1 (1.1%) | 0 (0.0%) |
| 75 Years and over | 3 (17.6%) | 0 (0.0%) |
Disability Class: Ambulatory Difficulty
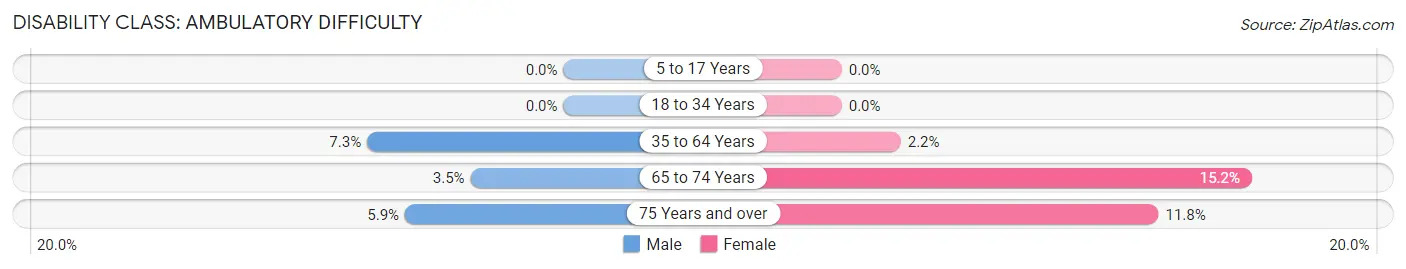
| Age Bracket | Male | Female |
| 5 to 17 Years | 0 (0.0%) | 0 (0.0%) |
| 18 to 34 Years | 0 (0.0%) | 0 (0.0%) |
| 35 to 64 Years | 7 (7.3%) | 3 (2.2%) |
| 65 to 74 Years | 3 (3.5%) | 14 (15.2%) |
| 75 Years and over | 1 (5.9%) | 2 (11.8%) |
Disability Class: Self-Care Difficulty
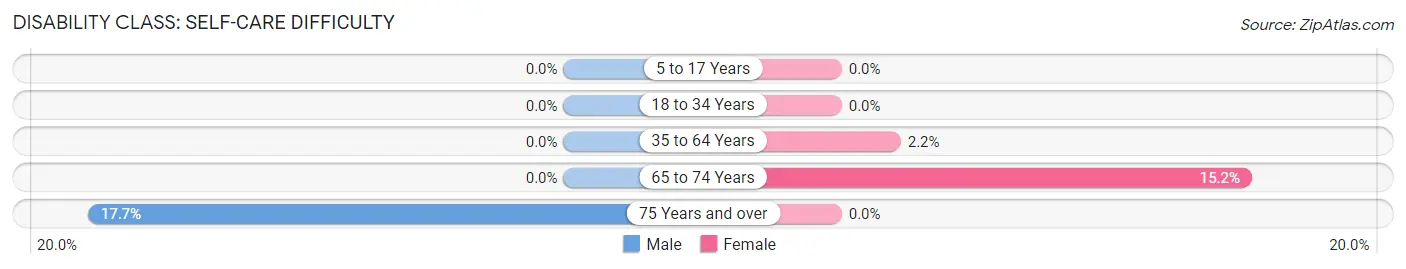
| Age Bracket | Male | Female |
| 5 to 17 Years | 0 (0.0%) | 0 (0.0%) |
| 18 to 34 Years | 0 (0.0%) | 0 (0.0%) |
| 35 to 64 Years | 0 (0.0%) | 3 (2.2%) |
| 65 to 74 Years | 0 (0.0%) | 14 (15.2%) |
| 75 Years and over | 3 (17.6%) | 0 (0.0%) |
Technology Access in Arden
Computing Device Access in Arden
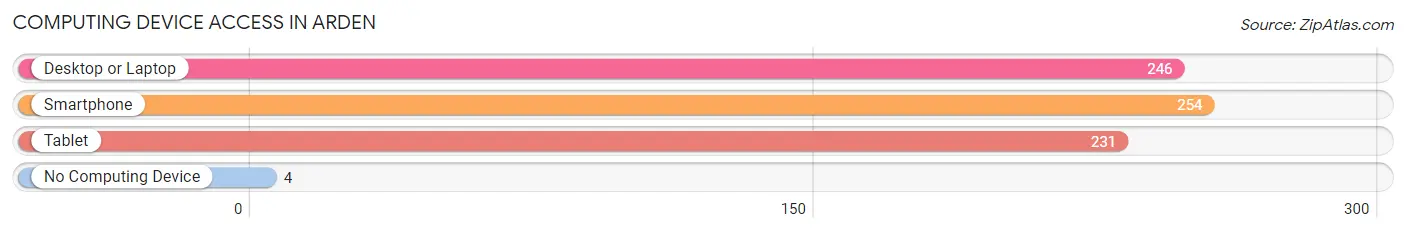
| Device Type | # Households | % Households |
| Desktop or Laptop | 246 | 88.8% |
| Smartphone | 254 | 91.7% |
| Tablet | 231 | 83.4% |
| No Computing Device | 4 | 1.4% |
| Total | 277 | 100.0% |
Internet Access in Arden
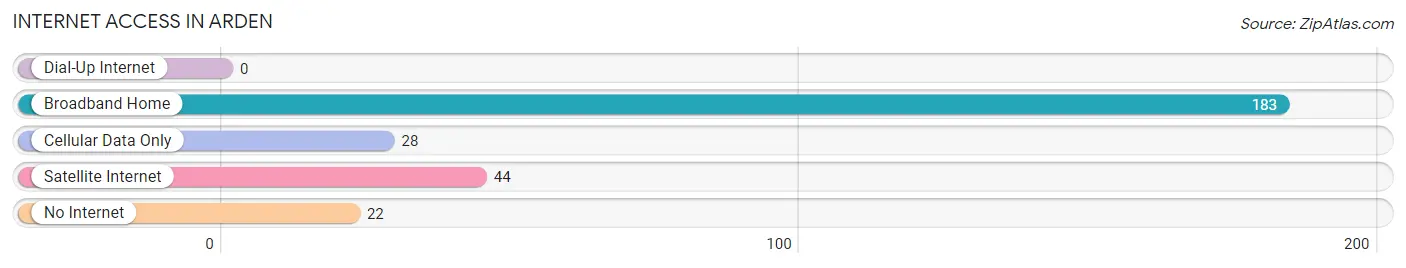
| Internet Type | # Households | % Households |
| Dial-Up Internet | 0 | 0.0% |
| Broadband Home | 183 | 66.1% |
| Cellular Data Only | 28 | 10.1% |
| Satellite Internet | 44 | 15.9% |
| No Internet | 22 | 7.9% |
| Total | 277 | 100.0% |
Arden Summary
Arden, Delaware is a small unincorporated community located in New Castle County, Delaware. It is situated just north of Wilmington, Delaware and is part of the Wilmington Metropolitan Statistical Area. The community is known for its unique history, geography, economy, and demographics.
History
Arden was founded in 1900 by a group of Quakers who were looking for a place to practice their faith. The Quakers purchased a large tract of land from the DuPont family and established the Arden community. The community was named after the English village of Arden, which was the birthplace of William Penn, the founder of Pennsylvania.
The Quakers established a number of businesses in the area, including a sawmill, a gristmill, a general store, and a post office. The community also had a school, a library, and a meeting house. The Quakers also established a number of farms in the area, which provided food for the community.
The Quakers were also instrumental in establishing the Arden Fair, which is held every year in August. The fair is a celebration of the community’s history and culture, and features a variety of activities, including music, food, and crafts.
Geography
Arden is located in northern New Castle County, Delaware. It is situated just north of Wilmington, Delaware and is part of the Wilmington Metropolitan Statistical Area. The community is located in a rural area, and is surrounded by forests and farmland.
The community is located on the banks of the Red Clay Creek, which is a tributary of the Christina River. The creek is a popular spot for fishing and canoeing. The area is also home to a number of parks and nature preserves, including the Arden Woods Nature Preserve and the Arden Wildlife Refuge.
Economy
The economy of Arden is largely based on agriculture and tourism. The community is home to a number of farms, which produce a variety of crops, including corn, soybeans, and wheat. The area is also home to a number of wineries and breweries, which produce a variety of wines and beers.
The community is also home to a number of small businesses, including restaurants, shops, and art galleries. The community is also home to a number of bed and breakfasts, which attract tourists from all over the world.
Demographics
As of the 2010 census, the population of Arden was 1,845. The population is largely white (94.3%), with a small percentage of African Americans (2.2%) and Hispanics (2.2%). The median household income in the community is $60,000, and the median home value is $250,000.
The community is served by the Red Clay Consolidated School District, which includes two elementary schools, one middle school, and one high school. The community is also home to a number of churches, including the Arden Friends Meeting House, which is the oldest Quaker meeting house in the United States.
Conclusion
Arden, Delaware is a small unincorporated community located in New Castle County, Delaware. It is situated just north of Wilmington, Delaware and is part of the Wilmington Metropolitan Statistical Area. The community is known for its unique history, geography, economy, and demographics. The economy of Arden is largely based on agriculture and tourism, and the population is largely white. The community is served by the Red Clay Consolidated School District, and is home to a number of churches, including the Arden Friends Meeting House.
Common Questions
What is Per Capita Income in Arden?
Per Capita income in Arden is $49,135.
What is the Median Household income in Arden?
Median Household Income in Arden is $74,620.
What is Inequality or Gini Index in Arden?
Inequality or Gini Index in Arden is 0.45.
What is the Total Population of Arden?
Total Population of Arden is 652.
What is the Total Male Population of Arden?
Total Male Population of Arden is 301.
What is the Total Female Population of Arden?
Total Female Population of Arden is 351.
What is the Ratio of Males per 100 Females in Arden?
There are 85.75 Males per 100 Females in Arden.
What is the Ratio of Females per 100 Males in Arden?
There are 116.61 Females per 100 Males in Arden.
What is the Median Population Age in Arden?
Median Population Age in Arden is 58.0 Years.
What is the Average Family Size in Arden
Average Family Size in Arden is 2.9 People.
What is the Average Household Size in Arden
Average Household Size in Arden is 2.4 People.
How Large is the Labor Force in Arden?
There are 313 People in the Labor Forcein in Arden.
What is the Percentage of People in the Labor Force in Arden?
52.7% of People are in the Labor Force in Arden.
What is the Unemployment Rate in Arden?
Unemployment Rate in Arden is 4.5%.