Croom, MD Map & Demographics
Croom Map
Croom Overview
$59,876
PER CAPITA INCOME
$164,875
AVG FAMILY INCOME
$146,387
AVG HOUSEHOLD INCOME
7.1%
WAGE / INCOME GAP [ % ]
92.9¢/ $1
WAGE / INCOME GAP [ $ ]
0.35
INEQUALITY / GINI INDEX
2,842
TOTAL POPULATION
1,598
MALE POPULATION
1,244
FEMALE POPULATION
128.46
MALES / 100 FEMALES
77.85
FEMALES / 100 MALES
48.1
MEDIAN AGE
3.1
AVG FAMILY SIZE
2.7
AVG HOUSEHOLD SIZE
1,627
LABOR FORCE [ PEOPLE ]
66.1%
PERCENT IN LABOR FORCE
7.8%
UNEMPLOYMENT RATE
Income in Croom
Income Overview in Croom
Per Capita Income in Croom is $59,876, while median incomes of families and households are $164,875 and $146,387 respectively.
| Characteristic | Number | Measure |
| Per Capita Income | 2,842 | $59,876 |
| Median Family Income | 823 | $164,875 |
| Mean Family Income | 823 | $179,897 |
| Median Household Income | 1,035 | $146,387 |
| Mean Household Income | 1,035 | $162,071 |
| Income Deficit | 823 | $0 |
| Wage / Income Gap (%) | 2,842 | 7.13% |
| Wage / Income Gap ($) | 2,842 | 92.87¢ per $1 |
| Gini / Inequality Index | 2,842 | 0.35 |
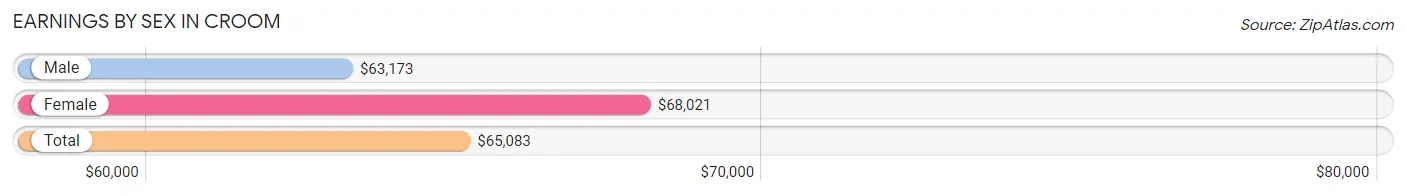
Earnings by Sex in Croom
Average Earnings in Croom are $65,083, $63,173 for men and $68,021 for women, a difference of 7.1%.
| Sex | Number | Average Earnings |
| Male | 943 (56.8%) | $63,173 |
| Female | 716 (43.2%) | $68,021 |
| Total | 1,659 (100.0%) | $65,083 |
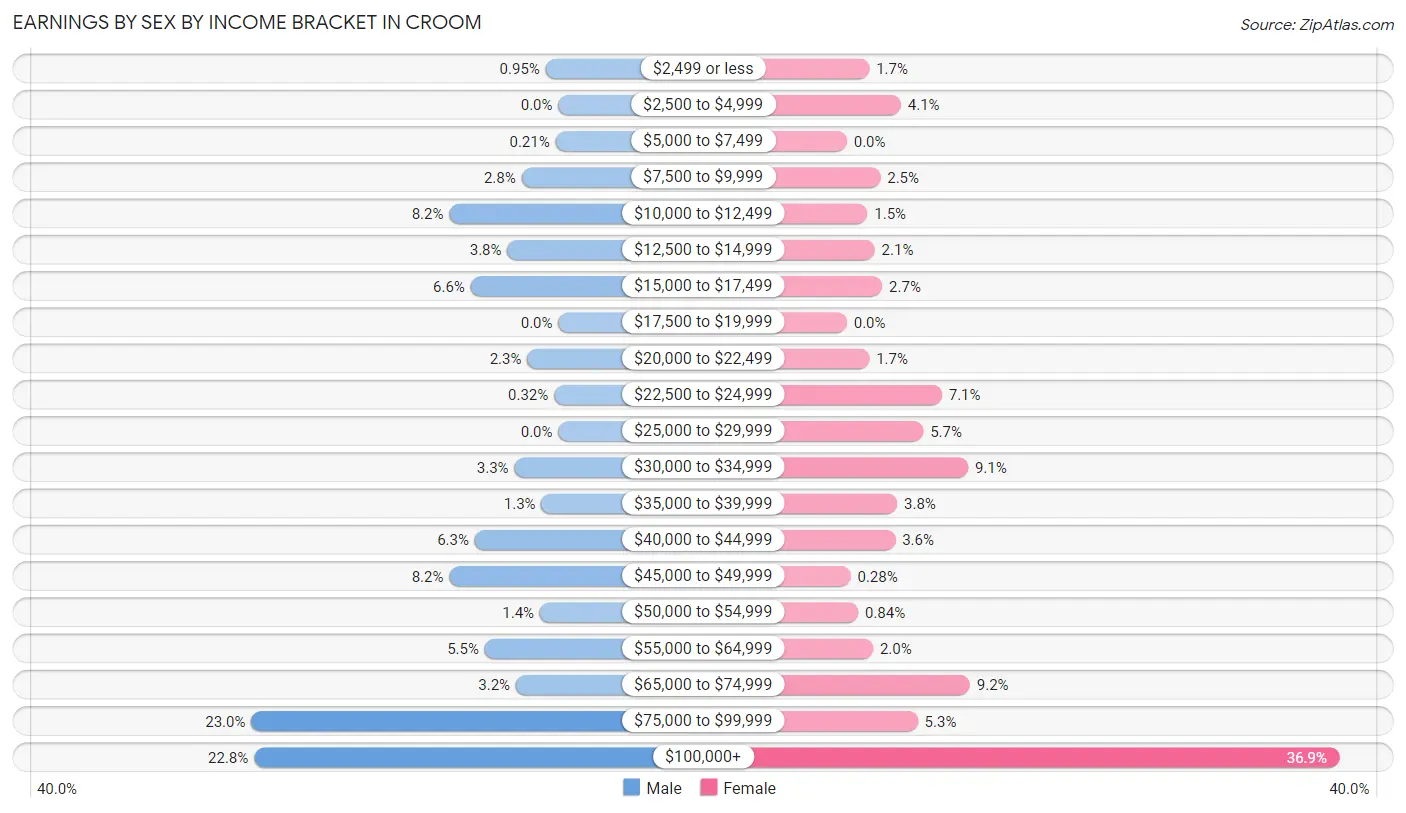
Earnings by Sex by Income Bracket in Croom
The most common earnings brackets in Croom are $75,000 to $99,999 for men (217 | 23.0%) and $100,000+ for women (264 | 36.9%).
| Income | Male | Female |
| $2,499 or less | 9 (0.9%) | 12 (1.7%) |
| $2,500 to $4,999 | 0 (0.0%) | 29 (4.1%) |
| $5,000 to $7,499 | 2 (0.2%) | 0 (0.0%) |
| $7,500 to $9,999 | 26 (2.8%) | 18 (2.5%) |
| $10,000 to $12,499 | 77 (8.2%) | 11 (1.5%) |
| $12,500 to $14,999 | 36 (3.8%) | 15 (2.1%) |
| $15,000 to $17,499 | 62 (6.6%) | 19 (2.6%) |
| $17,500 to $19,999 | 0 (0.0%) | 0 (0.0%) |
| $20,000 to $22,499 | 22 (2.3%) | 12 (1.7%) |
| $22,500 to $24,999 | 3 (0.3%) | 51 (7.1%) |
| $25,000 to $29,999 | 0 (0.0%) | 41 (5.7%) |
| $30,000 to $34,999 | 31 (3.3%) | 65 (9.1%) |
| $35,000 to $39,999 | 12 (1.3%) | 27 (3.8%) |
| $40,000 to $44,999 | 59 (6.3%) | 26 (3.6%) |
| $45,000 to $49,999 | 77 (8.2%) | 2 (0.3%) |
| $50,000 to $54,999 | 13 (1.4%) | 6 (0.8%) |
| $55,000 to $64,999 | 52 (5.5%) | 14 (2.0%) |
| $65,000 to $74,999 | 30 (3.2%) | 66 (9.2%) |
| $75,000 to $99,999 | 217 (23.0%) | 38 (5.3%) |
| $100,000+ | 215 (22.8%) | 264 (36.9%) |
| Total | 943 (100.0%) | 716 (100.0%) |
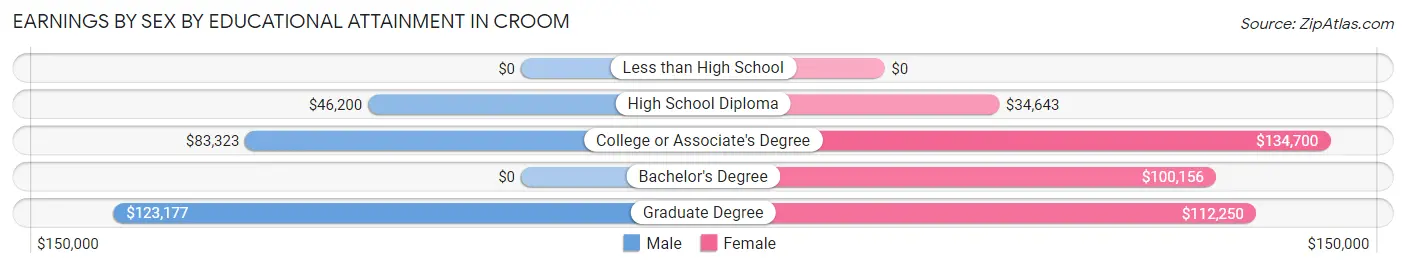
Earnings by Sex by Educational Attainment in Croom
Average earnings in Croom are $80,583 for men and $69,714 for women, a difference of 13.5%. Men with an educational attainment of graduate degree enjoy the highest average annual earnings of $123,177, while those with high school diploma education earn the least with $46,200. Women with an educational attainment of college or associate's degree earn the most with the average annual earnings of $134,700, while those with high school diploma education have the smallest earnings of $34,643.
| Educational Attainment | Male Income | Female Income |
| Less than High School | - | - |
| High School Diploma | $46,200 | $34,643 |
| College or Associate's Degree | $83,323 | $134,700 |
| Bachelor's Degree | - | - |
| Graduate Degree | $123,177 | $112,250 |
| Total | $80,583 | $69,714 |
Family Income in Croom
Family Income Brackets in Croom
According to the Croom family income data, there are 289 families falling into the $200,000+ income range, which is the most common income bracket and makes up 35.1% of all families.
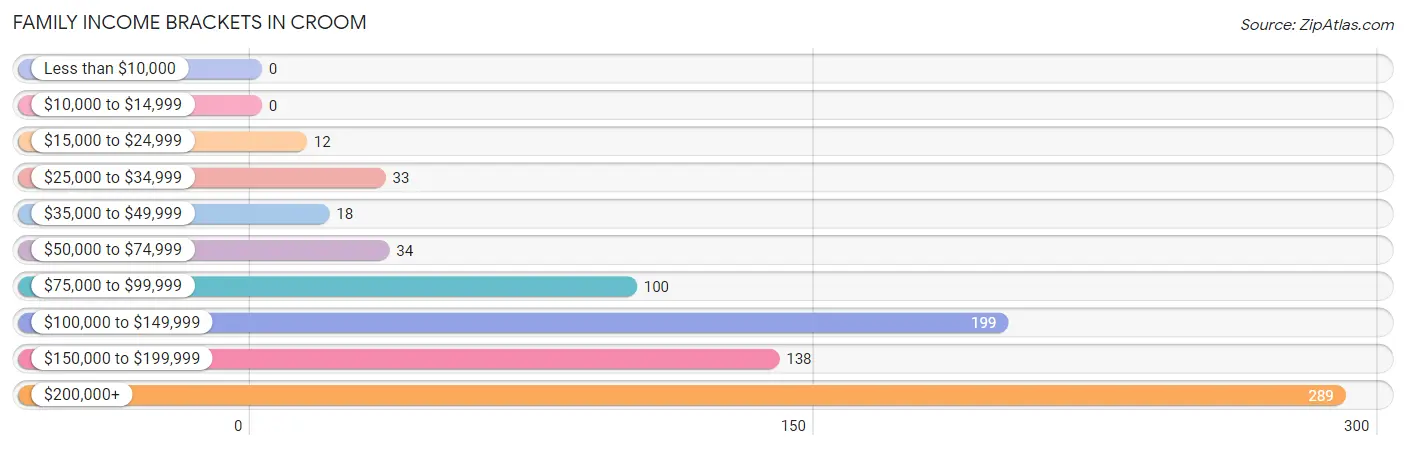
| Income Bracket | # Families | % Families |
| Less than $10,000 | 0 | 0.0% |
| $10,000 to $14,999 | 0 | 0.0% |
| $15,000 to $24,999 | 12 | 1.5% |
| $25,000 to $34,999 | 33 | 4.0% |
| $35,000 to $49,999 | 18 | 2.2% |
| $50,000 to $74,999 | 34 | 4.1% |
| $75,000 to $99,999 | 100 | 12.2% |
| $100,000 to $149,999 | 199 | 24.2% |
| $150,000 to $199,999 | 138 | 16.8% |
| $200,000+ | 289 | 35.1% |
Family Income by Famaliy Size in Croom
4-person families (137 | 16.7%) account for the highest median family income in Croom with $250,001 per family, while 2-person families (356 | 43.3%) have the highest median income of $73,007 per family member.
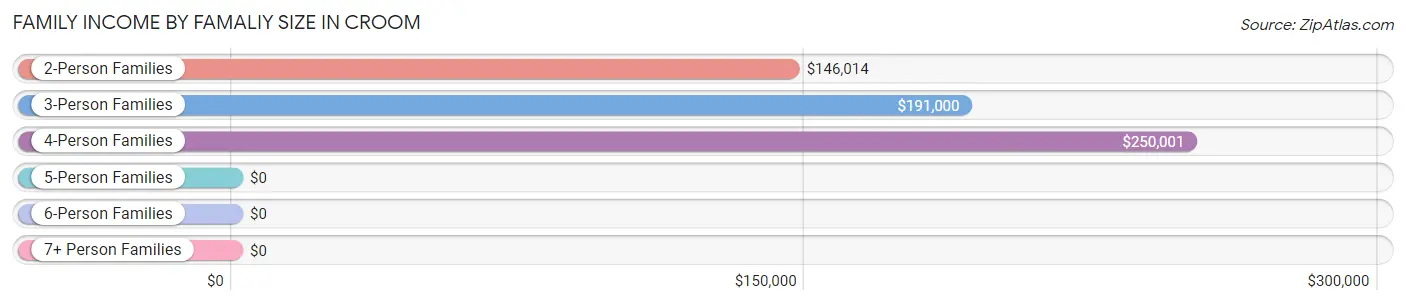
| Income Bracket | # Families | Median Income |
| 2-Person Families | 356 (43.3%) | $146,014 |
| 3-Person Families | 242 (29.4%) | $191,000 |
| 4-Person Families | 137 (16.7%) | $250,001 |
| 5-Person Families | 88 (10.7%) | $0 |
| 6-Person Families | 0 (0.0%) | $0 |
| 7+ Person Families | 0 (0.0%) | $0 |
| Total | 823 (100.0%) | $164,875 |
Family Income by Number of Earners in Croom
The median family income in Croom is $164,875, with families comprising 3+ earners (179) having the highest median family income of $213,125, while families with 1 earner (232) have the lowest median family income of $92,750, accounting for 21.7% and 28.2% of families, respectively.
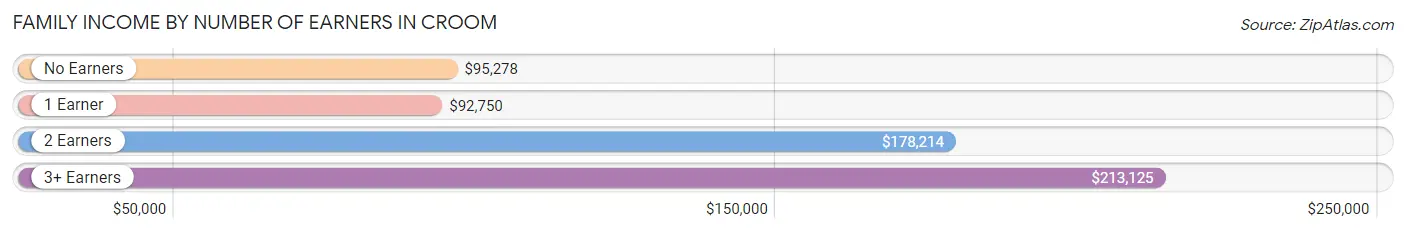
| Number of Earners | # Families | Median Income |
| No Earners | 98 (11.9%) | $95,278 |
| 1 Earner | 232 (28.2%) | $92,750 |
| 2 Earners | 314 (38.2%) | $178,214 |
| 3+ Earners | 179 (21.7%) | $213,125 |
| Total | 823 (100.0%) | $164,875 |
Household Income in Croom
Household Income Brackets in Croom
With 337 households falling in the category, the $200,000+ income range is the most frequent in Croom, accounting for 32.6% of all households.
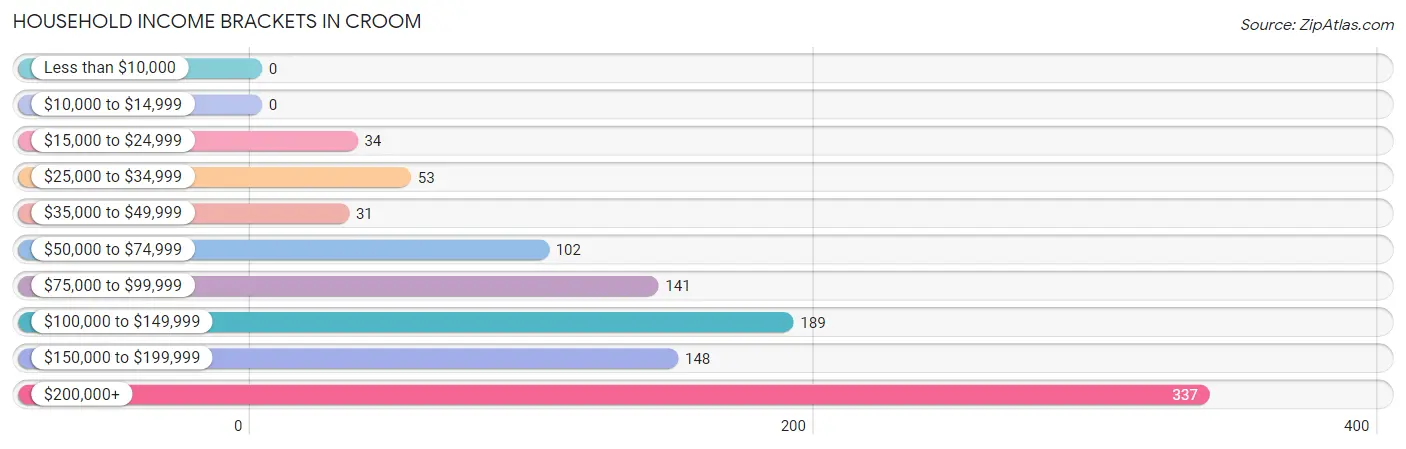
| Income Bracket | # Households | % Households |
| Less than $10,000 | 0 | 0.0% |
| $10,000 to $14,999 | 0 | 0.0% |
| $15,000 to $24,999 | 34 | 3.3% |
| $25,000 to $34,999 | 53 | 5.1% |
| $35,000 to $49,999 | 31 | 3.0% |
| $50,000 to $74,999 | 102 | 9.9% |
| $75,000 to $99,999 | 141 | 13.6% |
| $100,000 to $149,999 | 189 | 18.3% |
| $150,000 to $199,999 | 148 | 14.3% |
| $200,000+ | 337 | 32.6% |
Household Income by Householder Age in Croom
The median household income in Croom is $146,387, with the highest median household income of $168,125 found in the 45 to 64 years age bracket for the primary householder. A total of 503 households (48.6%) fall into this category. Meanwhile, the 15 to 24 years age bracket for the primary householder has the lowest median household income of $0, with 13 households (1.3%) in this group.
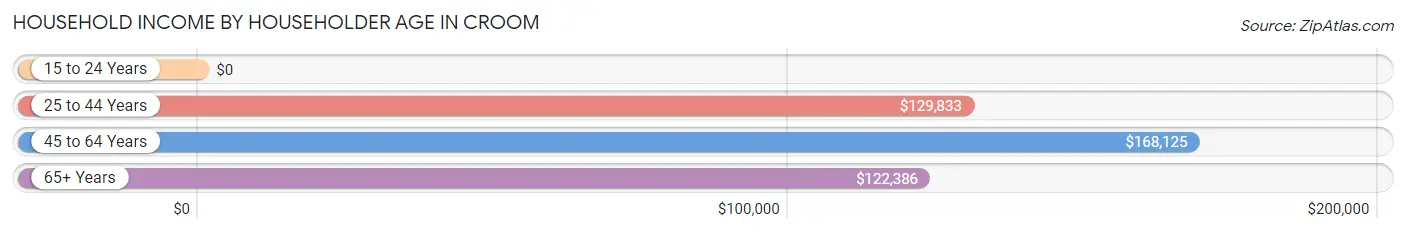
| Income Bracket | # Households | Median Income |
| 15 to 24 Years | 13 (1.3%) | $0 |
| 25 to 44 Years | 140 (13.5%) | $129,833 |
| 45 to 64 Years | 503 (48.6%) | $168,125 |
| 65+ Years | 379 (36.6%) | $122,386 |
| Total | 1,035 (100.0%) | $146,387 |
Poverty in Croom
Income Below Poverty by Sex and Age in Croom
With 5.6% poverty level for males and 10.1% for females among the residents of Croom, 6 to 11 year old males and 6 to 11 year old females are the most vulnerable to poverty, with 40 males (58.8%) and 35 females (92.1%) in their respective age groups living below the poverty level.
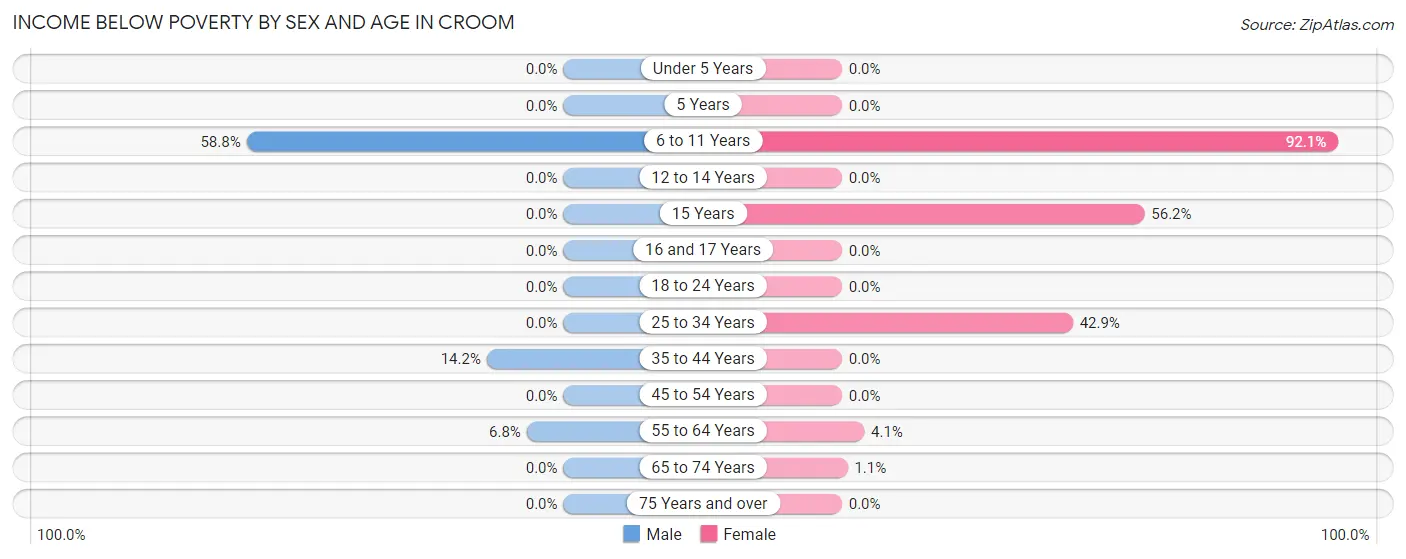
| Age Bracket | Male | Female |
| Under 5 Years | 0 (0.0%) | 0 (0.0%) |
| 5 Years | 0 (0.0%) | 0 (0.0%) |
| 6 to 11 Years | 40 (58.8%) | 35 (92.1%) |
| 12 to 14 Years | 0 (0.0%) | 0 (0.0%) |
| 15 Years | 0 (0.0%) | 41 (56.2%) |
| 16 and 17 Years | 0 (0.0%) | 0 (0.0%) |
| 18 to 24 Years | 0 (0.0%) | 0 (0.0%) |
| 25 to 34 Years | 0 (0.0%) | 36 (42.9%) |
| 35 to 44 Years | 30 (14.2%) | 0 (0.0%) |
| 45 to 54 Years | 0 (0.0%) | 0 (0.0%) |
| 55 to 64 Years | 19 (6.8%) | 11 (4.1%) |
| 65 to 74 Years | 0 (0.0%) | 2 (1.1%) |
| 75 Years and over | 0 (0.0%) | 0 (0.0%) |
| Total | 89 (5.6%) | 125 (10.1%) |
Income Above Poverty by Sex and Age in Croom
According to the poverty statistics in Croom, males aged under 5 years and females aged 5 years are the age groups that are most secure financially, with 100.0% of males and 100.0% of females in these age groups living above the poverty line.
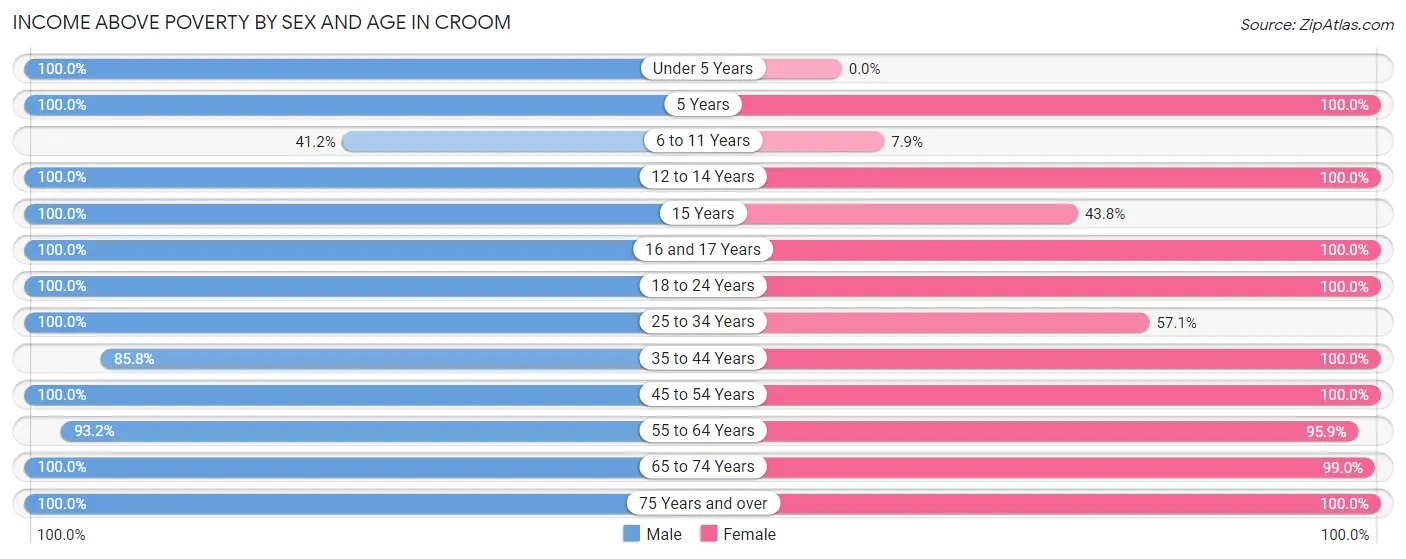
| Age Bracket | Male | Female |
| Under 5 Years | 60 (100.0%) | 0 (0.0%) |
| 5 Years | 21 (100.0%) | 8 (100.0%) |
| 6 to 11 Years | 28 (41.2%) | 3 (7.9%) |
| 12 to 14 Years | 91 (100.0%) | 7 (100.0%) |
| 15 Years | 15 (100.0%) | 32 (43.8%) |
| 16 and 17 Years | 18 (100.0%) | 8 (100.0%) |
| 18 to 24 Years | 164 (100.0%) | 149 (100.0%) |
| 25 to 34 Years | 112 (100.0%) | 48 (57.1%) |
| 35 to 44 Years | 181 (85.8%) | 118 (100.0%) |
| 45 to 54 Years | 252 (100.0%) | 213 (100.0%) |
| 55 to 64 Years | 260 (93.2%) | 255 (95.9%) |
| 65 to 74 Years | 127 (100.0%) | 189 (99.0%) |
| 75 Years and over | 180 (100.0%) | 89 (100.0%) |
| Total | 1,509 (94.4%) | 1,119 (89.9%) |
Income Below Poverty Among Married-Couple Families in Croom
The poverty statistics for married-couple families in Croom show that 5.9% or 42 of the total 709 families live below the poverty line. Families with 3 or 4 children have the highest poverty rate of 88.2%, comprising of 30 families. On the other hand, families with 1 or 2 children have the lowest poverty rate of 0.0%, which includes 0 families.
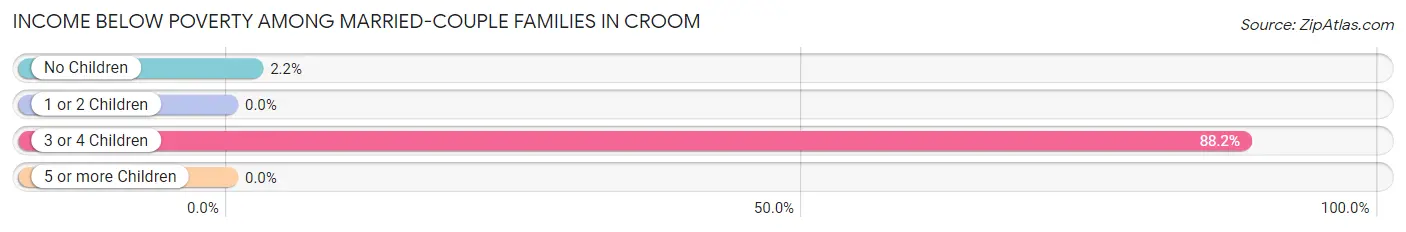
| Children | Above Poverty | Below Poverty |
| No Children | 537 (97.8%) | 12 (2.2%) |
| 1 or 2 Children | 126 (100.0%) | 0 (0.0%) |
| 3 or 4 Children | 4 (11.8%) | 30 (88.2%) |
| 5 or more Children | 0 (0.0%) | 0 (0.0%) |
| Total | 667 (94.1%) | 42 (5.9%) |
Income Below Poverty Among Single-Parent Households in Croom
| Children | Single Father | Single Mother |
| No Children | 0 (0.0%) | 0 (0.0%) |
| 1 or 2 Children | 0 (0.0%) | 0 (0.0%) |
| 3 or 4 Children | 0 (0.0%) | 0 (0.0%) |
| 5 or more Children | 0 (0.0%) | 0 (0.0%) |
| Total | 0 (0.0%) | 0 (0.0%) |
Income Below Poverty Among Married-Couple vs Single-Parent Households in Croom
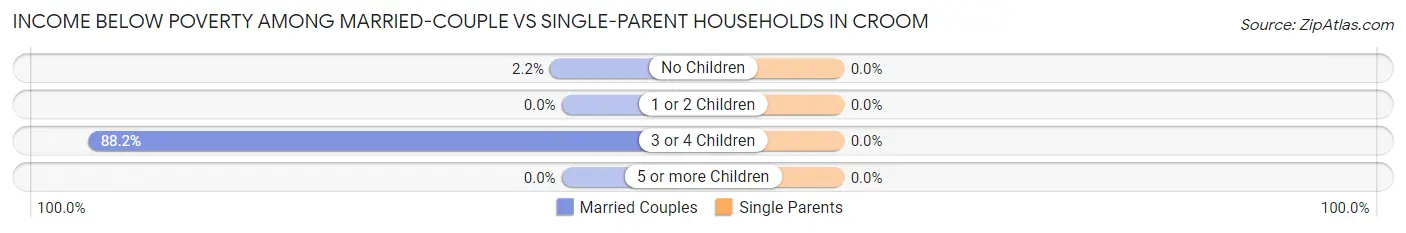
| Children | Married-Couple Families | Single-Parent Households |
| No Children | 12 (2.2%) | 0 (0.0%) |
| 1 or 2 Children | 0 (0.0%) | 0 (0.0%) |
| 3 or 4 Children | 30 (88.2%) | 0 (0.0%) |
| 5 or more Children | 0 (0.0%) | 0 (0.0%) |
| Total | 42 (5.9%) | 0 (0.0%) |
Race in Croom
The most populous races in Croom are White / Caucasian (1,402 | 49.3%), Black / African American (1,182 | 41.6%), and Hispanic or Latino (143 | 5.0%).
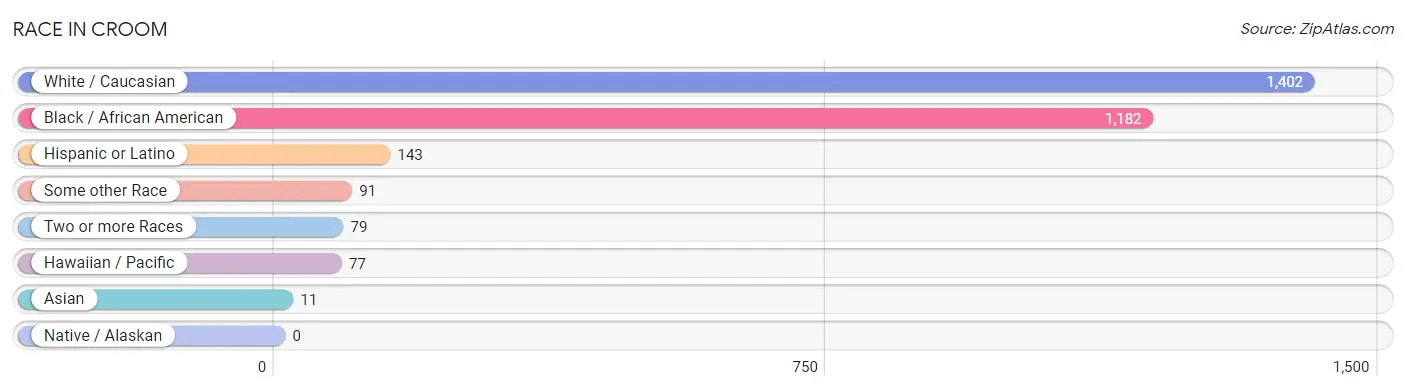
| Race | # Population | % Population |
| Asian | 11 | 0.4% |
| Black / African American | 1,182 | 41.6% |
| Hawaiian / Pacific | 77 | 2.7% |
| Hispanic or Latino | 143 | 5.0% |
| Native / Alaskan | 0 | 0.0% |
| White / Caucasian | 1,402 | 49.3% |
| Two or more Races | 79 | 2.8% |
| Some other Race | 91 | 3.2% |
| Total | 2,842 | 100.0% |
Ancestry in Croom
The most populous ancestries reported in Croom are American (473 | 16.6%), English (237 | 8.3%), German (180 | 6.3%), Irish (135 | 4.8%), and Mexican (116 | 4.1%), together accounting for 40.1% of all Croom residents.
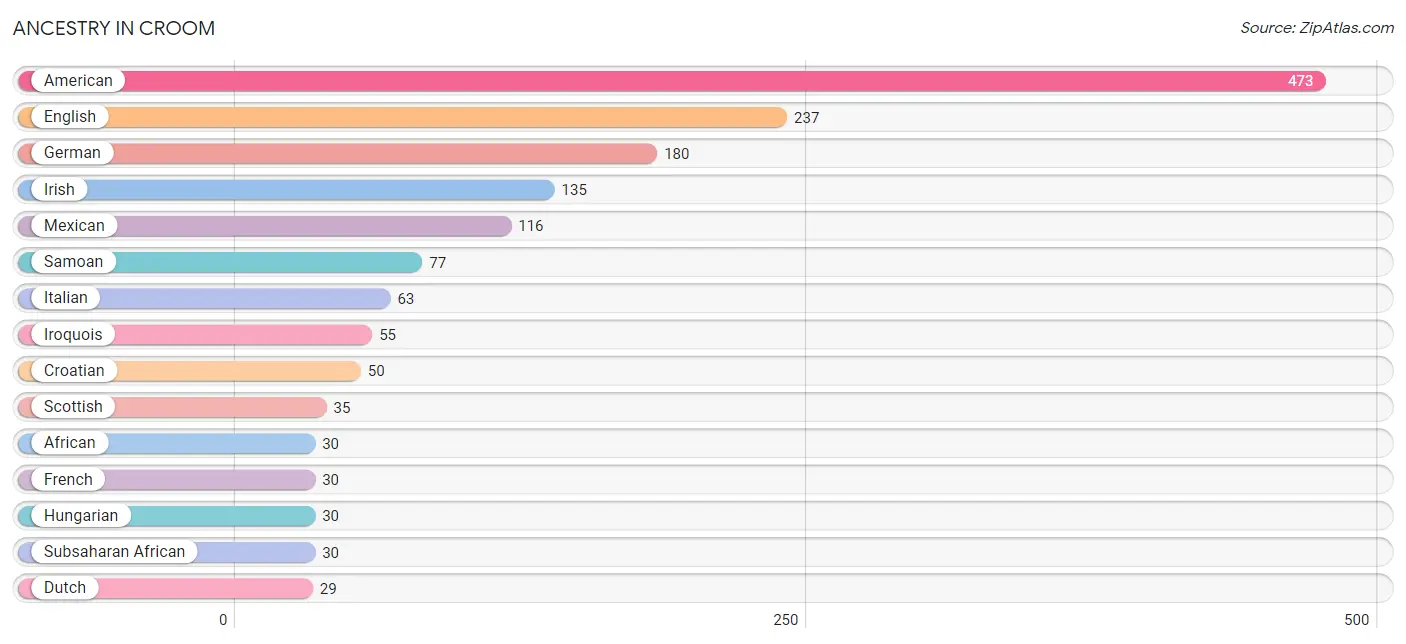
| Ancestry | # Population | % Population |
| African | 30 | 1.1% |
| American | 473 | 16.6% |
| British | 21 | 0.7% |
| Croatian | 50 | 1.8% |
| Dutch | 29 | 1.0% |
| Eastern European | 2 | 0.1% |
| English | 237 | 8.3% |
| European | 12 | 0.4% |
| French | 30 | 1.1% |
| French Canadian | 28 | 1.0% |
| German | 180 | 6.3% |
| Hungarian | 30 | 1.1% |
| Irish | 135 | 4.8% |
| Iroquois | 55 | 1.9% |
| Italian | 63 | 2.2% |
| Jamaican | 8 | 0.3% |
| Korean | 11 | 0.4% |
| Mexican | 116 | 4.1% |
| Northern European | 21 | 0.7% |
| Norwegian | 9 | 0.3% |
| Polish | 12 | 0.4% |
| Puerto Rican | 27 | 0.9% |
| Samoan | 77 | 2.7% |
| Scandinavian | 12 | 0.4% |
| Scotch-Irish | 10 | 0.4% |
| Scottish | 35 | 1.2% |
| Subsaharan African | 30 | 1.1% |
| Swedish | 21 | 0.7% |
| Swiss | 5 | 0.2% | View All 29 Rows |
Immigrants in Croom
The most numerous immigrant groups reported in Croom came from Oceania (39 | 1.4%), Central America (31 | 1.1%), Latin America (31 | 1.1%), Mexico (31 | 1.1%), and Europe (21 | 0.7%), together accounting for 5.4% of all Croom residents.
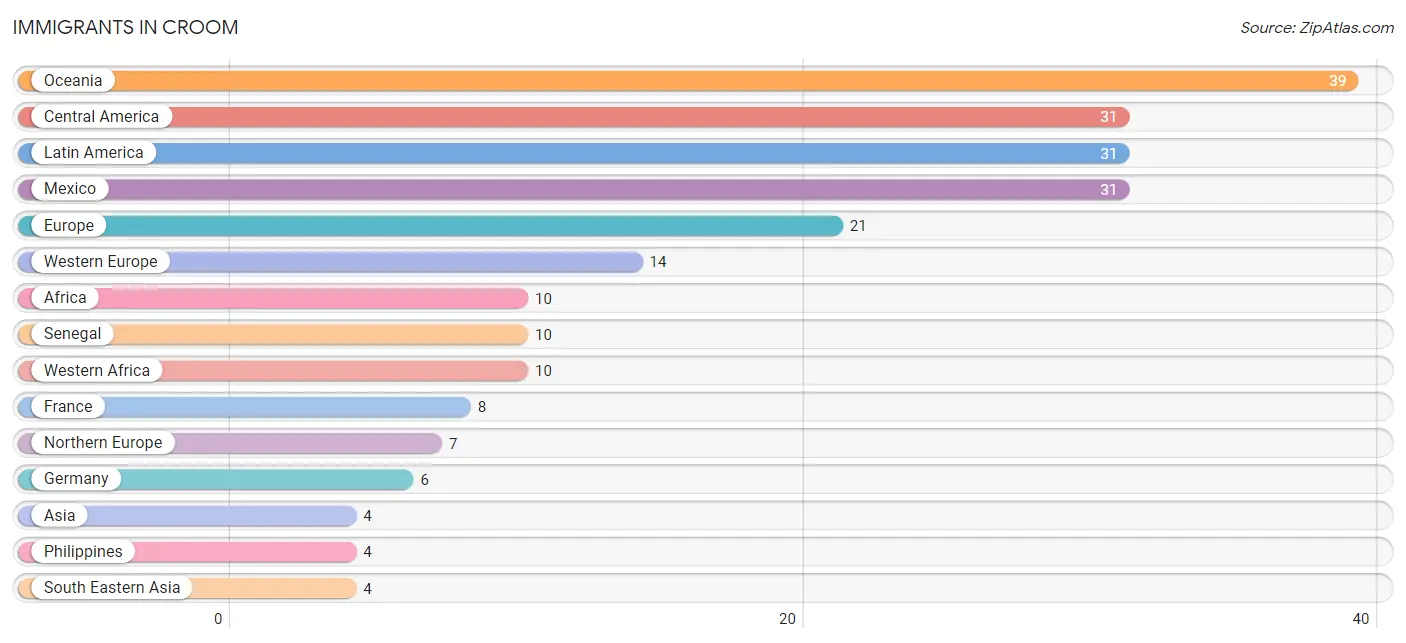
| Immigration Origin | # Population | % Population |
| Africa | 10 | 0.4% |
| Asia | 4 | 0.1% |
| Central America | 31 | 1.1% |
| Europe | 21 | 0.7% |
| France | 8 | 0.3% |
| Germany | 6 | 0.2% |
| Latin America | 31 | 1.1% |
| Mexico | 31 | 1.1% |
| Northern Europe | 7 | 0.3% |
| Oceania | 39 | 1.4% |
| Philippines | 4 | 0.1% |
| Senegal | 10 | 0.4% |
| South Eastern Asia | 4 | 0.1% |
| Western Africa | 10 | 0.4% |
| Western Europe | 14 | 0.5% | View All 15 Rows |
Sex and Age in Croom
Sex and Age in Croom
The most populous age groups in Croom are 45 to 49 Years (171 | 10.7%) for men and 45 to 49 Years (138 | 11.1%) for women.
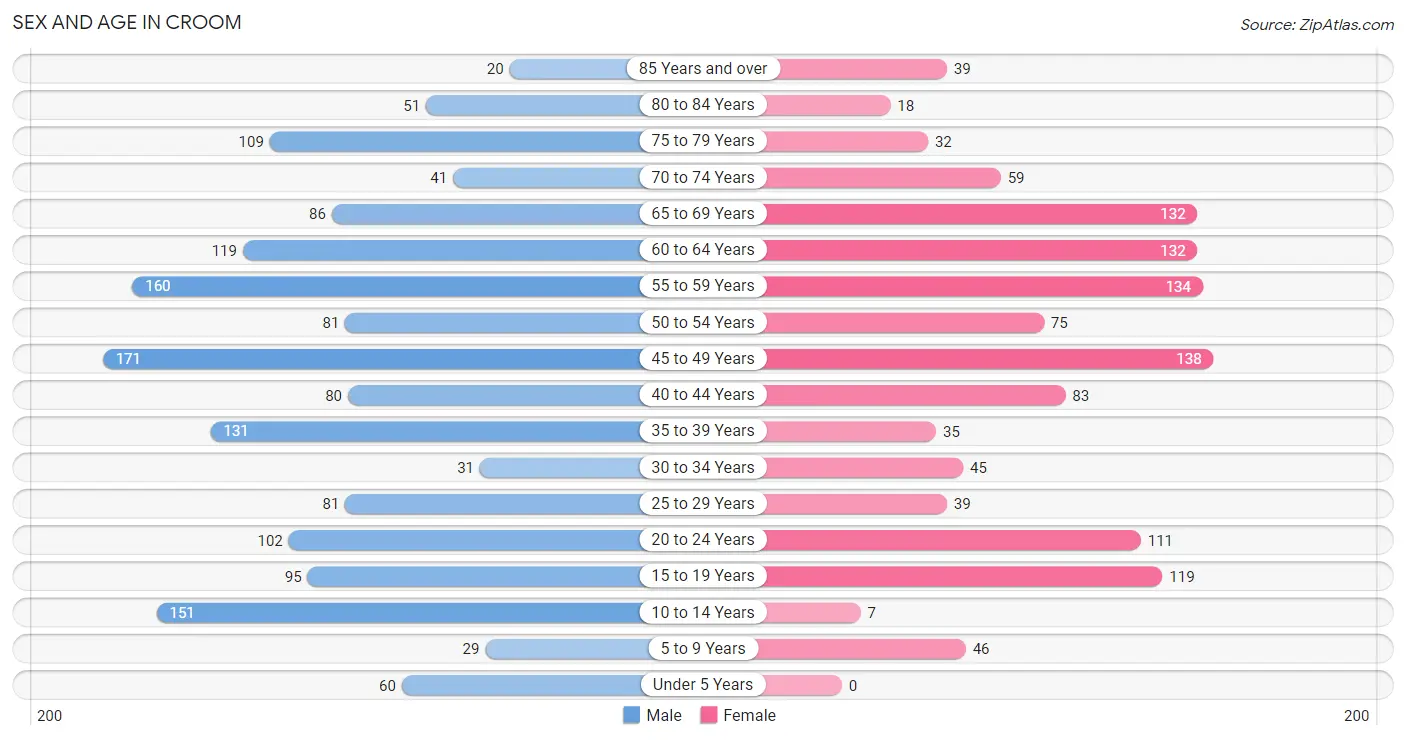
| Age Bracket | Male | Female |
| Under 5 Years | 60 (3.7%) | 0 (0.0%) |
| 5 to 9 Years | 29 (1.8%) | 46 (3.7%) |
| 10 to 14 Years | 151 (9.5%) | 7 (0.6%) |
| 15 to 19 Years | 95 (5.9%) | 119 (9.6%) |
| 20 to 24 Years | 102 (6.4%) | 111 (8.9%) |
| 25 to 29 Years | 81 (5.1%) | 39 (3.1%) |
| 30 to 34 Years | 31 (1.9%) | 45 (3.6%) |
| 35 to 39 Years | 131 (8.2%) | 35 (2.8%) |
| 40 to 44 Years | 80 (5.0%) | 83 (6.7%) |
| 45 to 49 Years | 171 (10.7%) | 138 (11.1%) |
| 50 to 54 Years | 81 (5.1%) | 75 (6.0%) |
| 55 to 59 Years | 160 (10.0%) | 134 (10.8%) |
| 60 to 64 Years | 119 (7.4%) | 132 (10.6%) |
| 65 to 69 Years | 86 (5.4%) | 132 (10.6%) |
| 70 to 74 Years | 41 (2.6%) | 59 (4.7%) |
| 75 to 79 Years | 109 (6.8%) | 32 (2.6%) |
| 80 to 84 Years | 51 (3.2%) | 18 (1.5%) |
| 85 Years and over | 20 (1.3%) | 39 (3.1%) |
| Total | 1,598 (100.0%) | 1,244 (100.0%) |
Families and Households in Croom
Median Family Size in Croom
The median family size in Croom is 3.09 persons per family, with single female/mother families (103 | 12.5%) accounting for the largest median family size of 3.71 persons per family. On the other hand, married-couple families (709 | 86.2%) represent the smallest median family size with 3.00 persons per family.
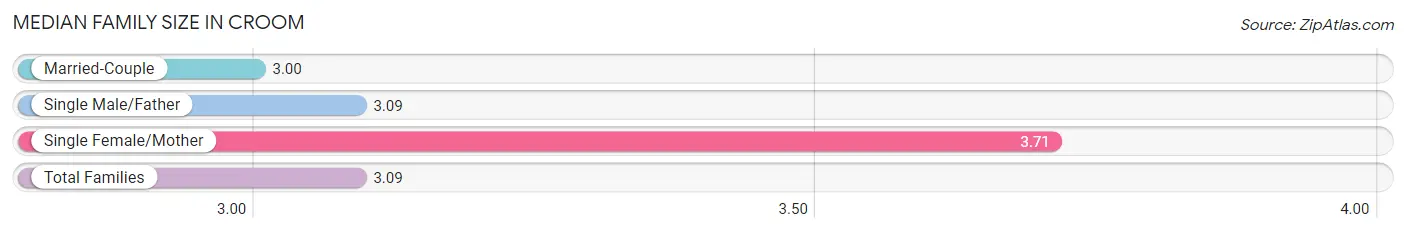
| Family Type | # Families | Family Size |
| Married-Couple | 709 (86.2%) | 3.00 |
| Single Male/Father | 11 (1.3%) | 3.09 |
| Single Female/Mother | 103 (12.5%) | 3.71 |
| Total Families | 823 (100.0%) | 3.09 |
Median Household Size in Croom
The median household size in Croom is 2.74 persons per household, with single female/mother households (103 | 10.0%) accounting for the largest median household size of 4.21 persons per household. non-family households (212 | 20.5%) represent the smallest median household size with 1.15 persons per household.
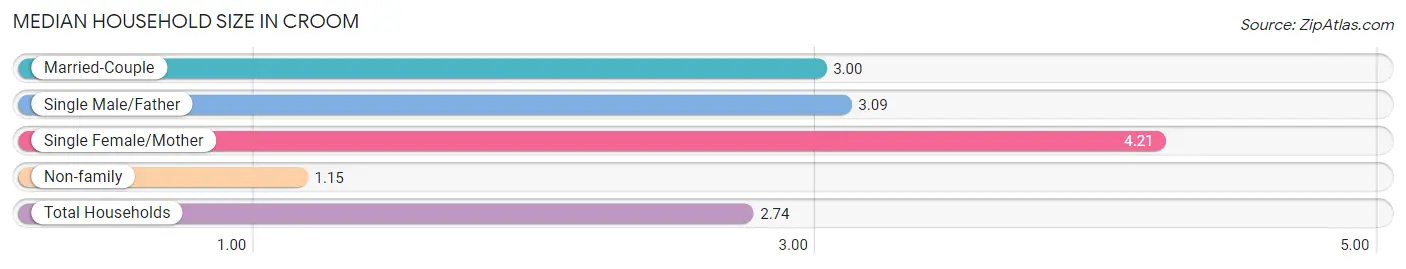
| Household Type | # Households | Household Size |
| Married-Couple | 709 (68.5%) | 3.00 |
| Single Male/Father | 11 (1.1%) | 3.09 |
| Single Female/Mother | 103 (10.0%) | 4.21 |
| Non-family | 212 (20.5%) | 1.15 |
| Total Households | 1,035 (100.0%) | 2.74 |
Household Size by Marriage Status in Croom
Out of a total of 1,035 households in Croom, 823 (79.5%) are family households, while 212 (20.5%) are nonfamily households. The most numerous type of family households are 2-person households, comprising 356, and the most common type of nonfamily households are 1-person households, comprising 174.
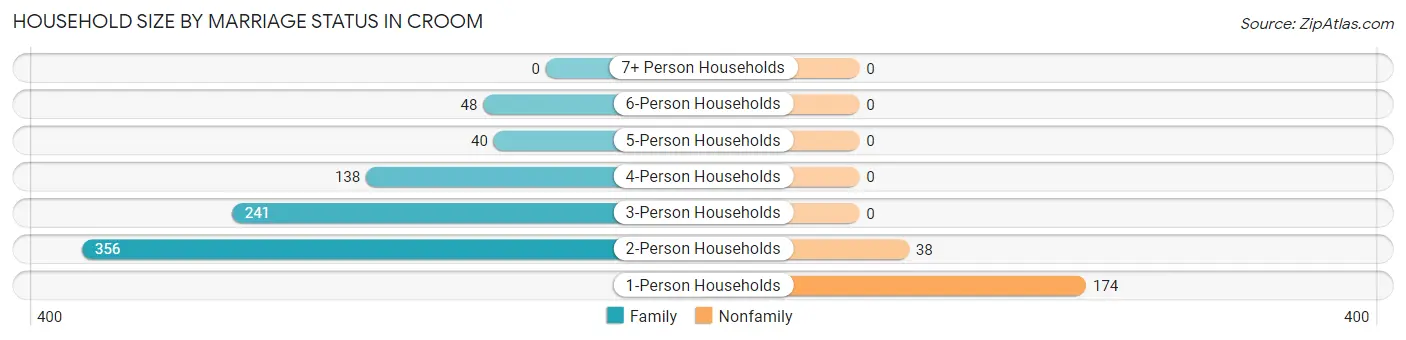
| Household Size | Family Households | Nonfamily Households |
| 1-Person Households | - | 174 (16.8%) |
| 2-Person Households | 356 (34.4%) | 38 (3.7%) |
| 3-Person Households | 241 (23.3%) | 0 (0.0%) |
| 4-Person Households | 138 (13.3%) | 0 (0.0%) |
| 5-Person Households | 40 (3.9%) | 0 (0.0%) |
| 6-Person Households | 48 (4.6%) | 0 (0.0%) |
| 7+ Person Households | 0 (0.0%) | 0 (0.0%) |
| Total | 823 (79.5%) | 212 (20.5%) |
Female Fertility in Croom
Fertility by Age in Croom
| Age Bracket | Women with Births | Births / 1,000 Women |
| 15 to 19 years | 0 (0.0%) | 0.0 |
| 20 to 34 years | 0 (0.0%) | 0.0 |
| 35 to 50 years | 0 (0.0%) | 0.0 |
| Total | 0 (0.0%) | 0.0 |
Fertility by Age by Marriage Status in Croom
| Age Bracket | Married | Unmarried |
| 15 to 19 years | 0 (0.0%) | 0 (0.0%) |
| 20 to 34 years | 0 (0.0%) | 0 (0.0%) |
| 35 to 50 years | 0 (0.0%) | 0 (0.0%) |
| Total | 0 (0.0%) | 0 (0.0%) |
Fertility by Education in Croom
| Educational Attainment | Women with Births | Births / 1,000 Women |
| Less than High School | 0 (0.0%) | 0.0 |
| High School Diploma | 0 (0.0%) | 0.0 |
| College or Associate's Degree | 0 (0.0%) | 0.0 |
| Bachelor's Degree | 0 (0.0%) | 0.0 |
| Graduate Degree | 0 (0.0%) | 0.0 |
| Total | 0 (0.0%) | 0.0 |
Fertility by Education by Marriage Status in Croom
| Educational Attainment | Married | Unmarried |
| Less than High School | 0 (0.0%) | 0 (0.0%) |
| High School Diploma | 0 (0.0%) | 0 (0.0%) |
| College or Associate's Degree | 0 (0.0%) | 0 (0.0%) |
| Bachelor's Degree | 0 (0.0%) | 0 (0.0%) |
| Graduate Degree | 0 (0.0%) | 0 (0.0%) |
| Total | 0 (0.0%) | 0 (0.0%) |
Employment Characteristics in Croom
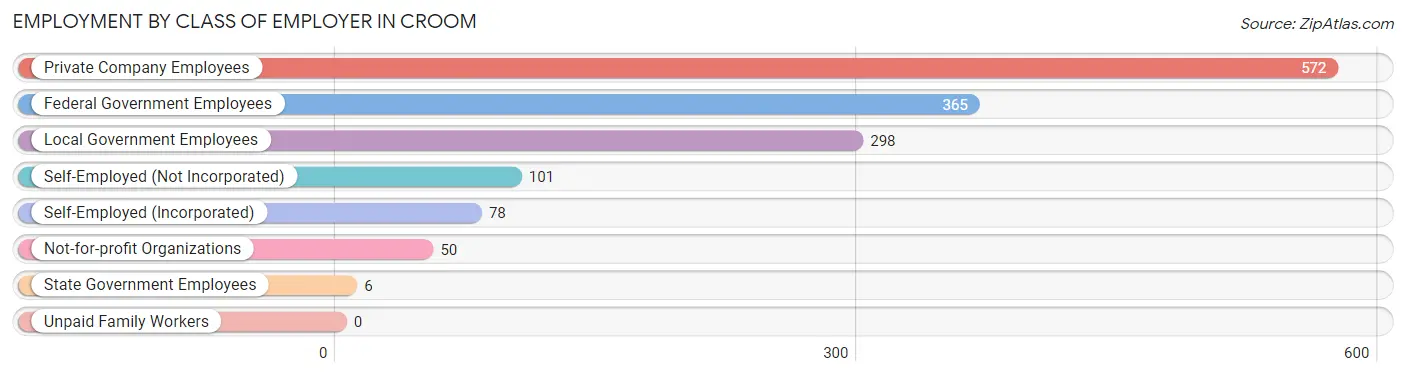
Employment by Class of Employer in Croom
Among the 1,470 employed individuals in Croom, private company employees (572 | 38.9%), federal government employees (365 | 24.8%), and local government employees (298 | 20.3%) make up the most common classes of employment.
| Employer Class | # Employees | % Employees |
| Private Company Employees | 572 | 38.9% |
| Self-Employed (Incorporated) | 78 | 5.3% |
| Self-Employed (Not Incorporated) | 101 | 6.9% |
| Not-for-profit Organizations | 50 | 3.4% |
| Local Government Employees | 298 | 20.3% |
| State Government Employees | 6 | 0.4% |
| Federal Government Employees | 365 | 24.8% |
| Unpaid Family Workers | 0 | 0.0% |
| Total | 1,470 | 100.0% |
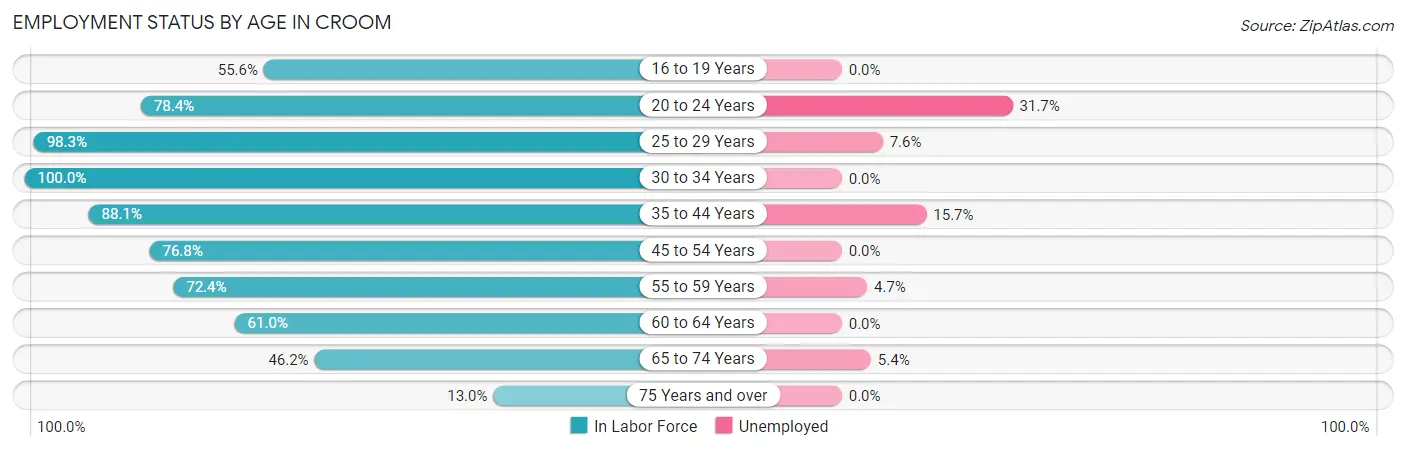
Employment Status by Age in Croom
According to the labor force statistics for Croom, out of the total population over 16 years of age (2,461), 66.1% or 1,627 individuals are in the labor force, with 7.8% or 127 of them unemployed. The age group with the highest labor force participation rate is 30 to 34 years, with 100.0% or 76 individuals in the labor force. Within the labor force, the 20 to 24 years age range has the highest percentage of unemployed individuals, with 31.7% or 53 of them being unemployed.
| Age Bracket | In Labor Force | Unemployed |
| 16 to 19 Years | 70 (55.6%) | 0 (0.0%) |
| 20 to 24 Years | 167 (78.4%) | 53 (31.7%) |
| 25 to 29 Years | 118 (98.3%) | 9 (7.6%) |
| 30 to 34 Years | 76 (100.0%) | 0 (0.0%) |
| 35 to 44 Years | 290 (88.1%) | 46 (15.7%) |
| 45 to 54 Years | 357 (76.8%) | 0 (0.0%) |
| 55 to 59 Years | 213 (72.4%) | 10 (4.7%) |
| 60 to 64 Years | 153 (61.0%) | 0 (0.0%) |
| 65 to 74 Years | 147 (46.2%) | 8 (5.4%) |
| 75 Years and over | 35 (13.0%) | 0 (0.0%) |
| Total | 1,627 (66.1%) | 127 (7.8%) |
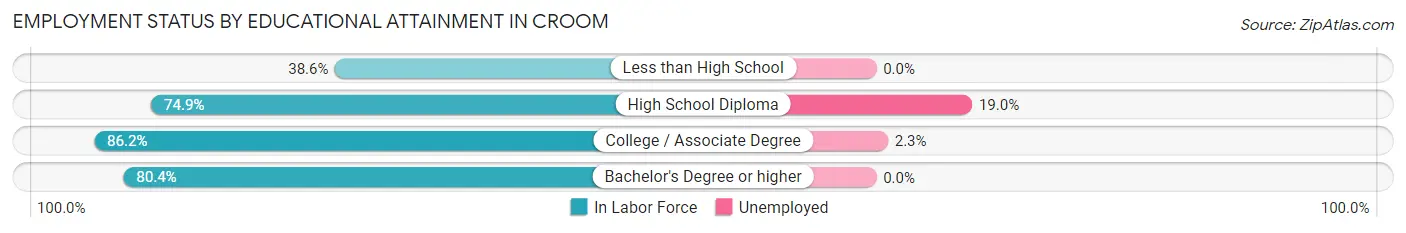
Employment Status by Educational Attainment in Croom
According to labor force statistics for Croom, 78.6% of individuals (1,207) out of the total population between 25 and 64 years of age (1,535) are in the labor force, with 5.3% or 64 of them being unemployed. The group with the highest labor force participation rate are those with the educational attainment of college / associate degree, with 86.2% or 437 individuals in the labor force. Within the labor force, individuals with high school diploma education have the highest percentage of unemployment, with 19.0% or 51 of them being unemployed.
| Educational Attainment | In Labor Force | Unemployed |
| Less than High School | 34 (38.6%) | 0 (0.0%) |
| High School Diploma | 268 (74.9%) | 68 (19.0%) |
| College / Associate Degree | 437 (86.2%) | 12 (2.3%) |
| Bachelor's Degree or higher | 468 (80.4%) | 0 (0.0%) |
| Total | 1,207 (78.6%) | 81 (5.3%) |
Employment Occupations by Sex in Croom
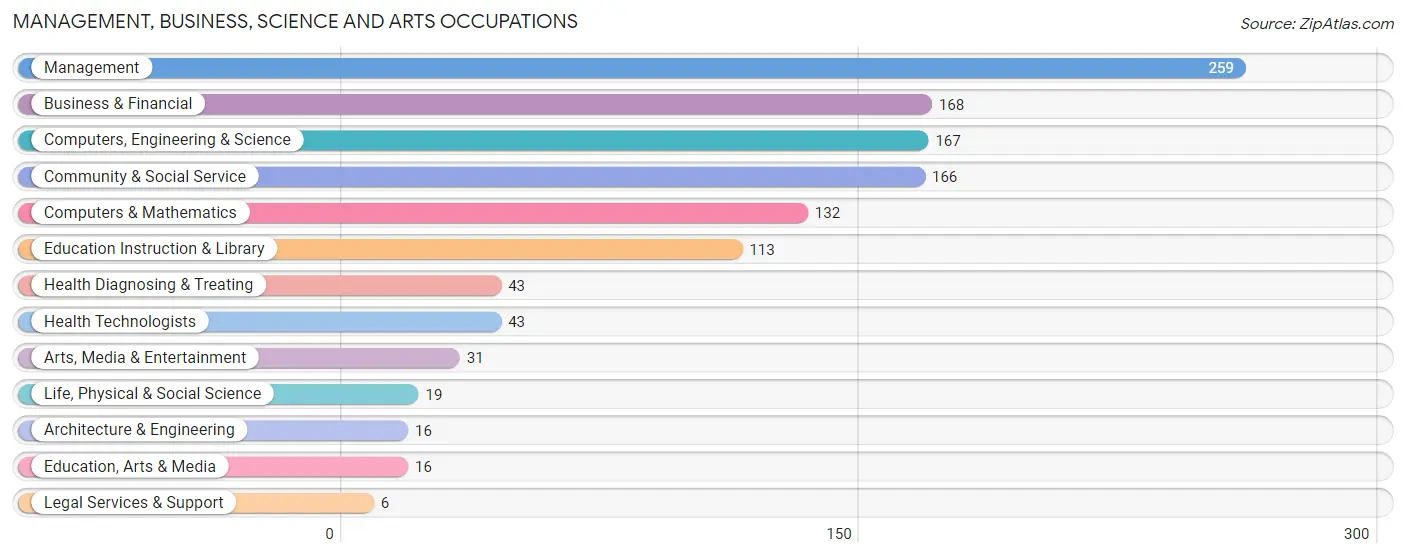
Management, Business, Science and Arts Occupations
The most common Management, Business, Science and Arts occupations in Croom are Management (259 | 18.0%), Business & Financial (168 | 11.7%), Computers, Engineering & Science (167 | 11.6%), Community & Social Service (166 | 11.5%), and Computers & Mathematics (132 | 9.1%).
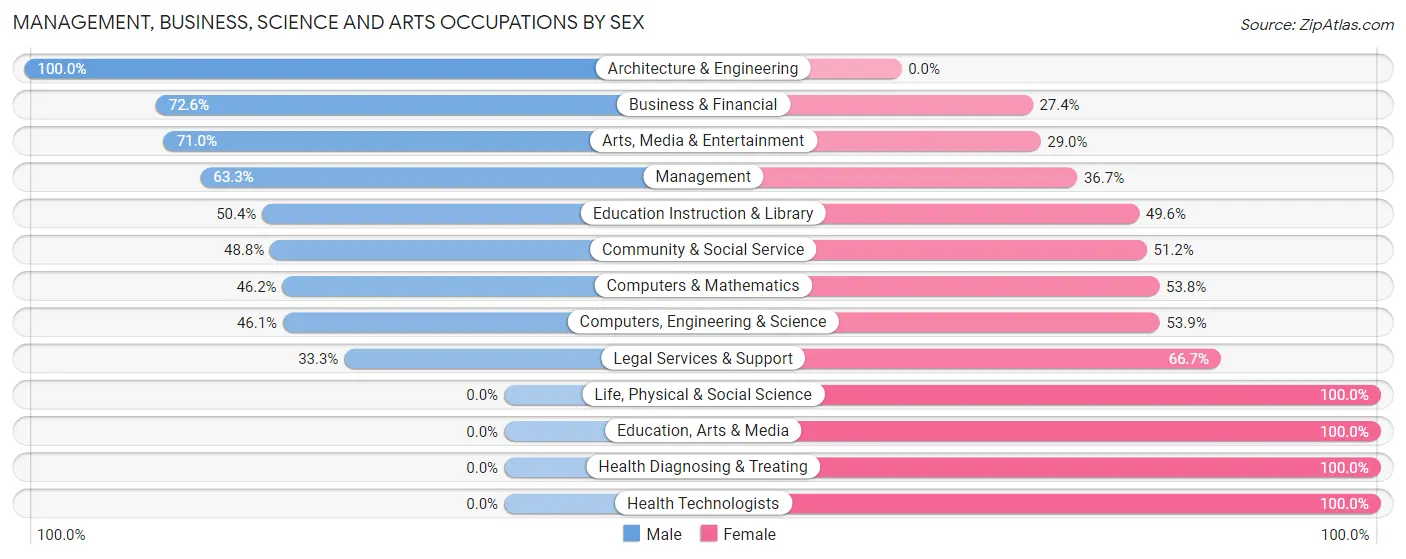
Management, Business, Science and Arts Occupations by Sex
Within the Management, Business, Science and Arts occupations in Croom, the most male-oriented occupations are Architecture & Engineering (100.0%), Business & Financial (72.6%), and Arts, Media & Entertainment (71.0%), while the most female-oriented occupations are Life, Physical & Social Science (100.0%), Education, Arts & Media (100.0%), and Health Diagnosing & Treating (100.0%).
| Occupation | Male | Female |
| Management | 164 (63.3%) | 95 (36.7%) |
| Business & Financial | 122 (72.6%) | 46 (27.4%) |
| Computers, Engineering & Science | 77 (46.1%) | 90 (53.9%) |
| Computers & Mathematics | 61 (46.2%) | 71 (53.8%) |
| Architecture & Engineering | 16 (100.0%) | 0 (0.0%) |
| Life, Physical & Social Science | 0 (0.0%) | 19 (100.0%) |
| Community & Social Service | 81 (48.8%) | 85 (51.2%) |
| Education, Arts & Media | 0 (0.0%) | 16 (100.0%) |
| Legal Services & Support | 2 (33.3%) | 4 (66.7%) |
| Education Instruction & Library | 57 (50.4%) | 56 (49.6%) |
| Arts, Media & Entertainment | 22 (71.0%) | 9 (29.0%) |
| Health Diagnosing & Treating | 0 (0.0%) | 43 (100.0%) |
| Health Technologists | 0 (0.0%) | 43 (100.0%) |
| Total (Category) | 444 (55.3%) | 359 (44.7%) |
| Total (Overall) | 850 (59.0%) | 592 (41.0%) |
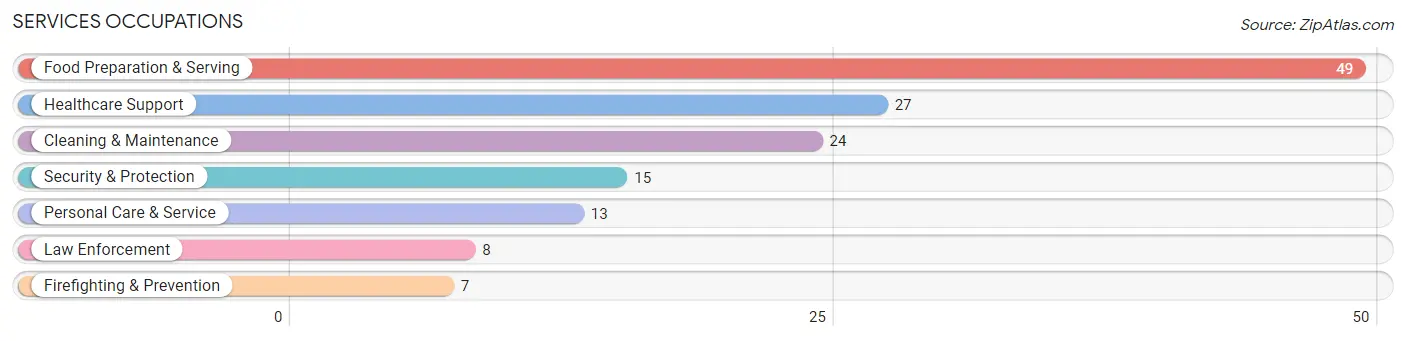
Services Occupations
The most common Services occupations in Croom are Food Preparation & Serving (49 | 3.4%), Healthcare Support (27 | 1.9%), Cleaning & Maintenance (24 | 1.7%), Security & Protection (15 | 1.0%), and Personal Care & Service (13 | 0.9%).
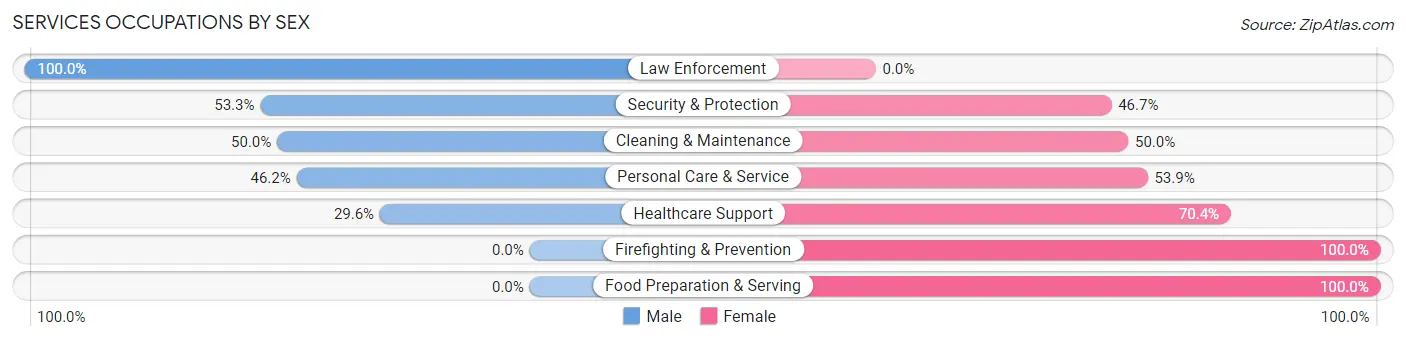
Services Occupations by Sex
Within the Services occupations in Croom, the most male-oriented occupations are Law Enforcement (100.0%), Security & Protection (53.3%), and Cleaning & Maintenance (50.0%), while the most female-oriented occupations are Firefighting & Prevention (100.0%), Food Preparation & Serving (100.0%), and Healthcare Support (70.4%).
| Occupation | Male | Female |
| Healthcare Support | 8 (29.6%) | 19 (70.4%) |
| Security & Protection | 8 (53.3%) | 7 (46.7%) |
| Firefighting & Prevention | 0 (0.0%) | 7 (100.0%) |
| Law Enforcement | 8 (100.0%) | 0 (0.0%) |
| Food Preparation & Serving | 0 (0.0%) | 49 (100.0%) |
| Cleaning & Maintenance | 12 (50.0%) | 12 (50.0%) |
| Personal Care & Service | 6 (46.2%) | 7 (53.8%) |
| Total (Category) | 34 (26.6%) | 94 (73.4%) |
| Total (Overall) | 850 (59.0%) | 592 (41.0%) |
Sales and Office Occupations
The most common Sales and Office occupations in Croom are Office & Administration (190 | 13.2%), and Sales & Related (92 | 6.4%).
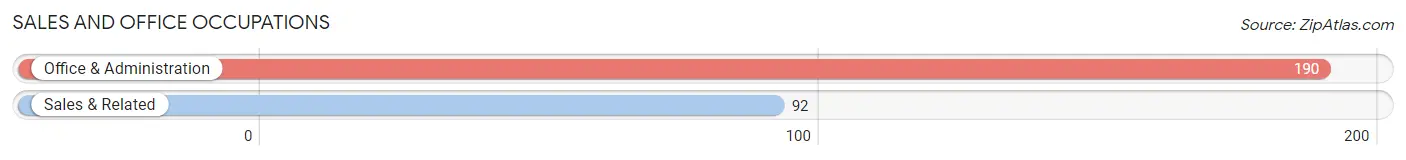
Sales and Office Occupations by Sex
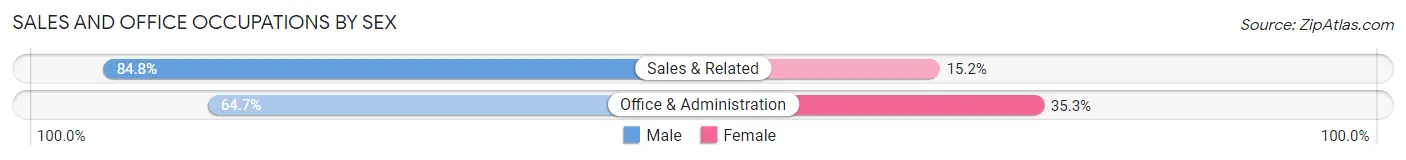
| Occupation | Male | Female |
| Sales & Related | 78 (84.8%) | 14 (15.2%) |
| Office & Administration | 123 (64.7%) | 67 (35.3%) |
| Total (Category) | 201 (71.3%) | 81 (28.7%) |
| Total (Overall) | 850 (59.0%) | 592 (41.0%) |
Natural Resources, Construction and Maintenance Occupations
The most common Natural Resources, Construction and Maintenance occupations in Croom are Installation, Maintenance & Repair (73 | 5.1%), and Construction & Extraction (36 | 2.5%).
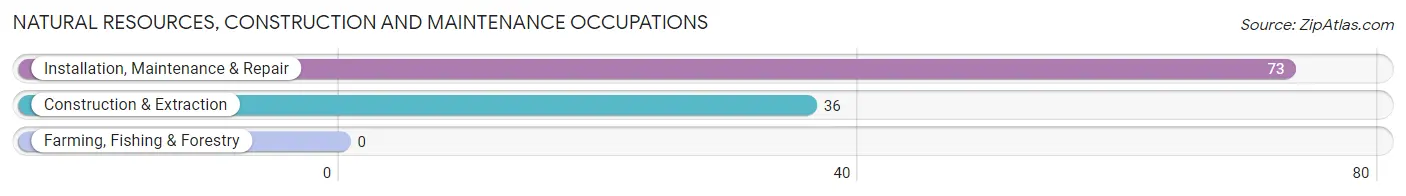
Natural Resources, Construction and Maintenance Occupations by Sex
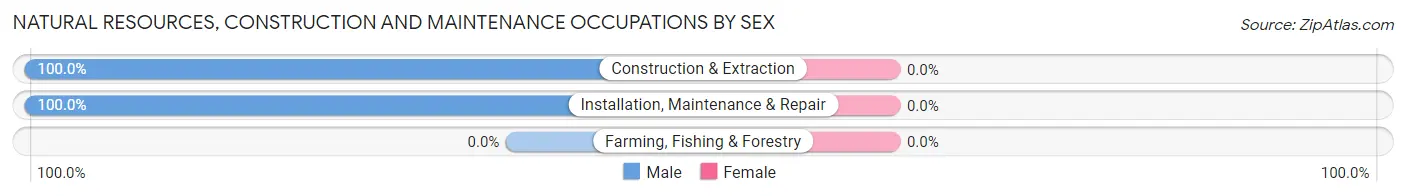
| Occupation | Male | Female |
| Farming, Fishing & Forestry | 0 (0.0%) | 0 (0.0%) |
| Construction & Extraction | 36 (100.0%) | 0 (0.0%) |
| Installation, Maintenance & Repair | 73 (100.0%) | 0 (0.0%) |
| Total (Category) | 109 (100.0%) | 0 (0.0%) |
| Total (Overall) | 850 (59.0%) | 592 (41.0%) |
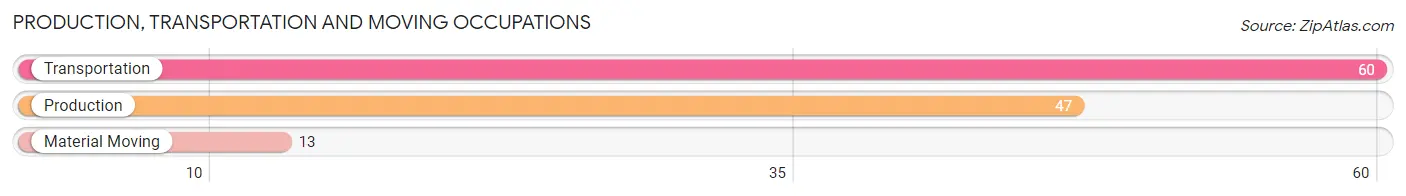
Production, Transportation and Moving Occupations
The most common Production, Transportation and Moving occupations in Croom are Transportation (60 | 4.2%), Production (47 | 3.3%), and Material Moving (13 | 0.9%).
Production, Transportation and Moving Occupations by Sex
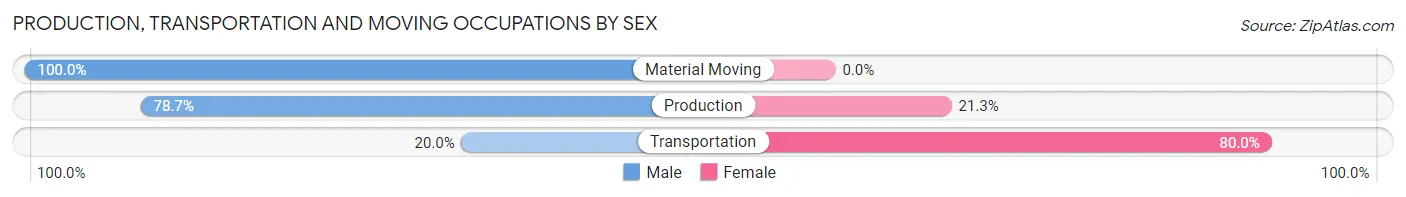
| Occupation | Male | Female |
| Production | 37 (78.7%) | 10 (21.3%) |
| Transportation | 12 (20.0%) | 48 (80.0%) |
| Material Moving | 13 (100.0%) | 0 (0.0%) |
| Total (Category) | 62 (51.7%) | 58 (48.3%) |
| Total (Overall) | 850 (59.0%) | 592 (41.0%) |
Employment Industries by Sex in Croom
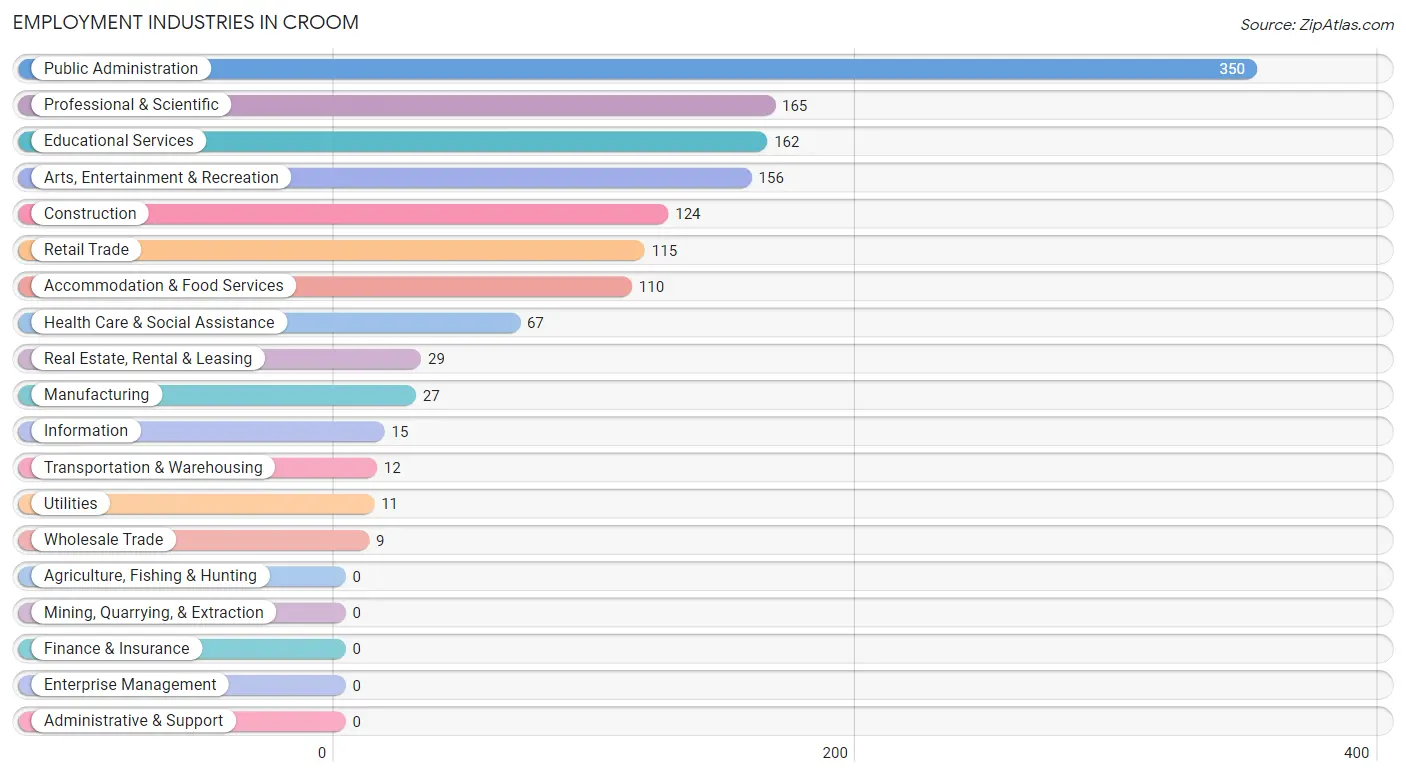
Employment Industries in Croom
The major employment industries in Croom include Public Administration (350 | 24.3%), Professional & Scientific (165 | 11.4%), Educational Services (162 | 11.2%), Arts, Entertainment & Recreation (156 | 10.8%), and Construction (124 | 8.6%).
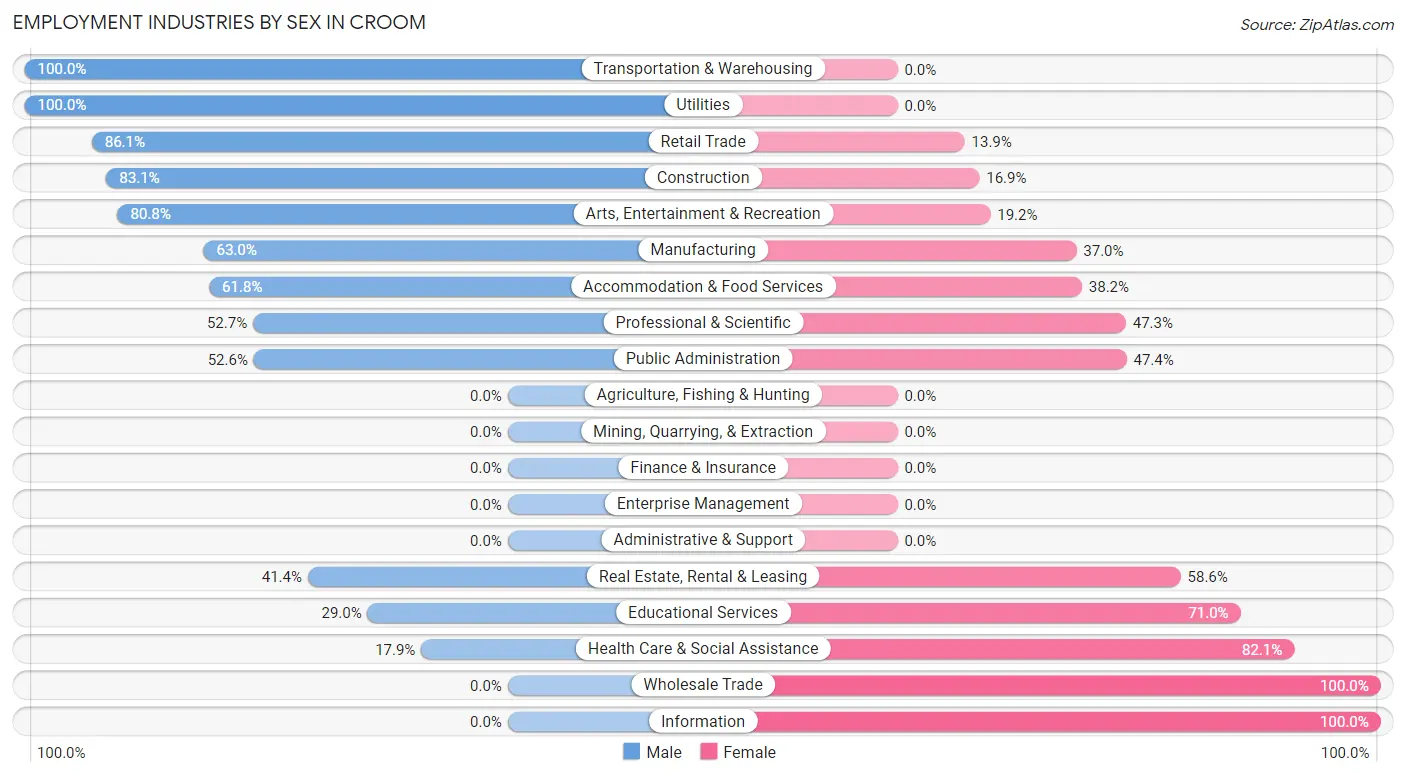
Employment Industries by Sex in Croom
The Croom industries that see more men than women are Transportation & Warehousing (100.0%), Utilities (100.0%), and Retail Trade (86.1%), whereas the industries that tend to have a higher number of women are Wholesale Trade (100.0%), Information (100.0%), and Health Care & Social Assistance (82.1%).
| Industry | Male | Female |
| Agriculture, Fishing & Hunting | 0 (0.0%) | 0 (0.0%) |
| Mining, Quarrying, & Extraction | 0 (0.0%) | 0 (0.0%) |
| Construction | 103 (83.1%) | 21 (16.9%) |
| Manufacturing | 17 (63.0%) | 10 (37.0%) |
| Wholesale Trade | 0 (0.0%) | 9 (100.0%) |
| Retail Trade | 99 (86.1%) | 16 (13.9%) |
| Transportation & Warehousing | 12 (100.0%) | 0 (0.0%) |
| Utilities | 11 (100.0%) | 0 (0.0%) |
| Information | 0 (0.0%) | 15 (100.0%) |
| Finance & Insurance | 0 (0.0%) | 0 (0.0%) |
| Real Estate, Rental & Leasing | 12 (41.4%) | 17 (58.6%) |
| Professional & Scientific | 87 (52.7%) | 78 (47.3%) |
| Enterprise Management | 0 (0.0%) | 0 (0.0%) |
| Administrative & Support | 0 (0.0%) | 0 (0.0%) |
| Educational Services | 47 (29.0%) | 115 (71.0%) |
| Health Care & Social Assistance | 12 (17.9%) | 55 (82.1%) |
| Arts, Entertainment & Recreation | 126 (80.8%) | 30 (19.2%) |
| Accommodation & Food Services | 68 (61.8%) | 42 (38.2%) |
| Public Administration | 184 (52.6%) | 166 (47.4%) |
| Total | 850 (59.0%) | 592 (41.0%) |
Education in Croom
School Enrollment in Croom
The most common levels of schooling among the 623 students in Croom are college / undergraduate (210 | 33.7%), middle school (138 | 22.2%), and high school (114 | 18.3%).
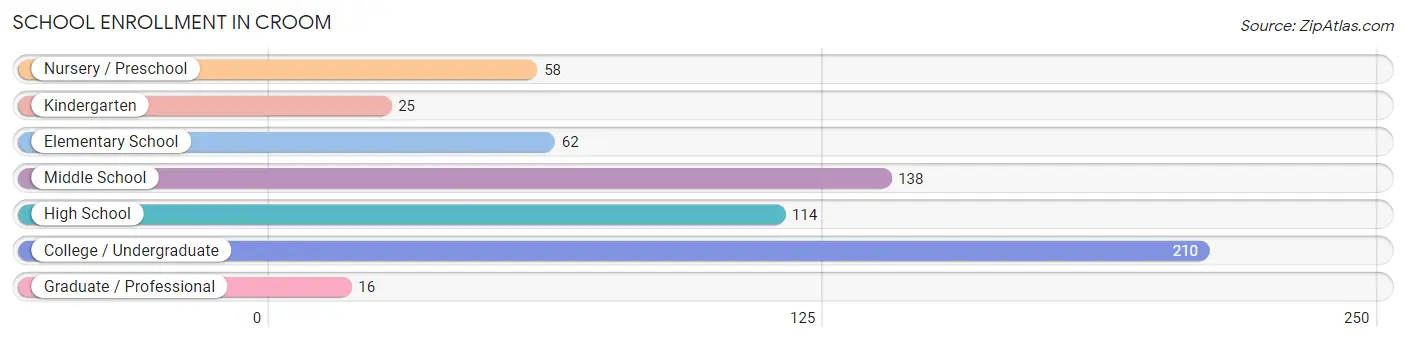
| School Level | # Students | % Students |
| Nursery / Preschool | 58 | 9.3% |
| Kindergarten | 25 | 4.0% |
| Elementary School | 62 | 10.0% |
| Middle School | 138 | 22.2% |
| High School | 114 | 18.3% |
| College / Undergraduate | 210 | 33.7% |
| Graduate / Professional | 16 | 2.6% |
| Total | 623 | 100.0% |
School Enrollment by Age by Funding Source in Croom
Out of a total of 623 students who are enrolled in schools in Croom, 126 (20.2%) attend a private institution, while the remaining 497 (79.8%) are enrolled in public schools. The age group of 35 years and over has the highest likelihood of being enrolled in private schools, with 8 (100.0% in the age bracket) enrolled. Conversely, the age group of 18 to 19 year olds has the lowest likelihood of being enrolled in a private school, with 38 (100.0% in the age bracket) attending a public institution.
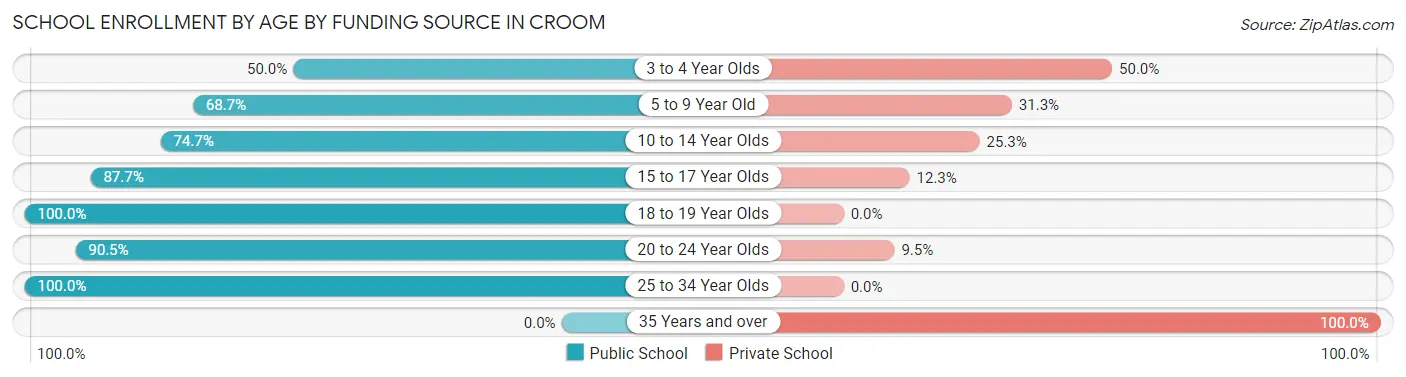
| Age Bracket | Public School | Private School |
| 3 to 4 Year Olds | 29 (50.0%) | 29 (50.0%) |
| 5 to 9 Year Old | 46 (68.7%) | 21 (31.3%) |
| 10 to 14 Year Olds | 118 (74.7%) | 40 (25.3%) |
| 15 to 17 Year Olds | 100 (87.7%) | 14 (12.3%) |
| 18 to 19 Year Olds | 38 (100.0%) | 0 (0.0%) |
| 20 to 24 Year Olds | 134 (90.5%) | 14 (9.5%) |
| 25 to 34 Year Olds | 32 (100.0%) | 0 (0.0%) |
| 35 Years and over | 0 (0.0%) | 8 (100.0%) |
| Total | 497 (79.8%) | 126 (20.2%) |
Educational Attainment by Field of Study in Croom
Business (149 | 17.4%), engineering (115 | 13.4%), science & technology (105 | 12.2%), social sciences (75 | 8.7%), and bio, nature & agricultural (59 | 6.9%) are the most common fields of study among 858 individuals in Croom who have obtained a bachelor's degree or higher.
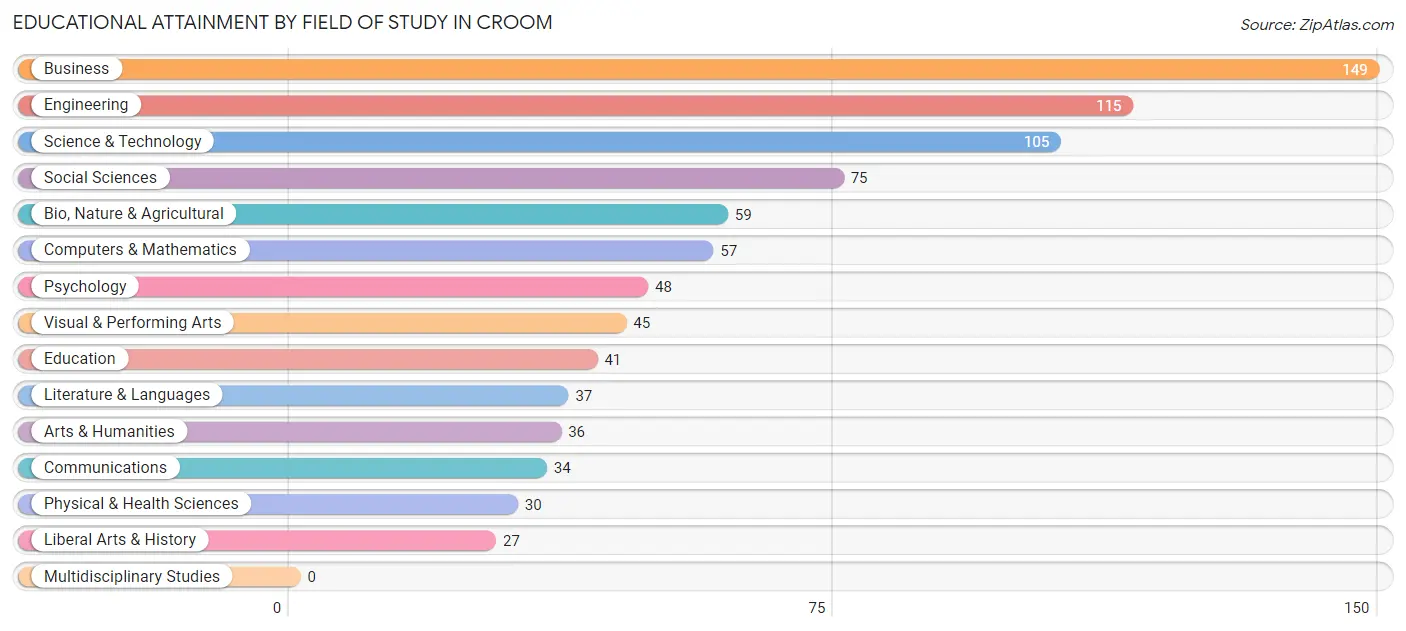
| Field of Study | # Graduates | % Graduates |
| Computers & Mathematics | 57 | 6.6% |
| Bio, Nature & Agricultural | 59 | 6.9% |
| Physical & Health Sciences | 30 | 3.5% |
| Psychology | 48 | 5.6% |
| Social Sciences | 75 | 8.7% |
| Engineering | 115 | 13.4% |
| Multidisciplinary Studies | 0 | 0.0% |
| Science & Technology | 105 | 12.2% |
| Business | 149 | 17.4% |
| Education | 41 | 4.8% |
| Literature & Languages | 37 | 4.3% |
| Liberal Arts & History | 27 | 3.2% |
| Visual & Performing Arts | 45 | 5.2% |
| Communications | 34 | 4.0% |
| Arts & Humanities | 36 | 4.2% |
| Total | 858 | 100.0% |
Transportation & Commute in Croom
Vehicle Availability by Sex in Croom
The most prevalent vehicle ownership categories in Croom are males with 4 vehicles (324, accounting for 37.1%) and females with 4 vehicles (163, making up 54.4%).
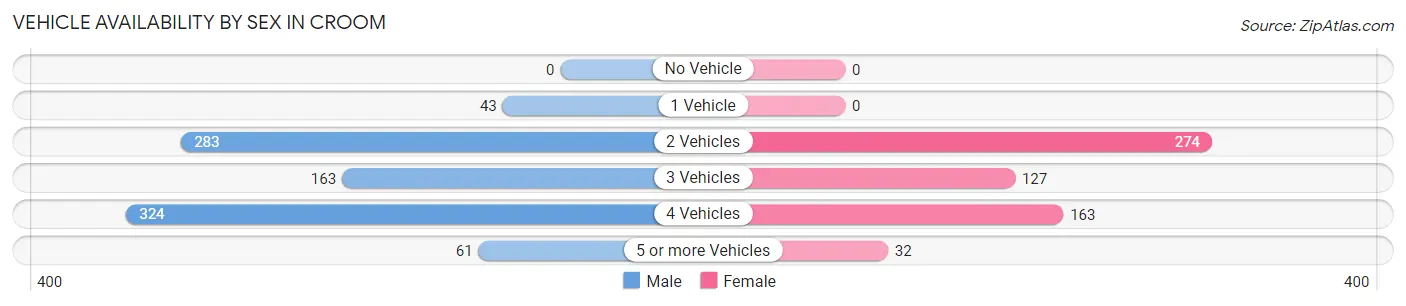
| Vehicles Available | Male | Female |
| No Vehicle | 0 (0.0%) | 0 (0.0%) |
| 1 Vehicle | 43 (4.9%) | 0 (0.0%) |
| 2 Vehicles | 283 (32.4%) | 274 (46.0%) |
| 3 Vehicles | 163 (18.6%) | 127 (21.3%) |
| 4 Vehicles | 324 (37.1%) | 163 (27.4%) |
| 5 or more Vehicles | 61 (7.0%) | 32 (5.4%) |
| Total | 874 (100.0%) | 596 (100.0%) |
Commute Time in Croom
The most frequently occuring commute durations in Croom are 30 to 34 minutes (383 commuters, 33.7%), 45 to 59 minutes (195 commuters, 17.2%), and 60 to 89 minutes (182 commuters, 16.0%).
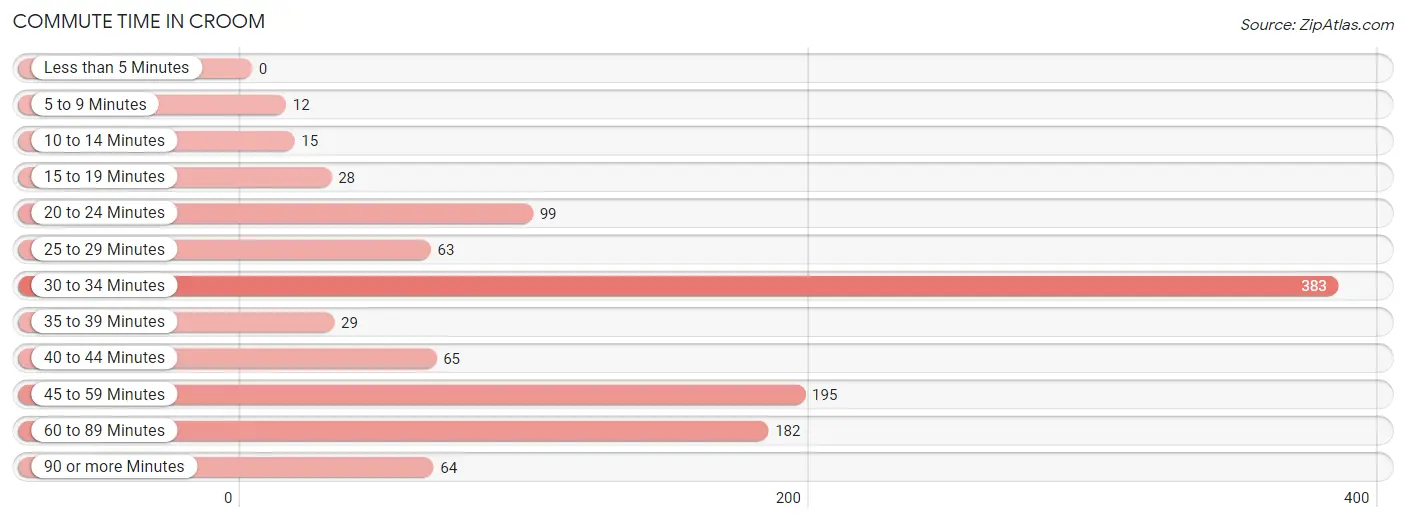
| Commute Time | # Commuters | % Commuters |
| Less than 5 Minutes | 0 | 0.0% |
| 5 to 9 Minutes | 12 | 1.1% |
| 10 to 14 Minutes | 15 | 1.3% |
| 15 to 19 Minutes | 28 | 2.5% |
| 20 to 24 Minutes | 99 | 8.7% |
| 25 to 29 Minutes | 63 | 5.6% |
| 30 to 34 Minutes | 383 | 33.7% |
| 35 to 39 Minutes | 29 | 2.6% |
| 40 to 44 Minutes | 65 | 5.7% |
| 45 to 59 Minutes | 195 | 17.2% |
| 60 to 89 Minutes | 182 | 16.0% |
| 90 or more Minutes | 64 | 5.6% |
Commute Time by Sex in Croom
The most common commute times in Croom are 30 to 34 minutes (243 commuters, 36.3%) for males and 30 to 34 minutes (140 commuters, 30.0%) for females.
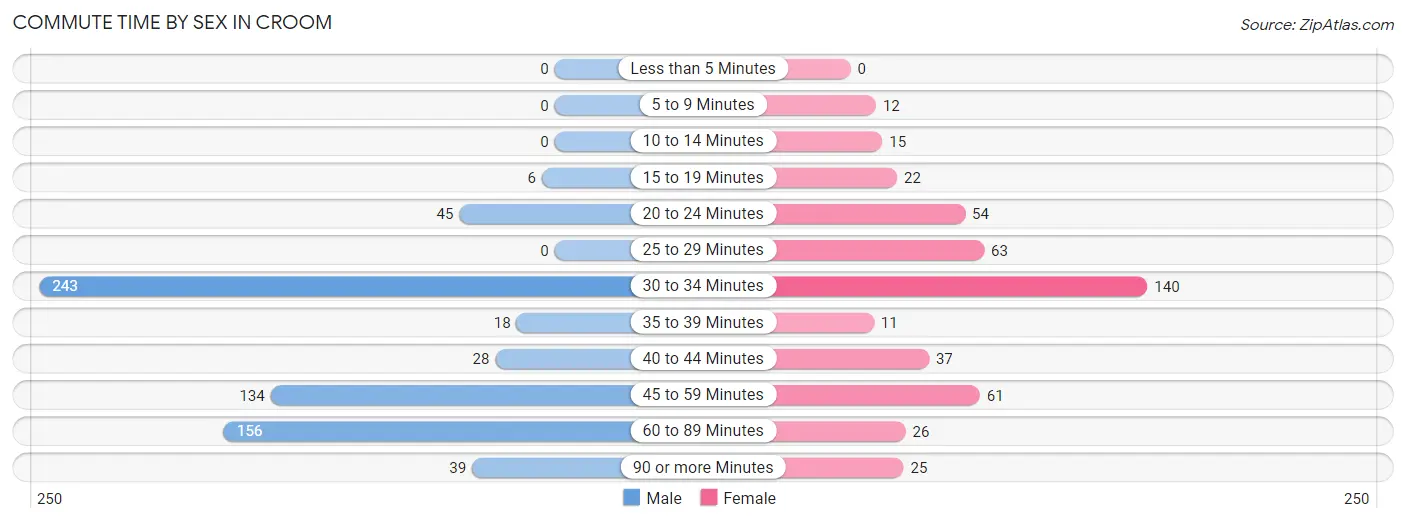
| Commute Time | Male | Female |
| Less than 5 Minutes | 0 (0.0%) | 0 (0.0%) |
| 5 to 9 Minutes | 0 (0.0%) | 12 (2.6%) |
| 10 to 14 Minutes | 0 (0.0%) | 15 (3.2%) |
| 15 to 19 Minutes | 6 (0.9%) | 22 (4.7%) |
| 20 to 24 Minutes | 45 (6.7%) | 54 (11.6%) |
| 25 to 29 Minutes | 0 (0.0%) | 63 (13.5%) |
| 30 to 34 Minutes | 243 (36.3%) | 140 (30.0%) |
| 35 to 39 Minutes | 18 (2.7%) | 11 (2.4%) |
| 40 to 44 Minutes | 28 (4.2%) | 37 (7.9%) |
| 45 to 59 Minutes | 134 (20.0%) | 61 (13.1%) |
| 60 to 89 Minutes | 156 (23.3%) | 26 (5.6%) |
| 90 or more Minutes | 39 (5.8%) | 25 (5.4%) |
Time of Departure to Work by Sex in Croom
The most frequent times of departure to work in Croom are 5:00 AM to 5:29 AM (146, 21.8%) for males and 7:00 AM to 7:29 AM (158, 33.9%) for females.
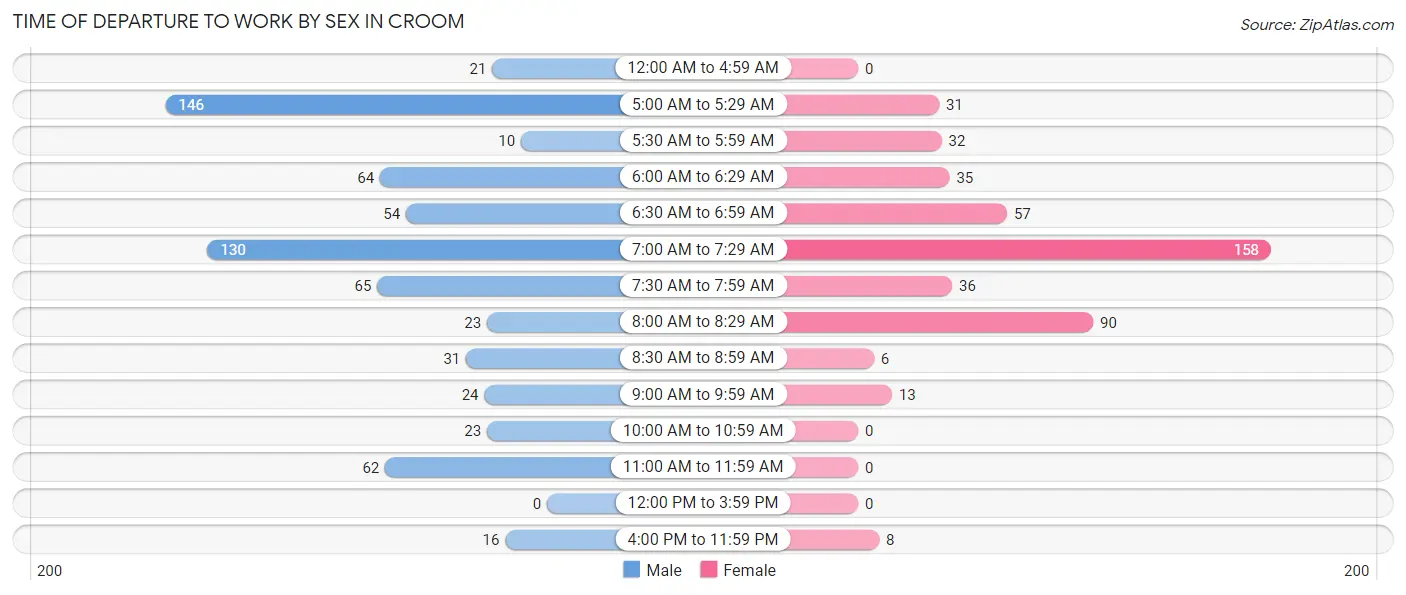
| Time of Departure | Male | Female |
| 12:00 AM to 4:59 AM | 21 (3.1%) | 0 (0.0%) |
| 5:00 AM to 5:29 AM | 146 (21.8%) | 31 (6.7%) |
| 5:30 AM to 5:59 AM | 10 (1.5%) | 32 (6.9%) |
| 6:00 AM to 6:29 AM | 64 (9.6%) | 35 (7.5%) |
| 6:30 AM to 6:59 AM | 54 (8.1%) | 57 (12.2%) |
| 7:00 AM to 7:29 AM | 130 (19.4%) | 158 (33.9%) |
| 7:30 AM to 7:59 AM | 65 (9.7%) | 36 (7.7%) |
| 8:00 AM to 8:29 AM | 23 (3.4%) | 90 (19.3%) |
| 8:30 AM to 8:59 AM | 31 (4.6%) | 6 (1.3%) |
| 9:00 AM to 9:59 AM | 24 (3.6%) | 13 (2.8%) |
| 10:00 AM to 10:59 AM | 23 (3.4%) | 0 (0.0%) |
| 11:00 AM to 11:59 AM | 62 (9.3%) | 0 (0.0%) |
| 12:00 PM to 3:59 PM | 0 (0.0%) | 0 (0.0%) |
| 4:00 PM to 11:59 PM | 16 (2.4%) | 8 (1.7%) |
| Total | 669 (100.0%) | 466 (100.0%) |
Housing Occupancy in Croom
Occupancy by Ownership in Croom
Of the total 1,035 dwellings in Croom, owner-occupied units account for 897 (86.7%), while renter-occupied units make up 138 (13.3%).
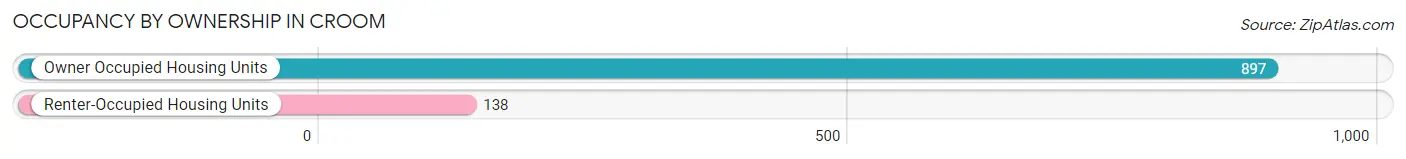
| Occupancy | # Housing Units | % Housing Units |
| Owner Occupied Housing Units | 897 | 86.7% |
| Renter-Occupied Housing Units | 138 | 13.3% |
| Total Occupied Housing Units | 1,035 | 100.0% |
Occupancy by Household Size in Croom
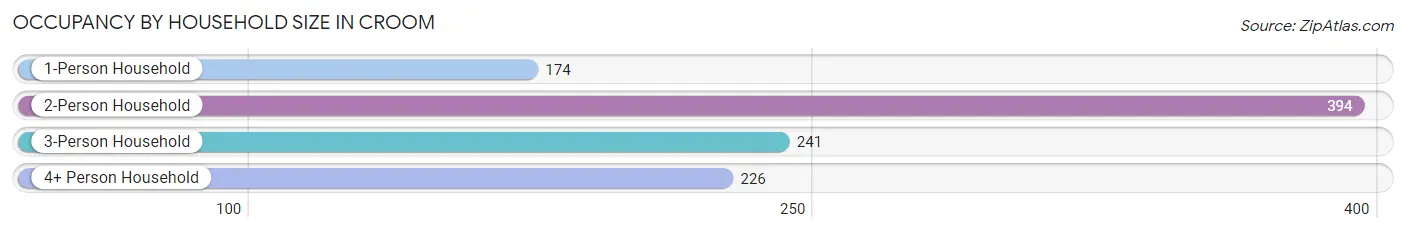
| Household Size | # Housing Units | % Housing Units |
| 1-Person Household | 174 | 16.8% |
| 2-Person Household | 394 | 38.1% |
| 3-Person Household | 241 | 23.3% |
| 4+ Person Household | 226 | 21.8% |
| Total Housing Units | 1,035 | 100.0% |
Occupancy by Ownership by Household Size in Croom
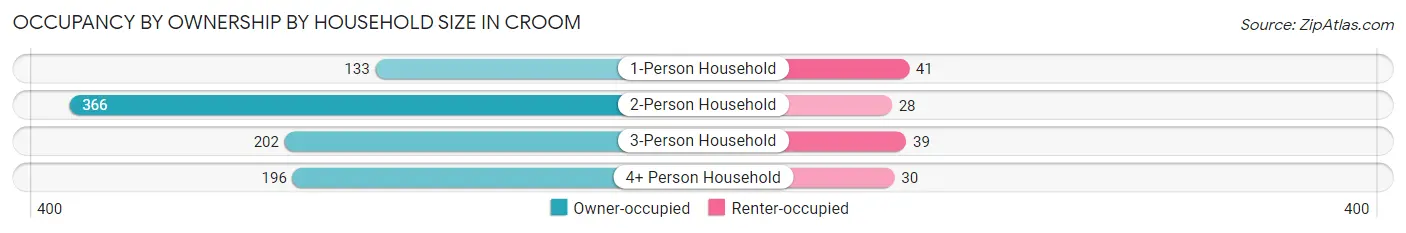
| Household Size | Owner-occupied | Renter-occupied |
| 1-Person Household | 133 (76.4%) | 41 (23.6%) |
| 2-Person Household | 366 (92.9%) | 28 (7.1%) |
| 3-Person Household | 202 (83.8%) | 39 (16.2%) |
| 4+ Person Household | 196 (86.7%) | 30 (13.3%) |
| Total Housing Units | 897 (86.7%) | 138 (13.3%) |
Occupancy by Educational Attainment in Croom
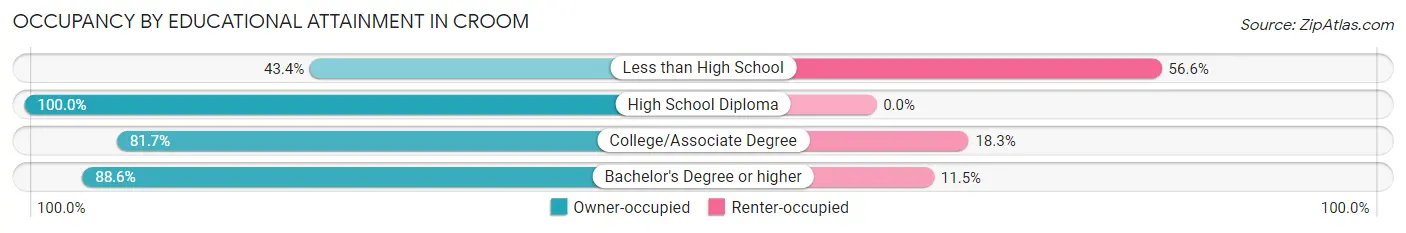
| Household Size | Owner-occupied | Renter-occupied |
| Less than High School | 23 (43.4%) | 30 (56.6%) |
| High School Diploma | 222 (100.0%) | 0 (0.0%) |
| College/Associate Degree | 250 (81.7%) | 56 (18.3%) |
| Bachelor's Degree or higher | 402 (88.5%) | 52 (11.5%) |
Occupancy by Age of Householder in Croom
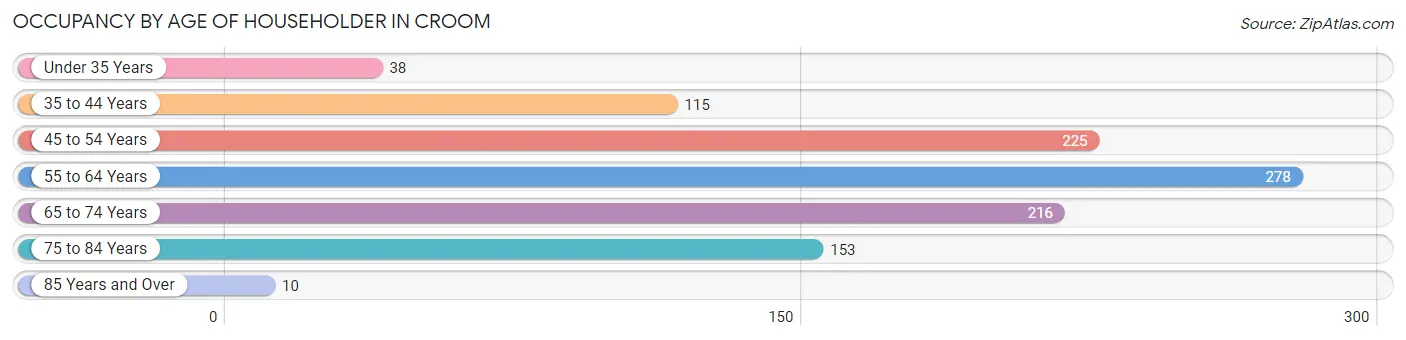
| Age Bracket | # Households | % Households |
| Under 35 Years | 38 | 3.7% |
| 35 to 44 Years | 115 | 11.1% |
| 45 to 54 Years | 225 | 21.7% |
| 55 to 64 Years | 278 | 26.9% |
| 65 to 74 Years | 216 | 20.9% |
| 75 to 84 Years | 153 | 14.8% |
| 85 Years and Over | 10 | 1.0% |
| Total | 1,035 | 100.0% |
Housing Finances in Croom
Median Income by Occupancy in Croom
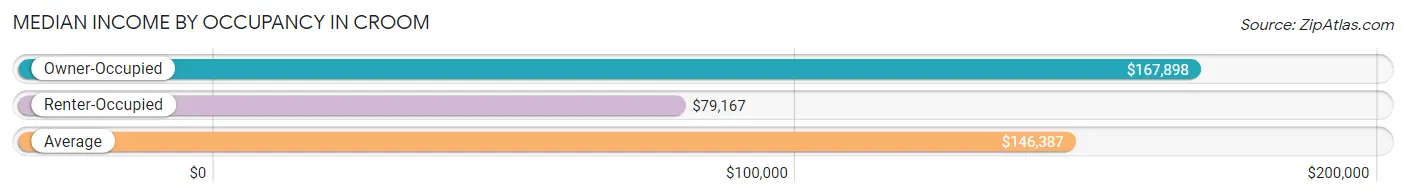
| Occupancy Type | # Households | Median Income |
| Owner-Occupied | 897 (86.7%) | $167,898 |
| Renter-Occupied | 138 (13.3%) | $79,167 |
| Average | 1,035 (100.0%) | $146,387 |
Occupancy by Householder Income Bracket in Croom
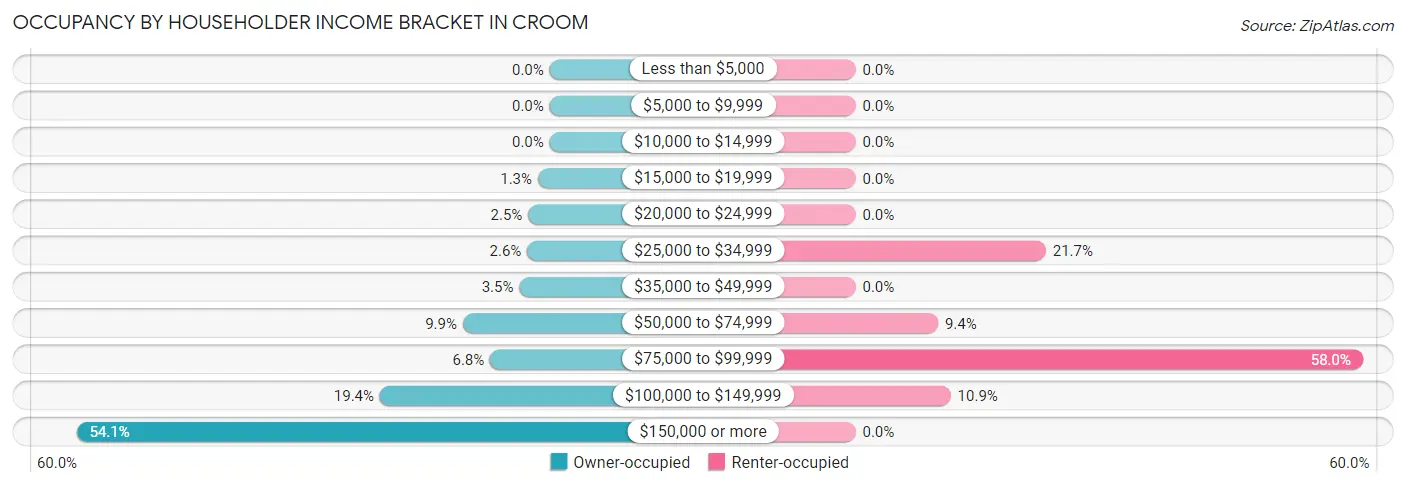
| Income Bracket | Owner-occupied | Renter-occupied |
| Less than $5,000 | 0 (0.0%) | 0 (0.0%) |
| $5,000 to $9,999 | 0 (0.0%) | 0 (0.0%) |
| $10,000 to $14,999 | 0 (0.0%) | 0 (0.0%) |
| $15,000 to $19,999 | 12 (1.3%) | 0 (0.0%) |
| $20,000 to $24,999 | 22 (2.5%) | 0 (0.0%) |
| $25,000 to $34,999 | 23 (2.6%) | 30 (21.7%) |
| $35,000 to $49,999 | 31 (3.5%) | 0 (0.0%) |
| $50,000 to $74,999 | 89 (9.9%) | 13 (9.4%) |
| $75,000 to $99,999 | 61 (6.8%) | 80 (58.0%) |
| $100,000 to $149,999 | 174 (19.4%) | 15 (10.9%) |
| $150,000 or more | 485 (54.1%) | 0 (0.0%) |
| Total | 897 (100.0%) | 138 (100.0%) |
Monthly Housing Cost Tiers in Croom
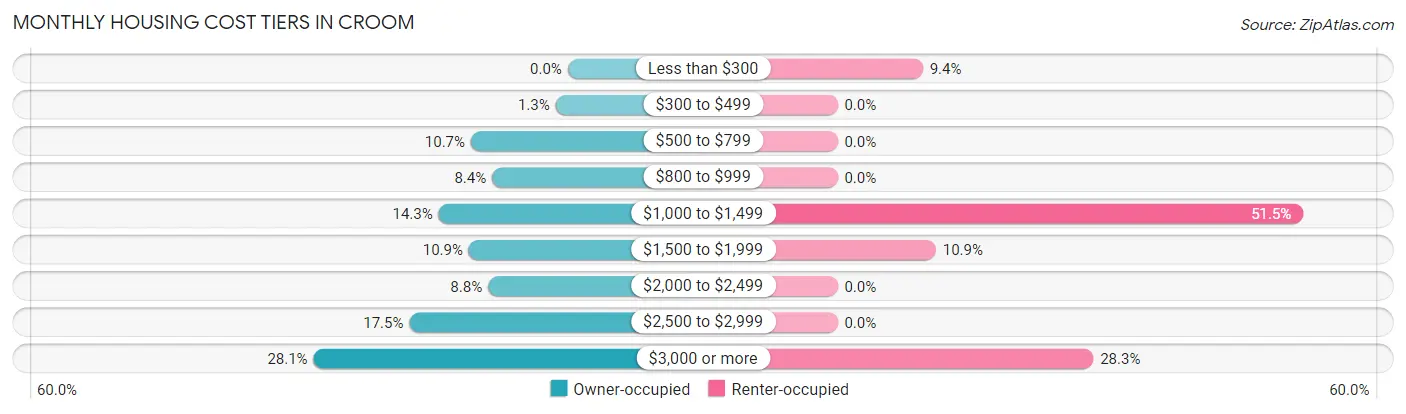
| Monthly Cost | Owner-occupied | Renter-occupied |
| Less than $300 | 0 (0.0%) | 13 (9.4%) |
| $300 to $499 | 12 (1.3%) | 0 (0.0%) |
| $500 to $799 | 96 (10.7%) | 0 (0.0%) |
| $800 to $999 | 75 (8.4%) | 0 (0.0%) |
| $1,000 to $1,499 | 128 (14.3%) | 71 (51.4%) |
| $1,500 to $1,999 | 98 (10.9%) | 15 (10.9%) |
| $2,000 to $2,499 | 79 (8.8%) | 0 (0.0%) |
| $2,500 to $2,999 | 157 (17.5%) | 0 (0.0%) |
| $3,000 or more | 252 (28.1%) | 39 (28.3%) |
| Total | 897 (100.0%) | 138 (100.0%) |
Physical Housing Characteristics in Croom
Housing Structures in Croom
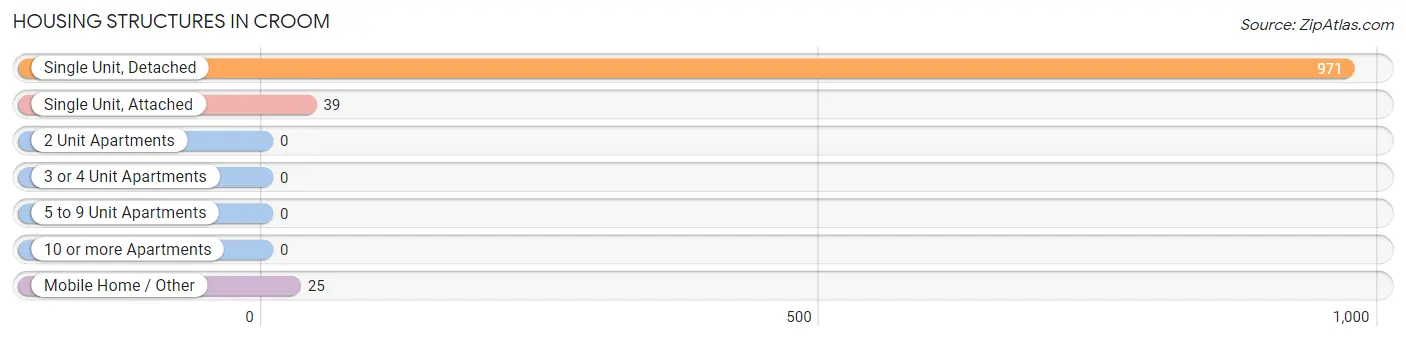
| Structure Type | # Housing Units | % Housing Units |
| Single Unit, Detached | 971 | 93.8% |
| Single Unit, Attached | 39 | 3.8% |
| 2 Unit Apartments | 0 | 0.0% |
| 3 or 4 Unit Apartments | 0 | 0.0% |
| 5 to 9 Unit Apartments | 0 | 0.0% |
| 10 or more Apartments | 0 | 0.0% |
| Mobile Home / Other | 25 | 2.4% |
| Total | 1,035 | 100.0% |
Housing Structures by Occupancy in Croom
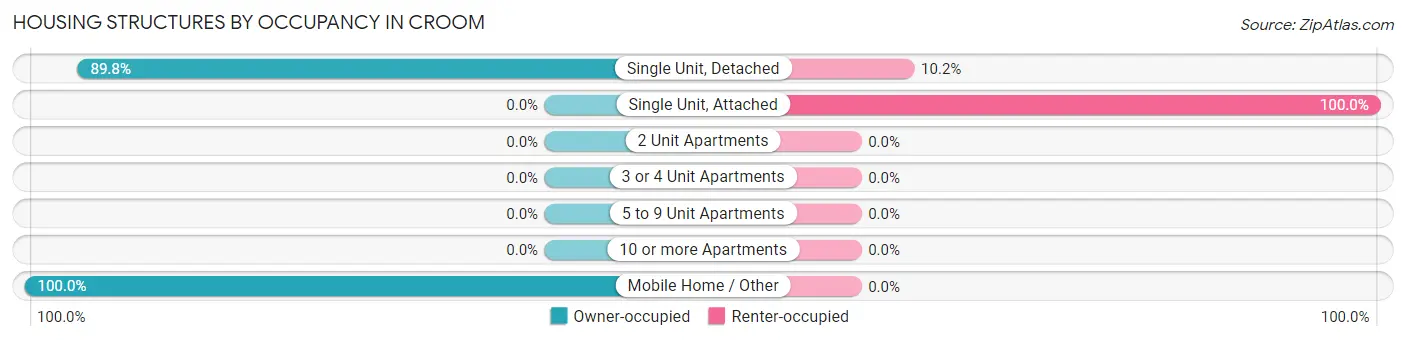
| Structure Type | Owner-occupied | Renter-occupied |
| Single Unit, Detached | 872 (89.8%) | 99 (10.2%) |
| Single Unit, Attached | 0 (0.0%) | 39 (100.0%) |
| 2 Unit Apartments | 0 (0.0%) | 0 (0.0%) |
| 3 or 4 Unit Apartments | 0 (0.0%) | 0 (0.0%) |
| 5 to 9 Unit Apartments | 0 (0.0%) | 0 (0.0%) |
| 10 or more Apartments | 0 (0.0%) | 0 (0.0%) |
| Mobile Home / Other | 25 (100.0%) | 0 (0.0%) |
| Total | 897 (86.7%) | 138 (13.3%) |
Housing Structures by Number of Rooms in Croom
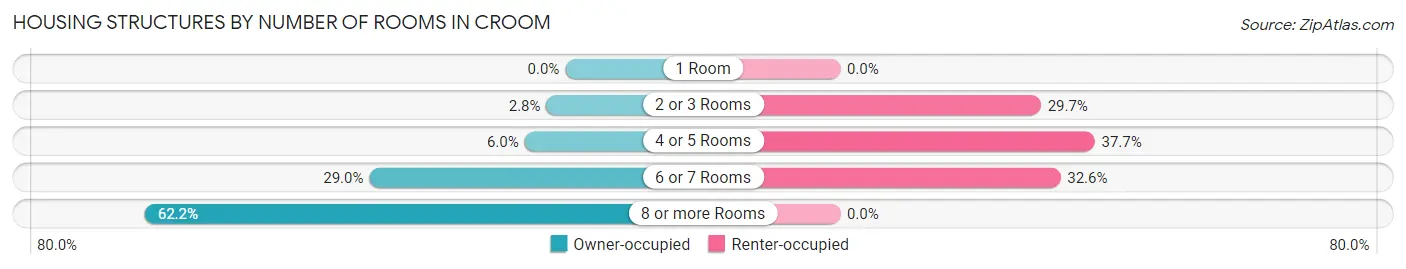
| Number of Rooms | Owner-occupied | Renter-occupied |
| 1 Room | 0 (0.0%) | 0 (0.0%) |
| 2 or 3 Rooms | 25 (2.8%) | 41 (29.7%) |
| 4 or 5 Rooms | 54 (6.0%) | 52 (37.7%) |
| 6 or 7 Rooms | 260 (29.0%) | 45 (32.6%) |
| 8 or more Rooms | 558 (62.2%) | 0 (0.0%) |
| Total | 897 (100.0%) | 138 (100.0%) |
Housing Structure by Heating Type in Croom
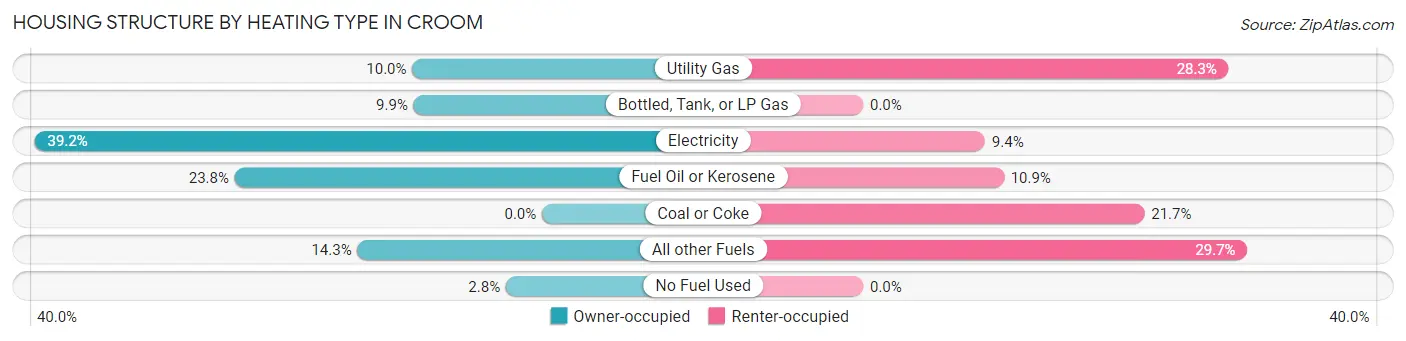
| Heating Type | Owner-occupied | Renter-occupied |
| Utility Gas | 90 (10.0%) | 39 (28.3%) |
| Bottled, Tank, or LP Gas | 89 (9.9%) | 0 (0.0%) |
| Electricity | 352 (39.2%) | 13 (9.4%) |
| Fuel Oil or Kerosene | 213 (23.7%) | 15 (10.9%) |
| Coal or Coke | 0 (0.0%) | 30 (21.7%) |
| All other Fuels | 128 (14.3%) | 41 (29.7%) |
| No Fuel Used | 25 (2.8%) | 0 (0.0%) |
| Total | 897 (100.0%) | 138 (100.0%) |
Household Vehicle Usage in Croom
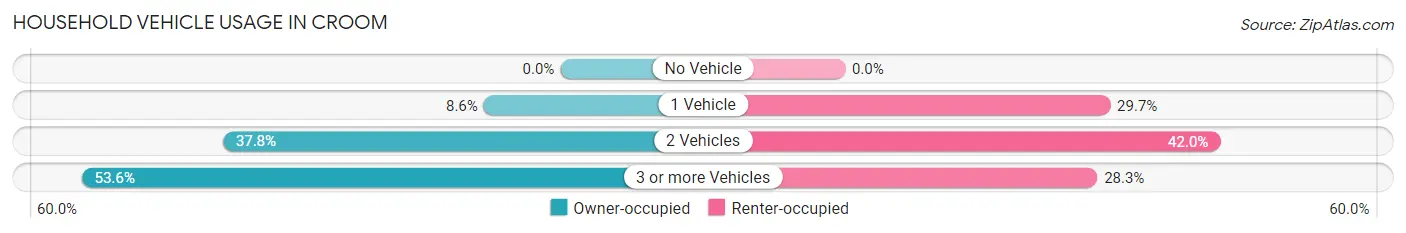
| Vehicles per Household | Owner-occupied | Renter-occupied |
| No Vehicle | 0 (0.0%) | 0 (0.0%) |
| 1 Vehicle | 77 (8.6%) | 41 (29.7%) |
| 2 Vehicles | 339 (37.8%) | 58 (42.0%) |
| 3 or more Vehicles | 481 (53.6%) | 39 (28.3%) |
| Total | 897 (100.0%) | 138 (100.0%) |
Real Estate & Mortgages in Croom
Real Estate and Mortgage Overview in Croom
| Characteristic | Without Mortgage | With Mortgage |
| Housing Units | 313 | 584 |
| Median Property Value | $486,400 | $635,700 |
| Median Household Income | $153,958 | $325 |
| Monthly Housing Costs | $890 | $252 |
| Real Estate Taxes | $5,549 | $27 |
Property Value by Mortgage Status in Croom
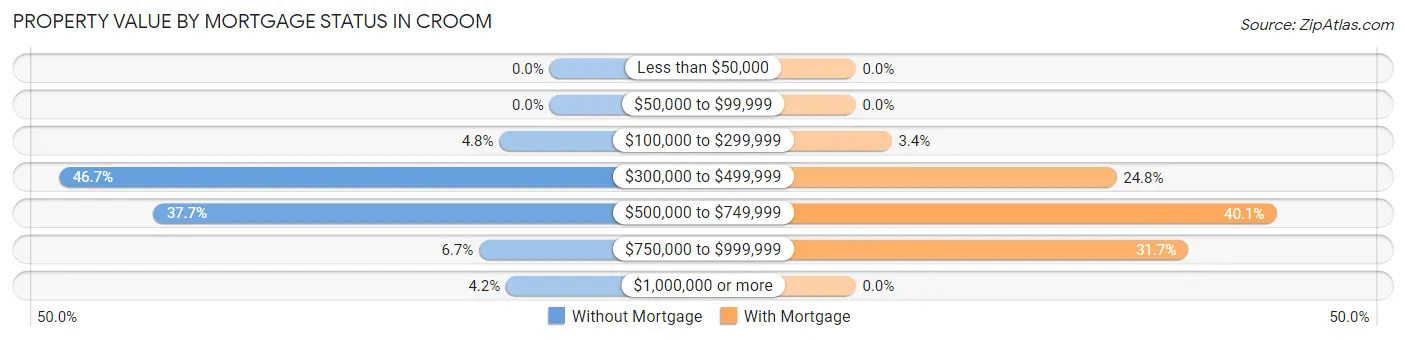
| Property Value | Without Mortgage | With Mortgage |
| Less than $50,000 | 0 (0.0%) | 0 (0.0%) |
| $50,000 to $99,999 | 0 (0.0%) | 0 (0.0%) |
| $100,000 to $299,999 | 15 (4.8%) | 20 (3.4%) |
| $300,000 to $499,999 | 146 (46.7%) | 145 (24.8%) |
| $500,000 to $749,999 | 118 (37.7%) | 234 (40.1%) |
| $750,000 to $999,999 | 21 (6.7%) | 185 (31.7%) |
| $1,000,000 or more | 13 (4.2%) | 0 (0.0%) |
| Total | 313 (100.0%) | 584 (100.0%) |
Household Income by Mortgage Status in Croom
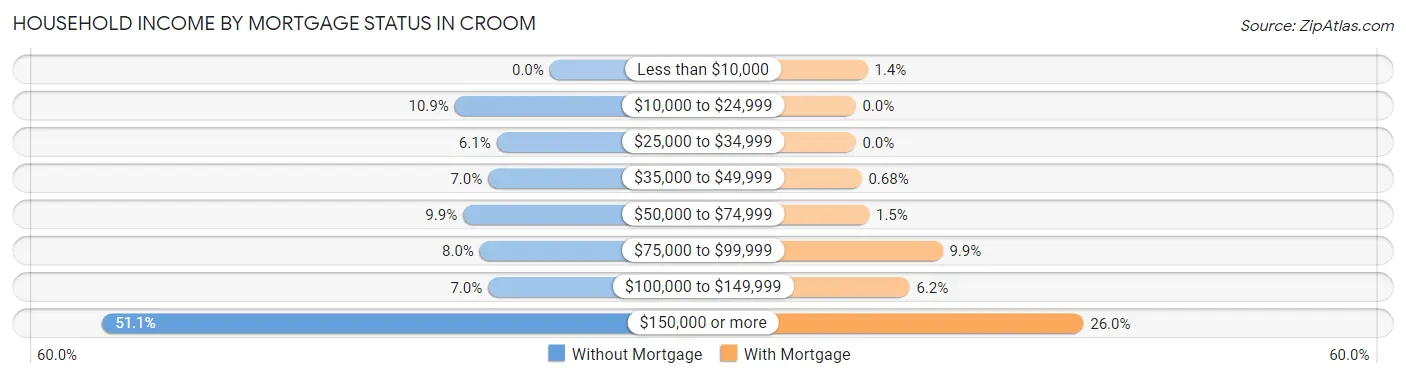
| Household Income | Without Mortgage | With Mortgage |
| Less than $10,000 | 0 (0.0%) | 8 (1.4%) |
| $10,000 to $24,999 | 34 (10.9%) | 0 (0.0%) |
| $25,000 to $34,999 | 19 (6.1%) | 0 (0.0%) |
| $35,000 to $49,999 | 22 (7.0%) | 4 (0.7%) |
| $50,000 to $74,999 | 31 (9.9%) | 9 (1.5%) |
| $75,000 to $99,999 | 25 (8.0%) | 58 (9.9%) |
| $100,000 to $149,999 | 22 (7.0%) | 36 (6.2%) |
| $150,000 or more | 160 (51.1%) | 152 (26.0%) |
| Total | 313 (100.0%) | 584 (100.0%) |
Property Value to Household Income Ratio in Croom
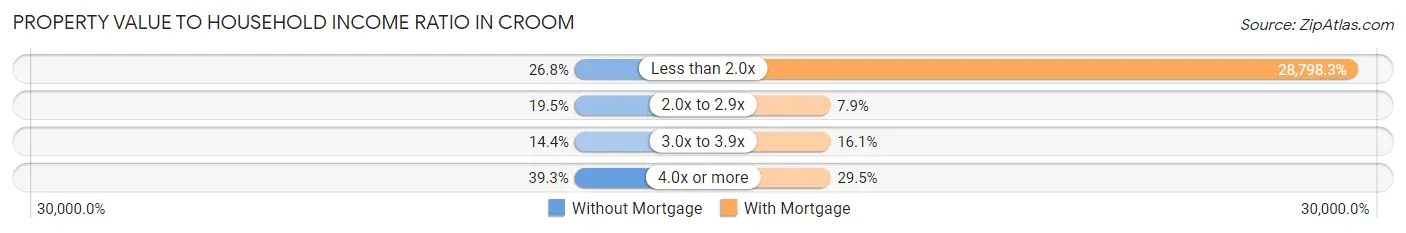
| Value-to-Income Ratio | Without Mortgage | With Mortgage |
| Less than 2.0x | 84 (26.8%) | 168,182 (28,798.3%) |
| 2.0x to 2.9x | 61 (19.5%) | 46 (7.9%) |
| 3.0x to 3.9x | 45 (14.4%) | 94 (16.1%) |
| 4.0x or more | 123 (39.3%) | 172 (29.4%) |
| Total | 313 (100.0%) | 584 (100.0%) |
Real Estate Taxes by Mortgage Status in Croom
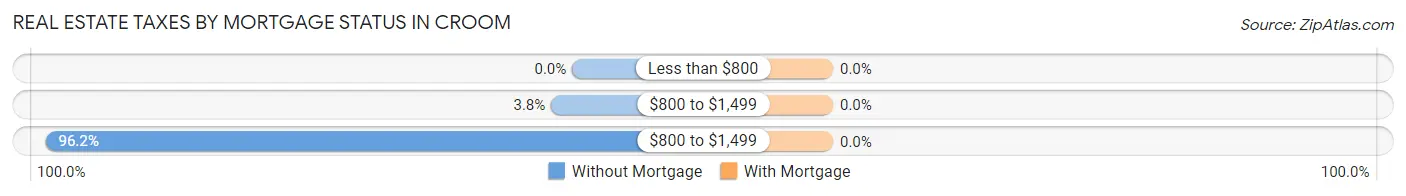
| Property Taxes | Without Mortgage | With Mortgage |
| Less than $800 | 0 (0.0%) | 0 (0.0%) |
| $800 to $1,499 | 12 (3.8%) | 0 (0.0%) |
| $800 to $1,499 | 301 (96.2%) | 0 (0.0%) |
| Total | 313 (100.0%) | 584 (100.0%) |
Health & Disability in Croom
Health Insurance Coverage by Age in Croom
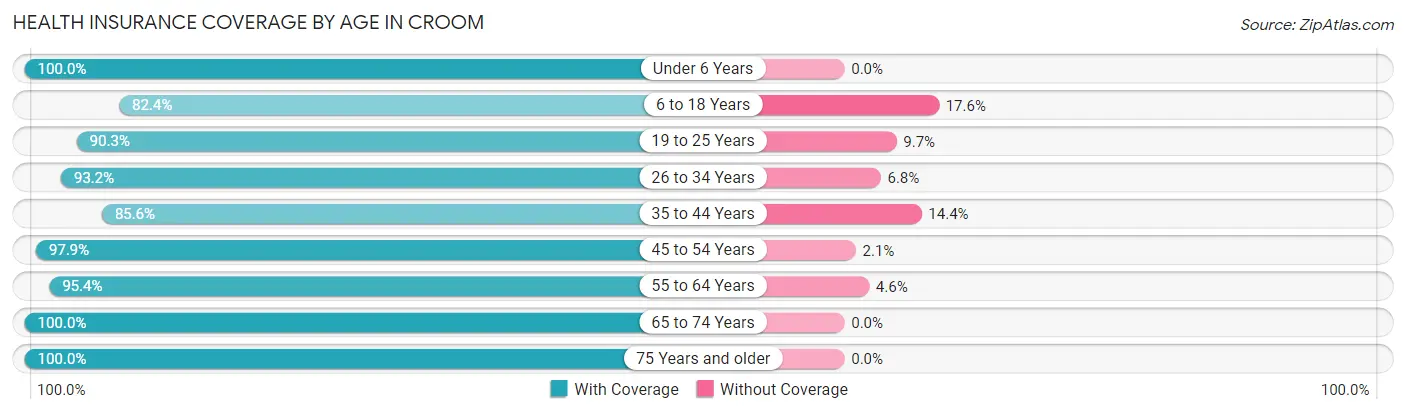
| Age Bracket | With Coverage | Without Coverage |
| Under 6 Years | 89 (100.0%) | 0 (0.0%) |
| 6 to 18 Years | 262 (82.4%) | 56 (17.6%) |
| 19 to 25 Years | 326 (90.3%) | 35 (9.7%) |
| 26 to 34 Years | 138 (93.2%) | 10 (6.8%) |
| 35 to 44 Years | 262 (85.6%) | 44 (14.4%) |
| 45 to 54 Years | 417 (97.9%) | 9 (2.1%) |
| 55 to 64 Years | 520 (95.4%) | 25 (4.6%) |
| 65 to 74 Years | 318 (100.0%) | 0 (0.0%) |
| 75 Years and older | 269 (100.0%) | 0 (0.0%) |
| Total | 2,601 (93.6%) | 179 (6.4%) |
Health Insurance Coverage by Citizenship Status in Croom
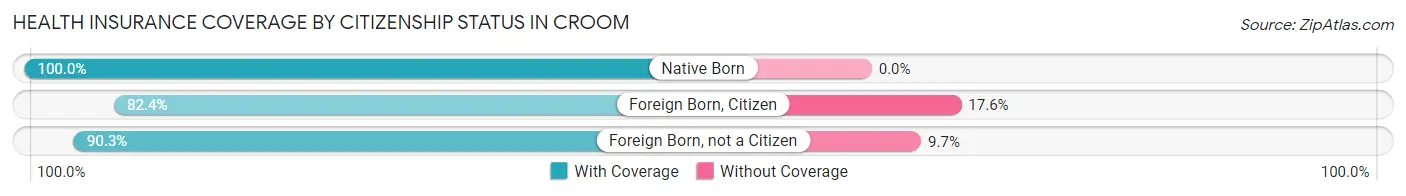
| Citizenship Status | With Coverage | Without Coverage |
| Native Born | 89 (100.0%) | 0 (0.0%) |
| Foreign Born, Citizen | 262 (82.4%) | 56 (17.6%) |
| Foreign Born, not a Citizen | 326 (90.3%) | 35 (9.7%) |
Health Insurance Coverage by Household Income in Croom
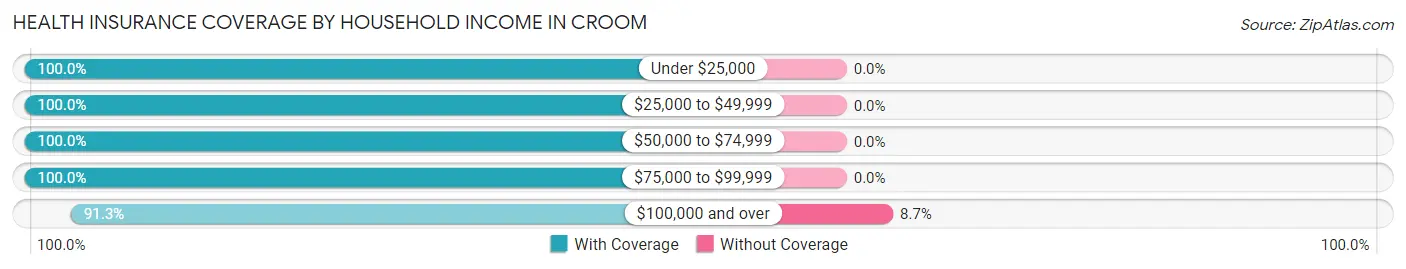
| Household Income | With Coverage | Without Coverage |
| Under $25,000 | 44 (100.0%) | 0 (0.0%) |
| $25,000 to $49,999 | 265 (100.0%) | 0 (0.0%) |
| $50,000 to $74,999 | 169 (100.0%) | 0 (0.0%) |
| $75,000 to $99,999 | 246 (100.0%) | 0 (0.0%) |
| $100,000 and over | 1,873 (91.3%) | 178 (8.7%) |
Public vs Private Health Insurance Coverage by Age in Croom
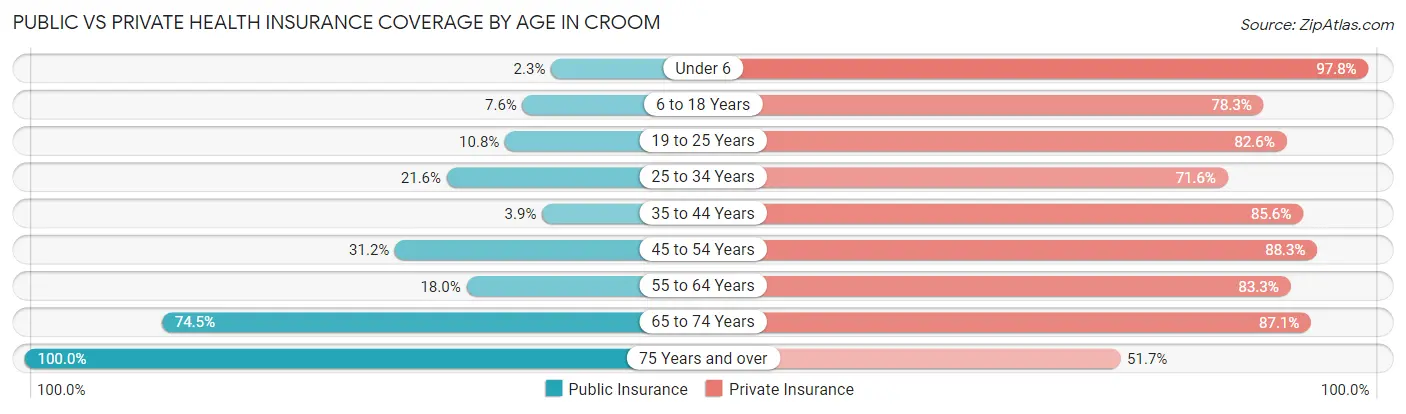
| Age Bracket | Public Insurance | Private Insurance |
| Under 6 | 2 (2.2%) | 87 (97.8%) |
| 6 to 18 Years | 24 (7.5%) | 249 (78.3%) |
| 19 to 25 Years | 39 (10.8%) | 298 (82.6%) |
| 25 to 34 Years | 32 (21.6%) | 106 (71.6%) |
| 35 to 44 Years | 12 (3.9%) | 262 (85.6%) |
| 45 to 54 Years | 133 (31.2%) | 376 (88.3%) |
| 55 to 64 Years | 98 (18.0%) | 454 (83.3%) |
| 65 to 74 Years | 237 (74.5%) | 277 (87.1%) |
| 75 Years and over | 269 (100.0%) | 139 (51.7%) |
| Total | 846 (30.4%) | 2,248 (80.9%) |
Disability Status by Sex by Age in Croom
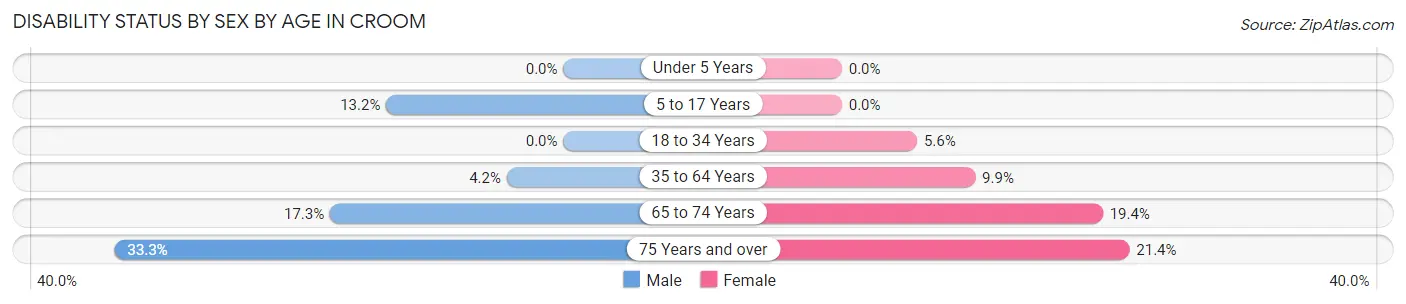
| Age Bracket | Male | Female |
| Under 5 Years | 0 (0.0%) | 0 (0.0%) |
| 5 to 17 Years | 28 (13.2%) | 0 (0.0%) |
| 18 to 34 Years | 0 (0.0%) | 13 (5.6%) |
| 35 to 64 Years | 29 (4.2%) | 58 (9.9%) |
| 65 to 74 Years | 22 (17.3%) | 37 (19.4%) |
| 75 Years and over | 60 (33.3%) | 19 (21.3%) |
Disability Class by Sex by Age in Croom
Disability Class: Hearing Difficulty
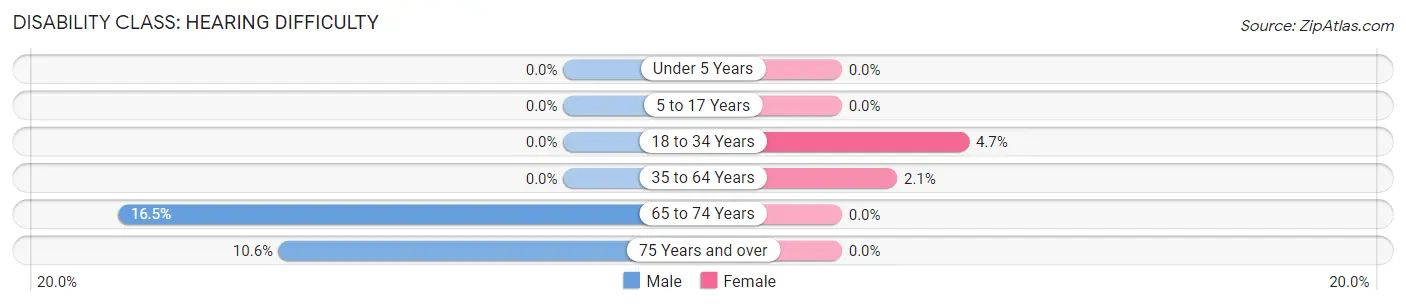
| Age Bracket | Male | Female |
| Under 5 Years | 0 (0.0%) | 0 (0.0%) |
| 5 to 17 Years | 0 (0.0%) | 0 (0.0%) |
| 18 to 34 Years | 0 (0.0%) | 11 (4.7%) |
| 35 to 64 Years | 0 (0.0%) | 12 (2.1%) |
| 65 to 74 Years | 21 (16.5%) | 0 (0.0%) |
| 75 Years and over | 19 (10.6%) | 0 (0.0%) |
Disability Class: Vision Difficulty
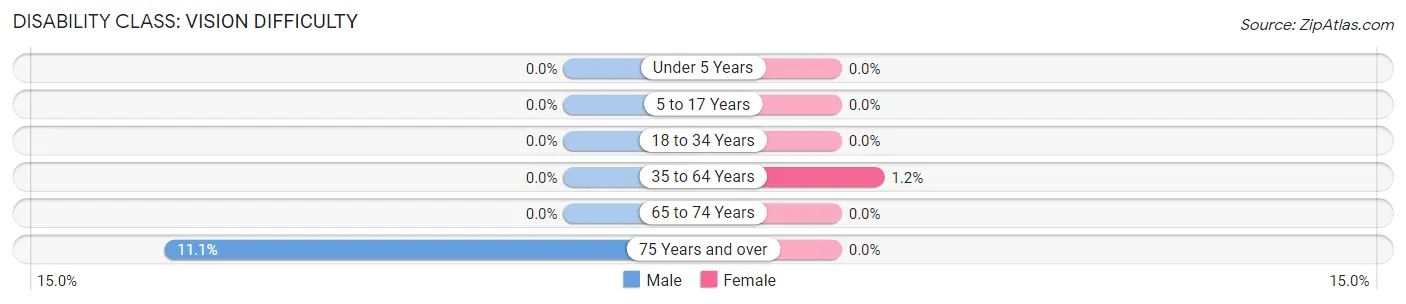
| Age Bracket | Male | Female |
| Under 5 Years | 0 (0.0%) | 0 (0.0%) |
| 5 to 17 Years | 0 (0.0%) | 0 (0.0%) |
| 18 to 34 Years | 0 (0.0%) | 0 (0.0%) |
| 35 to 64 Years | 0 (0.0%) | 7 (1.2%) |
| 65 to 74 Years | 0 (0.0%) | 0 (0.0%) |
| 75 Years and over | 20 (11.1%) | 0 (0.0%) |
Disability Class: Cognitive Difficulty
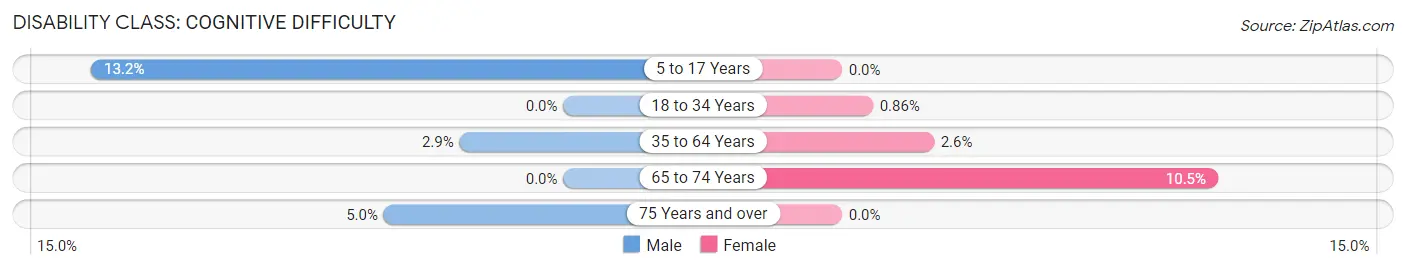
| Age Bracket | Male | Female |
| 5 to 17 Years | 28 (13.2%) | 0 (0.0%) |
| 18 to 34 Years | 0 (0.0%) | 2 (0.9%) |
| 35 to 64 Years | 20 (2.9%) | 15 (2.6%) |
| 65 to 74 Years | 0 (0.0%) | 20 (10.5%) |
| 75 Years and over | 9 (5.0%) | 0 (0.0%) |
Disability Class: Ambulatory Difficulty
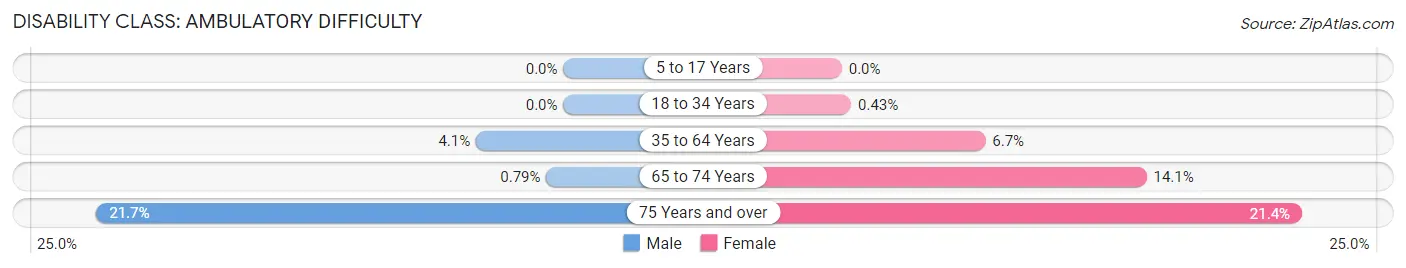
| Age Bracket | Male | Female |
| 5 to 17 Years | 0 (0.0%) | 0 (0.0%) |
| 18 to 34 Years | 0 (0.0%) | 1 (0.4%) |
| 35 to 64 Years | 28 (4.1%) | 39 (6.7%) |
| 65 to 74 Years | 1 (0.8%) | 27 (14.1%) |
| 75 Years and over | 39 (21.7%) | 19 (21.3%) |
Disability Class: Self-Care Difficulty
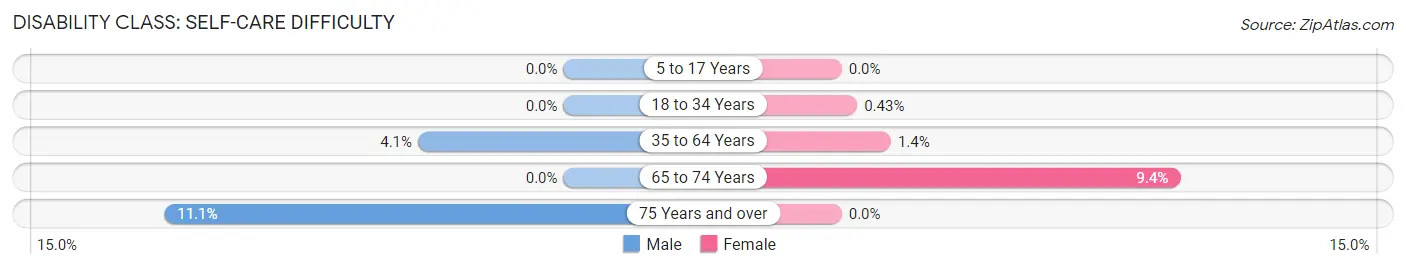
| Age Bracket | Male | Female |
| 5 to 17 Years | 0 (0.0%) | 0 (0.0%) |
| 18 to 34 Years | 0 (0.0%) | 1 (0.4%) |
| 35 to 64 Years | 28 (4.1%) | 8 (1.4%) |
| 65 to 74 Years | 0 (0.0%) | 18 (9.4%) |
| 75 Years and over | 20 (11.1%) | 0 (0.0%) |
Technology Access in Croom
Computing Device Access in Croom
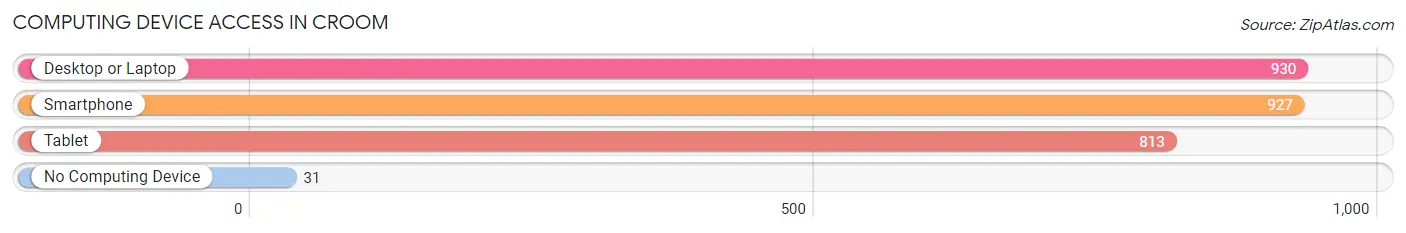
| Device Type | # Households | % Households |
| Desktop or Laptop | 930 | 89.9% |
| Smartphone | 927 | 89.6% |
| Tablet | 813 | 78.5% |
| No Computing Device | 31 | 3.0% |
| Total | 1,035 | 100.0% |
Internet Access in Croom
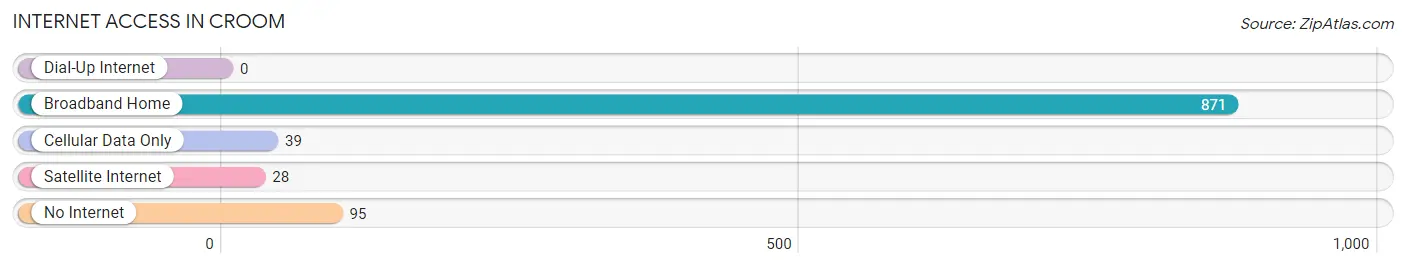
| Internet Type | # Households | % Households |
| Dial-Up Internet | 0 | 0.0% |
| Broadband Home | 871 | 84.2% |
| Cellular Data Only | 39 | 3.8% |
| Satellite Internet | 28 | 2.7% |
| No Internet | 95 | 9.2% |
| Total | 1,035 | 100.0% |
Croom Summary
Croom, Maryland is a small town located in Prince George’s County, Maryland. It is situated on the Patuxent River, about 25 miles south of Washington, D.C. The town has a population of about 1,000 people and is part of the larger Washington metropolitan area.
Geography
Croom is located in the Piedmont region of Maryland, which is characterized by rolling hills and valleys. The town is situated on the Patuxent River, which is a major tributary of the Chesapeake Bay. The town is bordered by the towns of Brandywine and Aquasco to the north, and by the towns of Upper Marlboro and Cheltenham to the south. The town is also close to the Patuxent Wildlife Research Center, which is a major research facility for the U.S. Fish and Wildlife Service.
History
Croom was first settled in the early 1700s by English settlers. The town was originally known as “Croom’s Landing” and was a major port for the shipping of tobacco and other goods. In the late 1700s, the town was renamed “Croom” after the Croom family, who were prominent landowners in the area.
In the early 1800s, Croom was a major stop on the Underground Railroad, which was a network of secret routes and safe houses used by African-Americans escaping slavery. The town was also home to a large African-American population, which was largely employed in the tobacco industry.
In the late 1800s, Croom became a popular destination for wealthy Washingtonians looking to escape the city. The town was home to several large estates, including the Croom Mansion, which was built in 1875 and is now a historic landmark.
Economy
Croom’s economy is largely based on agriculture and tourism. The town is home to several farms, which produce a variety of crops, including corn, soybeans, and wheat. The town is also home to several wineries, which produce a variety of wines.
Tourism is also an important part of the local economy. The town is home to several historic sites, including the Croom Mansion, which is a popular destination for visitors. The town is also home to several parks, including the Patuxent River State Park, which offers a variety of outdoor activities.
Demographics
As of the 2010 census, Croom had a population of 1,000 people. The town is predominantly white, with about 75% of the population identifying as white. The town is also home to a small African-American population, which makes up about 15% of the population. The town is also home to a small Hispanic population, which makes up about 5% of the population.
Croom is a small town with a rich history and a vibrant economy. The town is home to several historic sites, farms, wineries, and parks, which make it a popular destination for visitors. The town is also home to a diverse population, which makes it a great place to live and work.
Common Questions
What is Per Capita Income in Croom?
Per Capita income in Croom is $59,876.
What is the Median Family Income in Croom?
Median Family Income in Croom is $164,875.
What is the Median Household income in Croom?
Median Household Income in Croom is $146,387.
What is Income or Wage Gap in Croom?
Income or Wage Gap in Croom is 7.1%.
Women in Croom earn 92.9 cents for every dollar earned by a man.
What is Inequality or Gini Index in Croom?
Inequality or Gini Index in Croom is 0.35.
What is the Total Population of Croom?
Total Population of Croom is 2,842.
What is the Total Male Population of Croom?
Total Male Population of Croom is 1,598.
What is the Total Female Population of Croom?
Total Female Population of Croom is 1,244.
What is the Ratio of Males per 100 Females in Croom?
There are 128.46 Males per 100 Females in Croom.
What is the Ratio of Females per 100 Males in Croom?
There are 77.85 Females per 100 Males in Croom.
What is the Median Population Age in Croom?
Median Population Age in Croom is 48.1 Years.
What is the Average Family Size in Croom
Average Family Size in Croom is 3.1 People.
What is the Average Household Size in Croom
Average Household Size in Croom is 2.7 People.
How Large is the Labor Force in Croom?
There are 1,627 People in the Labor Forcein in Croom.
What is the Percentage of People in the Labor Force in Croom?
66.1% of People are in the Labor Force in Croom.
What is the Unemployment Rate in Croom?
Unemployment Rate in Croom is 7.8%.