Sheldon, IA Map & Demographics
Sheldon Map
Sheldon Overview
$29,944
PER CAPITA INCOME
$95,438
AVG FAMILY INCOME
$61,939
AVG HOUSEHOLD INCOME
46.2%
WAGE / INCOME GAP [ % ]
53.8¢/ $1
WAGE / INCOME GAP [ $ ]
0.35
INEQUALITY / GINI INDEX
5,417
TOTAL POPULATION
2,739
MALE POPULATION
2,678
FEMALE POPULATION
102.28
MALES / 100 FEMALES
97.77
FEMALES / 100 MALES
37.5
MEDIAN AGE
3.0
AVG FAMILY SIZE
2.5
AVG HOUSEHOLD SIZE
2,872
LABOR FORCE [ PEOPLE ]
67.0%
PERCENT IN LABOR FORCE
1.5%
UNEMPLOYMENT RATE
Sheldon Zip Codes
Sheldon Area Codes
Income in Sheldon
Income Overview in Sheldon
Per Capita Income in Sheldon is $29,944, while median incomes of families and households are $95,438 and $61,939 respectively.
| Characteristic | Number | Measure |
| Per Capita Income | 5,417 | $29,944 |
| Median Family Income | 1,273 | $95,438 |
| Mean Family Income | 1,273 | $92,439 |
| Median Household Income | 2,051 | $61,939 |
| Mean Household Income | 2,051 | $74,468 |
| Income Deficit | 1,273 | $0 |
| Wage / Income Gap (%) | 5,417 | 46.18% |
| Wage / Income Gap ($) | 5,417 | 53.82¢ per $1 |
| Gini / Inequality Index | 5,417 | 0.35 |
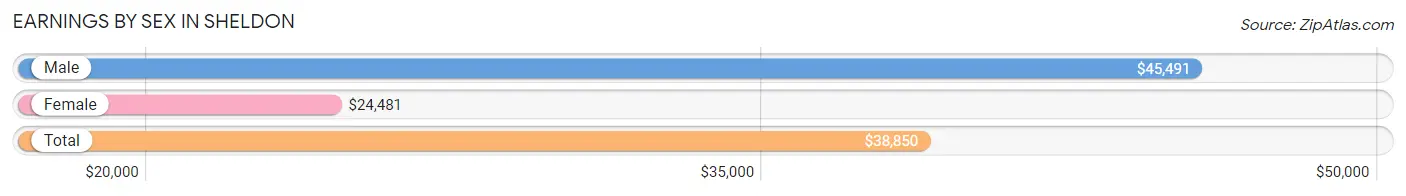
Earnings by Sex in Sheldon
Average Earnings in Sheldon are $38,850, $45,491 for men and $24,481 for women, a difference of 46.2%.
| Sex | Number | Average Earnings |
| Male | 1,863 (59.5%) | $45,491 |
| Female | 1,268 (40.5%) | $24,481 |
| Total | 3,131 (100.0%) | $38,850 |
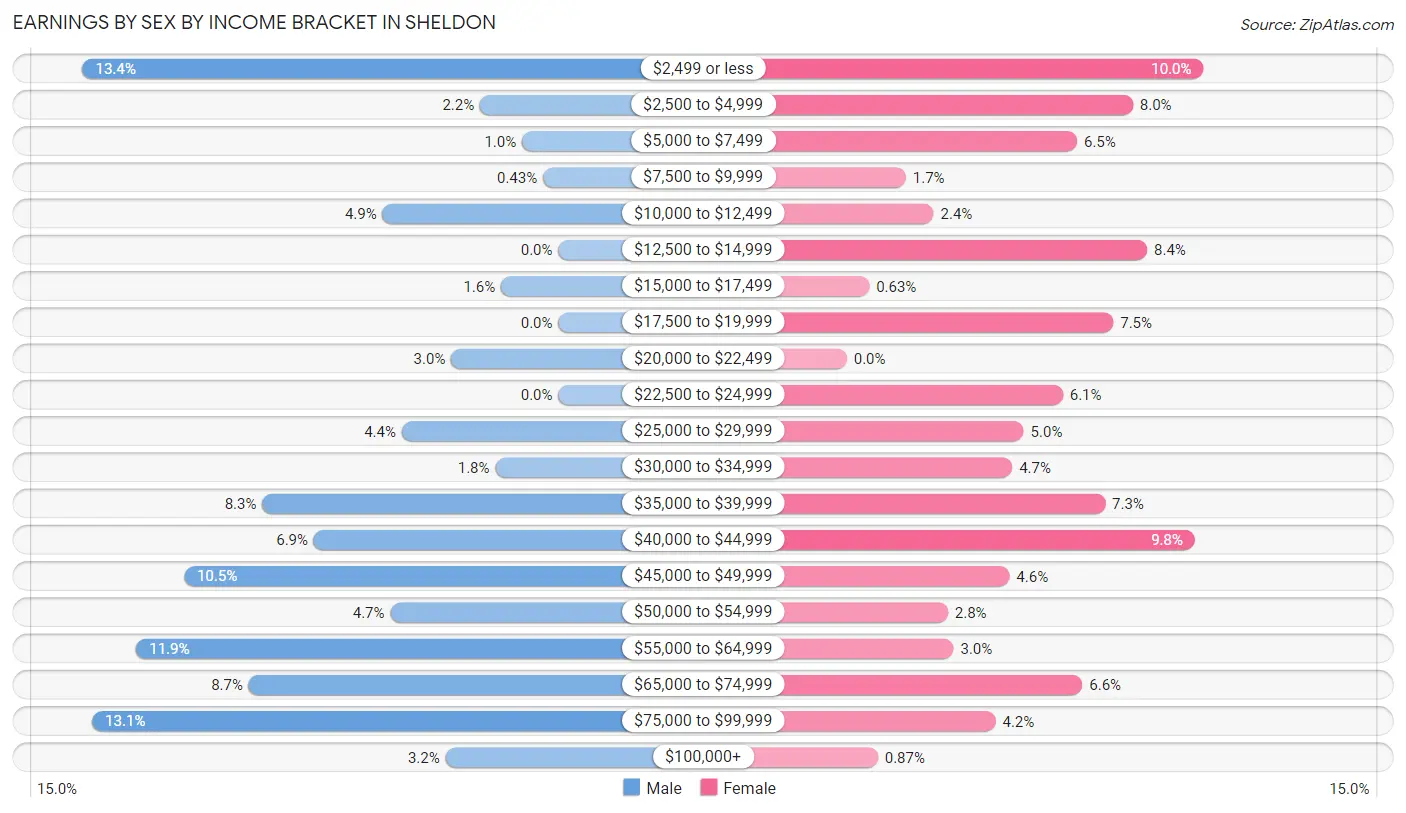
Earnings by Sex by Income Bracket in Sheldon
The most common earnings brackets in Sheldon are $2,499 or less for men (249 | 13.4%) and $2,499 or less for women (127 | 10.0%).
| Income | Male | Female |
| $2,499 or less | 249 (13.4%) | 127 (10.0%) |
| $2,500 to $4,999 | 41 (2.2%) | 102 (8.0%) |
| $5,000 to $7,499 | 19 (1.0%) | 82 (6.5%) |
| $7,500 to $9,999 | 8 (0.4%) | 21 (1.7%) |
| $10,000 to $12,499 | 92 (4.9%) | 31 (2.4%) |
| $12,500 to $14,999 | 0 (0.0%) | 107 (8.4%) |
| $15,000 to $17,499 | 30 (1.6%) | 8 (0.6%) |
| $17,500 to $19,999 | 0 (0.0%) | 95 (7.5%) |
| $20,000 to $22,499 | 56 (3.0%) | 0 (0.0%) |
| $22,500 to $24,999 | 0 (0.0%) | 77 (6.1%) |
| $25,000 to $29,999 | 82 (4.4%) | 63 (5.0%) |
| $30,000 to $34,999 | 33 (1.8%) | 59 (4.6%) |
| $35,000 to $39,999 | 155 (8.3%) | 92 (7.3%) |
| $40,000 to $44,999 | 128 (6.9%) | 124 (9.8%) |
| $45,000 to $49,999 | 196 (10.5%) | 58 (4.6%) |
| $50,000 to $54,999 | 88 (4.7%) | 36 (2.8%) |
| $55,000 to $64,999 | 221 (11.9%) | 38 (3.0%) |
| $65,000 to $74,999 | 162 (8.7%) | 84 (6.6%) |
| $75,000 to $99,999 | 244 (13.1%) | 53 (4.2%) |
| $100,000+ | 59 (3.2%) | 11 (0.9%) |
| Total | 1,863 (100.0%) | 1,268 (100.0%) |
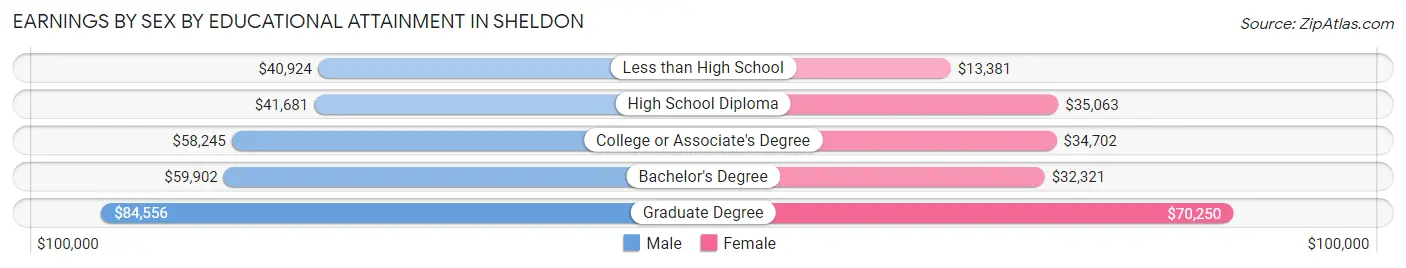
Earnings by Sex by Educational Attainment in Sheldon
Average earnings in Sheldon are $47,360 for men and $31,480 for women, a difference of 33.5%. Men with an educational attainment of graduate degree enjoy the highest average annual earnings of $84,556, while those with less than high school education earn the least with $40,924. Women with an educational attainment of graduate degree earn the most with the average annual earnings of $70,250, while those with less than high school education have the smallest earnings of $13,381.
| Educational Attainment | Male Income | Female Income |
| Less than High School | $40,924 | $13,381 |
| High School Diploma | $41,681 | $35,063 |
| College or Associate's Degree | $58,245 | $34,702 |
| Bachelor's Degree | $59,902 | $32,321 |
| Graduate Degree | $84,556 | $70,250 |
| Total | $47,360 | $31,480 |
Family Income in Sheldon
Family Income Brackets in Sheldon
According to the Sheldon family income data, there are 421 families falling into the $100,000 to $149,999 income range, which is the most common income bracket and makes up 33.1% of all families. Conversely, the less than $10,000 income bracket is the least frequent group with only 22 families (1.7%) belonging to this category.
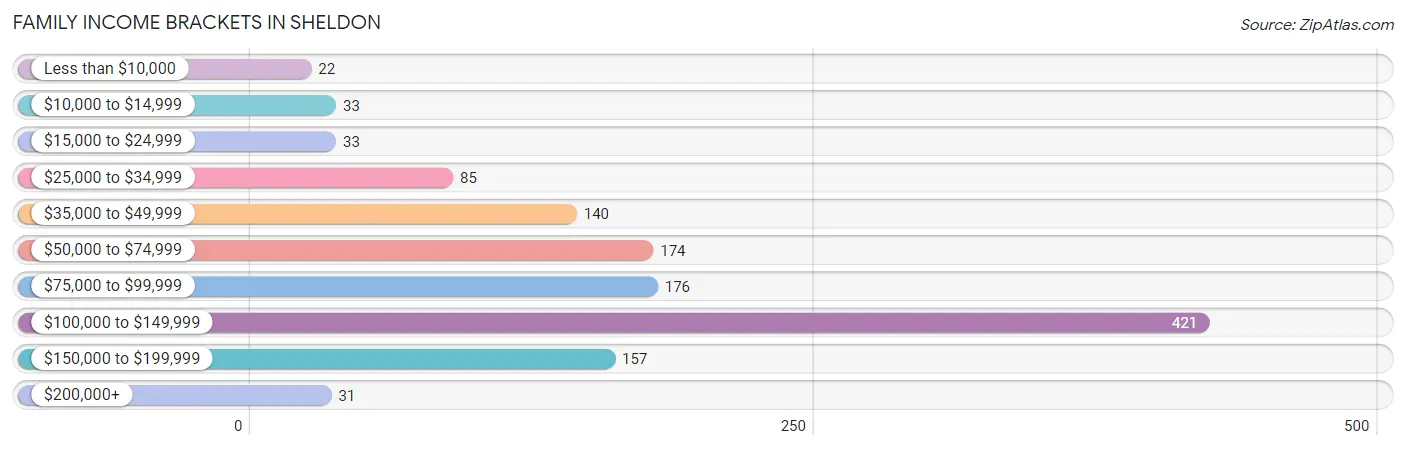
| Income Bracket | # Families | % Families |
| Less than $10,000 | 22 | 1.7% |
| $10,000 to $14,999 | 33 | 2.6% |
| $15,000 to $24,999 | 33 | 2.6% |
| $25,000 to $34,999 | 85 | 6.7% |
| $35,000 to $49,999 | 140 | 11.0% |
| $50,000 to $74,999 | 174 | 13.7% |
| $75,000 to $99,999 | 176 | 13.8% |
| $100,000 to $149,999 | 421 | 33.1% |
| $150,000 to $199,999 | 157 | 12.3% |
| $200,000+ | 31 | 2.4% |
Family Income by Famaliy Size in Sheldon
2-person families (627 | 49.2%) account for the highest median family income in Sheldon with $96,813 per family, while 2-person families (627 | 49.2%) have the highest median income of $48,406 per family member.
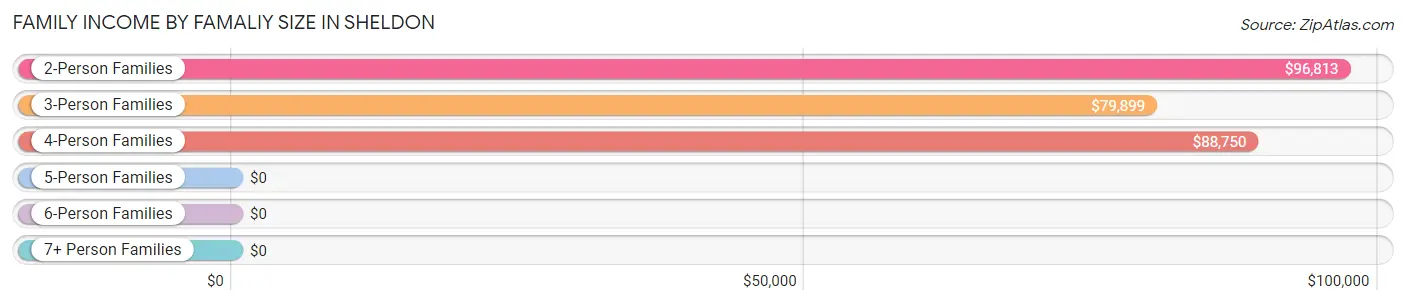
| Income Bracket | # Families | Median Income |
| 2-Person Families | 627 (49.2%) | $96,813 |
| 3-Person Families | 226 (17.7%) | $79,899 |
| 4-Person Families | 304 (23.9%) | $88,750 |
| 5-Person Families | 66 (5.2%) | $0 |
| 6-Person Families | 37 (2.9%) | $0 |
| 7+ Person Families | 13 (1.0%) | $0 |
| Total | 1,273 (100.0%) | $95,438 |
Family Income by Number of Earners in Sheldon
The median family income in Sheldon is $95,438, with families comprising 2 earners (665) having the highest median family income of $115,280, while families with 1 earner (311) have the lowest median family income of $47,083, accounting for 52.2% and 24.4% of families, respectively.
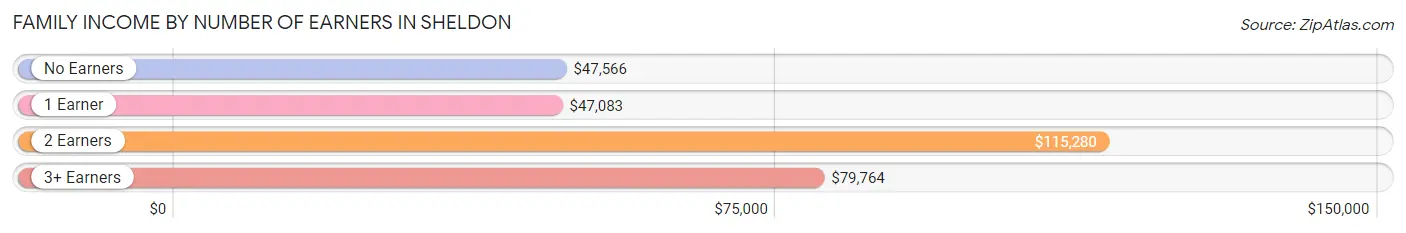
| Number of Earners | # Families | Median Income |
| No Earners | 135 (10.6%) | $47,566 |
| 1 Earner | 311 (24.4%) | $47,083 |
| 2 Earners | 665 (52.2%) | $115,280 |
| 3+ Earners | 162 (12.7%) | $79,764 |
| Total | 1,273 (100.0%) | $95,438 |
Household Income in Sheldon
Household Income Brackets in Sheldon
With 420 households falling in the category, the $100,000 to $149,999 income range is the most frequent in Sheldon, accounting for 20.5% of all households. In contrast, only 31 households (1.5%) fall into the $200,000+ income bracket, making it the least populous group.
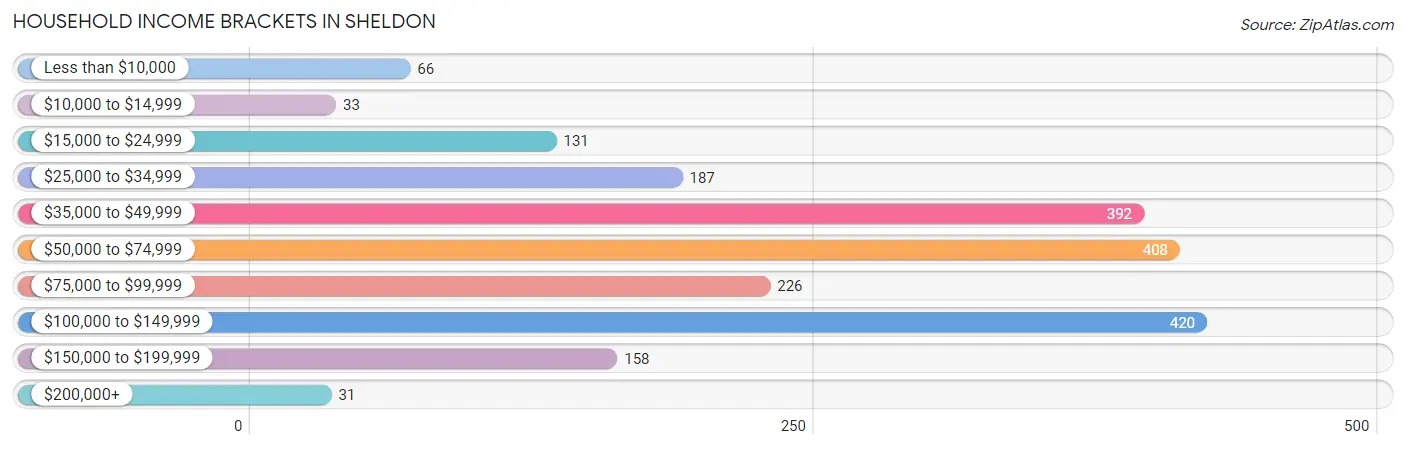
| Income Bracket | # Households | % Households |
| Less than $10,000 | 66 | 3.2% |
| $10,000 to $14,999 | 33 | 1.6% |
| $15,000 to $24,999 | 131 | 6.4% |
| $25,000 to $34,999 | 187 | 9.1% |
| $35,000 to $49,999 | 392 | 19.1% |
| $50,000 to $74,999 | 408 | 19.9% |
| $75,000 to $99,999 | 226 | 11.0% |
| $100,000 to $149,999 | 420 | 20.5% |
| $150,000 to $199,999 | 158 | 7.7% |
| $200,000+ | 31 | 1.5% |
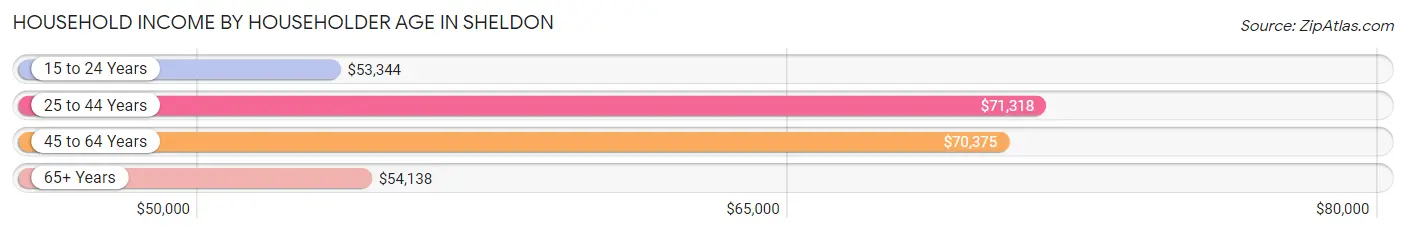
Household Income by Householder Age in Sheldon
The median household income in Sheldon is $61,939, with the highest median household income of $71,318 found in the 25 to 44 years age bracket for the primary householder. A total of 655 households (31.9%) fall into this category. Meanwhile, the 15 to 24 years age bracket for the primary householder has the lowest median household income of $53,344, with 131 households (6.4%) in this group.
| Income Bracket | # Households | Median Income |
| 15 to 24 Years | 131 (6.4%) | $53,344 |
| 25 to 44 Years | 655 (31.9%) | $71,318 |
| 45 to 64 Years | 687 (33.5%) | $70,375 |
| 65+ Years | 578 (28.2%) | $54,138 |
| Total | 2,051 (100.0%) | $61,939 |
Poverty in Sheldon
Income Below Poverty by Sex and Age in Sheldon
With 12.1% poverty level for males and 17.2% for females among the residents of Sheldon, 16 and 17 year old males and 16 and 17 year old females are the most vulnerable to poverty, with 15 males (32.6%) and 51 females (100.0%) in their respective age groups living below the poverty level.
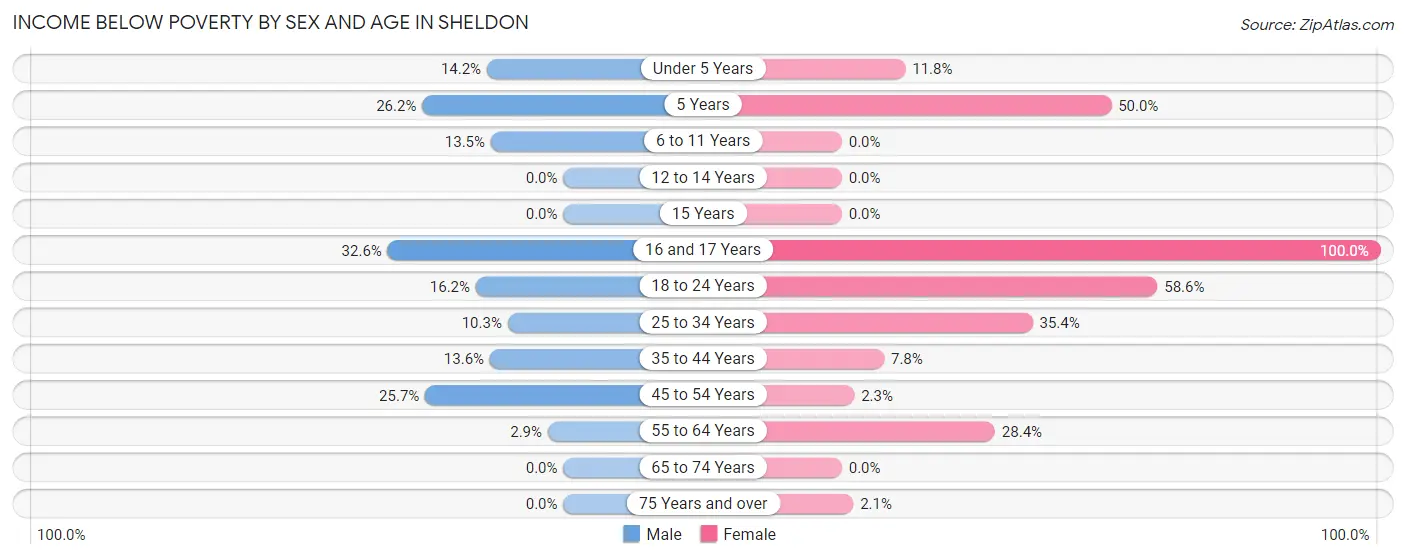
| Age Bracket | Male | Female |
| Under 5 Years | 20 (14.2%) | 27 (11.8%) |
| 5 Years | 22 (26.2%) | 17 (50.0%) |
| 6 to 11 Years | 23 (13.5%) | 0 (0.0%) |
| 12 to 14 Years | 0 (0.0%) | 0 (0.0%) |
| 15 Years | 0 (0.0%) | 0 (0.0%) |
| 16 and 17 Years | 15 (32.6%) | 51 (100.0%) |
| 18 to 24 Years | 44 (16.2%) | 65 (58.6%) |
| 25 to 34 Years | 39 (10.3%) | 148 (35.4%) |
| 35 to 44 Years | 59 (13.6%) | 28 (7.8%) |
| 45 to 54 Years | 89 (25.7%) | 4 (2.3%) |
| 55 to 64 Years | 8 (2.9%) | 106 (28.4%) |
| 65 to 74 Years | 0 (0.0%) | 0 (0.0%) |
| 75 Years and over | 0 (0.0%) | 4 (2.1%) |
| Total | 319 (12.1%) | 450 (17.2%) |
Income Above Poverty by Sex and Age in Sheldon
According to the poverty statistics in Sheldon, males aged 12 to 14 years and females aged 6 to 11 years are the age groups that are most secure financially, with 100.0% of males and 100.0% of females in these age groups living above the poverty line.
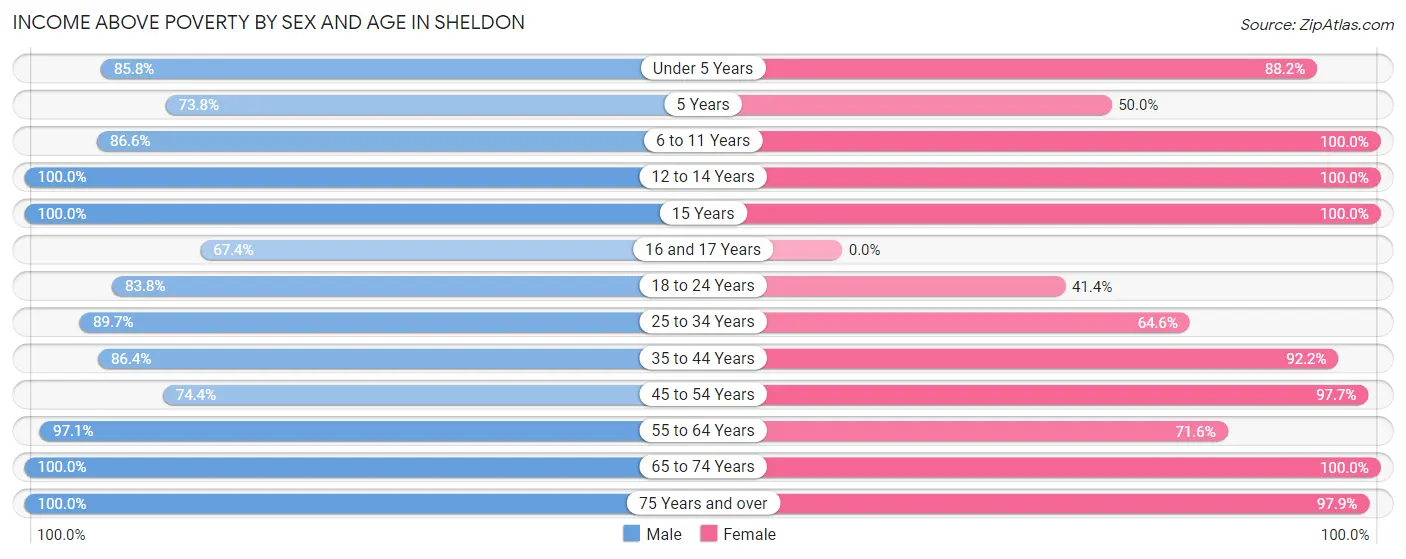
| Age Bracket | Male | Female |
| Under 5 Years | 121 (85.8%) | 202 (88.2%) |
| 5 Years | 62 (73.8%) | 17 (50.0%) |
| 6 to 11 Years | 148 (86.6%) | 302 (100.0%) |
| 12 to 14 Years | 42 (100.0%) | 58 (100.0%) |
| 15 Years | 31 (100.0%) | 28 (100.0%) |
| 16 and 17 Years | 31 (67.4%) | 0 (0.0%) |
| 18 to 24 Years | 227 (83.8%) | 46 (41.4%) |
| 25 to 34 Years | 339 (89.7%) | 270 (64.6%) |
| 35 to 44 Years | 374 (86.4%) | 329 (92.2%) |
| 45 to 54 Years | 258 (74.4%) | 170 (97.7%) |
| 55 to 64 Years | 271 (97.1%) | 267 (71.6%) |
| 65 to 74 Years | 283 (100.0%) | 291 (100.0%) |
| 75 Years and over | 123 (100.0%) | 185 (97.9%) |
| Total | 2,310 (87.9%) | 2,165 (82.8%) |
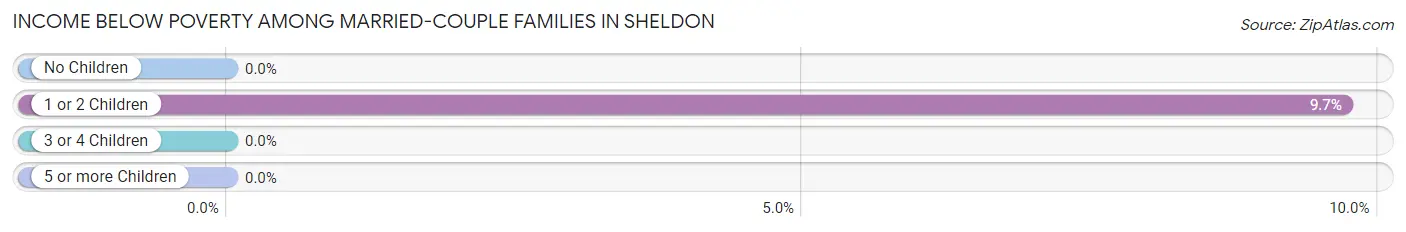
Income Below Poverty Among Married-Couple Families in Sheldon
The poverty statistics for married-couple families in Sheldon show that 3.0% or 33 of the total 1,102 families live below the poverty line. Families with 1 or 2 children have the highest poverty rate of 9.7%, comprising of 33 families. On the other hand, families with no children have the lowest poverty rate of 0.0%, which includes 0 families.
| Children | Above Poverty | Below Poverty |
| No Children | 646 (100.0%) | 0 (0.0%) |
| 1 or 2 Children | 307 (90.3%) | 33 (9.7%) |
| 3 or 4 Children | 116 (100.0%) | 0 (0.0%) |
| 5 or more Children | 0 (0.0%) | 0 (0.0%) |
| Total | 1,069 (97.0%) | 33 (3.0%) |
Income Below Poverty Among Single-Parent Households in Sheldon
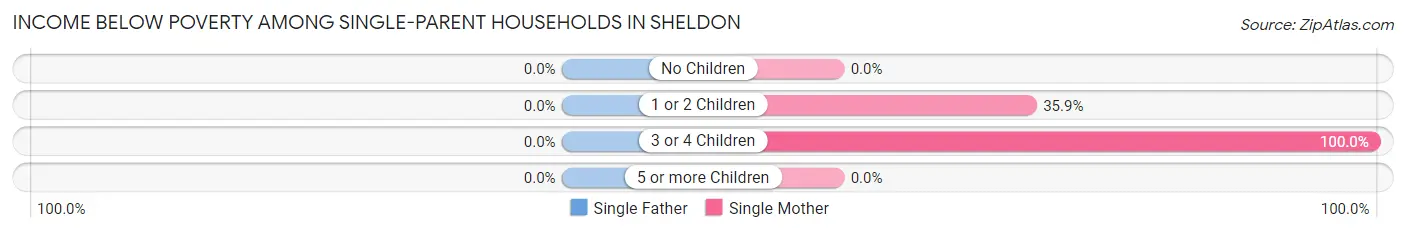
| Children | Single Father | Single Mother |
| No Children | 0 (0.0%) | 0 (0.0%) |
| 1 or 2 Children | 0 (0.0%) | 33 (35.9%) |
| 3 or 4 Children | 0 (0.0%) | 22 (100.0%) |
| 5 or more Children | 0 (0.0%) | 0 (0.0%) |
| Total | 0 (0.0%) | 55 (48.2%) |
Income Below Poverty Among Married-Couple vs Single-Parent Households in Sheldon
The poverty data for Sheldon shows that 33 of the married-couple family households (3.0%) and 55 of the single-parent households (32.2%) are living below the poverty level. Within the married-couple family households, those with 1 or 2 children have the highest poverty rate, with 33 households (9.7%) falling below the poverty line. Among the single-parent households, those with 3 or 4 children have the highest poverty rate, with 22 household (100.0%) living below poverty.
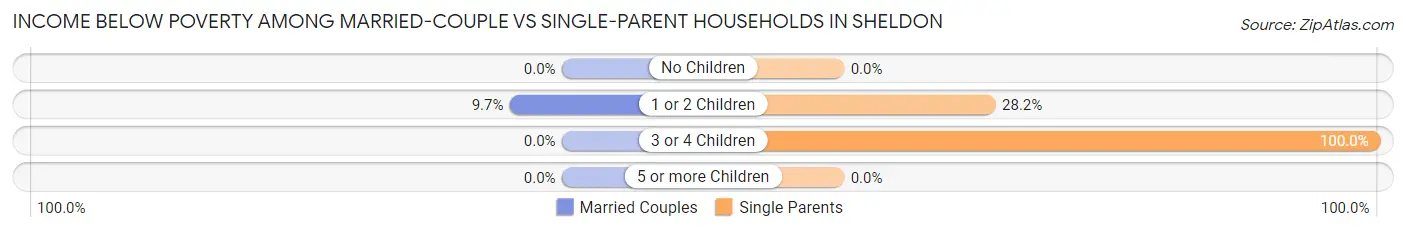
| Children | Married-Couple Families | Single-Parent Households |
| No Children | 0 (0.0%) | 0 (0.0%) |
| 1 or 2 Children | 33 (9.7%) | 33 (28.2%) |
| 3 or 4 Children | 0 (0.0%) | 22 (100.0%) |
| 5 or more Children | 0 (0.0%) | 0 (0.0%) |
| Total | 33 (3.0%) | 55 (32.2%) |
Race in Sheldon
The most populous races in Sheldon are White / Caucasian (4,593 | 84.8%), Hispanic or Latino (672 | 12.4%), and Two or more Races (436 | 8.1%).
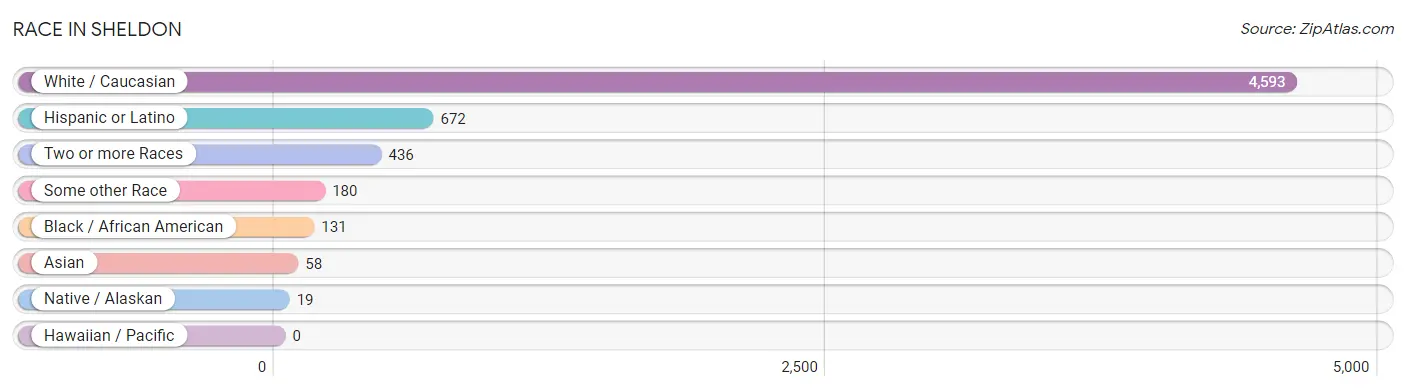
| Race | # Population | % Population |
| Asian | 58 | 1.1% |
| Black / African American | 131 | 2.4% |
| Hawaiian / Pacific | 0 | 0.0% |
| Hispanic or Latino | 672 | 12.4% |
| Native / Alaskan | 19 | 0.4% |
| White / Caucasian | 4,593 | 84.8% |
| Two or more Races | 436 | 8.1% |
| Some other Race | 180 | 3.3% |
| Total | 5,417 | 100.0% |
Ancestry in Sheldon
The most populous ancestries reported in Sheldon are German (2,208 | 40.8%), Dutch (1,651 | 30.5%), Norwegian (322 | 5.9%), Central American (256 | 4.7%), and Guatemalan (238 | 4.4%), together accounting for 86.3% of all Sheldon residents.
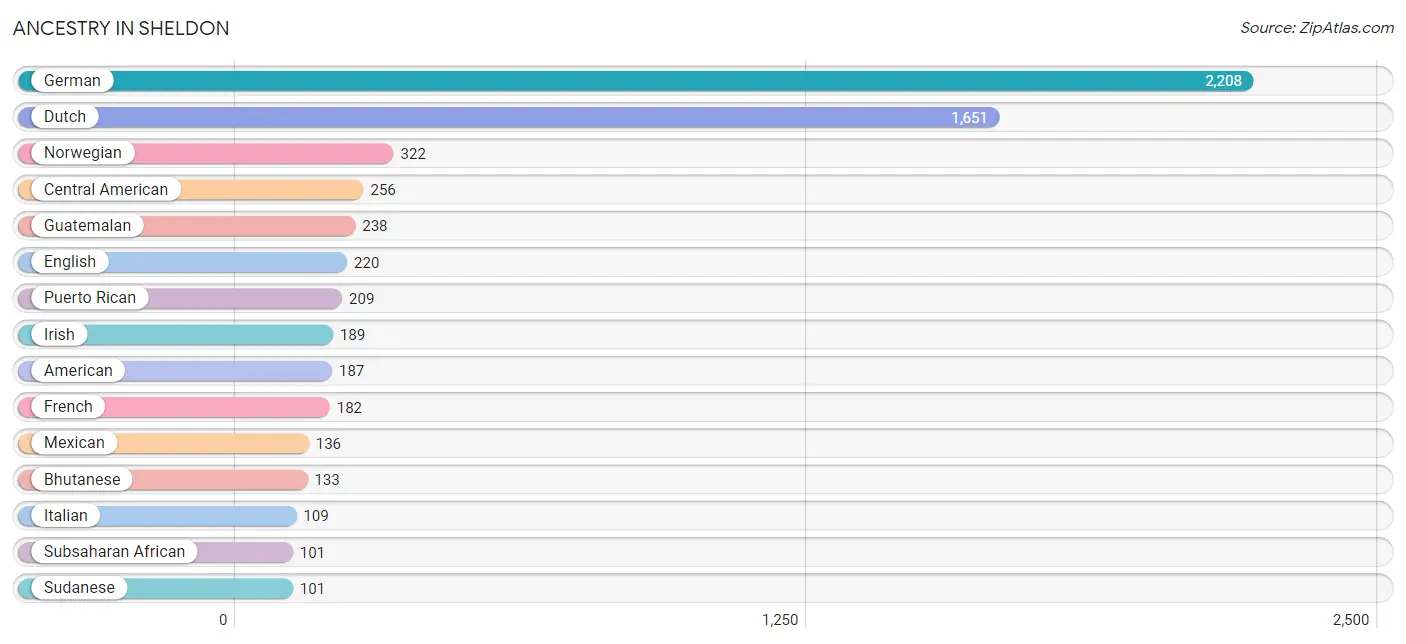
| Ancestry | # Population | % Population |
| American | 187 | 3.5% |
| Bhutanese | 133 | 2.5% |
| Central American | 256 | 4.7% |
| Cherokee | 5 | 0.1% |
| Cuban | 28 | 0.5% |
| Danish | 11 | 0.2% |
| Dutch | 1,651 | 30.5% |
| English | 220 | 4.1% |
| European | 14 | 0.3% |
| French | 182 | 3.4% |
| German | 2,208 | 40.8% |
| Guatemalan | 238 | 4.4% |
| Indian (Asian) | 2 | 0.0% |
| Irish | 189 | 3.5% |
| Italian | 109 | 2.0% |
| Korean | 15 | 0.3% |
| Mexican | 136 | 2.5% |
| Mexican American Indian | 10 | 0.2% |
| Norwegian | 322 | 5.9% |
| Peruvian | 43 | 0.8% |
| Puerto Rican | 209 | 3.9% |
| Russian | 17 | 0.3% |
| Salvadoran | 18 | 0.3% |
| Scottish | 82 | 1.5% |
| South American | 43 | 0.8% |
| Subsaharan African | 101 | 1.9% |
| Sudanese | 101 | 1.9% |
| Swedish | 83 | 1.5% |
| Swiss | 4 | 0.1% |
| Thai | 9 | 0.2% | View All 30 Rows |
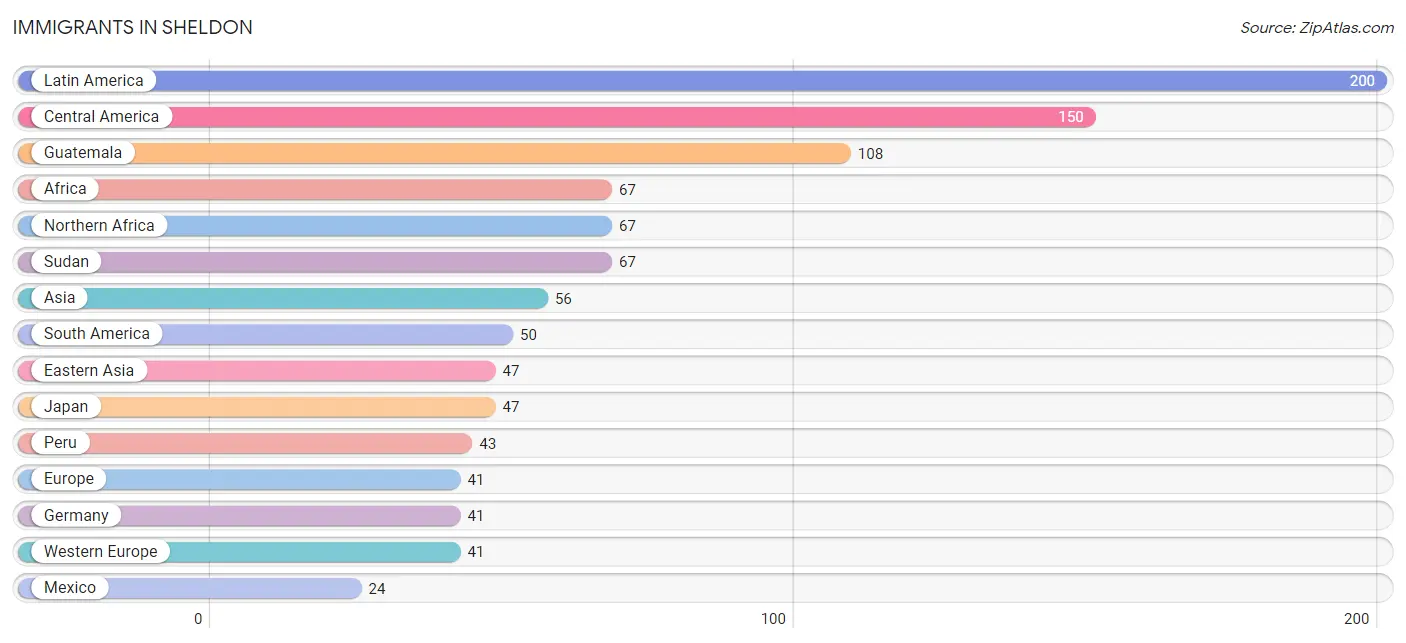
Immigrants in Sheldon
The most numerous immigrant groups reported in Sheldon came from Latin America (200 | 3.7%), Central America (150 | 2.8%), Guatemala (108 | 2.0%), Africa (67 | 1.2%), and Northern Africa (67 | 1.2%), together accounting for 10.9% of all Sheldon residents.
| Immigration Origin | # Population | % Population |
| Africa | 67 | 1.2% |
| Asia | 56 | 1.0% |
| Brazil | 7 | 0.1% |
| Central America | 150 | 2.8% |
| Eastern Asia | 47 | 0.9% |
| El Salvador | 18 | 0.3% |
| Europe | 41 | 0.8% |
| Germany | 41 | 0.8% |
| Guatemala | 108 | 2.0% |
| India | 9 | 0.2% |
| Japan | 47 | 0.9% |
| Latin America | 200 | 3.7% |
| Mexico | 24 | 0.4% |
| Northern Africa | 67 | 1.2% |
| Peru | 43 | 0.8% |
| South America | 50 | 0.9% |
| South Central Asia | 9 | 0.2% |
| Sudan | 67 | 1.2% |
| Western Europe | 41 | 0.8% | View All 19 Rows |
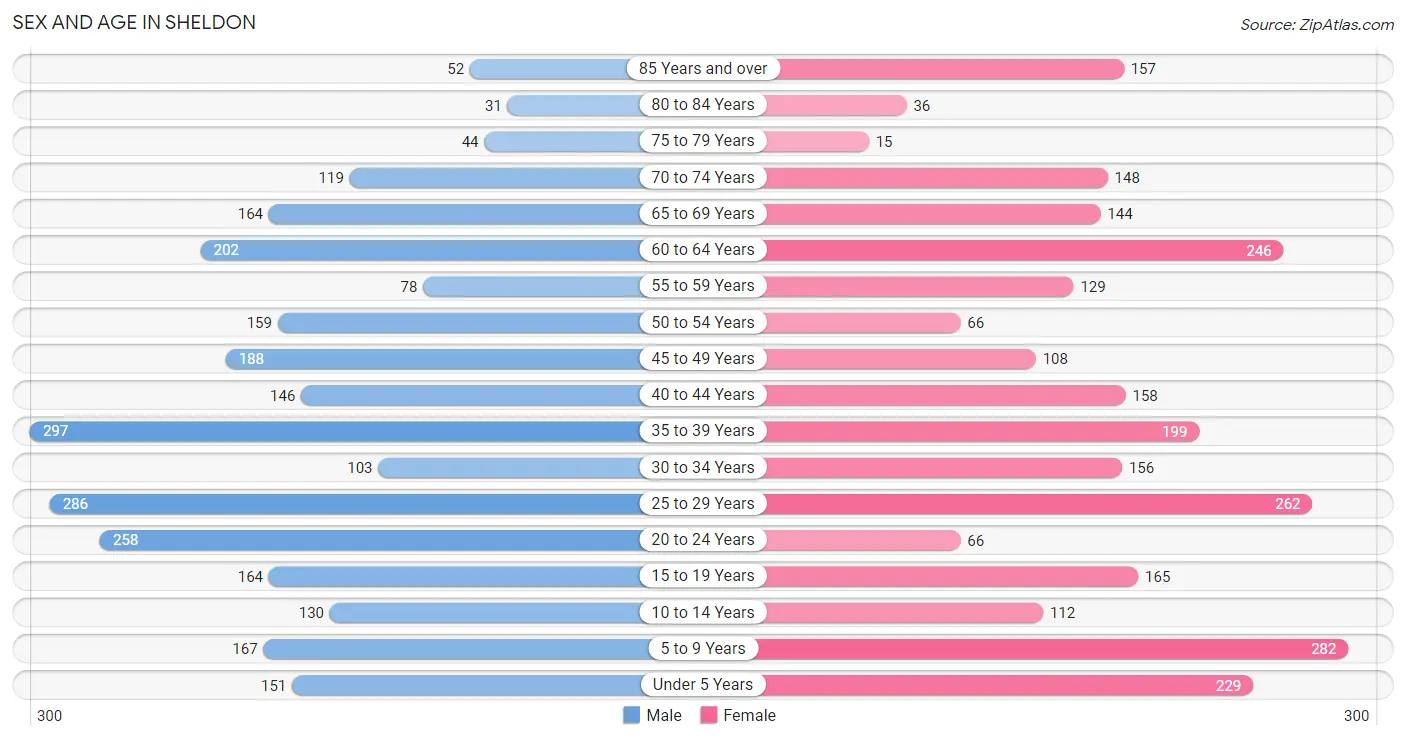
Sex and Age in Sheldon
Sex and Age in Sheldon
The most populous age groups in Sheldon are 35 to 39 Years (297 | 10.8%) for men and 5 to 9 Years (282 | 10.5%) for women.
| Age Bracket | Male | Female |
| Under 5 Years | 151 (5.5%) | 229 (8.6%) |
| 5 to 9 Years | 167 (6.1%) | 282 (10.5%) |
| 10 to 14 Years | 130 (4.8%) | 112 (4.2%) |
| 15 to 19 Years | 164 (6.0%) | 165 (6.2%) |
| 20 to 24 Years | 258 (9.4%) | 66 (2.5%) |
| 25 to 29 Years | 286 (10.4%) | 262 (9.8%) |
| 30 to 34 Years | 103 (3.8%) | 156 (5.8%) |
| 35 to 39 Years | 297 (10.8%) | 199 (7.4%) |
| 40 to 44 Years | 146 (5.3%) | 158 (5.9%) |
| 45 to 49 Years | 188 (6.9%) | 108 (4.0%) |
| 50 to 54 Years | 159 (5.8%) | 66 (2.5%) |
| 55 to 59 Years | 78 (2.9%) | 129 (4.8%) |
| 60 to 64 Years | 202 (7.4%) | 246 (9.2%) |
| 65 to 69 Years | 164 (6.0%) | 144 (5.4%) |
| 70 to 74 Years | 119 (4.3%) | 148 (5.5%) |
| 75 to 79 Years | 44 (1.6%) | 15 (0.6%) |
| 80 to 84 Years | 31 (1.1%) | 36 (1.3%) |
| 85 Years and over | 52 (1.9%) | 157 (5.9%) |
| Total | 2,739 (100.0%) | 2,678 (100.0%) |
Families and Households in Sheldon
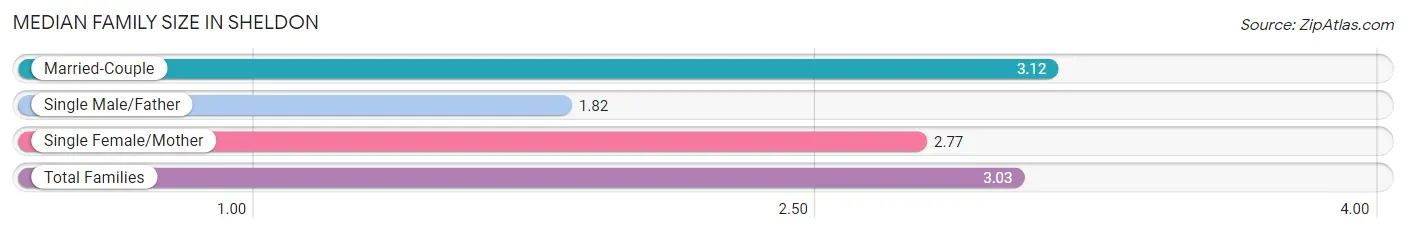
Median Family Size in Sheldon
The median family size in Sheldon is 3.03 persons per family, with married-couple families (1,102 | 86.6%) accounting for the largest median family size of 3.12 persons per family. On the other hand, single male/father families (57 | 4.5%) represent the smallest median family size with 1.82 persons per family.
| Family Type | # Families | Family Size |
| Married-Couple | 1,102 (86.6%) | 3.12 |
| Single Male/Father | 57 (4.5%) | 1.82 |
| Single Female/Mother | 114 (9.0%) | 2.77 |
| Total Families | 1,273 (100.0%) | 3.03 |
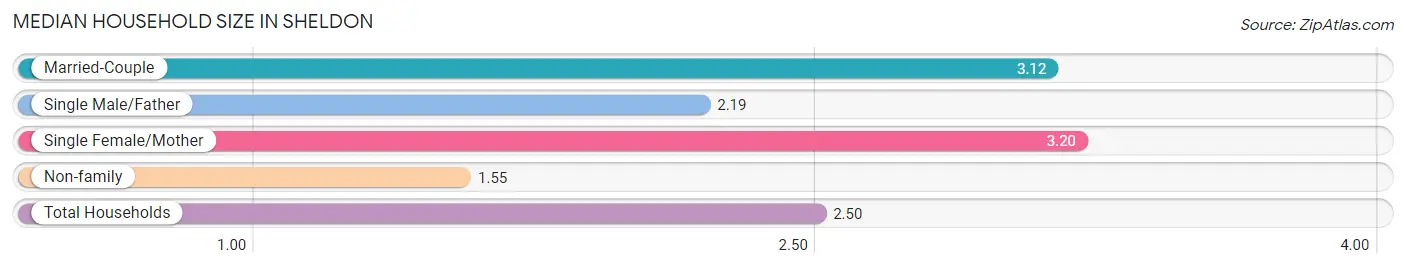
Median Household Size in Sheldon
The median household size in Sheldon is 2.50 persons per household, with single female/mother households (114 | 5.6%) accounting for the largest median household size of 3.2 persons per household. non-family households (778 | 37.9%) represent the smallest median household size with 1.55 persons per household.
| Household Type | # Households | Household Size |
| Married-Couple | 1,102 (53.7%) | 3.12 |
| Single Male/Father | 57 (2.8%) | 2.19 |
| Single Female/Mother | 114 (5.6%) | 3.20 |
| Non-family | 778 (37.9%) | 1.55 |
| Total Households | 2,051 (100.0%) | 2.50 |
Household Size by Marriage Status in Sheldon
Out of a total of 2,051 households in Sheldon, 1,273 (62.1%) are family households, while 778 (37.9%) are nonfamily households. The most numerous type of family households are 2-person households, comprising 587, and the most common type of nonfamily households are 1-person households, comprising 623.
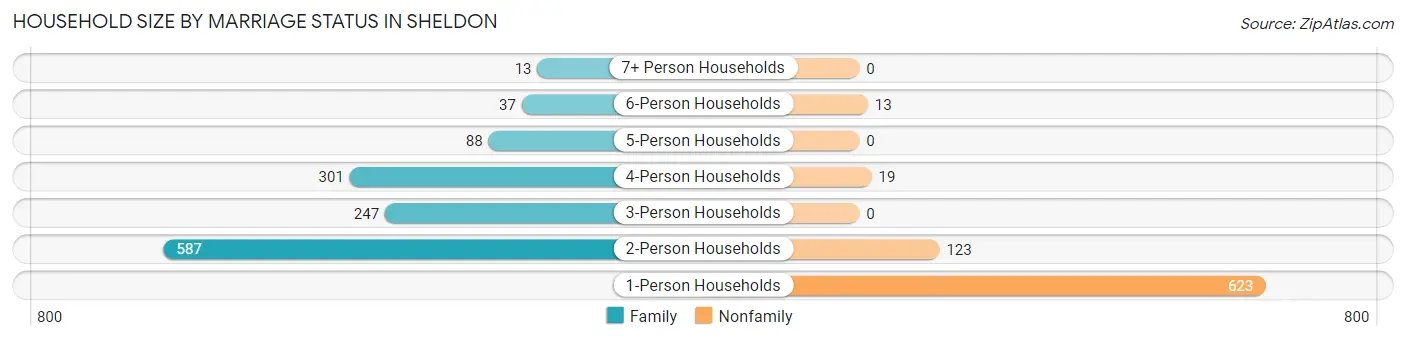
| Household Size | Family Households | Nonfamily Households |
| 1-Person Households | - | 623 (30.4%) |
| 2-Person Households | 587 (28.6%) | 123 (6.0%) |
| 3-Person Households | 247 (12.0%) | 0 (0.0%) |
| 4-Person Households | 301 (14.7%) | 19 (0.9%) |
| 5-Person Households | 88 (4.3%) | 0 (0.0%) |
| 6-Person Households | 37 (1.8%) | 13 (0.6%) |
| 7+ Person Households | 13 (0.6%) | 0 (0.0%) |
| Total | 1,273 (62.1%) | 778 (37.9%) |
Female Fertility in Sheldon
Fertility by Age in Sheldon
Average fertility rate in Sheldon is 79.0 births per 1,000 women. Women in the age bracket of 20 to 34 years have the highest fertility rate with 182.0 births per 1,000 women. Women in the age bracket of 20 to 34 years acount for 100.0% of all women with births.
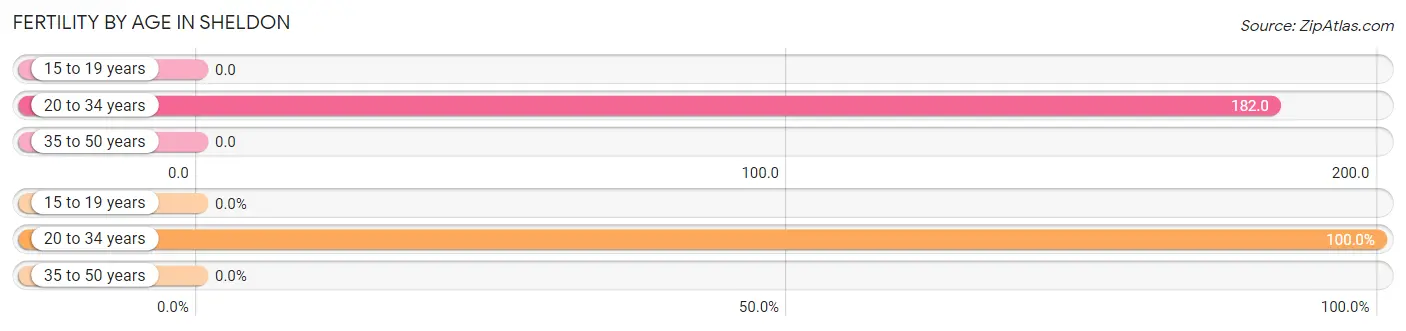
| Age Bracket | Women with Births | Births / 1,000 Women |
| 15 to 19 years | 0 (0.0%) | 0.0 |
| 20 to 34 years | 88 (100.0%) | 182.0 |
| 35 to 50 years | 0 (0.0%) | 0.0 |
| Total | 88 (100.0%) | 79.0 |
Fertility by Age by Marriage Status in Sheldon
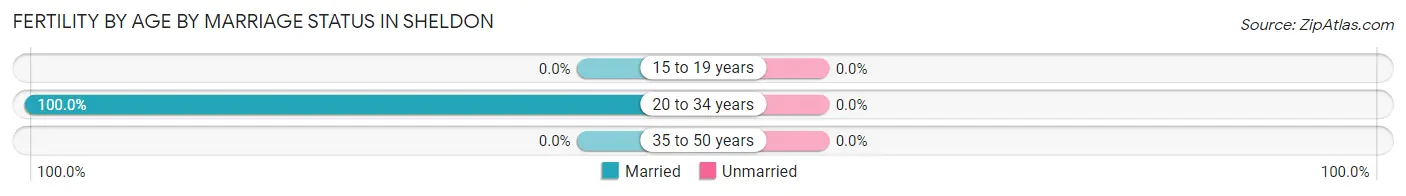
| Age Bracket | Married | Unmarried |
| 15 to 19 years | 0 (0.0%) | 0 (0.0%) |
| 20 to 34 years | 88 (100.0%) | 0 (0.0%) |
| 35 to 50 years | 0 (0.0%) | 0 (0.0%) |
| Total | 88 (100.0%) | 0 (0.0%) |
Fertility by Education in Sheldon
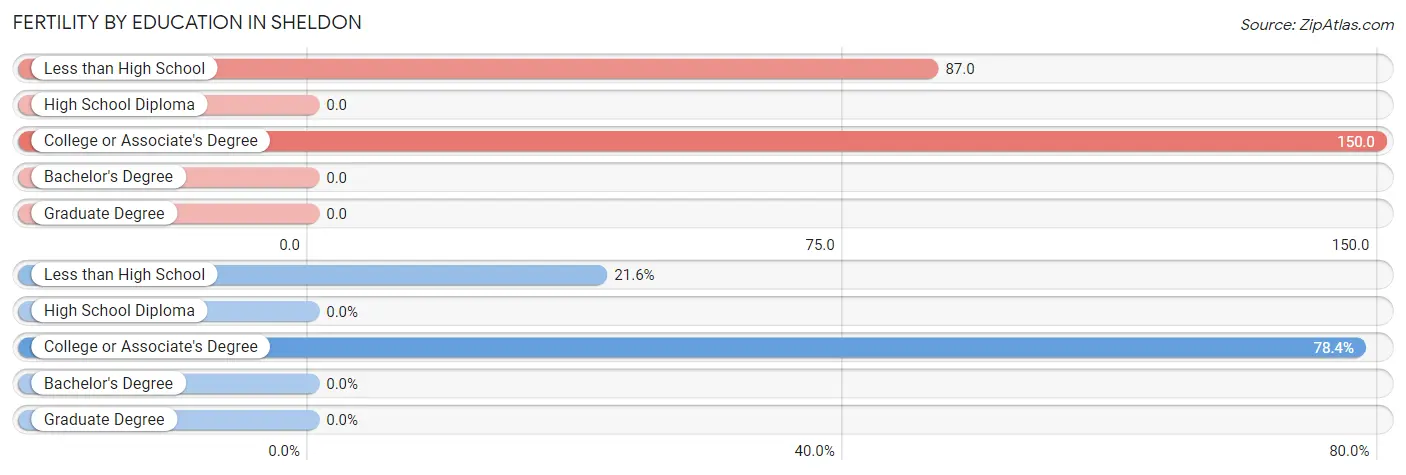
| Educational Attainment | Women with Births | Births / 1,000 Women |
| Less than High School | 19 (21.6%) | 87.0 |
| High School Diploma | 0 (0.0%) | 0.0 |
| College or Associate's Degree | 69 (78.4%) | 150.0 |
| Bachelor's Degree | 0 (0.0%) | 0.0 |
| Graduate Degree | 0 (0.0%) | 0.0 |
| Total | 88 (100.0%) | 79.0 |
Fertility by Education by Marriage Status in Sheldon
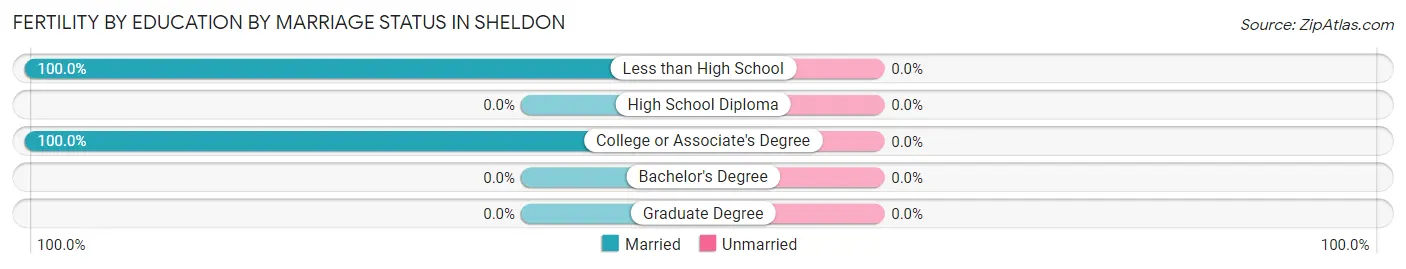
| Educational Attainment | Married | Unmarried |
| Less than High School | 19 (100.0%) | 0 (0.0%) |
| High School Diploma | 0 (0.0%) | 0 (0.0%) |
| College or Associate's Degree | 69 (100.0%) | 0 (0.0%) |
| Bachelor's Degree | 0 (0.0%) | 0 (0.0%) |
| Graduate Degree | 0 (0.0%) | 0 (0.0%) |
| Total | 88 (100.0%) | 0 (0.0%) |
Employment Characteristics in Sheldon
Employment by Class of Employer in Sheldon
Among the 2,753 employed individuals in Sheldon, private company employees (1,689 | 61.4%), not-for-profit organizations (286 | 10.4%), and local government employees (286 | 10.4%) make up the most common classes of employment.
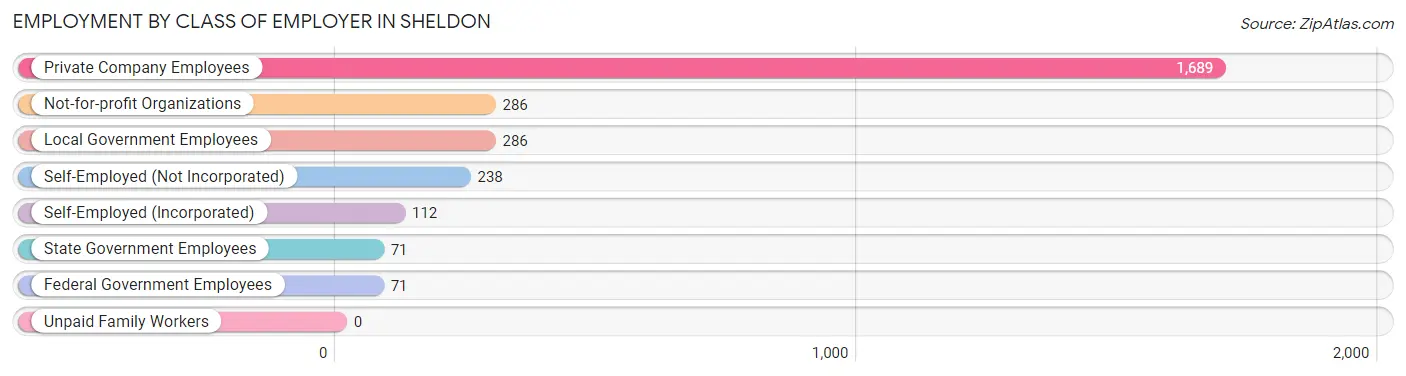
| Employer Class | # Employees | % Employees |
| Private Company Employees | 1,689 | 61.4% |
| Self-Employed (Incorporated) | 112 | 4.1% |
| Self-Employed (Not Incorporated) | 238 | 8.6% |
| Not-for-profit Organizations | 286 | 10.4% |
| Local Government Employees | 286 | 10.4% |
| State Government Employees | 71 | 2.6% |
| Federal Government Employees | 71 | 2.6% |
| Unpaid Family Workers | 0 | 0.0% |
| Total | 2,753 | 100.0% |
Employment Status by Age in Sheldon
According to the labor force statistics for Sheldon, out of the total population over 16 years of age (4,287), 67.0% or 2,872 individuals are in the labor force, with 1.5% or 43 of them unemployed. The age group with the highest labor force participation rate is 45 to 54 years, with 93.9% or 489 individuals in the labor force. Within the labor force, the 65 to 74 years age range has the highest percentage of unemployed individuals, with 12.8% or 29 of them being unemployed.
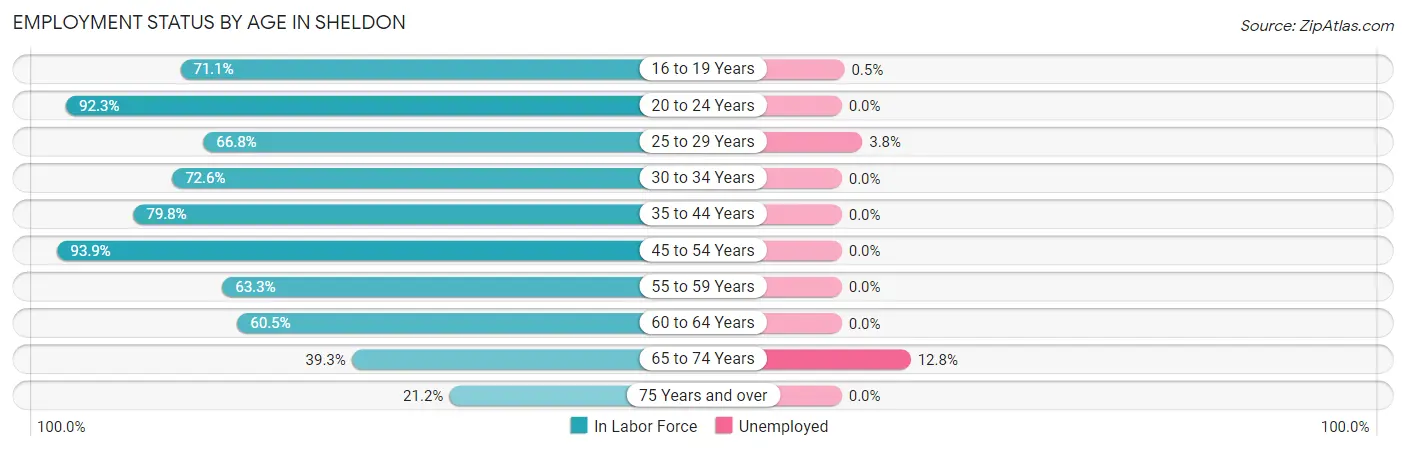
| Age Bracket | In Labor Force | Unemployed |
| 16 to 19 Years | 192 (71.1%) | 1 (0.5%) |
| 20 to 24 Years | 299 (92.3%) | 0 (0.0%) |
| 25 to 29 Years | 366 (66.8%) | 14 (3.8%) |
| 30 to 34 Years | 188 (72.6%) | 0 (0.0%) |
| 35 to 44 Years | 638 (79.8%) | 0 (0.0%) |
| 45 to 54 Years | 489 (93.9%) | 0 (0.0%) |
| 55 to 59 Years | 131 (63.3%) | 0 (0.0%) |
| 60 to 64 Years | 271 (60.5%) | 0 (0.0%) |
| 65 to 74 Years | 226 (39.3%) | 29 (12.8%) |
| 75 Years and over | 71 (21.2%) | 0 (0.0%) |
| Total | 2,872 (67.0%) | 43 (1.5%) |
Employment Status by Educational Attainment in Sheldon
According to labor force statistics for Sheldon, 74.8% of individuals (2,082) out of the total population between 25 and 64 years of age (2,783) are in the labor force, with 0.7% or 15 of them being unemployed. The group with the highest labor force participation rate are those with the educational attainment of bachelor's degree or higher, with 93.3% or 471 individuals in the labor force. Within the labor force, individuals with high school diploma education have the highest percentage of unemployment, with 2.3% or 14 of them being unemployed.
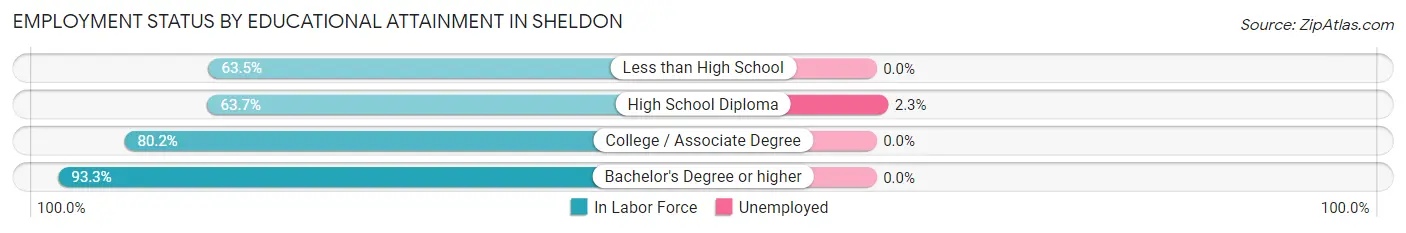
| Educational Attainment | In Labor Force | Unemployed |
| Less than High School | 228 (63.5%) | 0 (0.0%) |
| High School Diploma | 596 (63.7%) | 22 (2.3%) |
| College / Associate Degree | 788 (80.2%) | 0 (0.0%) |
| Bachelor's Degree or higher | 471 (93.3%) | 0 (0.0%) |
| Total | 2,082 (74.8%) | 19 (0.7%) |
Employment Occupations by Sex in Sheldon
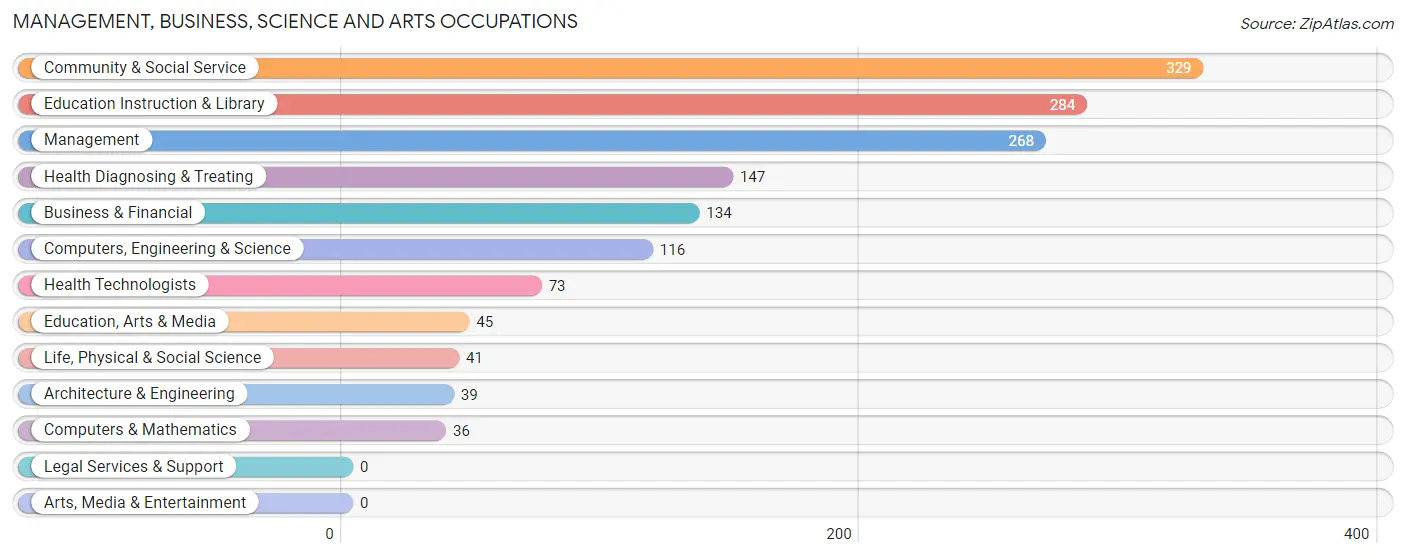
Management, Business, Science and Arts Occupations
The most common Management, Business, Science and Arts occupations in Sheldon are Community & Social Service (329 | 11.6%), Education Instruction & Library (284 | 10.1%), Management (268 | 9.5%), Health Diagnosing & Treating (147 | 5.2%), and Business & Financial (134 | 4.7%).
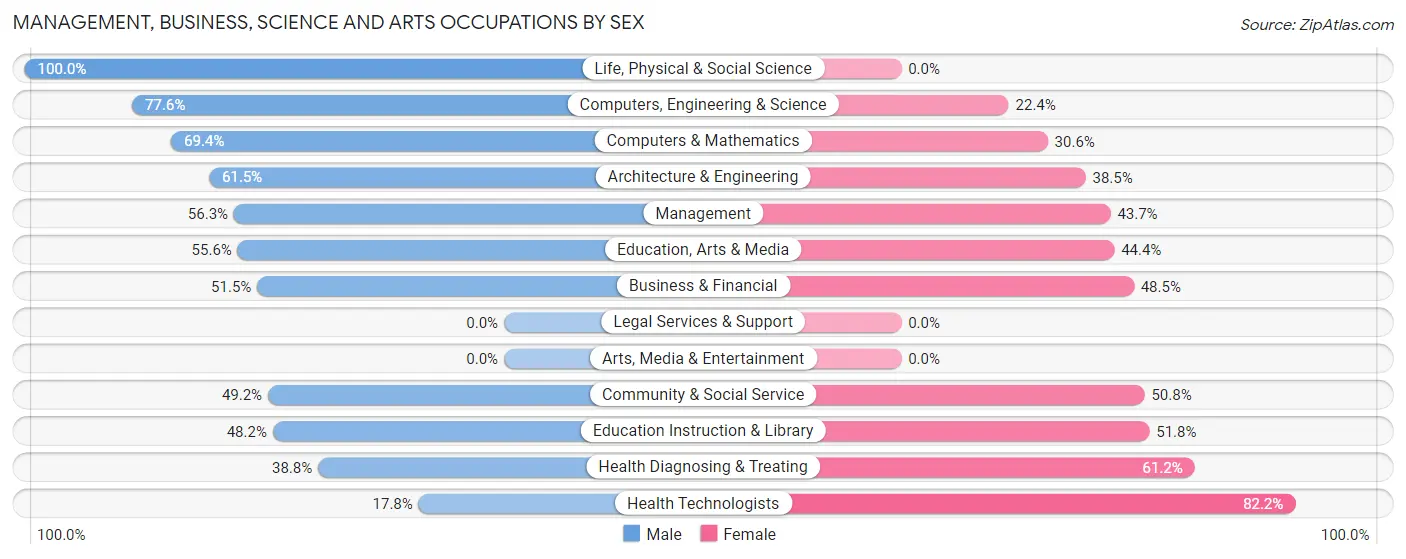
Management, Business, Science and Arts Occupations by Sex
Within the Management, Business, Science and Arts occupations in Sheldon, the most male-oriented occupations are Life, Physical & Social Science (100.0%), Computers, Engineering & Science (77.6%), and Computers & Mathematics (69.4%), while the most female-oriented occupations are Health Technologists (82.2%), Health Diagnosing & Treating (61.2%), and Education Instruction & Library (51.8%).
| Occupation | Male | Female |
| Management | 151 (56.3%) | 117 (43.7%) |
| Business & Financial | 69 (51.5%) | 65 (48.5%) |
| Computers, Engineering & Science | 90 (77.6%) | 26 (22.4%) |
| Computers & Mathematics | 25 (69.4%) | 11 (30.6%) |
| Architecture & Engineering | 24 (61.5%) | 15 (38.5%) |
| Life, Physical & Social Science | 41 (100.0%) | 0 (0.0%) |
| Community & Social Service | 162 (49.2%) | 167 (50.8%) |
| Education, Arts & Media | 25 (55.6%) | 20 (44.4%) |
| Legal Services & Support | 0 (0.0%) | 0 (0.0%) |
| Education Instruction & Library | 137 (48.2%) | 147 (51.8%) |
| Arts, Media & Entertainment | 0 (0.0%) | 0 (0.0%) |
| Health Diagnosing & Treating | 57 (38.8%) | 90 (61.2%) |
| Health Technologists | 13 (17.8%) | 60 (82.2%) |
| Total (Category) | 529 (53.2%) | 465 (46.8%) |
| Total (Overall) | 1,689 (59.8%) | 1,138 (40.3%) |
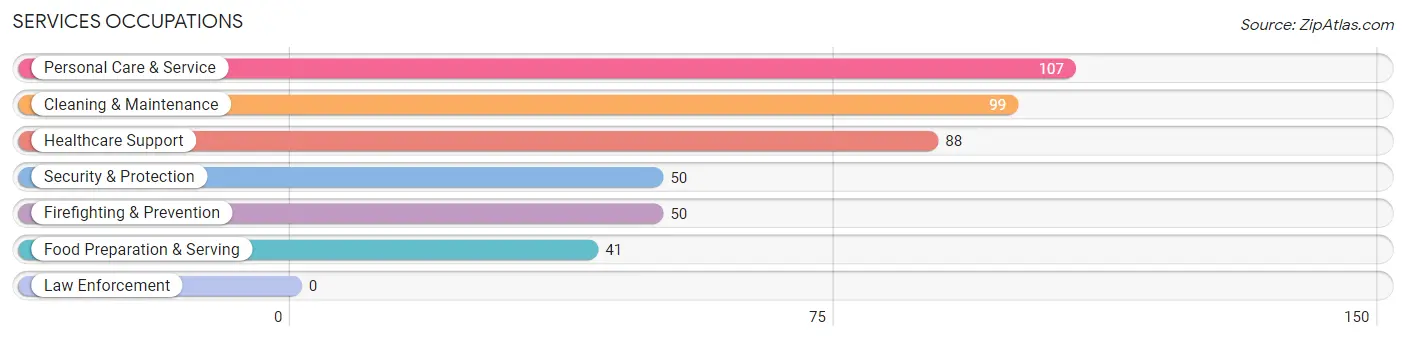
Services Occupations
The most common Services occupations in Sheldon are Personal Care & Service (107 | 3.8%), Cleaning & Maintenance (99 | 3.5%), Healthcare Support (88 | 3.1%), Security & Protection (50 | 1.8%), and Firefighting & Prevention (50 | 1.8%).
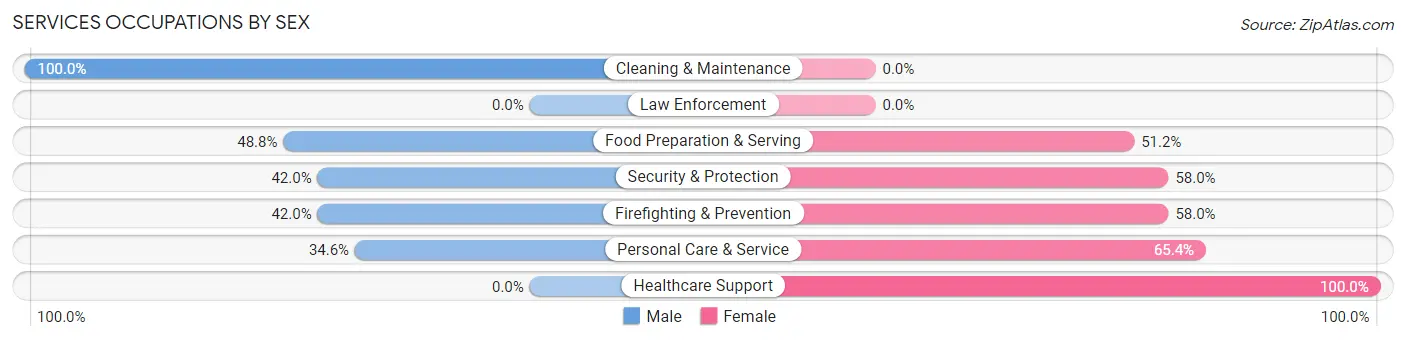
Services Occupations by Sex
Within the Services occupations in Sheldon, the most male-oriented occupations are Cleaning & Maintenance (100.0%), Food Preparation & Serving (48.8%), and Security & Protection (42.0%), while the most female-oriented occupations are Healthcare Support (100.0%), Personal Care & Service (65.4%), and Security & Protection (58.0%).
| Occupation | Male | Female |
| Healthcare Support | 0 (0.0%) | 88 (100.0%) |
| Security & Protection | 21 (42.0%) | 29 (58.0%) |
| Firefighting & Prevention | 21 (42.0%) | 29 (58.0%) |
| Law Enforcement | 0 (0.0%) | 0 (0.0%) |
| Food Preparation & Serving | 20 (48.8%) | 21 (51.2%) |
| Cleaning & Maintenance | 99 (100.0%) | 0 (0.0%) |
| Personal Care & Service | 37 (34.6%) | 70 (65.4%) |
| Total (Category) | 177 (46.0%) | 208 (54.0%) |
| Total (Overall) | 1,689 (59.8%) | 1,138 (40.3%) |
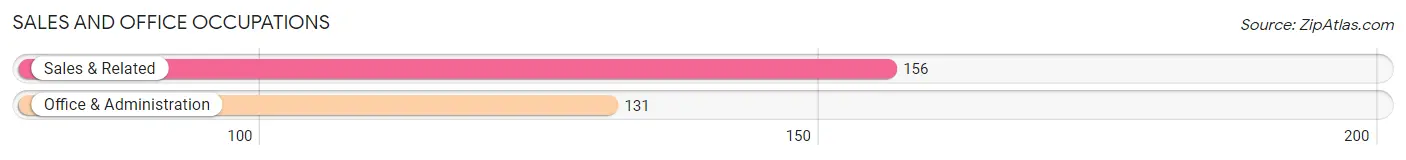
Sales and Office Occupations
The most common Sales and Office occupations in Sheldon are Sales & Related (156 | 5.5%), and Office & Administration (131 | 4.6%).
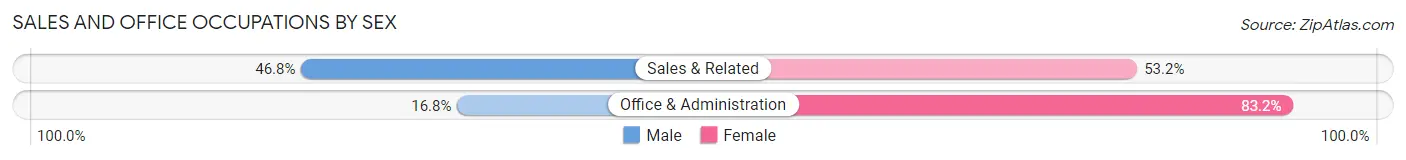
Sales and Office Occupations by Sex
| Occupation | Male | Female |
| Sales & Related | 73 (46.8%) | 83 (53.2%) |
| Office & Administration | 22 (16.8%) | 109 (83.2%) |
| Total (Category) | 95 (33.1%) | 192 (66.9%) |
| Total (Overall) | 1,689 (59.8%) | 1,138 (40.3%) |
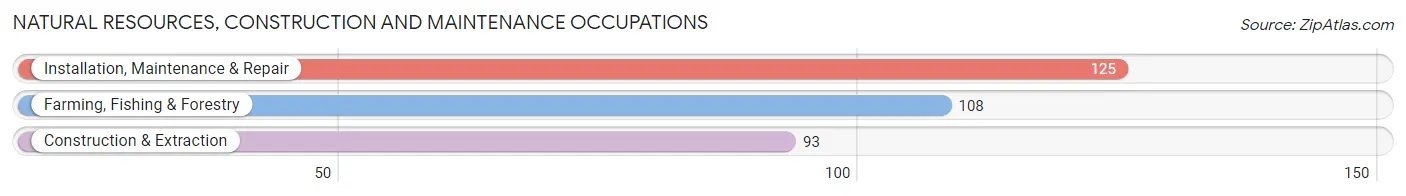
Natural Resources, Construction and Maintenance Occupations
The most common Natural Resources, Construction and Maintenance occupations in Sheldon are Installation, Maintenance & Repair (125 | 4.4%), Farming, Fishing & Forestry (108 | 3.8%), and Construction & Extraction (93 | 3.3%).
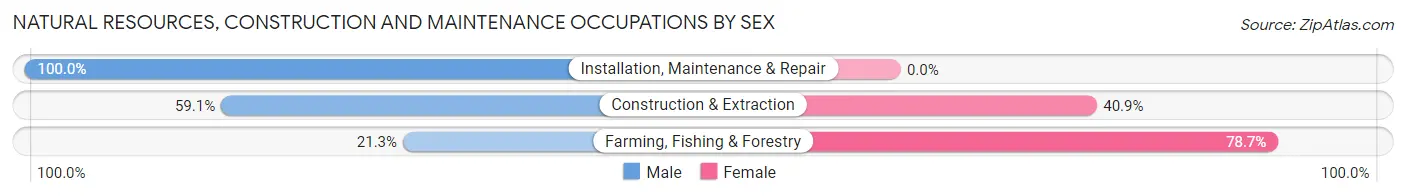
Natural Resources, Construction and Maintenance Occupations by Sex
| Occupation | Male | Female |
| Farming, Fishing & Forestry | 23 (21.3%) | 85 (78.7%) |
| Construction & Extraction | 55 (59.1%) | 38 (40.9%) |
| Installation, Maintenance & Repair | 125 (100.0%) | 0 (0.0%) |
| Total (Category) | 203 (62.3%) | 123 (37.7%) |
| Total (Overall) | 1,689 (59.8%) | 1,138 (40.3%) |
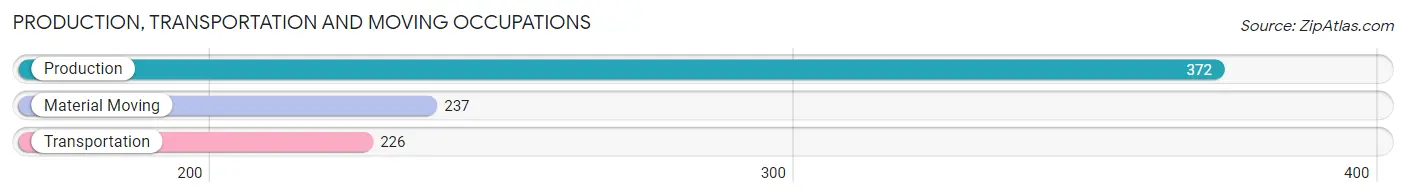
Production, Transportation and Moving Occupations
The most common Production, Transportation and Moving occupations in Sheldon are Production (372 | 13.2%), Material Moving (237 | 8.4%), and Transportation (226 | 8.0%).
Production, Transportation and Moving Occupations by Sex
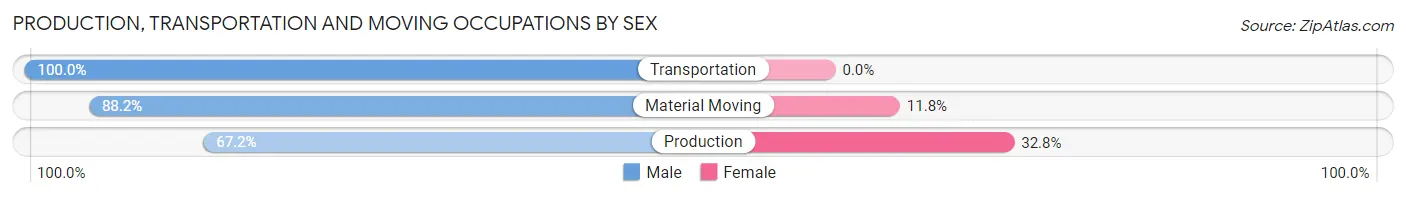
| Occupation | Male | Female |
| Production | 250 (67.2%) | 122 (32.8%) |
| Transportation | 226 (100.0%) | 0 (0.0%) |
| Material Moving | 209 (88.2%) | 28 (11.8%) |
| Total (Category) | 685 (82.0%) | 150 (18.0%) |
| Total (Overall) | 1,689 (59.8%) | 1,138 (40.3%) |
Employment Industries by Sex in Sheldon
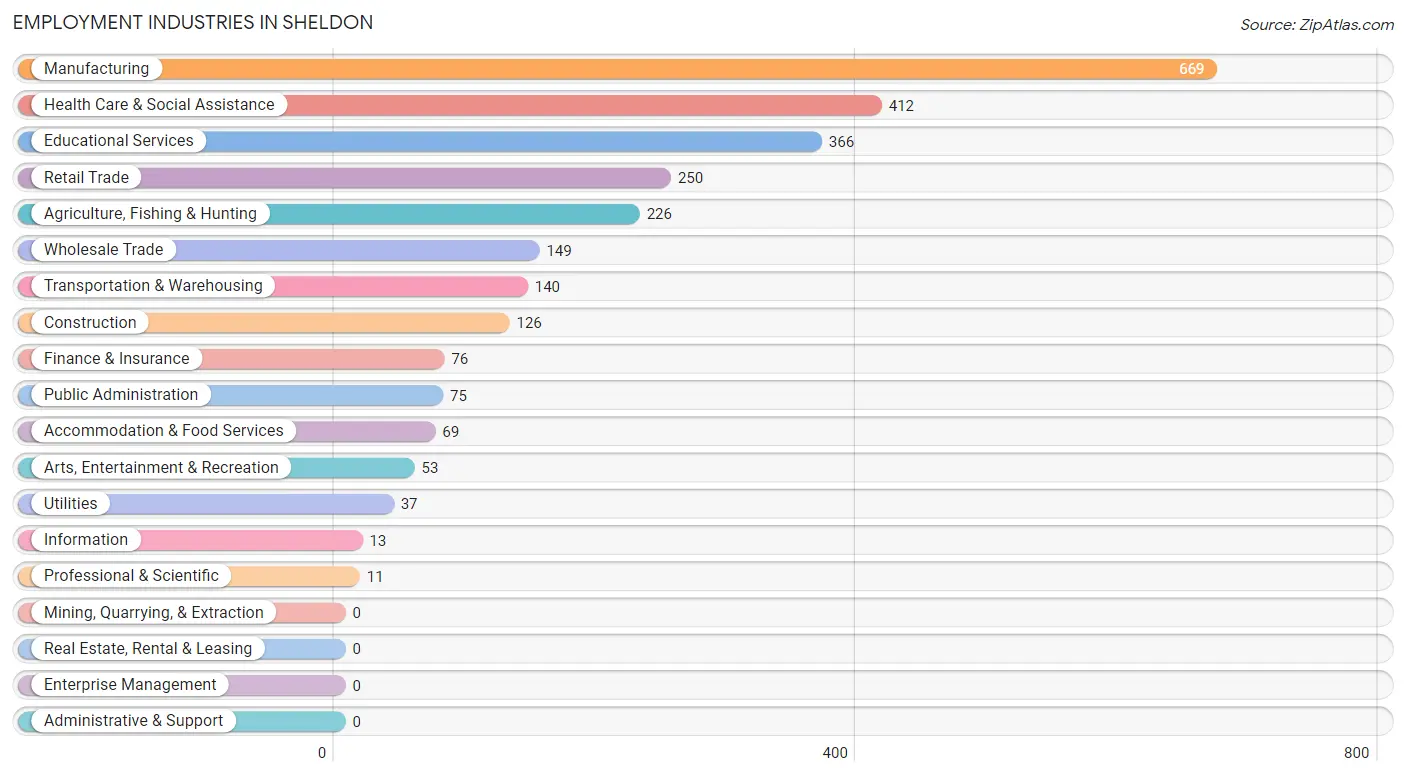
Employment Industries in Sheldon
The major employment industries in Sheldon include Manufacturing (669 | 23.7%), Health Care & Social Assistance (412 | 14.6%), Educational Services (366 | 13.0%), Retail Trade (250 | 8.8%), and Agriculture, Fishing & Hunting (226 | 8.0%).
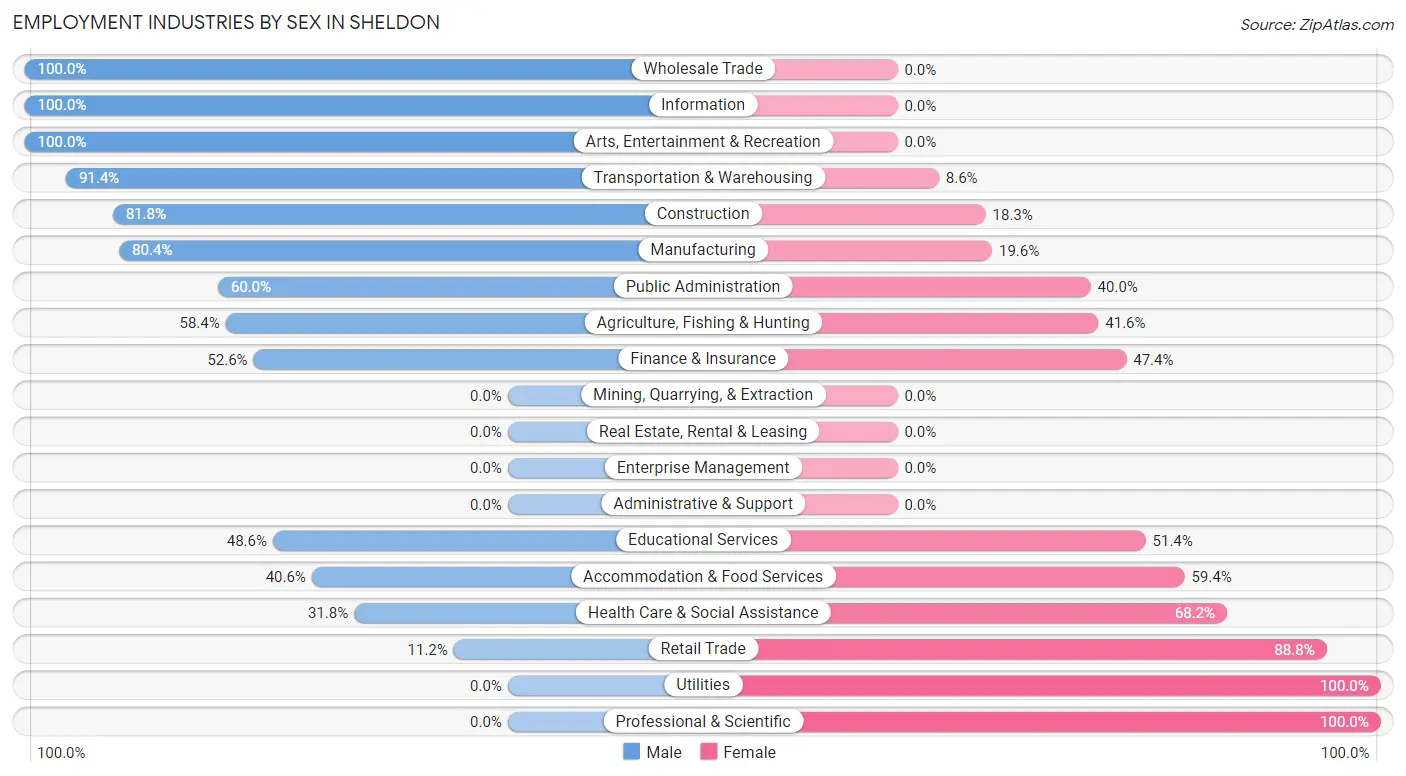
Employment Industries by Sex in Sheldon
The Sheldon industries that see more men than women are Wholesale Trade (100.0%), Information (100.0%), and Arts, Entertainment & Recreation (100.0%), whereas the industries that tend to have a higher number of women are Utilities (100.0%), Professional & Scientific (100.0%), and Retail Trade (88.8%).
| Industry | Male | Female |
| Agriculture, Fishing & Hunting | 132 (58.4%) | 94 (41.6%) |
| Mining, Quarrying, & Extraction | 0 (0.0%) | 0 (0.0%) |
| Construction | 103 (81.8%) | 23 (18.2%) |
| Manufacturing | 538 (80.4%) | 131 (19.6%) |
| Wholesale Trade | 149 (100.0%) | 0 (0.0%) |
| Retail Trade | 28 (11.2%) | 222 (88.8%) |
| Transportation & Warehousing | 128 (91.4%) | 12 (8.6%) |
| Utilities | 0 (0.0%) | 37 (100.0%) |
| Information | 13 (100.0%) | 0 (0.0%) |
| Finance & Insurance | 40 (52.6%) | 36 (47.4%) |
| Real Estate, Rental & Leasing | 0 (0.0%) | 0 (0.0%) |
| Professional & Scientific | 0 (0.0%) | 11 (100.0%) |
| Enterprise Management | 0 (0.0%) | 0 (0.0%) |
| Administrative & Support | 0 (0.0%) | 0 (0.0%) |
| Educational Services | 178 (48.6%) | 188 (51.4%) |
| Health Care & Social Assistance | 131 (31.8%) | 281 (68.2%) |
| Arts, Entertainment & Recreation | 53 (100.0%) | 0 (0.0%) |
| Accommodation & Food Services | 28 (40.6%) | 41 (59.4%) |
| Public Administration | 45 (60.0%) | 30 (40.0%) |
| Total | 1,689 (59.8%) | 1,138 (40.3%) |
Education in Sheldon
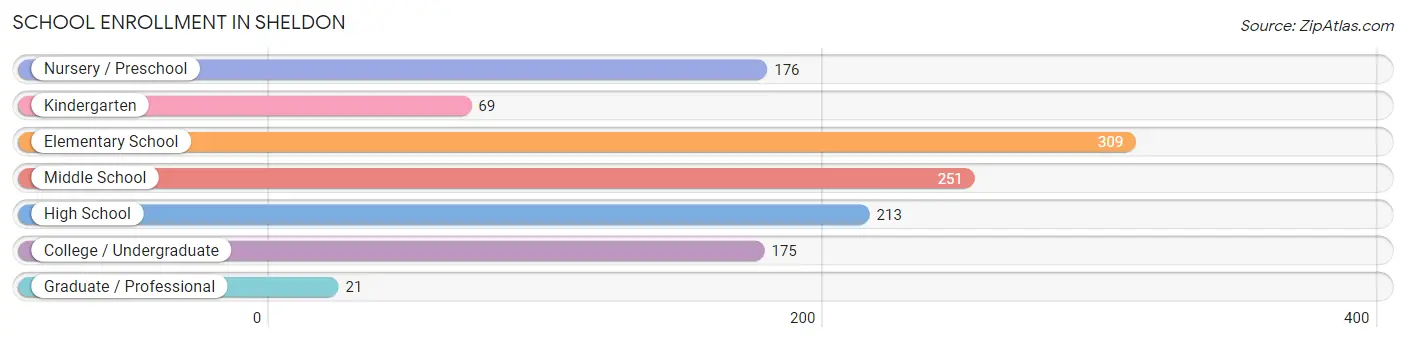
School Enrollment in Sheldon
The most common levels of schooling among the 1,214 students in Sheldon are elementary school (309 | 25.5%), middle school (251 | 20.7%), and high school (213 | 17.5%).
| School Level | # Students | % Students |
| Nursery / Preschool | 176 | 14.5% |
| Kindergarten | 69 | 5.7% |
| Elementary School | 309 | 25.5% |
| Middle School | 251 | 20.7% |
| High School | 213 | 17.5% |
| College / Undergraduate | 175 | 14.4% |
| Graduate / Professional | 21 | 1.7% |
| Total | 1,214 | 100.0% |
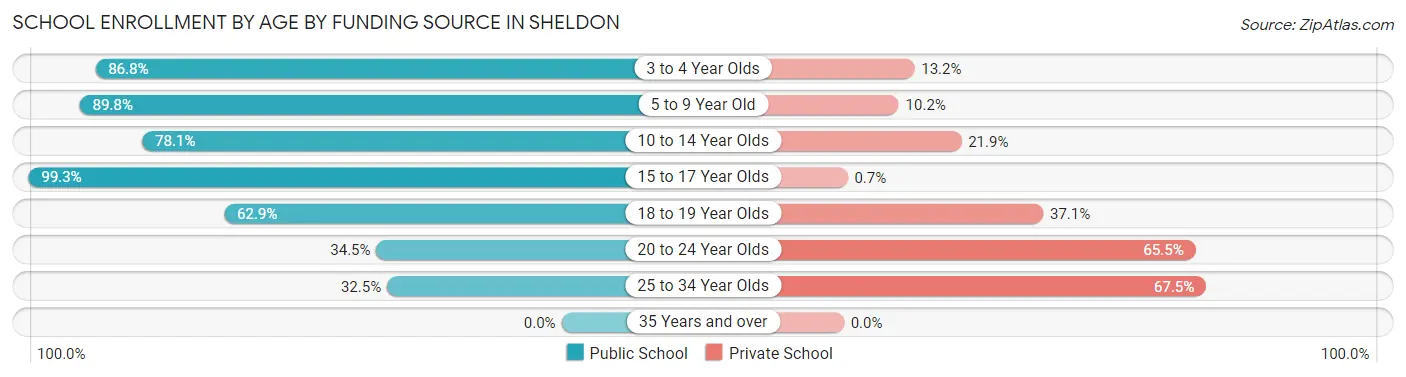
School Enrollment by Age by Funding Source in Sheldon
Out of a total of 1,214 students who are enrolled in schools in Sheldon, 251 (20.7%) attend a private institution, while the remaining 963 (79.3%) are enrolled in public schools. The age group of 25 to 34 year olds has the highest likelihood of being enrolled in private schools, with 27 (67.5% in the age bracket) enrolled. Conversely, the age group of 15 to 17 year olds has the lowest likelihood of being enrolled in a private school, with 141 (99.3% in the age bracket) attending a public institution.
| Age Bracket | Public School | Private School |
| 3 to 4 Year Olds | 99 (86.8%) | 15 (13.2%) |
| 5 to 9 Year Old | 403 (89.8%) | 46 (10.2%) |
| 10 to 14 Year Olds | 189 (78.1%) | 53 (21.9%) |
| 15 to 17 Year Olds | 141 (99.3%) | 1 (0.7%) |
| 18 to 19 Year Olds | 88 (62.9%) | 52 (37.1%) |
| 20 to 24 Year Olds | 30 (34.5%) | 57 (65.5%) |
| 25 to 34 Year Olds | 13 (32.5%) | 27 (67.5%) |
| 35 Years and over | 0 (0.0%) | 0 (0.0%) |
| Total | 963 (79.3%) | 251 (20.7%) |
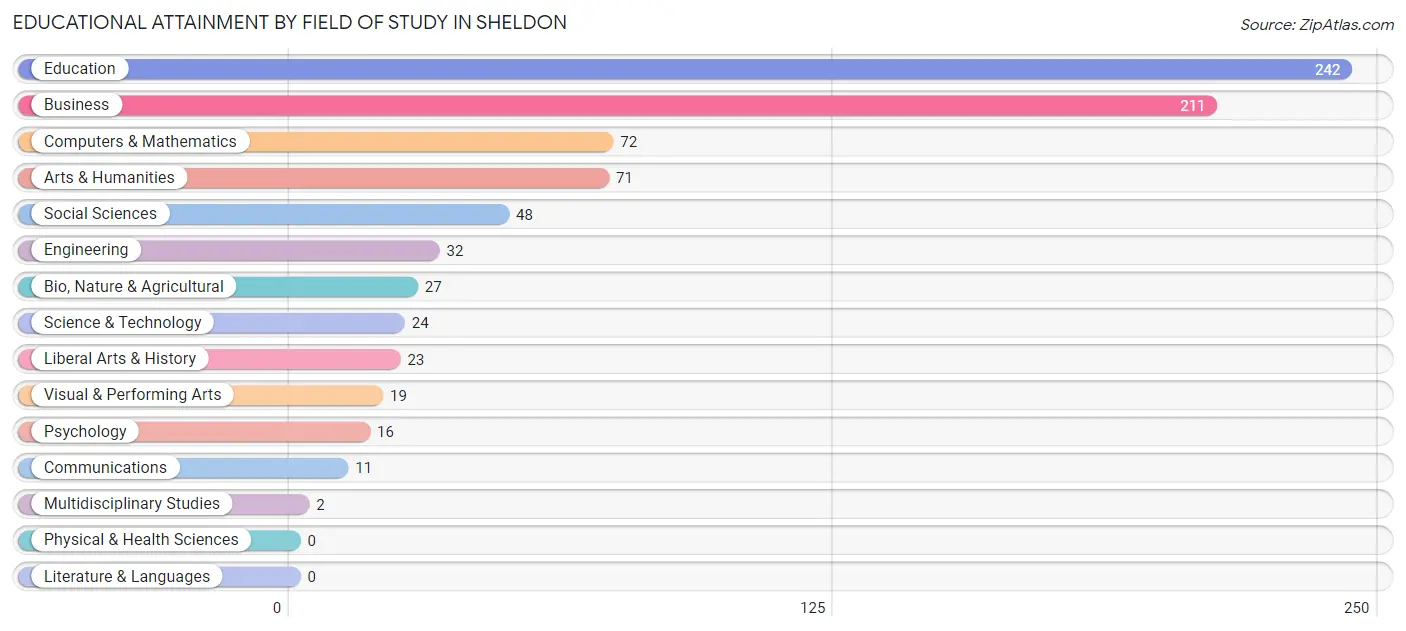
Educational Attainment by Field of Study in Sheldon
Education (242 | 30.3%), business (211 | 26.4%), computers & mathematics (72 | 9.0%), arts & humanities (71 | 8.9%), and social sciences (48 | 6.0%) are the most common fields of study among 798 individuals in Sheldon who have obtained a bachelor's degree or higher.
| Field of Study | # Graduates | % Graduates |
| Computers & Mathematics | 72 | 9.0% |
| Bio, Nature & Agricultural | 27 | 3.4% |
| Physical & Health Sciences | 0 | 0.0% |
| Psychology | 16 | 2.0% |
| Social Sciences | 48 | 6.0% |
| Engineering | 32 | 4.0% |
| Multidisciplinary Studies | 2 | 0.3% |
| Science & Technology | 24 | 3.0% |
| Business | 211 | 26.4% |
| Education | 242 | 30.3% |
| Literature & Languages | 0 | 0.0% |
| Liberal Arts & History | 23 | 2.9% |
| Visual & Performing Arts | 19 | 2.4% |
| Communications | 11 | 1.4% |
| Arts & Humanities | 71 | 8.9% |
| Total | 798 | 100.0% |
Transportation & Commute in Sheldon
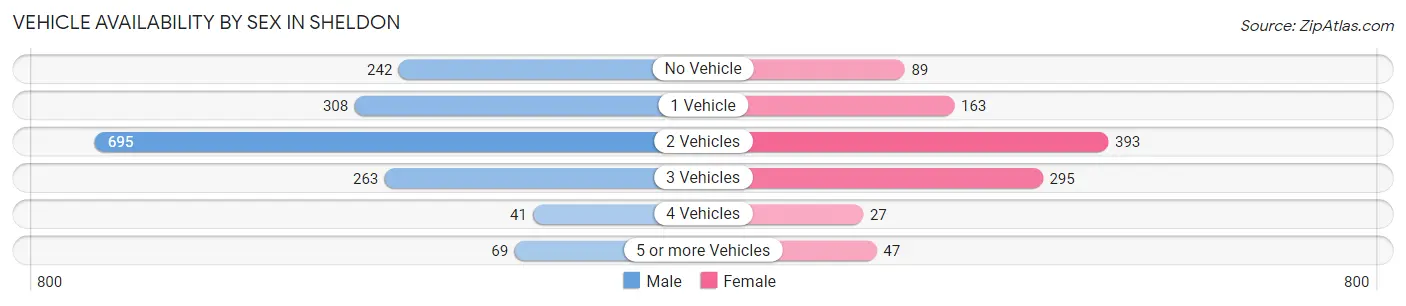
Vehicle Availability by Sex in Sheldon
The most prevalent vehicle ownership categories in Sheldon are males with 2 vehicles (695, accounting for 42.9%) and females with 2 vehicles (393, making up 68.5%).
| Vehicles Available | Male | Female |
| No Vehicle | 242 (15.0%) | 89 (8.8%) |
| 1 Vehicle | 308 (19.0%) | 163 (16.1%) |
| 2 Vehicles | 695 (42.9%) | 393 (38.8%) |
| 3 Vehicles | 263 (16.3%) | 295 (29.1%) |
| 4 Vehicles | 41 (2.5%) | 27 (2.7%) |
| 5 or more Vehicles | 69 (4.3%) | 47 (4.6%) |
| Total | 1,618 (100.0%) | 1,014 (100.0%) |
Commute Time in Sheldon
The most frequently occuring commute durations in Sheldon are 5 to 9 minutes (1,109 commuters, 42.5%), less than 5 minutes (400 commuters, 15.3%), and 10 to 14 minutes (274 commuters, 10.5%).
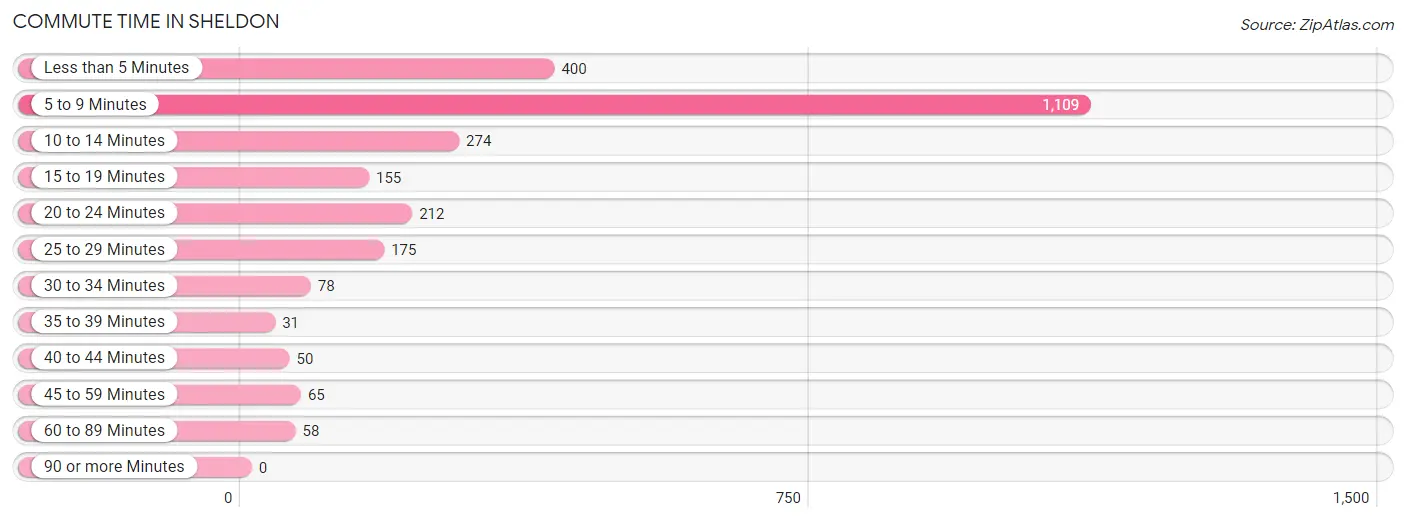
| Commute Time | # Commuters | % Commuters |
| Less than 5 Minutes | 400 | 15.3% |
| 5 to 9 Minutes | 1,109 | 42.5% |
| 10 to 14 Minutes | 274 | 10.5% |
| 15 to 19 Minutes | 155 | 5.9% |
| 20 to 24 Minutes | 212 | 8.1% |
| 25 to 29 Minutes | 175 | 6.7% |
| 30 to 34 Minutes | 78 | 3.0% |
| 35 to 39 Minutes | 31 | 1.2% |
| 40 to 44 Minutes | 50 | 1.9% |
| 45 to 59 Minutes | 65 | 2.5% |
| 60 to 89 Minutes | 58 | 2.2% |
| 90 or more Minutes | 0 | 0.0% |
Commute Time by Sex in Sheldon
The most common commute times in Sheldon are 5 to 9 minutes (715 commuters, 44.2%) for males and 5 to 9 minutes (394 commuters, 39.8%) for females.
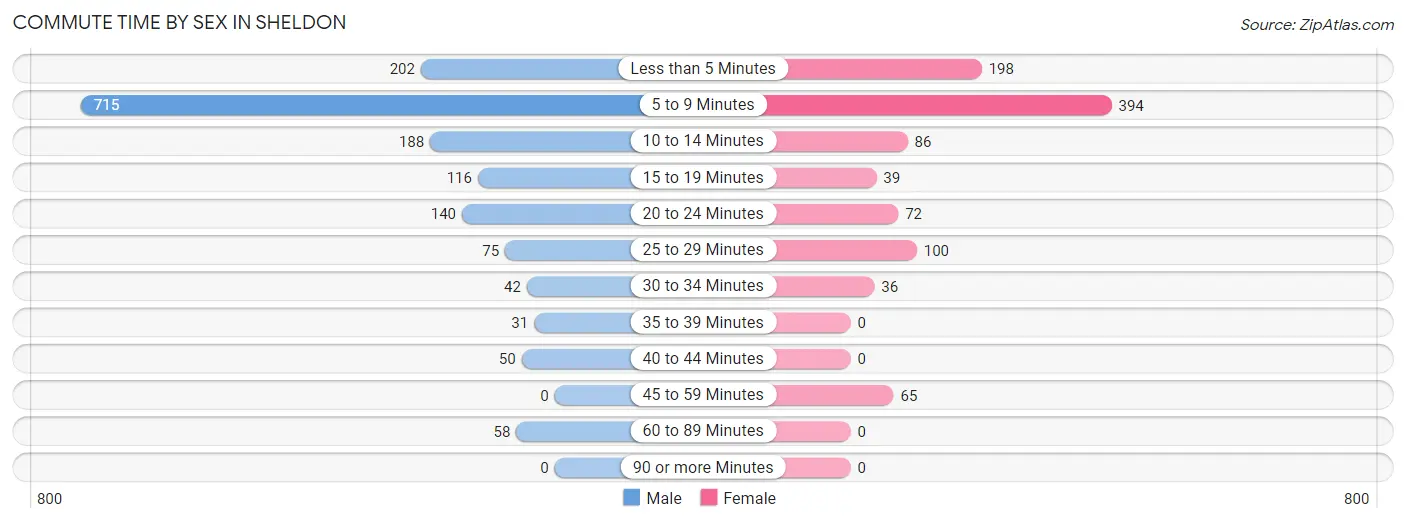
| Commute Time | Male | Female |
| Less than 5 Minutes | 202 (12.5%) | 198 (20.0%) |
| 5 to 9 Minutes | 715 (44.2%) | 394 (39.8%) |
| 10 to 14 Minutes | 188 (11.6%) | 86 (8.7%) |
| 15 to 19 Minutes | 116 (7.2%) | 39 (3.9%) |
| 20 to 24 Minutes | 140 (8.7%) | 72 (7.3%) |
| 25 to 29 Minutes | 75 (4.6%) | 100 (10.1%) |
| 30 to 34 Minutes | 42 (2.6%) | 36 (3.6%) |
| 35 to 39 Minutes | 31 (1.9%) | 0 (0.0%) |
| 40 to 44 Minutes | 50 (3.1%) | 0 (0.0%) |
| 45 to 59 Minutes | 0 (0.0%) | 65 (6.6%) |
| 60 to 89 Minutes | 58 (3.6%) | 0 (0.0%) |
| 90 or more Minutes | 0 (0.0%) | 0 (0.0%) |
Time of Departure to Work by Sex in Sheldon
The most frequent times of departure to work in Sheldon are 6:30 AM to 6:59 AM (331, 20.5%) for males and 7:30 AM to 7:59 AM (284, 28.7%) for females.
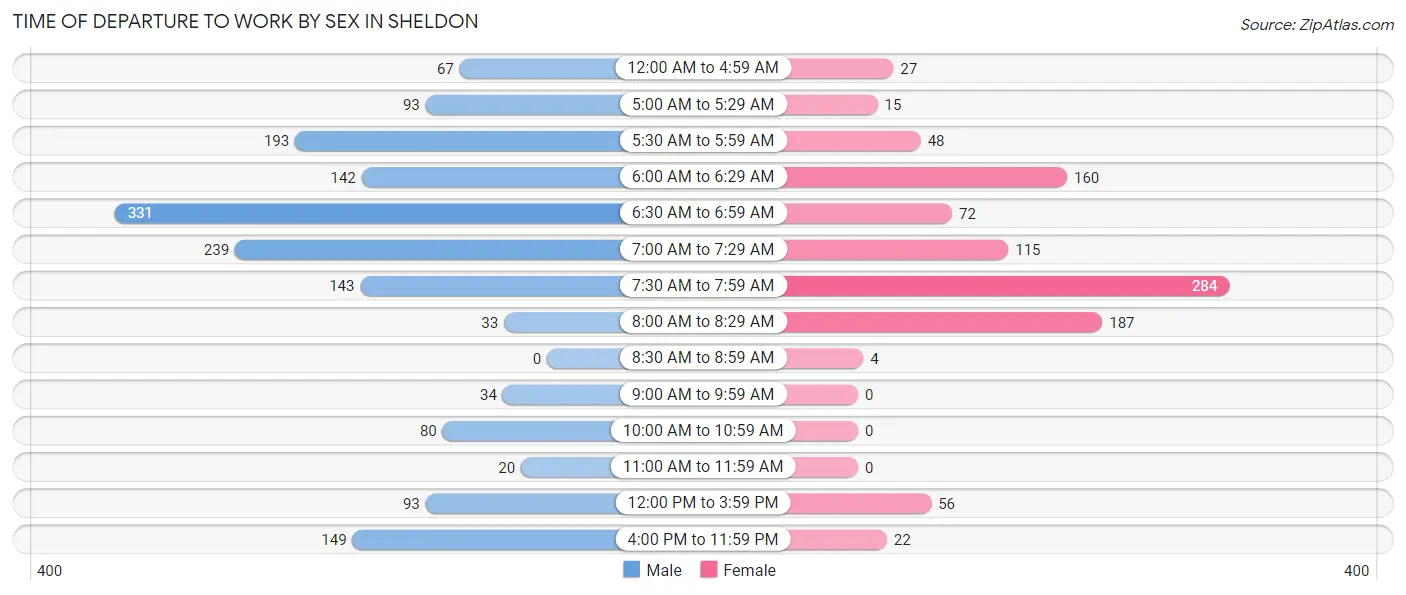
| Time of Departure | Male | Female |
| 12:00 AM to 4:59 AM | 67 (4.1%) | 27 (2.7%) |
| 5:00 AM to 5:29 AM | 93 (5.8%) | 15 (1.5%) |
| 5:30 AM to 5:59 AM | 193 (11.9%) | 48 (4.9%) |
| 6:00 AM to 6:29 AM | 142 (8.8%) | 160 (16.2%) |
| 6:30 AM to 6:59 AM | 331 (20.5%) | 72 (7.3%) |
| 7:00 AM to 7:29 AM | 239 (14.8%) | 115 (11.6%) |
| 7:30 AM to 7:59 AM | 143 (8.8%) | 284 (28.7%) |
| 8:00 AM to 8:29 AM | 33 (2.0%) | 187 (18.9%) |
| 8:30 AM to 8:59 AM | 0 (0.0%) | 4 (0.4%) |
| 9:00 AM to 9:59 AM | 34 (2.1%) | 0 (0.0%) |
| 10:00 AM to 10:59 AM | 80 (5.0%) | 0 (0.0%) |
| 11:00 AM to 11:59 AM | 20 (1.2%) | 0 (0.0%) |
| 12:00 PM to 3:59 PM | 93 (5.8%) | 56 (5.7%) |
| 4:00 PM to 11:59 PM | 149 (9.2%) | 22 (2.2%) |
| Total | 1,617 (100.0%) | 990 (100.0%) |
Housing Occupancy in Sheldon
Occupancy by Ownership in Sheldon
Of the total 2,051 dwellings in Sheldon, owner-occupied units account for 1,394 (68.0%), while renter-occupied units make up 657 (32.0%).
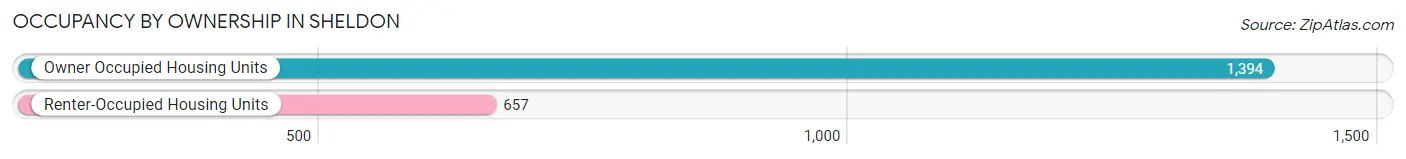
| Occupancy | # Housing Units | % Housing Units |
| Owner Occupied Housing Units | 1,394 | 68.0% |
| Renter-Occupied Housing Units | 657 | 32.0% |
| Total Occupied Housing Units | 2,051 | 100.0% |
Occupancy by Household Size in Sheldon
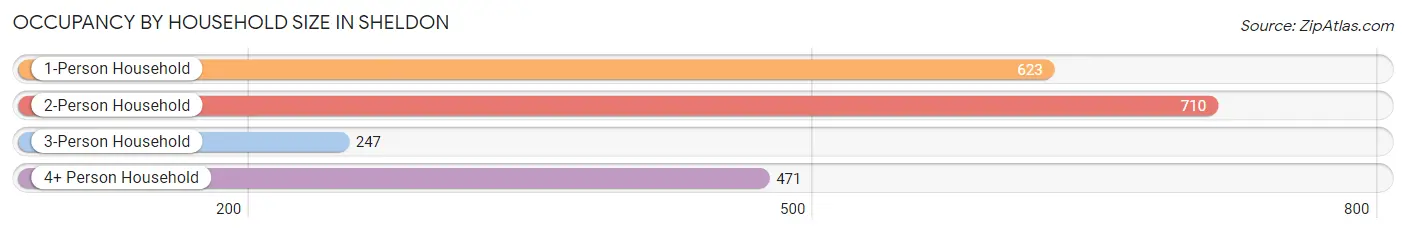
| Household Size | # Housing Units | % Housing Units |
| 1-Person Household | 623 | 30.4% |
| 2-Person Household | 710 | 34.6% |
| 3-Person Household | 247 | 12.0% |
| 4+ Person Household | 471 | 23.0% |
| Total Housing Units | 2,051 | 100.0% |
Occupancy by Ownership by Household Size in Sheldon
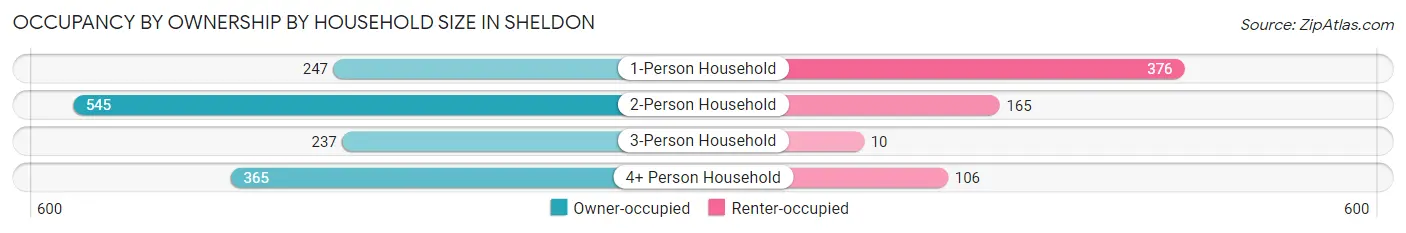
| Household Size | Owner-occupied | Renter-occupied |
| 1-Person Household | 247 (39.7%) | 376 (60.4%) |
| 2-Person Household | 545 (76.8%) | 165 (23.2%) |
| 3-Person Household | 237 (96.0%) | 10 (4.1%) |
| 4+ Person Household | 365 (77.5%) | 106 (22.5%) |
| Total Housing Units | 1,394 (68.0%) | 657 (32.0%) |
Occupancy by Educational Attainment in Sheldon
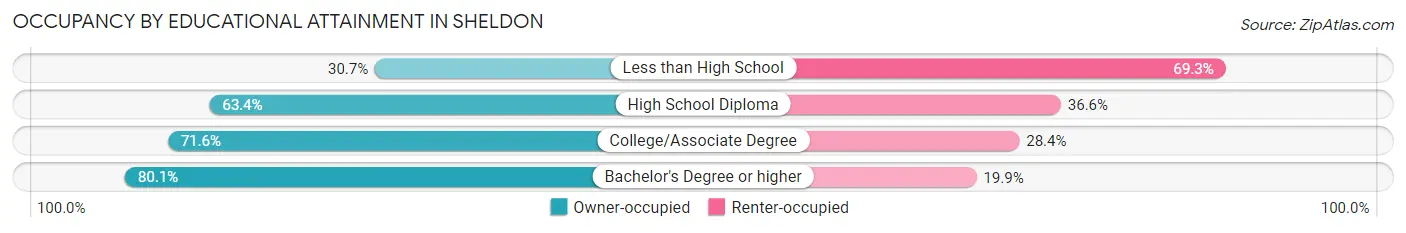
| Household Size | Owner-occupied | Renter-occupied |
| Less than High School | 47 (30.7%) | 106 (69.3%) |
| High School Diploma | 443 (63.4%) | 256 (36.6%) |
| College/Associate Degree | 477 (71.6%) | 189 (28.4%) |
| Bachelor's Degree or higher | 427 (80.1%) | 106 (19.9%) |
Occupancy by Age of Householder in Sheldon
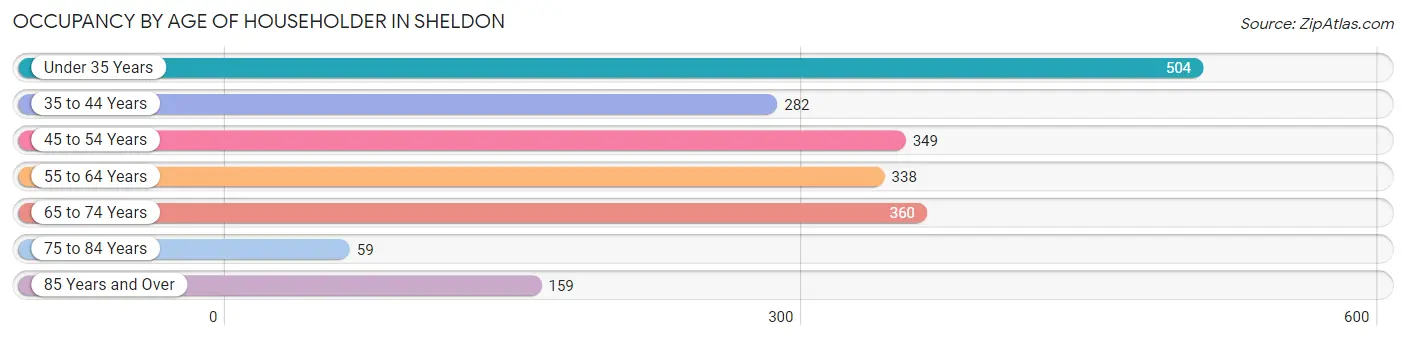
| Age Bracket | # Households | % Households |
| Under 35 Years | 504 | 24.6% |
| 35 to 44 Years | 282 | 13.8% |
| 45 to 54 Years | 349 | 17.0% |
| 55 to 64 Years | 338 | 16.5% |
| 65 to 74 Years | 360 | 17.5% |
| 75 to 84 Years | 59 | 2.9% |
| 85 Years and Over | 159 | 7.7% |
| Total | 2,051 | 100.0% |
Housing Finances in Sheldon
Median Income by Occupancy in Sheldon
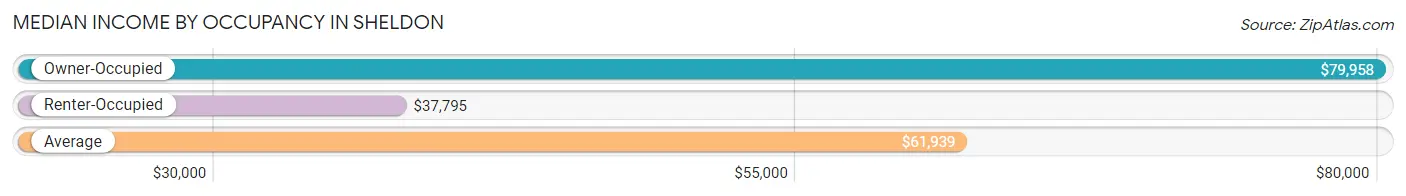
| Occupancy Type | # Households | Median Income |
| Owner-Occupied | 1,394 (68.0%) | $79,958 |
| Renter-Occupied | 657 (32.0%) | $37,795 |
| Average | 2,051 (100.0%) | $61,939 |
Occupancy by Householder Income Bracket in Sheldon
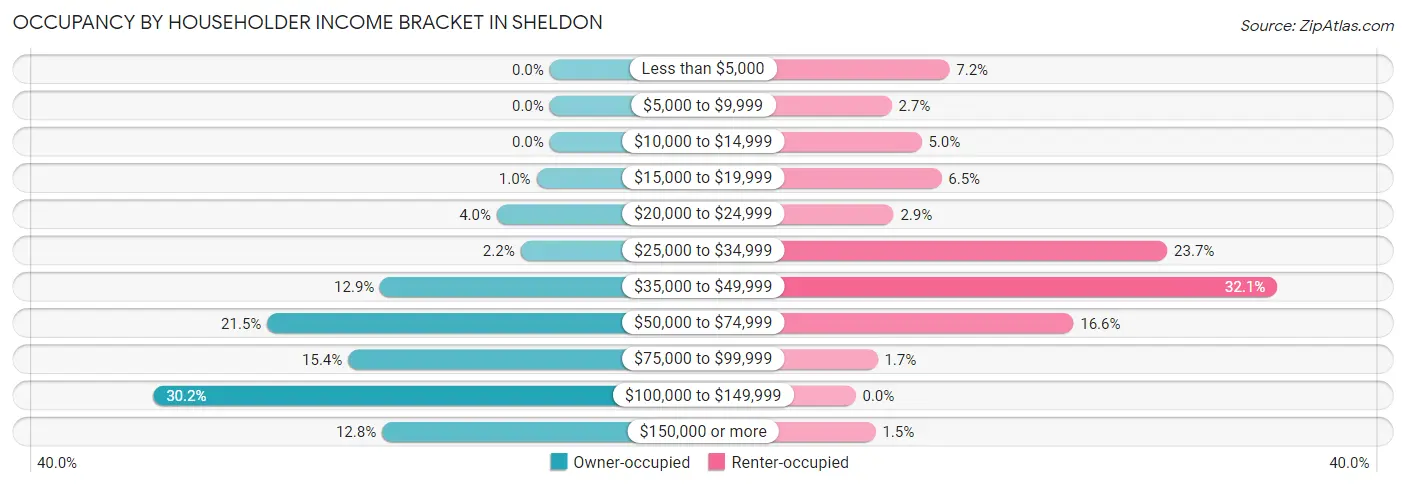
| Income Bracket | Owner-occupied | Renter-occupied |
| Less than $5,000 | 0 (0.0%) | 47 (7.1%) |
| $5,000 to $9,999 | 0 (0.0%) | 18 (2.7%) |
| $10,000 to $14,999 | 0 (0.0%) | 33 (5.0%) |
| $15,000 to $19,999 | 14 (1.0%) | 43 (6.5%) |
| $20,000 to $24,999 | 56 (4.0%) | 19 (2.9%) |
| $25,000 to $34,999 | 31 (2.2%) | 156 (23.7%) |
| $35,000 to $49,999 | 180 (12.9%) | 211 (32.1%) |
| $50,000 to $74,999 | 300 (21.5%) | 109 (16.6%) |
| $75,000 to $99,999 | 214 (15.3%) | 11 (1.7%) |
| $100,000 to $149,999 | 421 (30.2%) | 0 (0.0%) |
| $150,000 or more | 178 (12.8%) | 10 (1.5%) |
| Total | 1,394 (100.0%) | 657 (100.0%) |
Monthly Housing Cost Tiers in Sheldon
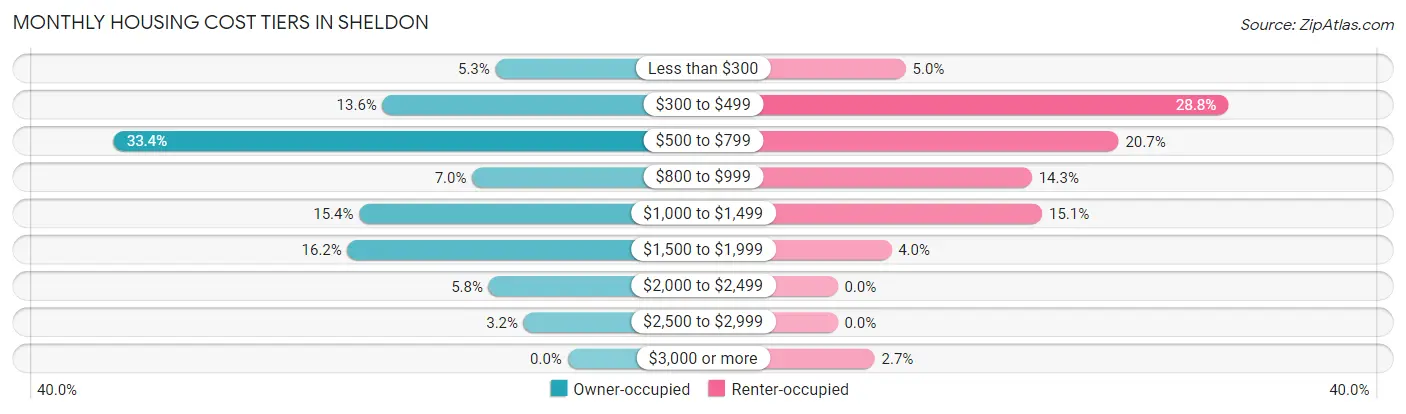
| Monthly Cost | Owner-occupied | Renter-occupied |
| Less than $300 | 74 (5.3%) | 33 (5.0%) |
| $300 to $499 | 190 (13.6%) | 189 (28.8%) |
| $500 to $799 | 466 (33.4%) | 136 (20.7%) |
| $800 to $999 | 98 (7.0%) | 94 (14.3%) |
| $1,000 to $1,499 | 214 (15.3%) | 99 (15.1%) |
| $1,500 to $1,999 | 226 (16.2%) | 26 (4.0%) |
| $2,000 to $2,499 | 81 (5.8%) | 0 (0.0%) |
| $2,500 to $2,999 | 45 (3.2%) | 0 (0.0%) |
| $3,000 or more | 0 (0.0%) | 18 (2.7%) |
| Total | 1,394 (100.0%) | 657 (100.0%) |
Physical Housing Characteristics in Sheldon
Housing Structures in Sheldon
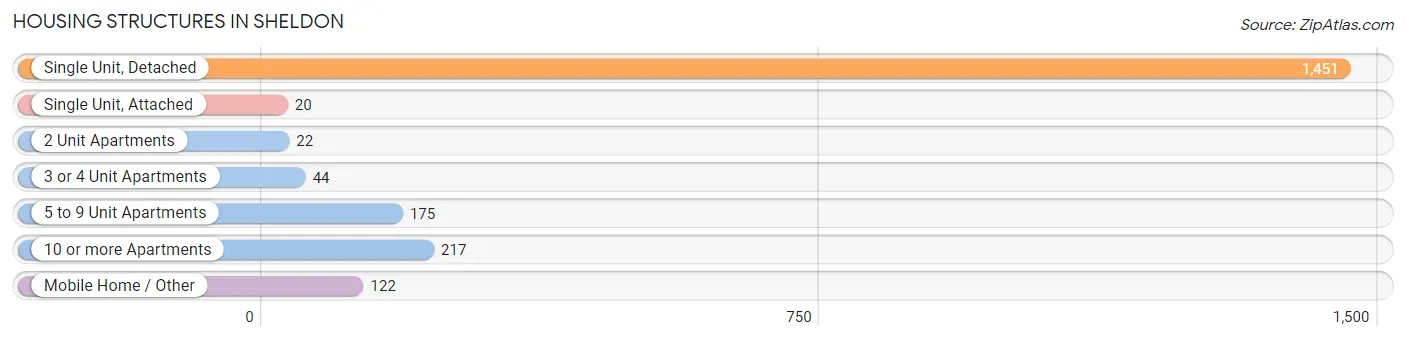
| Structure Type | # Housing Units | % Housing Units |
| Single Unit, Detached | 1,451 | 70.8% |
| Single Unit, Attached | 20 | 1.0% |
| 2 Unit Apartments | 22 | 1.1% |
| 3 or 4 Unit Apartments | 44 | 2.1% |
| 5 to 9 Unit Apartments | 175 | 8.5% |
| 10 or more Apartments | 217 | 10.6% |
| Mobile Home / Other | 122 | 5.9% |
| Total | 2,051 | 100.0% |
Housing Structures by Occupancy in Sheldon
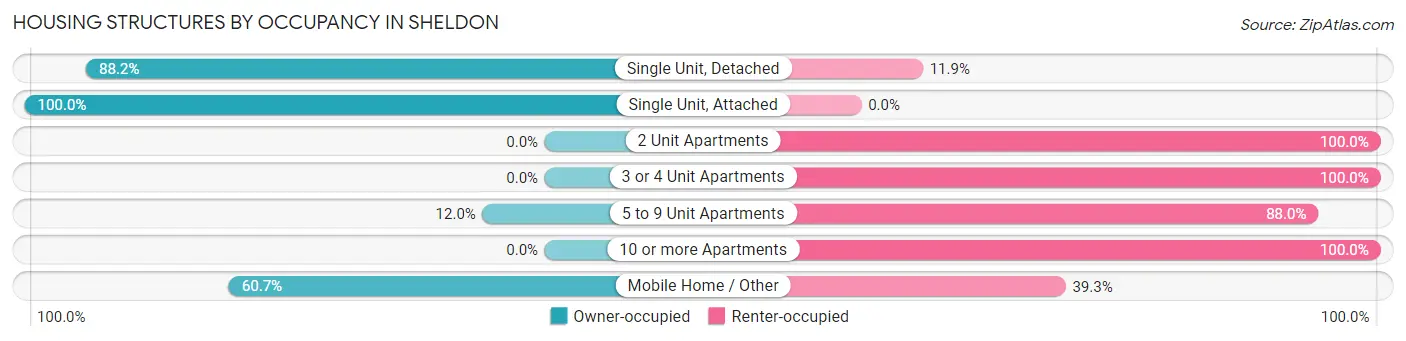
| Structure Type | Owner-occupied | Renter-occupied |
| Single Unit, Detached | 1,279 (88.1%) | 172 (11.8%) |
| Single Unit, Attached | 20 (100.0%) | 0 (0.0%) |
| 2 Unit Apartments | 0 (0.0%) | 22 (100.0%) |
| 3 or 4 Unit Apartments | 0 (0.0%) | 44 (100.0%) |
| 5 to 9 Unit Apartments | 21 (12.0%) | 154 (88.0%) |
| 10 or more Apartments | 0 (0.0%) | 217 (100.0%) |
| Mobile Home / Other | 74 (60.7%) | 48 (39.3%) |
| Total | 1,394 (68.0%) | 657 (32.0%) |
Housing Structures by Number of Rooms in Sheldon
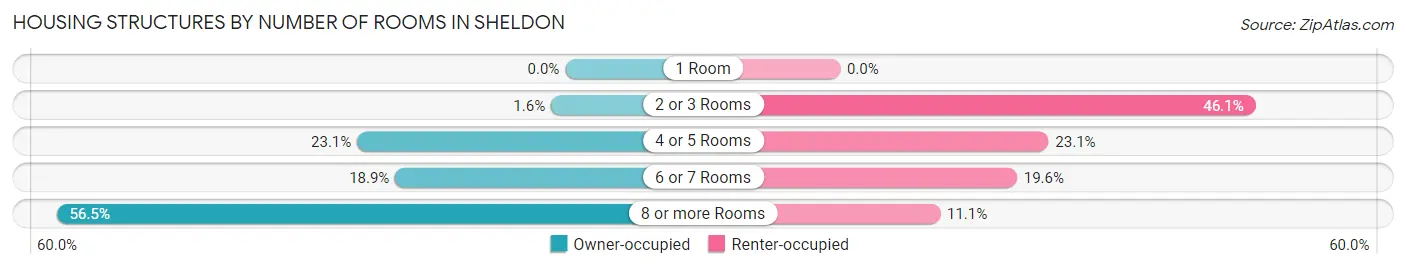
| Number of Rooms | Owner-occupied | Renter-occupied |
| 1 Room | 0 (0.0%) | 0 (0.0%) |
| 2 or 3 Rooms | 22 (1.6%) | 303 (46.1%) |
| 4 or 5 Rooms | 322 (23.1%) | 152 (23.1%) |
| 6 or 7 Rooms | 263 (18.9%) | 129 (19.6%) |
| 8 or more Rooms | 787 (56.5%) | 73 (11.1%) |
| Total | 1,394 (100.0%) | 657 (100.0%) |
Housing Structure by Heating Type in Sheldon
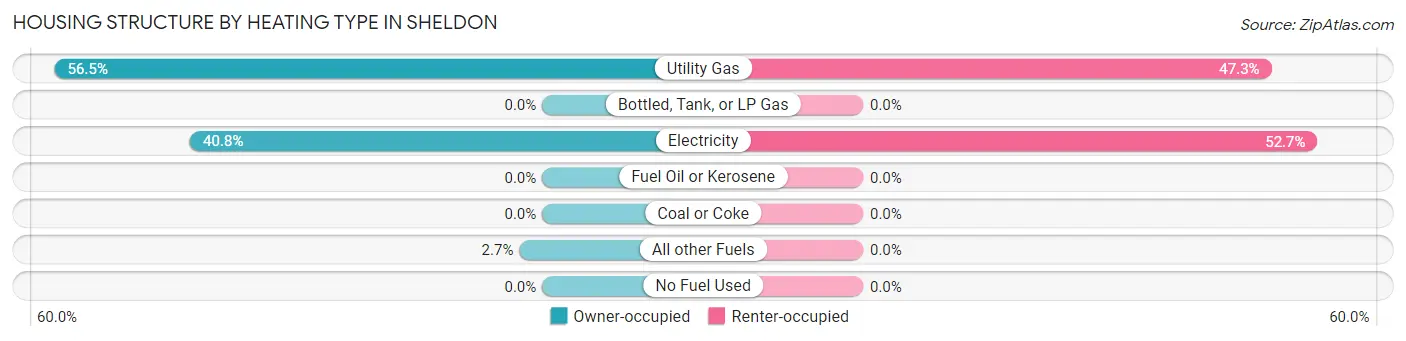
| Heating Type | Owner-occupied | Renter-occupied |
| Utility Gas | 788 (56.5%) | 311 (47.3%) |
| Bottled, Tank, or LP Gas | 0 (0.0%) | 0 (0.0%) |
| Electricity | 569 (40.8%) | 346 (52.7%) |
| Fuel Oil or Kerosene | 0 (0.0%) | 0 (0.0%) |
| Coal or Coke | 0 (0.0%) | 0 (0.0%) |
| All other Fuels | 37 (2.6%) | 0 (0.0%) |
| No Fuel Used | 0 (0.0%) | 0 (0.0%) |
| Total | 1,394 (100.0%) | 657 (100.0%) |
Household Vehicle Usage in Sheldon
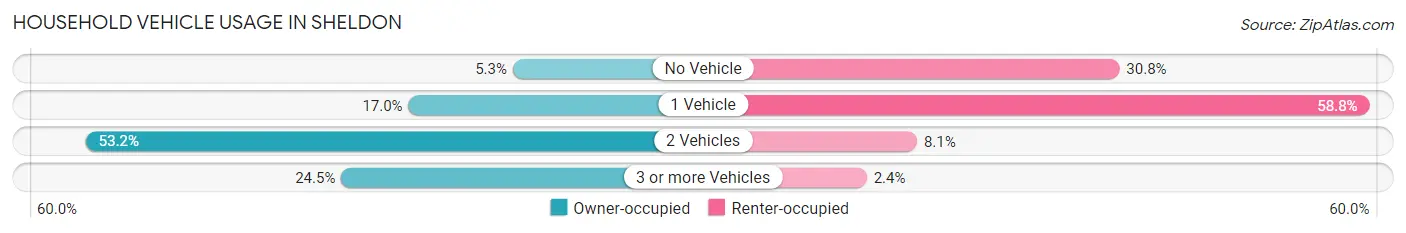
| Vehicles per Household | Owner-occupied | Renter-occupied |
| No Vehicle | 74 (5.3%) | 202 (30.7%) |
| 1 Vehicle | 237 (17.0%) | 386 (58.8%) |
| 2 Vehicles | 741 (53.2%) | 53 (8.1%) |
| 3 or more Vehicles | 342 (24.5%) | 16 (2.4%) |
| Total | 1,394 (100.0%) | 657 (100.0%) |
Real Estate & Mortgages in Sheldon
Real Estate and Mortgage Overview in Sheldon
| Characteristic | Without Mortgage | With Mortgage |
| Housing Units | 602 | 792 |
| Median Property Value | $134,000 | $169,600 |
| Median Household Income | $77,635 | $116 |
| Monthly Housing Costs | $555 | $0 |
| Real Estate Taxes | $2,205 | $0 |
Property Value by Mortgage Status in Sheldon
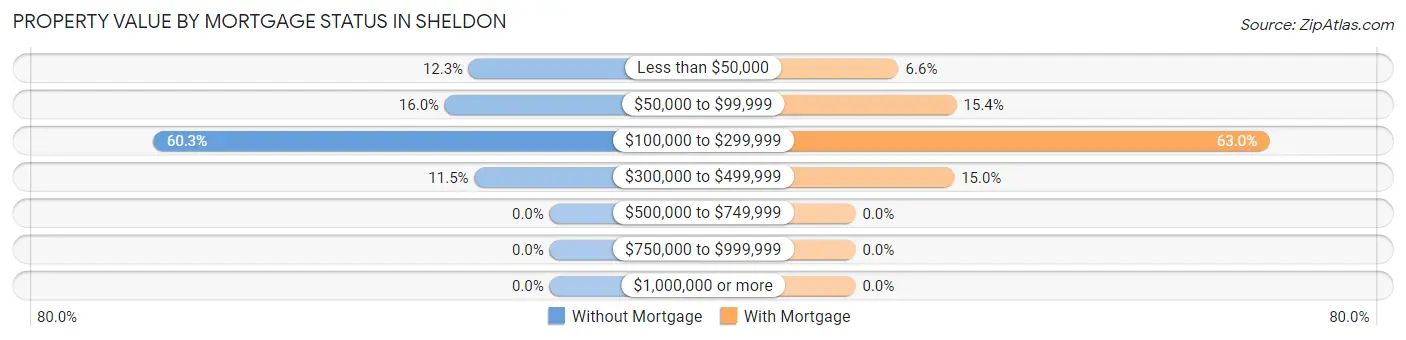
| Property Value | Without Mortgage | With Mortgage |
| Less than $50,000 | 74 (12.3%) | 52 (6.6%) |
| $50,000 to $99,999 | 96 (16.0%) | 122 (15.4%) |
| $100,000 to $299,999 | 363 (60.3%) | 499 (63.0%) |
| $300,000 to $499,999 | 69 (11.5%) | 119 (15.0%) |
| $500,000 to $749,999 | 0 (0.0%) | 0 (0.0%) |
| $750,000 to $999,999 | 0 (0.0%) | 0 (0.0%) |
| $1,000,000 or more | 0 (0.0%) | 0 (0.0%) |
| Total | 602 (100.0%) | 792 (100.0%) |
Household Income by Mortgage Status in Sheldon
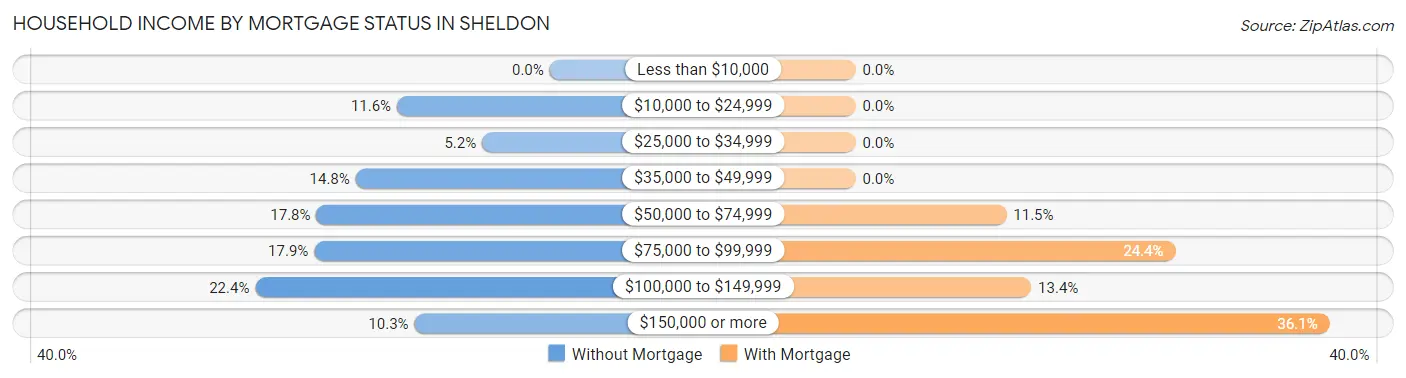
| Household Income | Without Mortgage | With Mortgage |
| Less than $10,000 | 0 (0.0%) | 0 (0.0%) |
| $10,000 to $24,999 | 70 (11.6%) | 0 (0.0%) |
| $25,000 to $34,999 | 31 (5.1%) | 0 (0.0%) |
| $35,000 to $49,999 | 89 (14.8%) | 0 (0.0%) |
| $50,000 to $74,999 | 107 (17.8%) | 91 (11.5%) |
| $75,000 to $99,999 | 108 (17.9%) | 193 (24.4%) |
| $100,000 to $149,999 | 135 (22.4%) | 106 (13.4%) |
| $150,000 or more | 62 (10.3%) | 286 (36.1%) |
| Total | 602 (100.0%) | 792 (100.0%) |
Property Value to Household Income Ratio in Sheldon
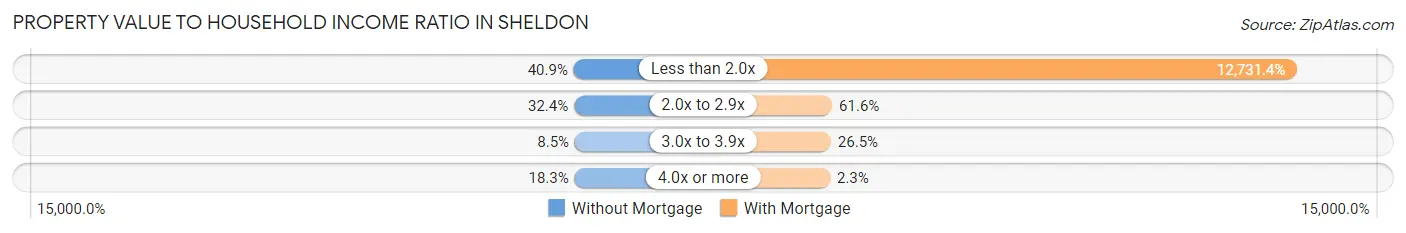
| Value-to-Income Ratio | Without Mortgage | With Mortgage |
| Less than 2.0x | 246 (40.9%) | 100,833 (12,731.4%) |
| 2.0x to 2.9x | 195 (32.4%) | 488 (61.6%) |
| 3.0x to 3.9x | 51 (8.5%) | 210 (26.5%) |
| 4.0x or more | 110 (18.3%) | 18 (2.3%) |
| Total | 602 (100.0%) | 792 (100.0%) |
Real Estate Taxes by Mortgage Status in Sheldon
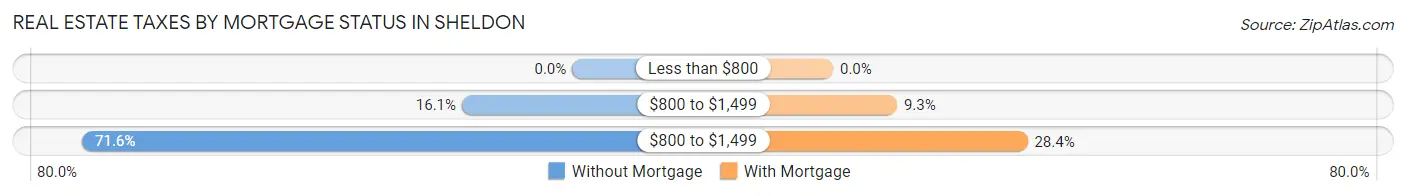
| Property Taxes | Without Mortgage | With Mortgage |
| Less than $800 | 0 (0.0%) | 0 (0.0%) |
| $800 to $1,499 | 97 (16.1%) | 74 (9.3%) |
| $800 to $1,499 | 431 (71.6%) | 225 (28.4%) |
| Total | 602 (100.0%) | 792 (100.0%) |
Health & Disability in Sheldon
Health Insurance Coverage by Age in Sheldon
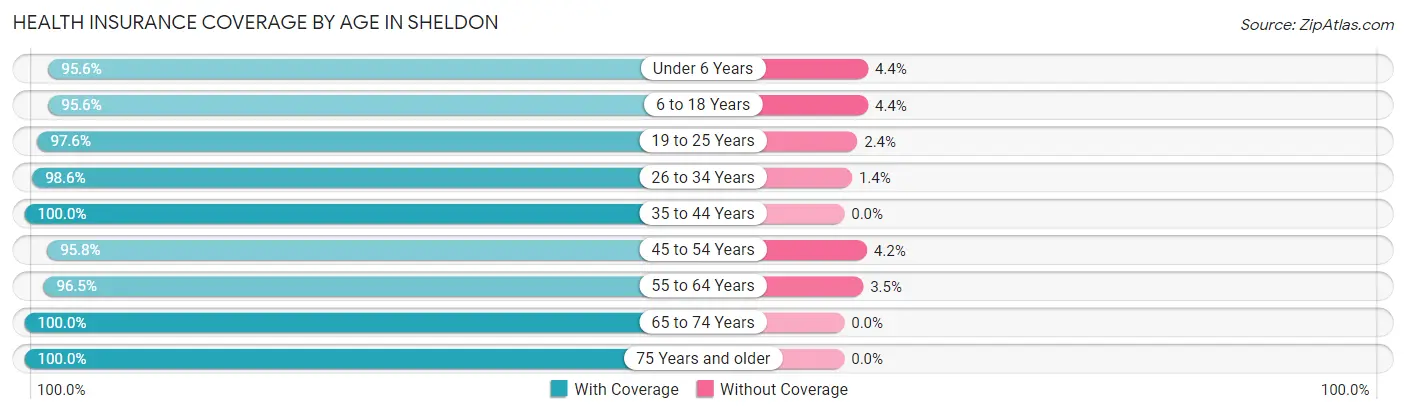
| Age Bracket | With Coverage | Without Coverage |
| Under 6 Years | 476 (95.6%) | 22 (4.4%) |
| 6 to 18 Years | 799 (95.6%) | 37 (4.4%) |
| 19 to 25 Years | 404 (97.6%) | 10 (2.4%) |
| 26 to 34 Years | 758 (98.6%) | 11 (1.4%) |
| 35 to 44 Years | 790 (100.0%) | 0 (0.0%) |
| 45 to 54 Years | 499 (95.8%) | 22 (4.2%) |
| 55 to 64 Years | 629 (96.5%) | 23 (3.5%) |
| 65 to 74 Years | 574 (100.0%) | 0 (0.0%) |
| 75 Years and older | 312 (100.0%) | 0 (0.0%) |
| Total | 5,241 (97.7%) | 125 (2.3%) |
Health Insurance Coverage by Citizenship Status in Sheldon
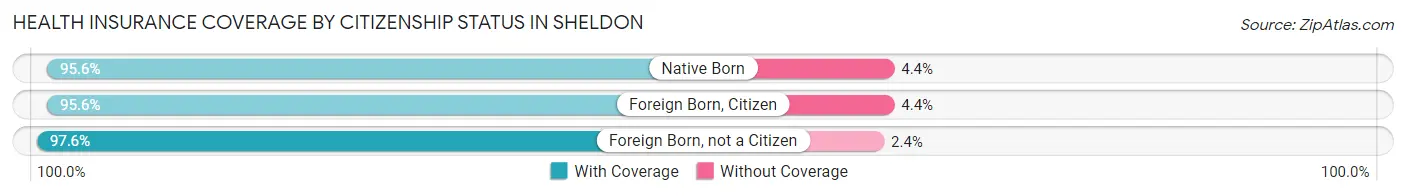
| Citizenship Status | With Coverage | Without Coverage |
| Native Born | 476 (95.6%) | 22 (4.4%) |
| Foreign Born, Citizen | 799 (95.6%) | 37 (4.4%) |
| Foreign Born, not a Citizen | 404 (97.6%) | 10 (2.4%) |
Health Insurance Coverage by Household Income in Sheldon

| Household Income | With Coverage | Without Coverage |
| Under $25,000 | 407 (91.7%) | 37 (8.3%) |
| $25,000 to $49,999 | 1,280 (98.2%) | 23 (1.8%) |
| $50,000 to $74,999 | 963 (97.8%) | 22 (2.2%) |
| $75,000 to $99,999 | 525 (100.0%) | 0 (0.0%) |
| $100,000 and over | 1,832 (97.7%) | 43 (2.3%) |
Public vs Private Health Insurance Coverage by Age in Sheldon
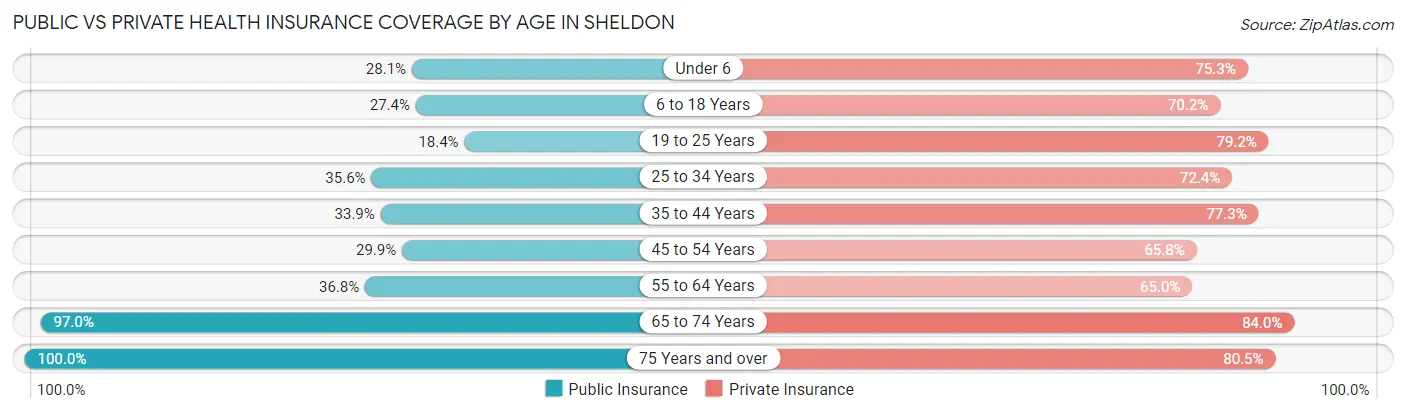
| Age Bracket | Public Insurance | Private Insurance |
| Under 6 | 140 (28.1%) | 375 (75.3%) |
| 6 to 18 Years | 229 (27.4%) | 587 (70.2%) |
| 19 to 25 Years | 76 (18.4%) | 328 (79.2%) |
| 25 to 34 Years | 274 (35.6%) | 557 (72.4%) |
| 35 to 44 Years | 268 (33.9%) | 611 (77.3%) |
| 45 to 54 Years | 156 (29.9%) | 343 (65.8%) |
| 55 to 64 Years | 240 (36.8%) | 424 (65.0%) |
| 65 to 74 Years | 557 (97.0%) | 482 (84.0%) |
| 75 Years and over | 312 (100.0%) | 251 (80.4%) |
| Total | 2,252 (42.0%) | 3,958 (73.8%) |
Disability Status by Sex by Age in Sheldon
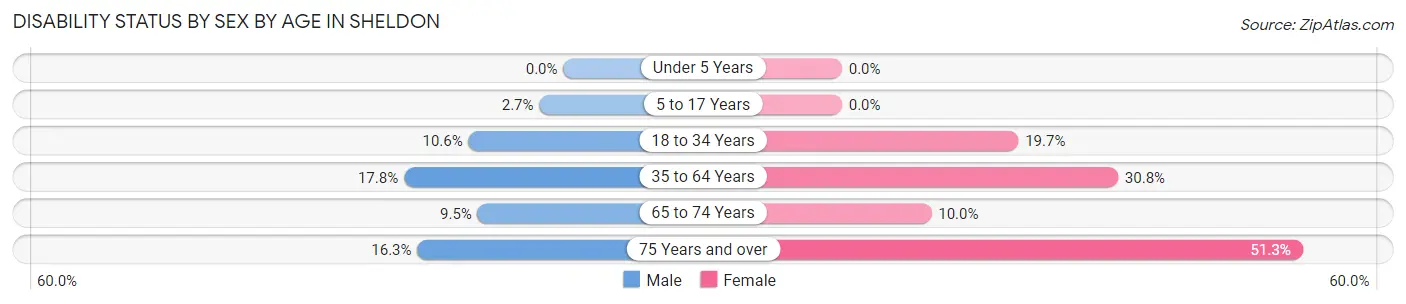
| Age Bracket | Male | Female |
| Under 5 Years | 0 (0.0%) | 0 (0.0%) |
| 5 to 17 Years | 10 (2.7%) | 0 (0.0%) |
| 18 to 34 Years | 76 (10.6%) | 112 (19.7%) |
| 35 to 64 Years | 188 (17.7%) | 278 (30.7%) |
| 65 to 74 Years | 27 (9.5%) | 29 (10.0%) |
| 75 Years and over | 20 (16.3%) | 97 (51.3%) |
Disability Class by Sex by Age in Sheldon
Disability Class: Hearing Difficulty
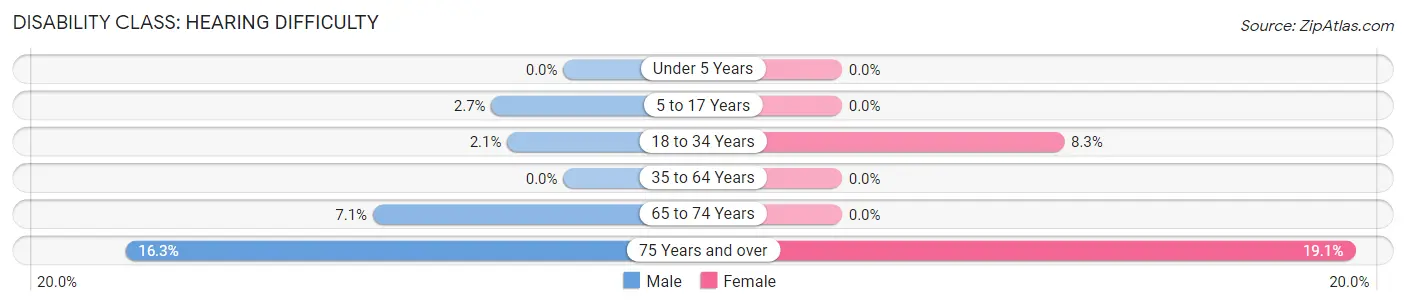
| Age Bracket | Male | Female |
| Under 5 Years | 0 (0.0%) | 0 (0.0%) |
| 5 to 17 Years | 10 (2.7%) | 0 (0.0%) |
| 18 to 34 Years | 15 (2.1%) | 47 (8.3%) |
| 35 to 64 Years | 0 (0.0%) | 0 (0.0%) |
| 65 to 74 Years | 20 (7.1%) | 0 (0.0%) |
| 75 Years and over | 20 (16.3%) | 36 (19.1%) |
Disability Class: Vision Difficulty
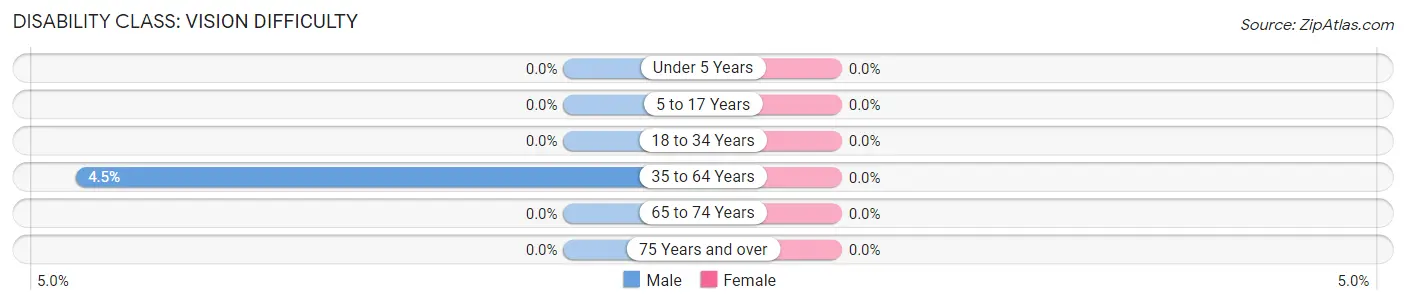
| Age Bracket | Male | Female |
| Under 5 Years | 0 (0.0%) | 0 (0.0%) |
| 5 to 17 Years | 0 (0.0%) | 0 (0.0%) |
| 18 to 34 Years | 0 (0.0%) | 0 (0.0%) |
| 35 to 64 Years | 48 (4.5%) | 0 (0.0%) |
| 65 to 74 Years | 0 (0.0%) | 0 (0.0%) |
| 75 Years and over | 0 (0.0%) | 0 (0.0%) |
Disability Class: Cognitive Difficulty
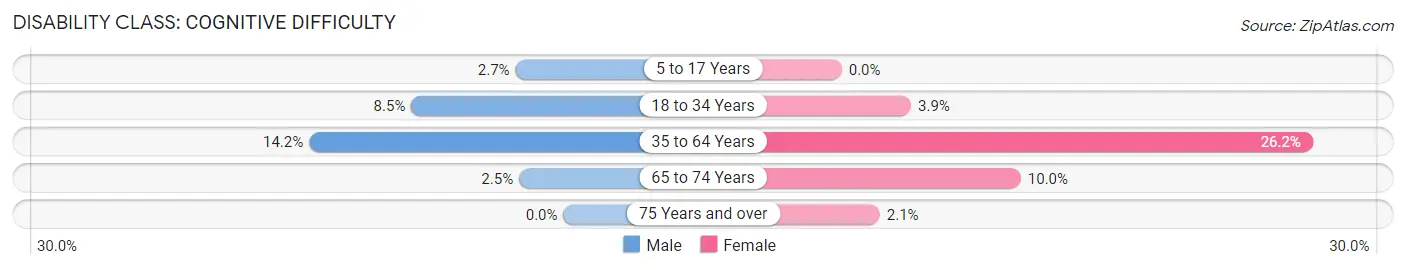
| Age Bracket | Male | Female |
| 5 to 17 Years | 10 (2.7%) | 0 (0.0%) |
| 18 to 34 Years | 61 (8.5%) | 22 (3.9%) |
| 35 to 64 Years | 150 (14.2%) | 237 (26.2%) |
| 65 to 74 Years | 7 (2.5%) | 29 (10.0%) |
| 75 Years and over | 0 (0.0%) | 4 (2.1%) |
Disability Class: Ambulatory Difficulty
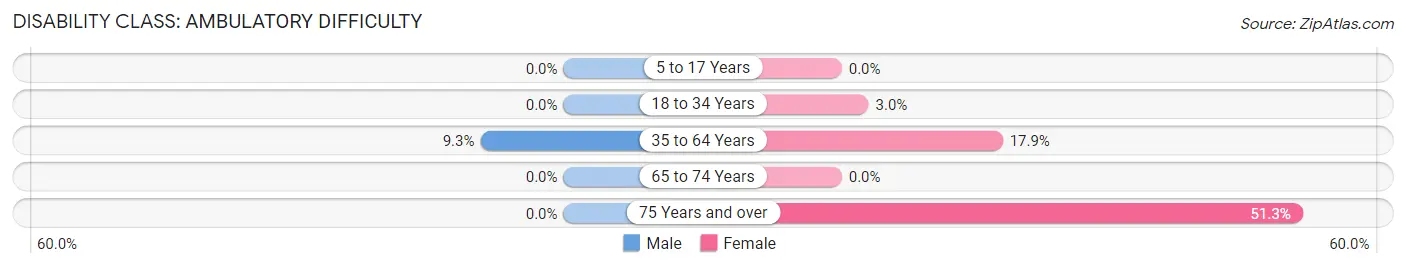
| Age Bracket | Male | Female |
| 5 to 17 Years | 0 (0.0%) | 0 (0.0%) |
| 18 to 34 Years | 0 (0.0%) | 17 (3.0%) |
| 35 to 64 Years | 98 (9.2%) | 162 (17.9%) |
| 65 to 74 Years | 0 (0.0%) | 0 (0.0%) |
| 75 Years and over | 0 (0.0%) | 97 (51.3%) |
Disability Class: Self-Care Difficulty
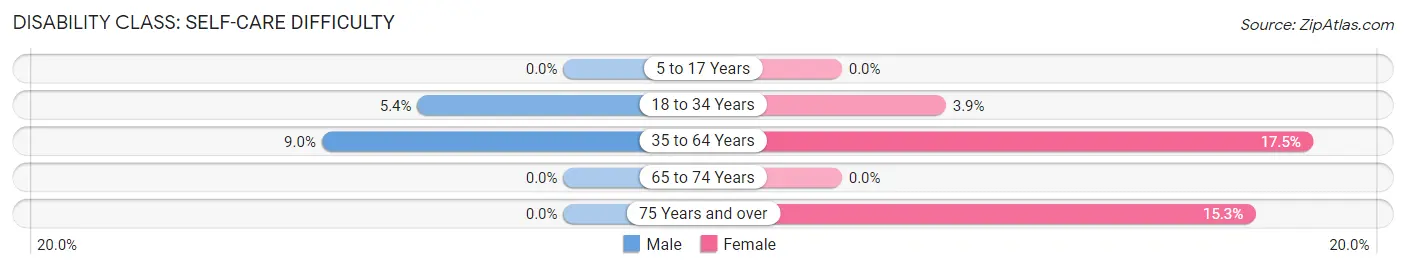
| Age Bracket | Male | Female |
| 5 to 17 Years | 0 (0.0%) | 0 (0.0%) |
| 18 to 34 Years | 39 (5.4%) | 22 (3.9%) |
| 35 to 64 Years | 95 (9.0%) | 158 (17.5%) |
| 65 to 74 Years | 0 (0.0%) | 0 (0.0%) |
| 75 Years and over | 0 (0.0%) | 29 (15.3%) |
Technology Access in Sheldon
Computing Device Access in Sheldon
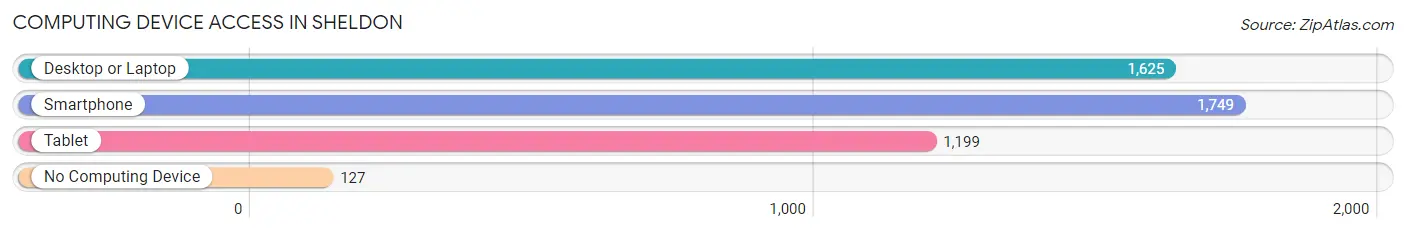
| Device Type | # Households | % Households |
| Desktop or Laptop | 1,625 | 79.2% |
| Smartphone | 1,749 | 85.3% |
| Tablet | 1,199 | 58.5% |
| No Computing Device | 127 | 6.2% |
| Total | 2,051 | 100.0% |
Internet Access in Sheldon
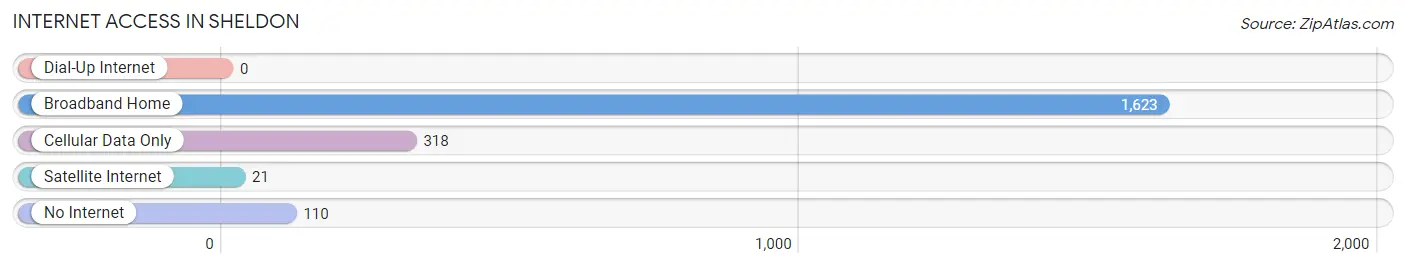
| Internet Type | # Households | % Households |
| Dial-Up Internet | 0 | 0.0% |
| Broadband Home | 1,623 | 79.1% |
| Cellular Data Only | 318 | 15.5% |
| Satellite Internet | 21 | 1.0% |
| No Internet | 110 | 5.4% |
| Total | 2,051 | 100.0% |
Sheldon Summary
Sheldon, Iowa is a small city located in the northwest corner of the state, in O’Brien County. It is situated on the Big Sioux River, and is the county seat. The city has a population of approximately 5,000 people, and is part of the Sioux City metropolitan area.
History
The area that is now Sheldon was first settled in 1871, when a group of settlers from Wisconsin arrived and established a small settlement. The settlement was named after the nearby Big Sioux River, which was named after the Sioux Indians who had once lived in the area. The settlers built a sawmill and a gristmill, and the town began to grow.
In 1873, the town was officially incorporated as Sheldon, and the first post office was established. The town continued to grow, and by 1880, it had a population of over 500 people.
In the late 19th century, Sheldon became a major center for the lumber industry, and the town was home to several sawmills and lumber yards. The town also had a thriving agricultural industry, and was home to several grain elevators and other agricultural businesses.
In the early 20th century, Sheldon began to diversify its economy, and the town became home to several manufacturing businesses, including a furniture factory, a canning factory, and a brickyard. The town also had a thriving retail sector, and was home to several stores and shops.
Geography
Sheldon is located in the northwest corner of Iowa, in O’Brien County. It is situated on the Big Sioux River, and is the county seat. The city has a total area of 4.2 square miles, all of which is land.
The city is located in a flat, open area, and is surrounded by farmland. The Big Sioux River runs through the city, and there are several small lakes and ponds in the area.
Economy
Sheldon’s economy is largely based on agriculture and manufacturing. The city is home to several grain elevators and other agricultural businesses, as well as several manufacturing businesses, including a furniture factory, a canning factory, and a brickyard.
The city also has a thriving retail sector, and is home to several stores and shops. The city is also home to several banks and other financial institutions.
Demographics
As of the 2010 census, Sheldon had a population of 5,093 people. The racial makeup of the city was 95.3% White, 0.7% African American, 0.3% Native American, 0.5% Asian, 0.1% Pacific Islander, 1.7% from other races, and 1.4% from two or more races. Hispanic or Latino of any race were 3.2% of the population.
The median household income in Sheldon was $41,944, and the median family income was $50,917. The per capita income in the city was $20,845. About 8.3% of families and 11.2% of the population were below the poverty line, including 15.2% of those under age 18 and 8.2% of those age 65 or over.
Common Questions
What is Per Capita Income in Sheldon?
Per Capita income in Sheldon is $29,944.
What is the Median Family Income in Sheldon?
Median Family Income in Sheldon is $95,438.
What is the Median Household income in Sheldon?
Median Household Income in Sheldon is $61,939.
What is Income or Wage Gap in Sheldon?
Income or Wage Gap in Sheldon is 46.2%.
Women in Sheldon earn 53.8 cents for every dollar earned by a man.
What is Inequality or Gini Index in Sheldon?
Inequality or Gini Index in Sheldon is 0.35.
What is the Total Population of Sheldon?
Total Population of Sheldon is 5,417.
What is the Total Male Population of Sheldon?
Total Male Population of Sheldon is 2,739.
What is the Total Female Population of Sheldon?
Total Female Population of Sheldon is 2,678.
What is the Ratio of Males per 100 Females in Sheldon?
There are 102.28 Males per 100 Females in Sheldon.
What is the Ratio of Females per 100 Males in Sheldon?
There are 97.77 Females per 100 Males in Sheldon.
What is the Median Population Age in Sheldon?
Median Population Age in Sheldon is 37.5 Years.
What is the Average Family Size in Sheldon
Average Family Size in Sheldon is 3.0 People.
What is the Average Household Size in Sheldon
Average Household Size in Sheldon is 2.5 People.
How Large is the Labor Force in Sheldon?
There are 2,872 People in the Labor Forcein in Sheldon.
What is the Percentage of People in the Labor Force in Sheldon?
67.0% of People are in the Labor Force in Sheldon.
What is the Unemployment Rate in Sheldon?
Unemployment Rate in Sheldon is 1.5%.