Star City, WV Map & Demographics
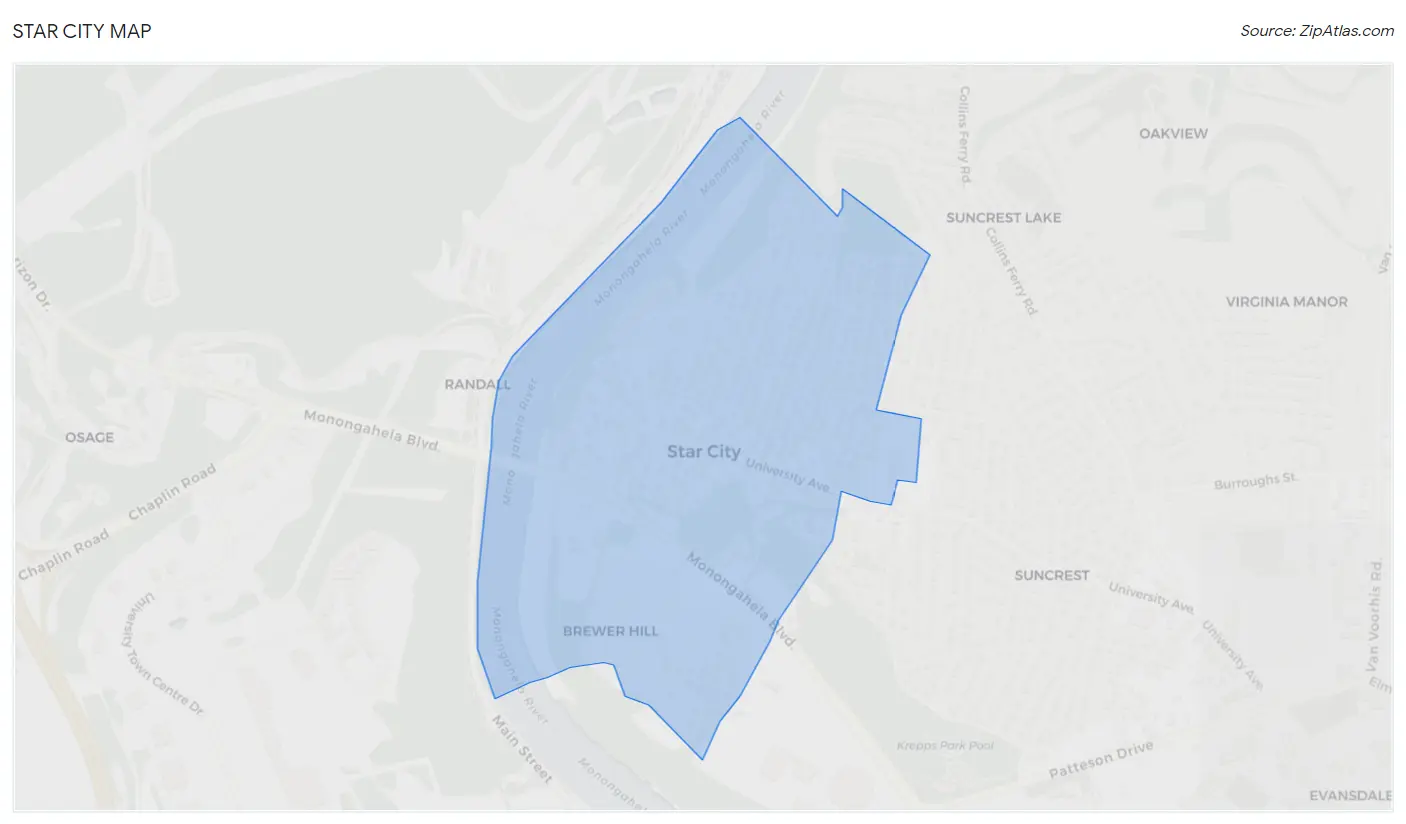
Star City Map
Star City Overview
$38,837
PER CAPITA INCOME
$91,680
AVG FAMILY INCOME
$69,063
AVG HOUSEHOLD INCOME
9.0%
WAGE / INCOME GAP [ % ]
91.0¢/ $1
WAGE / INCOME GAP [ $ ]
0.40
INEQUALITY / GINI INDEX
2,167
TOTAL POPULATION
1,182
MALE POPULATION
985
FEMALE POPULATION
120.00
MALES / 100 FEMALES
83.33
FEMALES / 100 MALES
33.8
MEDIAN AGE
2.8
AVG FAMILY SIZE
2.1
AVG HOUSEHOLD SIZE
1,376
LABOR FORCE [ PEOPLE ]
68.4%
PERCENT IN LABOR FORCE
1.0%
UNEMPLOYMENT RATE
Income in Star City
Income Overview in Star City
Per Capita Income in Star City is $38,837, while median incomes of families and households are $91,680 and $69,063 respectively.
| Characteristic | Number | Measure |
| Per Capita Income | 2,167 | $38,837 |
| Median Family Income | 436 | $91,680 |
| Mean Family Income | 436 | $103,364 |
| Median Household Income | 1,032 | $69,063 |
| Mean Household Income | 1,032 | $80,798 |
| Income Deficit | 436 | $0 |
| Wage / Income Gap (%) | 2,167 | 9.04% |
| Wage / Income Gap ($) | 2,167 | 90.96¢ per $1 |
| Gini / Inequality Index | 2,167 | 0.40 |
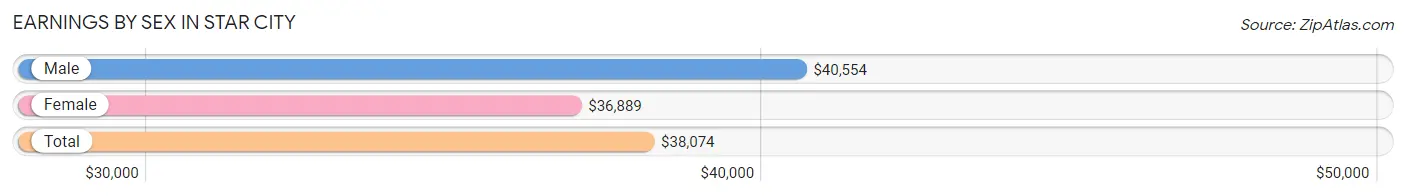
Earnings by Sex in Star City
Average Earnings in Star City are $38,074, $40,554 for men and $36,889 for women, a difference of 9.0%.
| Sex | Number | Average Earnings |
| Male | 779 (53.0%) | $40,554 |
| Female | 692 (47.0%) | $36,889 |
| Total | 1,471 (100.0%) | $38,074 |
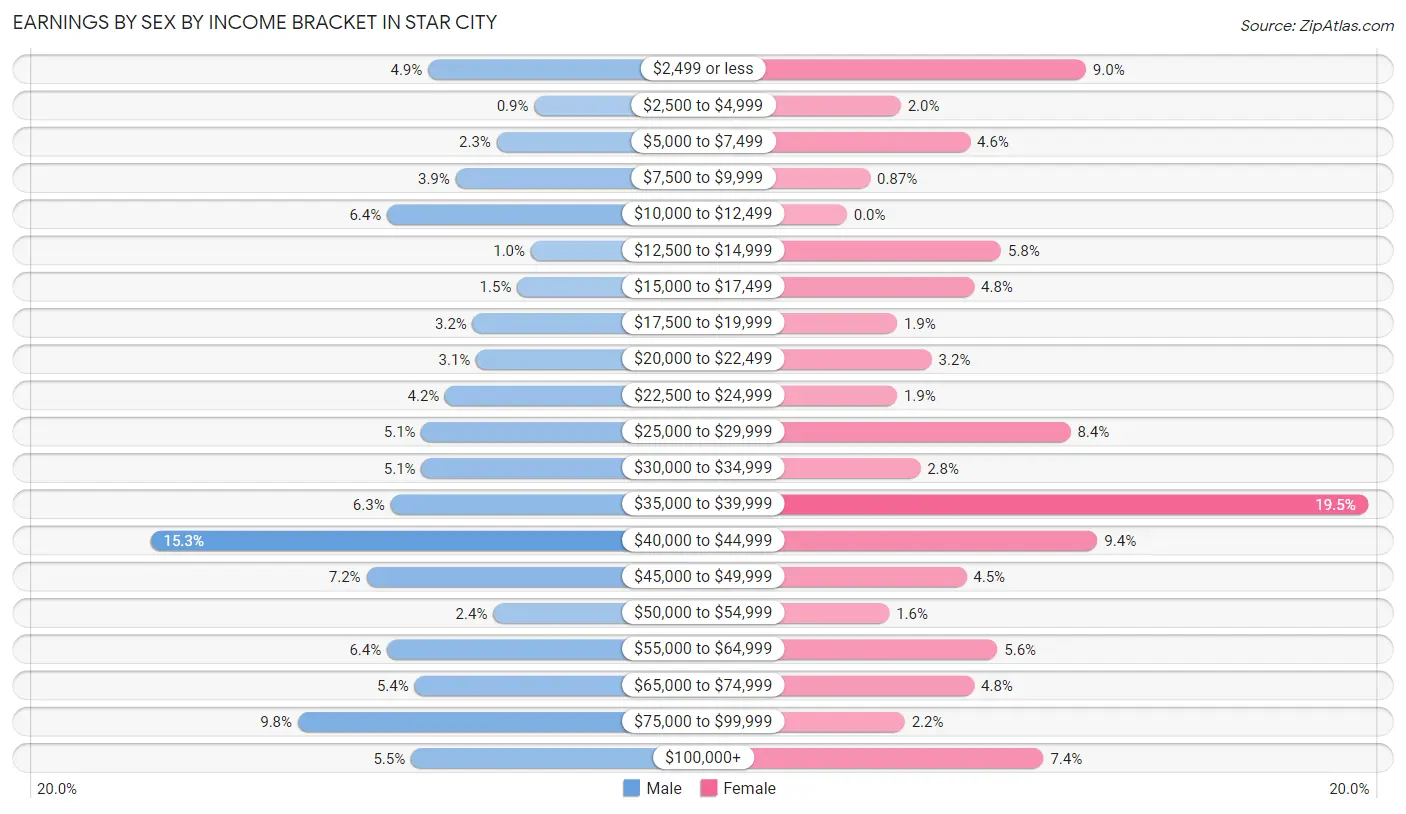
Earnings by Sex by Income Bracket in Star City
The most common earnings brackets in Star City are $40,000 to $44,999 for men (119 | 15.3%) and $35,000 to $39,999 for women (135 | 19.5%).
| Income | Male | Female |
| $2,499 or less | 38 (4.9%) | 62 (9.0%) |
| $2,500 to $4,999 | 7 (0.9%) | 14 (2.0%) |
| $5,000 to $7,499 | 18 (2.3%) | 32 (4.6%) |
| $7,500 to $9,999 | 30 (3.8%) | 6 (0.9%) |
| $10,000 to $12,499 | 50 (6.4%) | 0 (0.0%) |
| $12,500 to $14,999 | 8 (1.0%) | 40 (5.8%) |
| $15,000 to $17,499 | 12 (1.5%) | 33 (4.8%) |
| $17,500 to $19,999 | 25 (3.2%) | 13 (1.9%) |
| $20,000 to $22,499 | 24 (3.1%) | 22 (3.2%) |
| $22,500 to $24,999 | 33 (4.2%) | 13 (1.9%) |
| $25,000 to $29,999 | 40 (5.1%) | 58 (8.4%) |
| $30,000 to $34,999 | 40 (5.1%) | 19 (2.8%) |
| $35,000 to $39,999 | 49 (6.3%) | 135 (19.5%) |
| $40,000 to $44,999 | 119 (15.3%) | 65 (9.4%) |
| $45,000 to $49,999 | 56 (7.2%) | 31 (4.5%) |
| $50,000 to $54,999 | 19 (2.4%) | 11 (1.6%) |
| $55,000 to $64,999 | 50 (6.4%) | 39 (5.6%) |
| $65,000 to $74,999 | 42 (5.4%) | 33 (4.8%) |
| $75,000 to $99,999 | 76 (9.8%) | 15 (2.2%) |
| $100,000+ | 43 (5.5%) | 51 (7.4%) |
| Total | 779 (100.0%) | 692 (100.0%) |
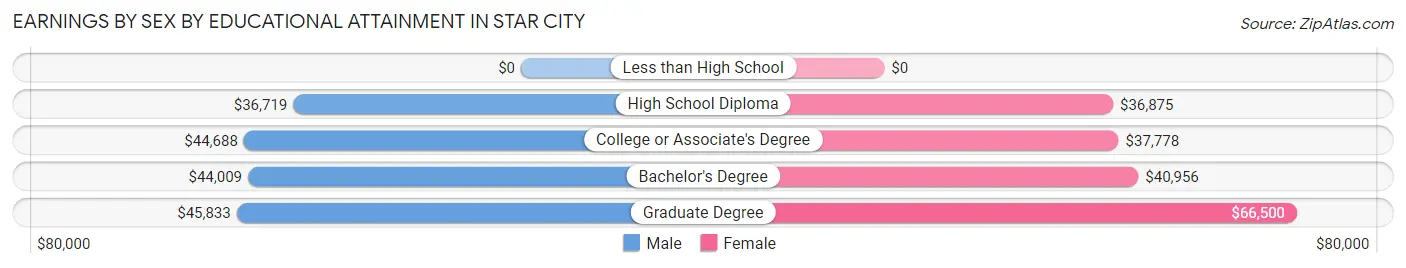
Earnings by Sex by Educational Attainment in Star City
Average earnings in Star City are $42,577 for men and $40,994 for women, a difference of 3.7%. Men with an educational attainment of graduate degree enjoy the highest average annual earnings of $45,833, while those with high school diploma education earn the least with $36,719. Women with an educational attainment of graduate degree earn the most with the average annual earnings of $66,500, while those with high school diploma education have the smallest earnings of $36,875.
| Educational Attainment | Male Income | Female Income |
| Less than High School | - | - |
| High School Diploma | $36,719 | $36,875 |
| College or Associate's Degree | $44,688 | $37,778 |
| Bachelor's Degree | $44,009 | $40,956 |
| Graduate Degree | $45,833 | $66,500 |
| Total | $42,577 | $40,994 |
Family Income in Star City
Family Income Brackets in Star City
According to the Star City family income data, there are 125 families falling into the $100,000 to $149,999 income range, which is the most common income bracket and makes up 28.7% of all families.
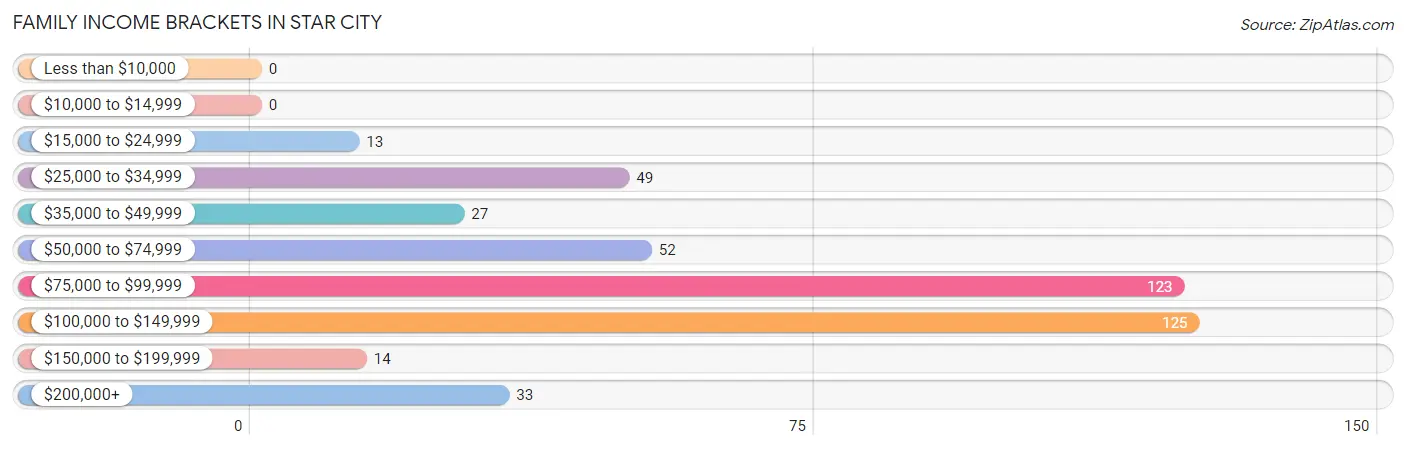
| Income Bracket | # Families | % Families |
| Less than $10,000 | 0 | 0.0% |
| $10,000 to $14,999 | 0 | 0.0% |
| $15,000 to $24,999 | 13 | 3.0% |
| $25,000 to $34,999 | 49 | 11.2% |
| $35,000 to $49,999 | 27 | 6.2% |
| $50,000 to $74,999 | 52 | 11.9% |
| $75,000 to $99,999 | 123 | 28.2% |
| $100,000 to $149,999 | 125 | 28.7% |
| $150,000 to $199,999 | 14 | 3.2% |
| $200,000+ | 33 | 7.6% |
Family Income by Famaliy Size in Star City
3-person families (168 | 38.5%) account for the highest median family income in Star City with $99,750 per family, while 2-person families (187 | 42.9%) have the highest median income of $35,027 per family member.
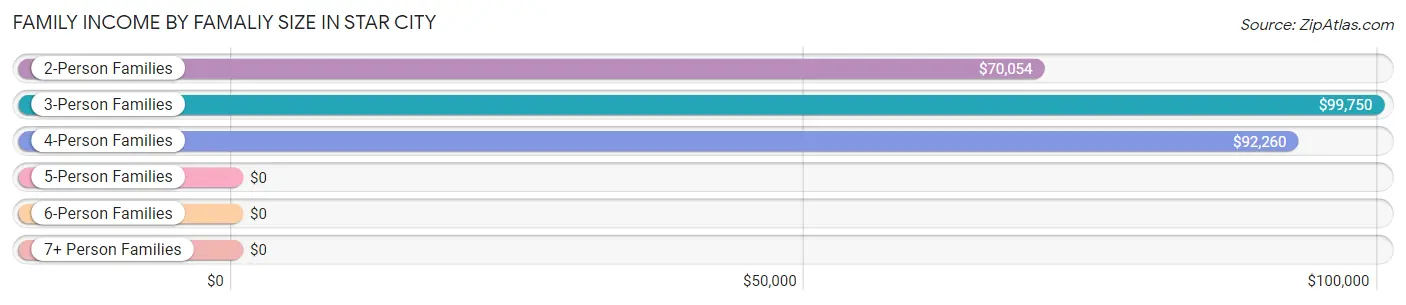
| Income Bracket | # Families | Median Income |
| 2-Person Families | 187 (42.9%) | $70,054 |
| 3-Person Families | 168 (38.5%) | $99,750 |
| 4-Person Families | 61 (14.0%) | $92,260 |
| 5-Person Families | 11 (2.5%) | $0 |
| 6-Person Families | 0 (0.0%) | $0 |
| 7+ Person Families | 9 (2.1%) | $0 |
| Total | 436 (100.0%) | $91,680 |
Family Income by Number of Earners in Star City
The median family income in Star City is $91,680, with families comprising 3+ earners (23) having the highest median family income of $115,972, while families with no earners (36) have the lowest median family income of $59,500, accounting for 5.3% and 8.3% of families, respectively.
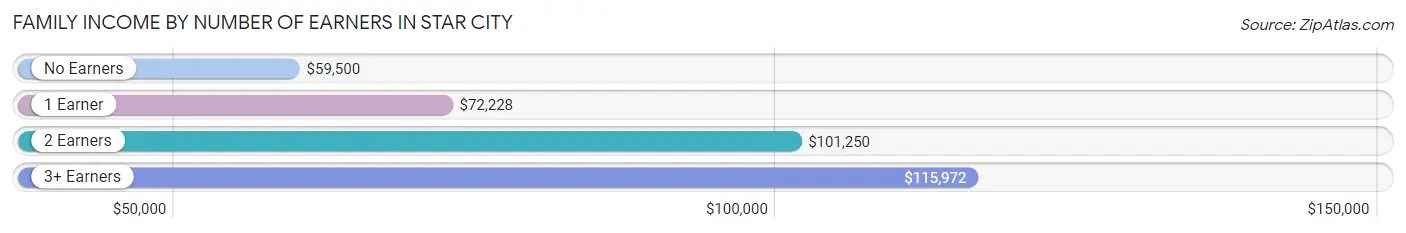
| Number of Earners | # Families | Median Income |
| No Earners | 36 (8.3%) | $59,500 |
| 1 Earner | 177 (40.6%) | $72,228 |
| 2 Earners | 200 (45.9%) | $101,250 |
| 3+ Earners | 23 (5.3%) | $115,972 |
| Total | 436 (100.0%) | $91,680 |
Household Income in Star City
Household Income Brackets in Star City
With 252 households falling in the category, the $75,000 to $99,999 income range is the most frequent in Star City, accounting for 24.4% of all households. In contrast, only 21 households (2.0%) fall into the $150,000 to $199,999 income bracket, making it the least populous group.
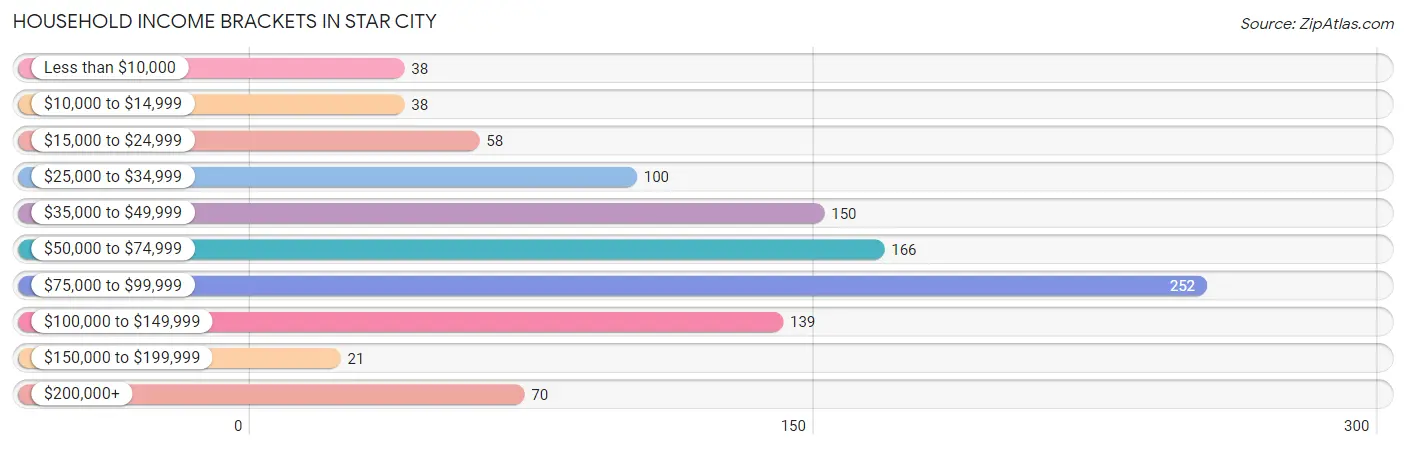
| Income Bracket | # Households | % Households |
| Less than $10,000 | 38 | 3.7% |
| $10,000 to $14,999 | 38 | 3.7% |
| $15,000 to $24,999 | 58 | 5.6% |
| $25,000 to $34,999 | 100 | 9.7% |
| $35,000 to $49,999 | 150 | 14.5% |
| $50,000 to $74,999 | 166 | 16.1% |
| $75,000 to $99,999 | 252 | 24.4% |
| $100,000 to $149,999 | 139 | 13.5% |
| $150,000 to $199,999 | 21 | 2.0% |
| $200,000+ | 70 | 6.8% |
Household Income by Householder Age in Star City
The median household income in Star City is $69,063, with the highest median household income of $95,536 found in the 65+ years age bracket for the primary householder. A total of 211 households (20.4%) fall into this category. Meanwhile, the 15 to 24 years age bracket for the primary householder has the lowest median household income of $53,219, with 137 households (13.3%) in this group.
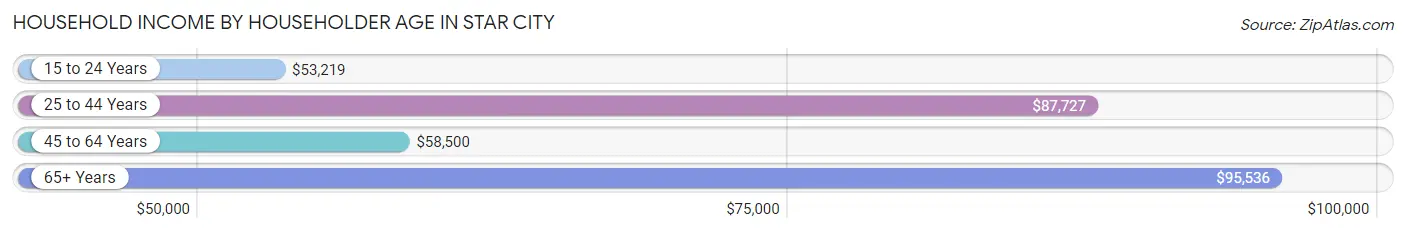
| Income Bracket | # Households | Median Income |
| 15 to 24 Years | 137 (13.3%) | $53,219 |
| 25 to 44 Years | 388 (37.6%) | $87,727 |
| 45 to 64 Years | 296 (28.7%) | $58,500 |
| 65+ Years | 211 (20.4%) | $95,536 |
| Total | 1,032 (100.0%) | $69,063 |
Poverty in Star City
Income Below Poverty by Sex and Age in Star City
With 12.3% poverty level for males and 12.1% for females among the residents of Star City, 45 to 54 year old males and 18 to 24 year old females are the most vulnerable to poverty, with 54 males (45.4%) and 83 females (36.9%) in their respective age groups living below the poverty level.
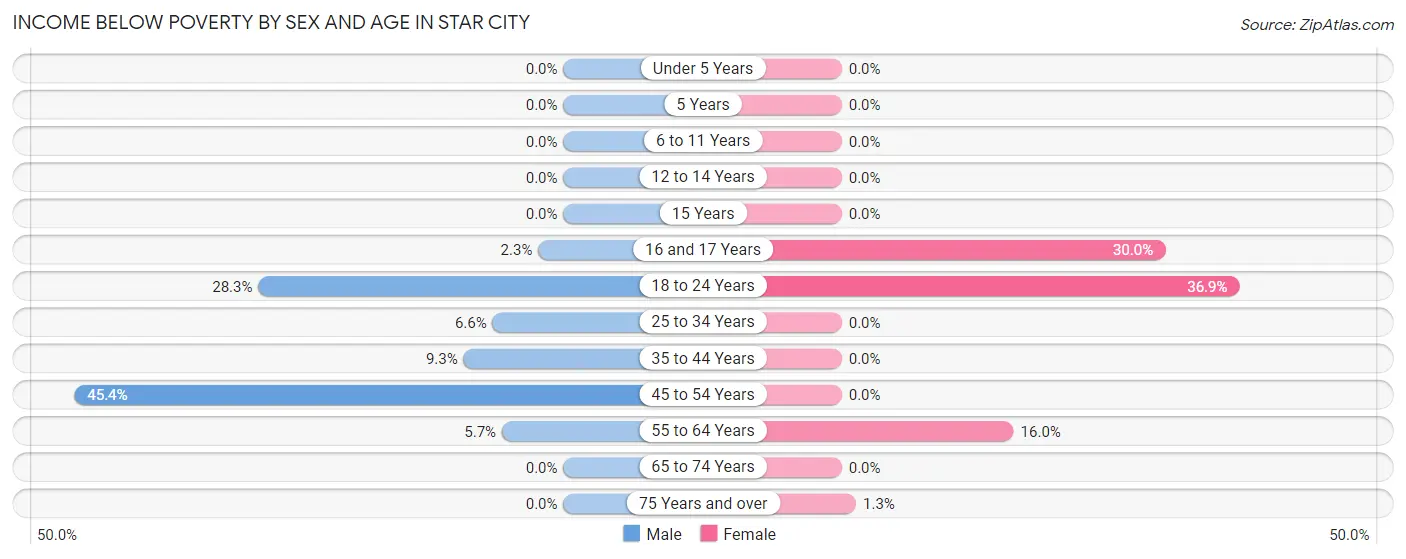
| Age Bracket | Male | Female |
| Under 5 Years | 0 (0.0%) | 0 (0.0%) |
| 5 Years | 0 (0.0%) | 0 (0.0%) |
| 6 to 11 Years | 0 (0.0%) | 0 (0.0%) |
| 12 to 14 Years | 0 (0.0%) | 0 (0.0%) |
| 15 Years | 0 (0.0%) | 0 (0.0%) |
| 16 and 17 Years | 1 (2.3%) | 9 (30.0%) |
| 18 to 24 Years | 47 (28.3%) | 83 (36.9%) |
| 25 to 34 Years | 19 (6.6%) | 0 (0.0%) |
| 35 to 44 Years | 15 (9.3%) | 0 (0.0%) |
| 45 to 54 Years | 54 (45.4%) | 0 (0.0%) |
| 55 to 64 Years | 9 (5.7%) | 26 (16.0%) |
| 65 to 74 Years | 0 (0.0%) | 0 (0.0%) |
| 75 Years and over | 0 (0.0%) | 1 (1.3%) |
| Total | 145 (12.3%) | 119 (12.1%) |
Income Above Poverty by Sex and Age in Star City
According to the poverty statistics in Star City, males aged 5 years and females aged under 5 years are the age groups that are most secure financially, with 100.0% of males and 100.0% of females in these age groups living above the poverty line.
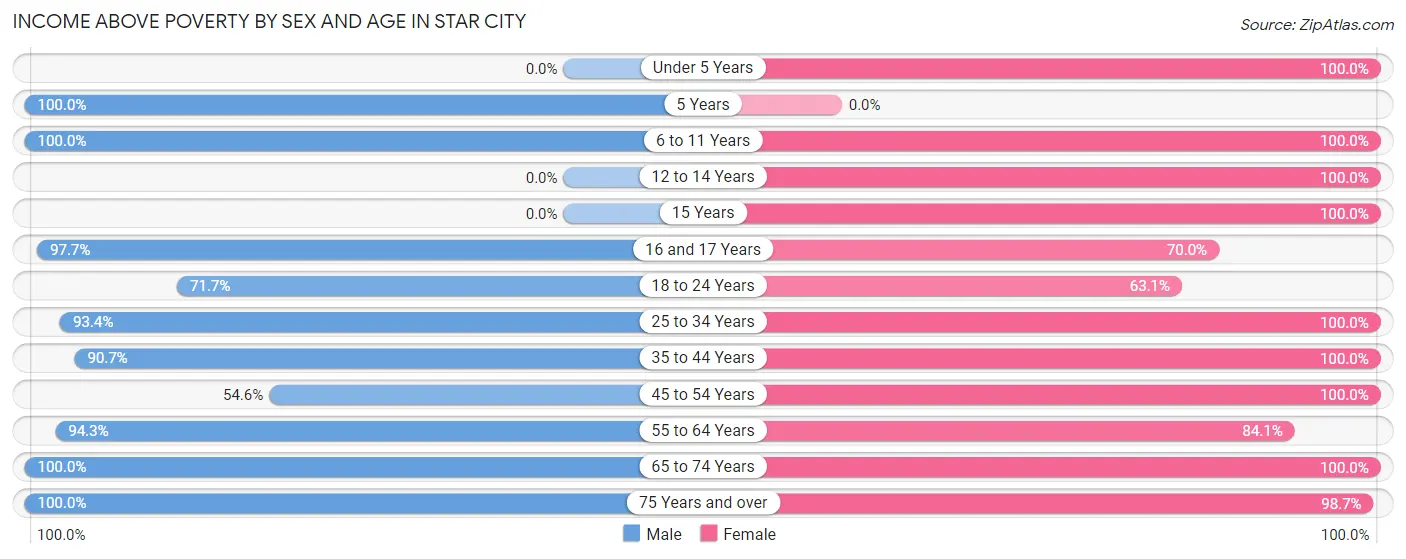
| Age Bracket | Male | Female |
| Under 5 Years | 0 (0.0%) | 25 (100.0%) |
| 5 Years | 13 (100.0%) | 0 (0.0%) |
| 6 to 11 Years | 83 (100.0%) | 4 (100.0%) |
| 12 to 14 Years | 0 (0.0%) | 24 (100.0%) |
| 15 Years | 0 (0.0%) | 6 (100.0%) |
| 16 and 17 Years | 42 (97.7%) | 21 (70.0%) |
| 18 to 24 Years | 119 (71.7%) | 142 (63.1%) |
| 25 to 34 Years | 270 (93.4%) | 222 (100.0%) |
| 35 to 44 Years | 147 (90.7%) | 82 (100.0%) |
| 45 to 54 Years | 65 (54.6%) | 58 (100.0%) |
| 55 to 64 Years | 149 (94.3%) | 137 (84.1%) |
| 65 to 74 Years | 99 (100.0%) | 71 (100.0%) |
| 75 Years and over | 50 (100.0%) | 74 (98.7%) |
| Total | 1,037 (87.7%) | 866 (87.9%) |
Income Below Poverty Among Married-Couple Families in Star City
| Children | Above Poverty | Below Poverty |
| No Children | 192 (100.0%) | 0 (0.0%) |
| 1 or 2 Children | 100 (100.0%) | 0 (0.0%) |
| 3 or 4 Children | 0 (0.0%) | 0 (0.0%) |
| 5 or more Children | 0 (0.0%) | 0 (0.0%) |
| Total | 292 (100.0%) | 0 (0.0%) |
Income Below Poverty Among Single-Parent Households in Star City
| Children | Single Father | Single Mother |
| No Children | 0 (0.0%) | 0 (0.0%) |
| 1 or 2 Children | 0 (0.0%) | 0 (0.0%) |
| 3 or 4 Children | 0 (0.0%) | 0 (0.0%) |
| 5 or more Children | 0 (0.0%) | 0 (0.0%) |
| Total | 0 (0.0%) | 0 (0.0%) |
Income Below Poverty Among Married-Couple vs Single-Parent Households in Star City
| Children | Married-Couple Families | Single-Parent Households |
| No Children | 0 (0.0%) | 0 (0.0%) |
| 1 or 2 Children | 0 (0.0%) | 0 (0.0%) |
| 3 or 4 Children | 0 (0.0%) | 0 (0.0%) |
| 5 or more Children | 0 (0.0%) | 0 (0.0%) |
| Total | 0 (0.0%) | 0 (0.0%) |
Race in Star City
The most populous races in Star City are White / Caucasian (1,829 | 84.4%), Asian (138 | 6.4%), and Black / African American (125 | 5.8%).
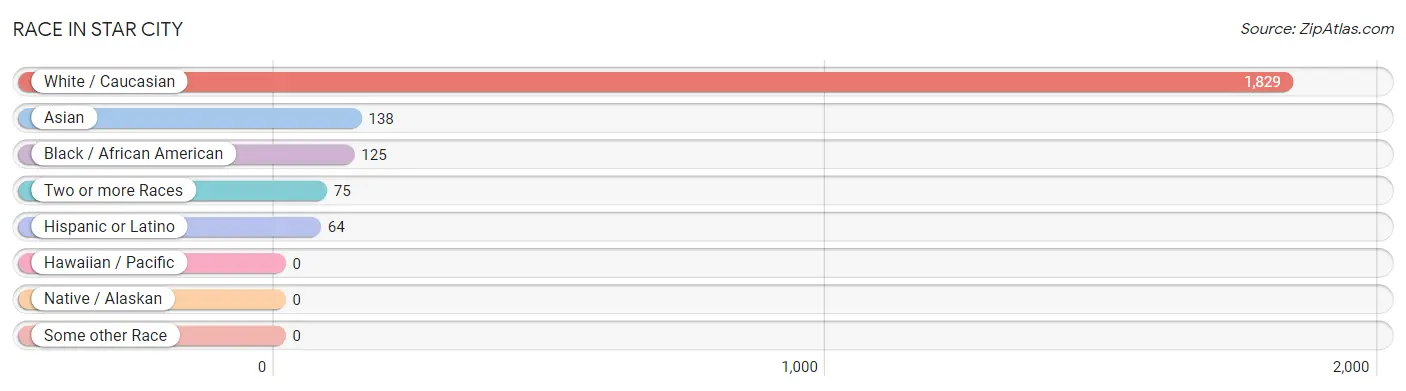
| Race | # Population | % Population |
| Asian | 138 | 6.4% |
| Black / African American | 125 | 5.8% |
| Hawaiian / Pacific | 0 | 0.0% |
| Hispanic or Latino | 64 | 2.9% |
| Native / Alaskan | 0 | 0.0% |
| White / Caucasian | 1,829 | 84.4% |
| Two or more Races | 75 | 3.5% |
| Some other Race | 0 | 0.0% |
| Total | 2,167 | 100.0% |
Ancestry in Star City
The most populous ancestries reported in Star City are German (545 | 25.2%), English (321 | 14.8%), Italian (222 | 10.2%), Irish (207 | 9.6%), and American (144 | 6.7%), together accounting for 66.4% of all Star City residents.
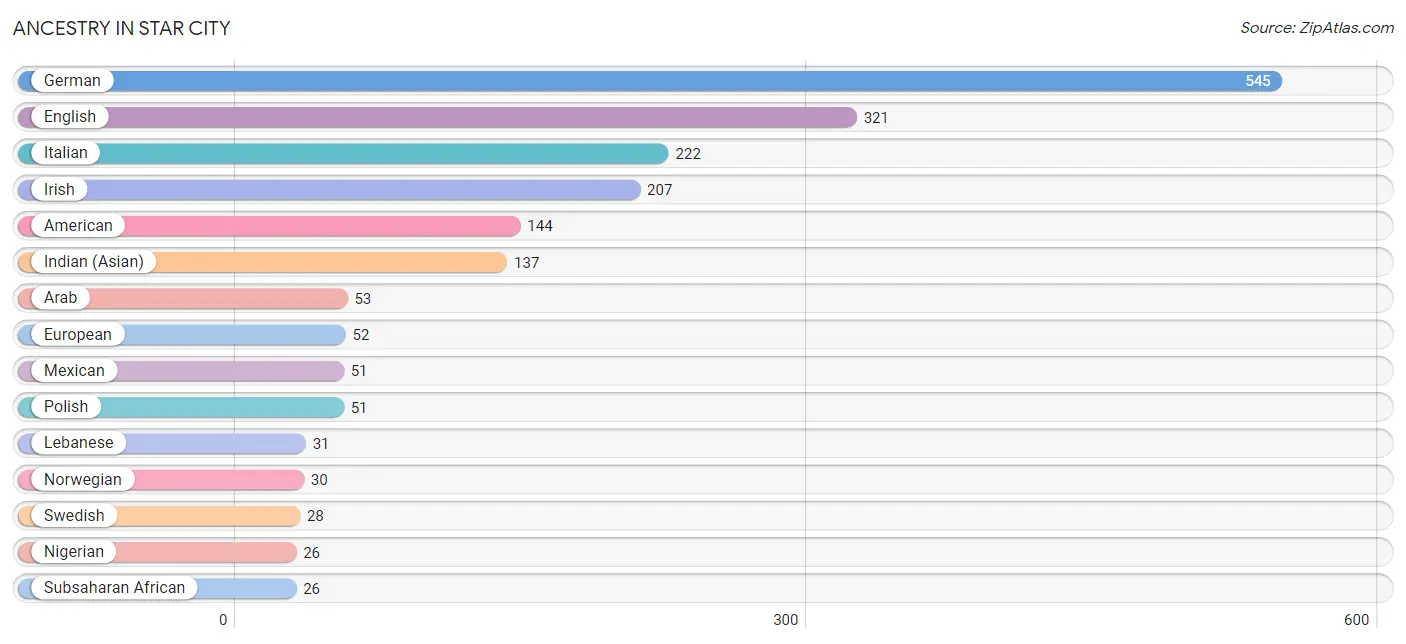
| Ancestry | # Population | % Population |
| American | 144 | 6.7% |
| Arab | 53 | 2.5% |
| British | 17 | 0.8% |
| Carpatho Rusyn | 4 | 0.2% |
| Cherokee | 1 | 0.1% |
| Danish | 6 | 0.3% |
| Dutch | 8 | 0.4% |
| Eastern European | 7 | 0.3% |
| Egyptian | 17 | 0.8% |
| English | 321 | 14.8% |
| European | 52 | 2.4% |
| French Canadian | 9 | 0.4% |
| German | 545 | 25.2% |
| Hungarian | 14 | 0.6% |
| Indian (Asian) | 137 | 6.3% |
| Iranian | 3 | 0.1% |
| Irish | 207 | 9.6% |
| Italian | 222 | 10.2% |
| Lebanese | 31 | 1.4% |
| Mexican | 51 | 2.4% |
| Nigerian | 26 | 1.2% |
| Norwegian | 30 | 1.4% |
| Polish | 51 | 2.4% |
| Puerto Rican | 10 | 0.5% |
| Russian | 11 | 0.5% |
| Scottish | 19 | 0.9% |
| Slovak | 7 | 0.3% |
| Spanish | 3 | 0.1% |
| Subsaharan African | 26 | 1.2% |
| Swedish | 28 | 1.3% |
| Swiss | 26 | 1.2% |
| Syrian | 5 | 0.2% |
| Thai | 1 | 0.1% |
| Ukrainian | 9 | 0.4% |
| Welsh | 9 | 0.4% | View All 35 Rows |
Immigrants in Star City
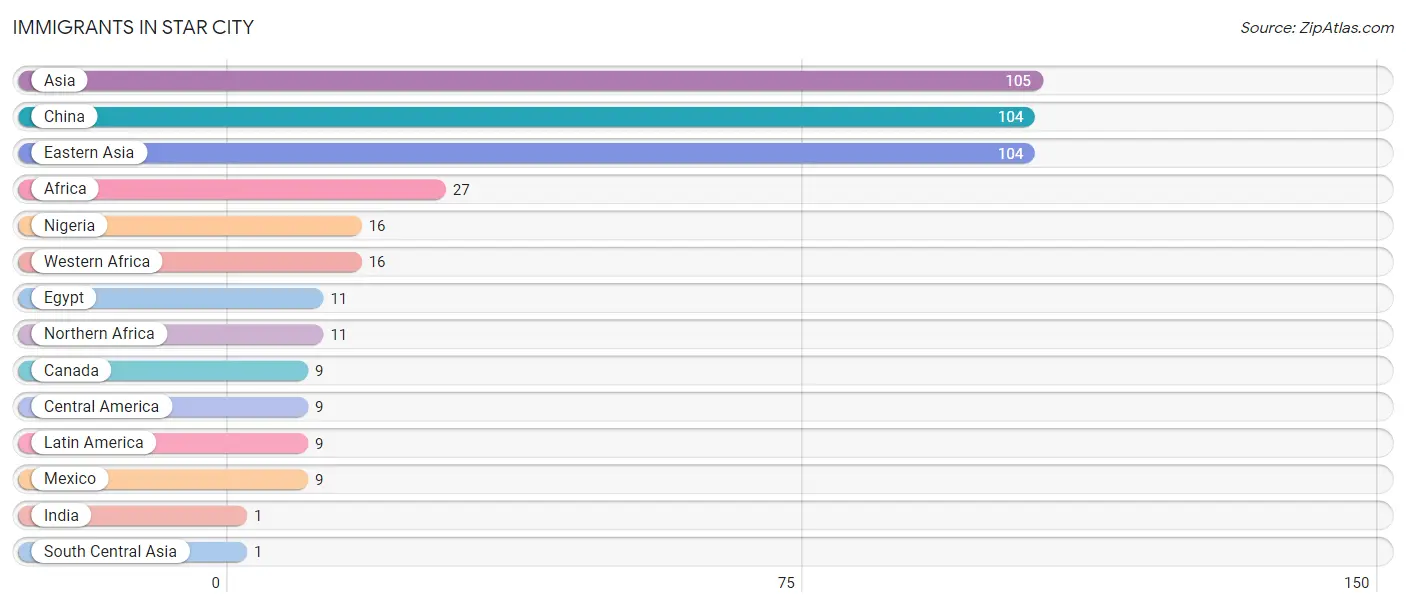
The most numerous immigrant groups reported in Star City came from Asia (105 | 4.9%), China (104 | 4.8%), Eastern Asia (104 | 4.8%), Africa (27 | 1.3%), and Nigeria (16 | 0.7%), together accounting for 16.4% of all Star City residents.
| Immigration Origin | # Population | % Population |
| Africa | 27 | 1.3% |
| Asia | 105 | 4.9% |
| Canada | 9 | 0.4% |
| Central America | 9 | 0.4% |
| China | 104 | 4.8% |
| Eastern Asia | 104 | 4.8% |
| Egypt | 11 | 0.5% |
| India | 1 | 0.1% |
| Latin America | 9 | 0.4% |
| Mexico | 9 | 0.4% |
| Nigeria | 16 | 0.7% |
| Northern Africa | 11 | 0.5% |
| South Central Asia | 1 | 0.1% |
| Western Africa | 16 | 0.7% | View All 14 Rows |
Sex and Age in Star City
Sex and Age in Star City
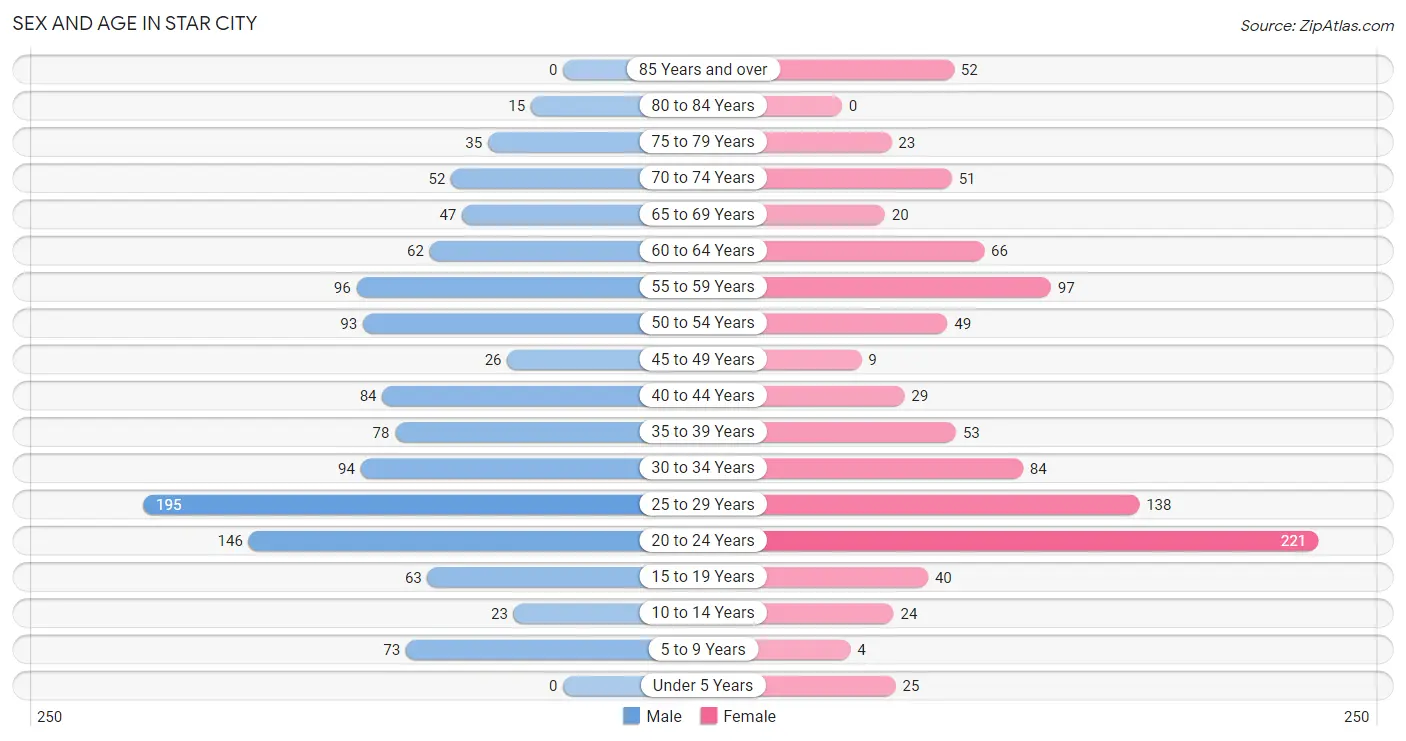
The most populous age groups in Star City are 25 to 29 Years (195 | 16.5%) for men and 20 to 24 Years (221 | 22.4%) for women.
| Age Bracket | Male | Female |
| Under 5 Years | 0 (0.0%) | 25 (2.5%) |
| 5 to 9 Years | 73 (6.2%) | 4 (0.4%) |
| 10 to 14 Years | 23 (1.9%) | 24 (2.4%) |
| 15 to 19 Years | 63 (5.3%) | 40 (4.1%) |
| 20 to 24 Years | 146 (12.3%) | 221 (22.4%) |
| 25 to 29 Years | 195 (16.5%) | 138 (14.0%) |
| 30 to 34 Years | 94 (8.0%) | 84 (8.5%) |
| 35 to 39 Years | 78 (6.6%) | 53 (5.4%) |
| 40 to 44 Years | 84 (7.1%) | 29 (2.9%) |
| 45 to 49 Years | 26 (2.2%) | 9 (0.9%) |
| 50 to 54 Years | 93 (7.9%) | 49 (5.0%) |
| 55 to 59 Years | 96 (8.1%) | 97 (9.9%) |
| 60 to 64 Years | 62 (5.2%) | 66 (6.7%) |
| 65 to 69 Years | 47 (4.0%) | 20 (2.0%) |
| 70 to 74 Years | 52 (4.4%) | 51 (5.2%) |
| 75 to 79 Years | 35 (3.0%) | 23 (2.3%) |
| 80 to 84 Years | 15 (1.3%) | 0 (0.0%) |
| 85 Years and over | 0 (0.0%) | 52 (5.3%) |
| Total | 1,182 (100.0%) | 985 (100.0%) |
Families and Households in Star City
Median Family Size in Star City
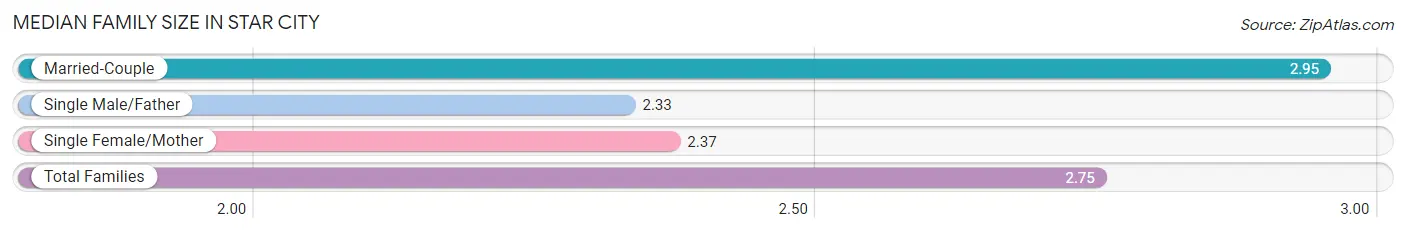
The median family size in Star City is 2.75 persons per family, with married-couple families (292 | 67.0%) accounting for the largest median family size of 2.95 persons per family. On the other hand, single male/father families (69 | 15.8%) represent the smallest median family size with 2.33 persons per family.
| Family Type | # Families | Family Size |
| Married-Couple | 292 (67.0%) | 2.95 |
| Single Male/Father | 69 (15.8%) | 2.33 |
| Single Female/Mother | 75 (17.2%) | 2.37 |
| Total Families | 436 (100.0%) | 2.75 |
Median Household Size in Star City
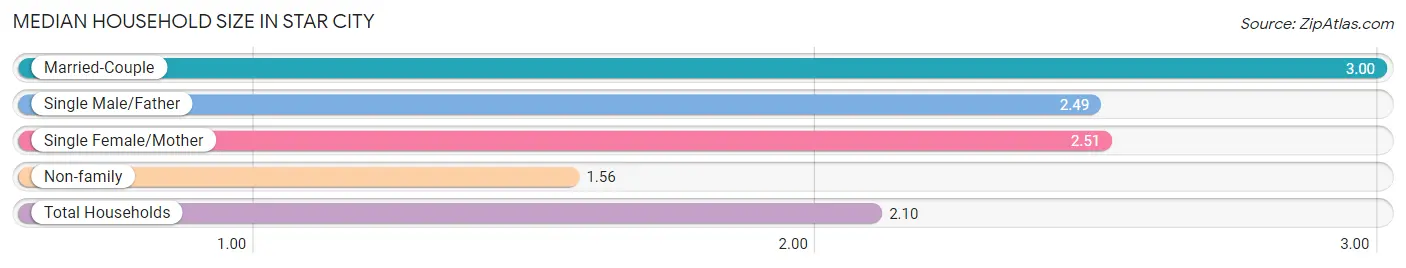
The median household size in Star City is 2.10 persons per household, with married-couple households (292 | 28.3%) accounting for the largest median household size of 3 persons per household. non-family households (596 | 57.8%) represent the smallest median household size with 1.56 persons per household.
| Household Type | # Households | Household Size |
| Married-Couple | 292 (28.3%) | 3.00 |
| Single Male/Father | 69 (6.7%) | 2.49 |
| Single Female/Mother | 75 (7.3%) | 2.51 |
| Non-family | 596 (57.8%) | 1.56 |
| Total Households | 1,032 (100.0%) | 2.10 |
Household Size by Marriage Status in Star City
Out of a total of 1,032 households in Star City, 436 (42.2%) are family households, while 596 (57.8%) are nonfamily households. The most numerous type of family households are 3-person households, comprising 188, and the most common type of nonfamily households are 1-person households, comprising 389.
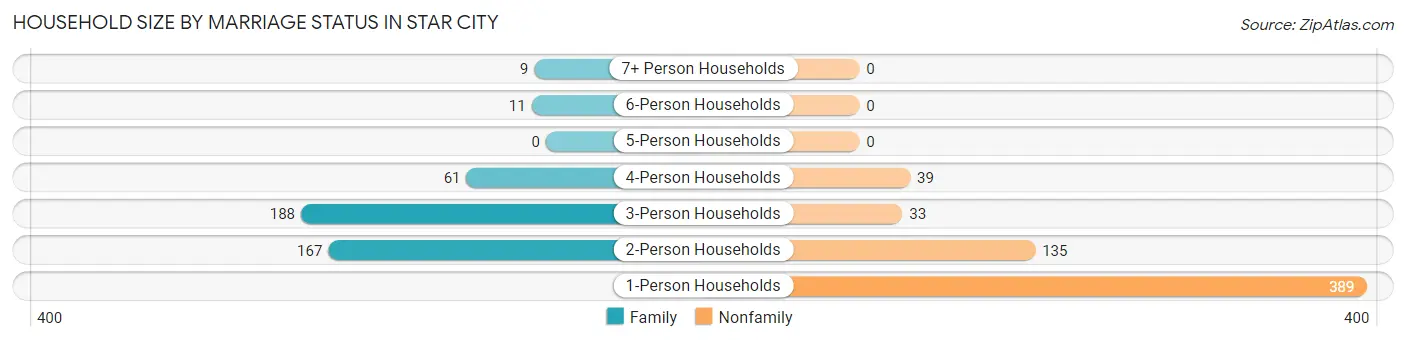
| Household Size | Family Households | Nonfamily Households |
| 1-Person Households | - | 389 (37.7%) |
| 2-Person Households | 167 (16.2%) | 135 (13.1%) |
| 3-Person Households | 188 (18.2%) | 33 (3.2%) |
| 4-Person Households | 61 (5.9%) | 39 (3.8%) |
| 5-Person Households | 0 (0.0%) | 0 (0.0%) |
| 6-Person Households | 11 (1.1%) | 0 (0.0%) |
| 7+ Person Households | 9 (0.9%) | 0 (0.0%) |
| Total | 436 (42.2%) | 596 (57.8%) |
Female Fertility in Star City
Fertility by Age in Star City
Average fertility rate in Star City is 10.0 births per 1,000 women. Women in the age bracket of 20 to 34 years have the highest fertility rate with 14.0 births per 1,000 women. Women in the age bracket of 20 to 34 years acount for 100.0% of all women with births.
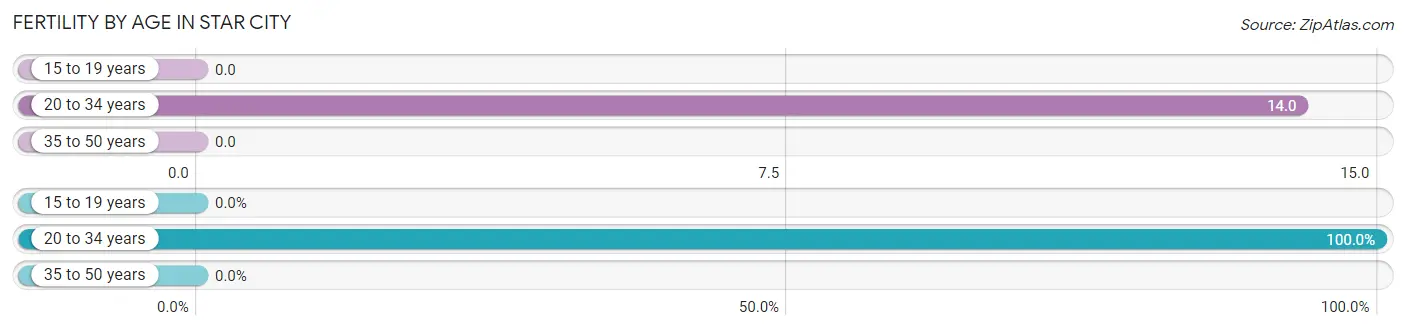
| Age Bracket | Women with Births | Births / 1,000 Women |
| 15 to 19 years | 0 (0.0%) | 0.0 |
| 20 to 34 years | 6 (100.0%) | 14.0 |
| 35 to 50 years | 0 (0.0%) | 0.0 |
| Total | 6 (100.0%) | 10.0 |
Fertility by Age by Marriage Status in Star City
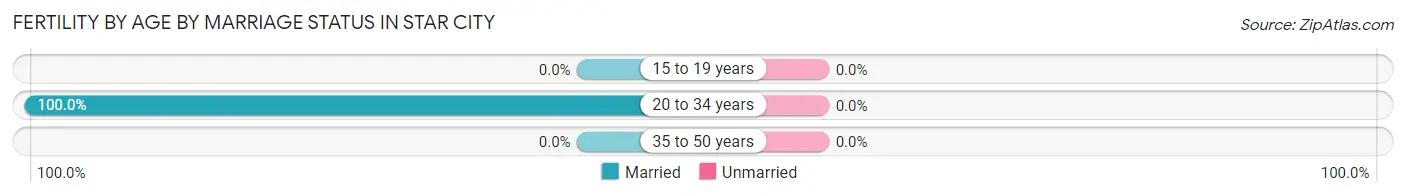
| Age Bracket | Married | Unmarried |
| 15 to 19 years | 0 (0.0%) | 0 (0.0%) |
| 20 to 34 years | 6 (100.0%) | 0 (0.0%) |
| 35 to 50 years | 0 (0.0%) | 0 (0.0%) |
| Total | 6 (100.0%) | 0 (0.0%) |
Fertility by Education in Star City
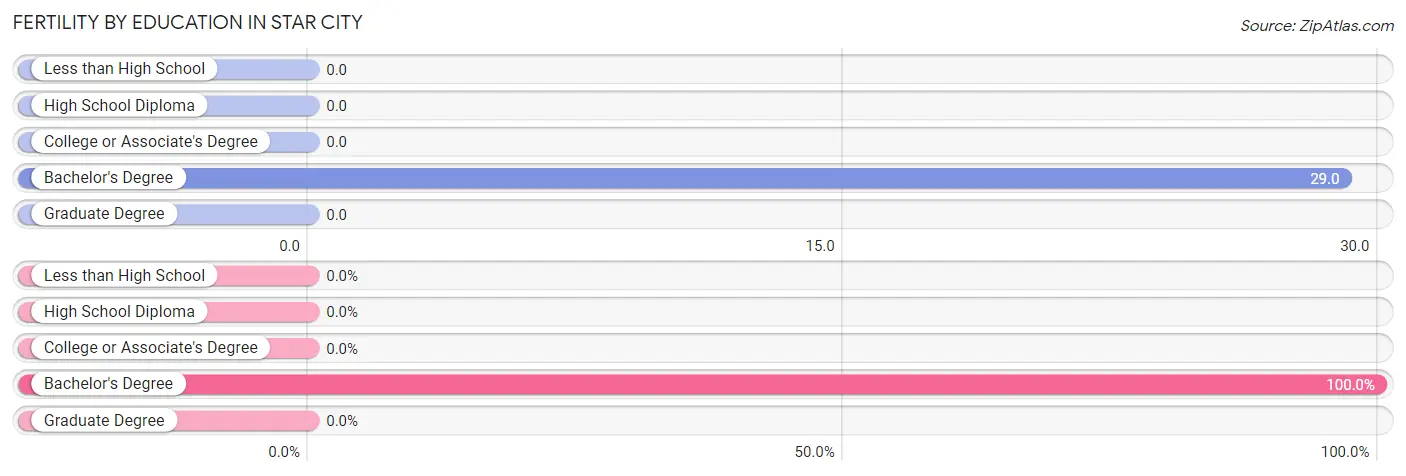
| Educational Attainment | Women with Births | Births / 1,000 Women |
| Less than High School | 0 (0.0%) | 0.0 |
| High School Diploma | 0 (0.0%) | 0.0 |
| College or Associate's Degree | 0 (0.0%) | 0.0 |
| Bachelor's Degree | 6 (100.0%) | 29.0 |
| Graduate Degree | 0 (0.0%) | 0.0 |
| Total | 6 (100.0%) | 10.0 |
Fertility by Education by Marriage Status in Star City
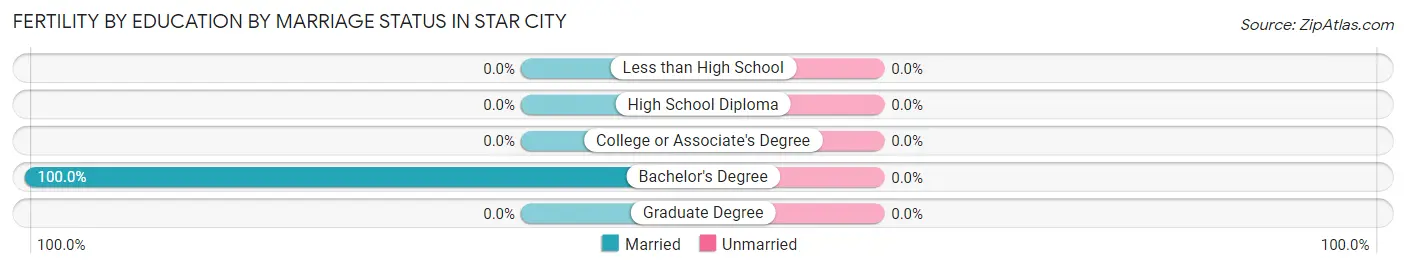
| Educational Attainment | Married | Unmarried |
| Less than High School | 0 (0.0%) | 0 (0.0%) |
| High School Diploma | 0 (0.0%) | 0 (0.0%) |
| College or Associate's Degree | 0 (0.0%) | 0 (0.0%) |
| Bachelor's Degree | 6 (100.0%) | 0 (0.0%) |
| Graduate Degree | 0 (0.0%) | 0 (0.0%) |
| Total | 6 (100.0%) | 0 (0.0%) |
Employment Characteristics in Star City
Employment by Class of Employer in Star City
Among the 1,343 employed individuals in Star City, private company employees (868 | 64.6%), state government employees (239 | 17.8%), and not-for-profit organizations (129 | 9.6%) make up the most common classes of employment.
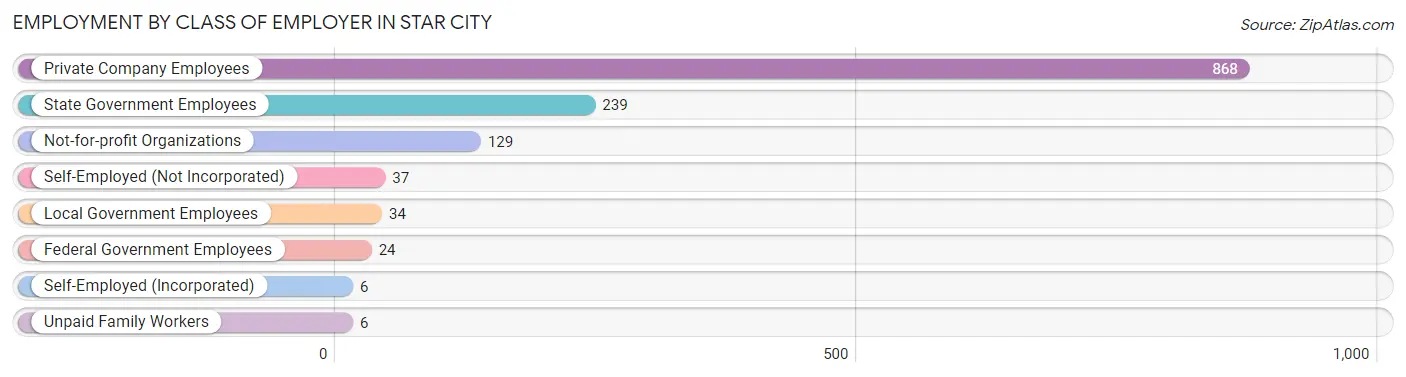
| Employer Class | # Employees | % Employees |
| Private Company Employees | 868 | 64.6% |
| Self-Employed (Incorporated) | 6 | 0.4% |
| Self-Employed (Not Incorporated) | 37 | 2.8% |
| Not-for-profit Organizations | 129 | 9.6% |
| Local Government Employees | 34 | 2.5% |
| State Government Employees | 239 | 17.8% |
| Federal Government Employees | 24 | 1.8% |
| Unpaid Family Workers | 6 | 0.4% |
| Total | 1,343 | 100.0% |
Employment Status by Age in Star City
According to the labor force statistics for Star City, out of the total population over 16 years of age (2,012), 68.4% or 1,376 individuals are in the labor force, with 1.0% or 14 of them unemployed. The age group with the highest labor force participation rate is 30 to 34 years, with 96.6% or 172 individuals in the labor force. Within the labor force, the 55 to 59 years age range has the highest percentage of unemployed individuals, with 7.7% or 8 of them being unemployed.
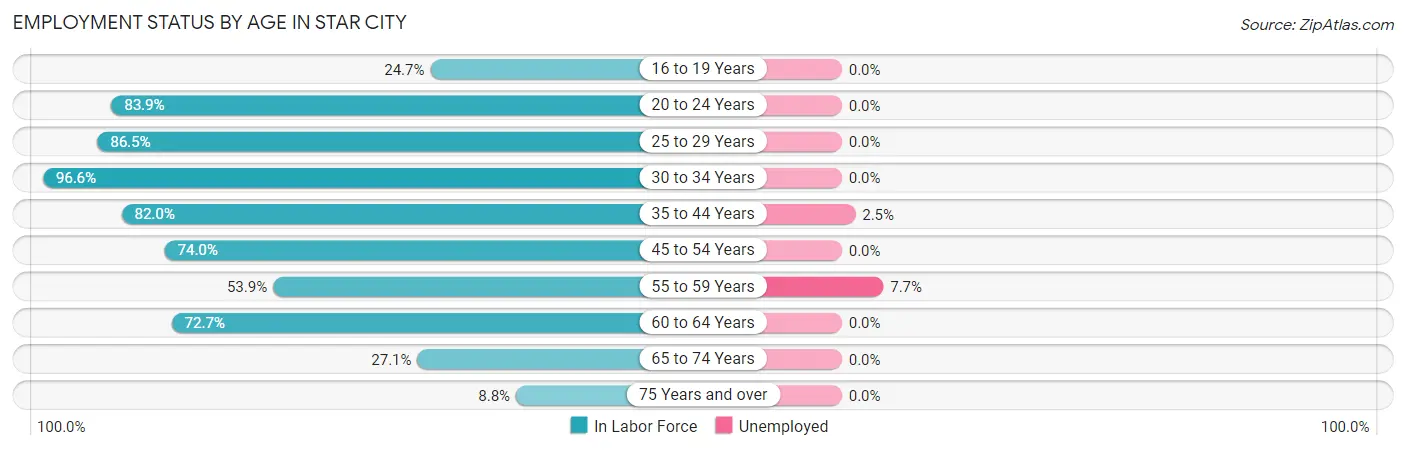
| Age Bracket | In Labor Force | Unemployed |
| 16 to 19 Years | 24 (24.7%) | 0 (0.0%) |
| 20 to 24 Years | 308 (83.9%) | 0 (0.0%) |
| 25 to 29 Years | 288 (86.5%) | 0 (0.0%) |
| 30 to 34 Years | 172 (96.6%) | 0 (0.0%) |
| 35 to 44 Years | 200 (82.0%) | 5 (2.5%) |
| 45 to 54 Years | 131 (74.0%) | 0 (0.0%) |
| 55 to 59 Years | 104 (53.9%) | 8 (7.7%) |
| 60 to 64 Years | 93 (72.7%) | 0 (0.0%) |
| 65 to 74 Years | 46 (27.1%) | 0 (0.0%) |
| 75 Years and over | 11 (8.8%) | 0 (0.0%) |
| Total | 1,376 (68.4%) | 14 (1.0%) |
Employment Status by Educational Attainment in Star City
According to labor force statistics for Star City, 78.9% of individuals (989) out of the total population between 25 and 64 years of age (1,253) are in the labor force, with 1.3% or 13 of them being unemployed. The group with the highest labor force participation rate are those with the educational attainment of less than high school, with 100.0% or 39 individuals in the labor force. Within the labor force, individuals with bachelor's degree or higher education have the highest percentage of unemployment, with 2.3% or 13 of them being unemployed.
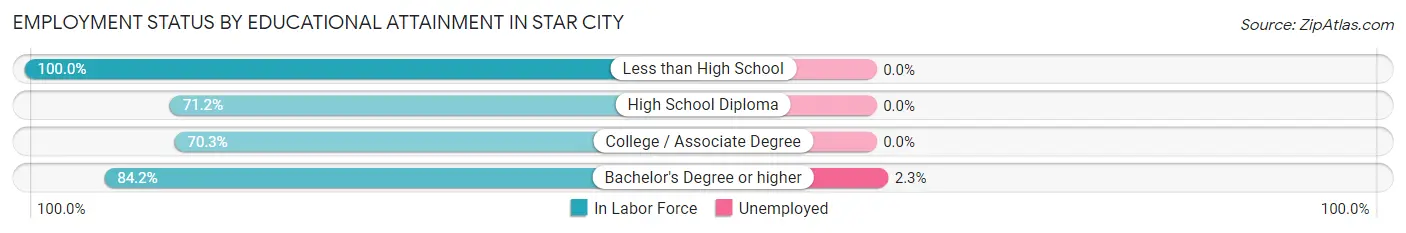
| Educational Attainment | In Labor Force | Unemployed |
| Less than High School | 39 (100.0%) | 0 (0.0%) |
| High School Diploma | 193 (71.2%) | 0 (0.0%) |
| College / Associate Degree | 192 (70.3%) | 0 (0.0%) |
| Bachelor's Degree or higher | 564 (84.2%) | 15 (2.3%) |
| Total | 989 (78.9%) | 16 (1.3%) |
Employment Occupations by Sex in Star City
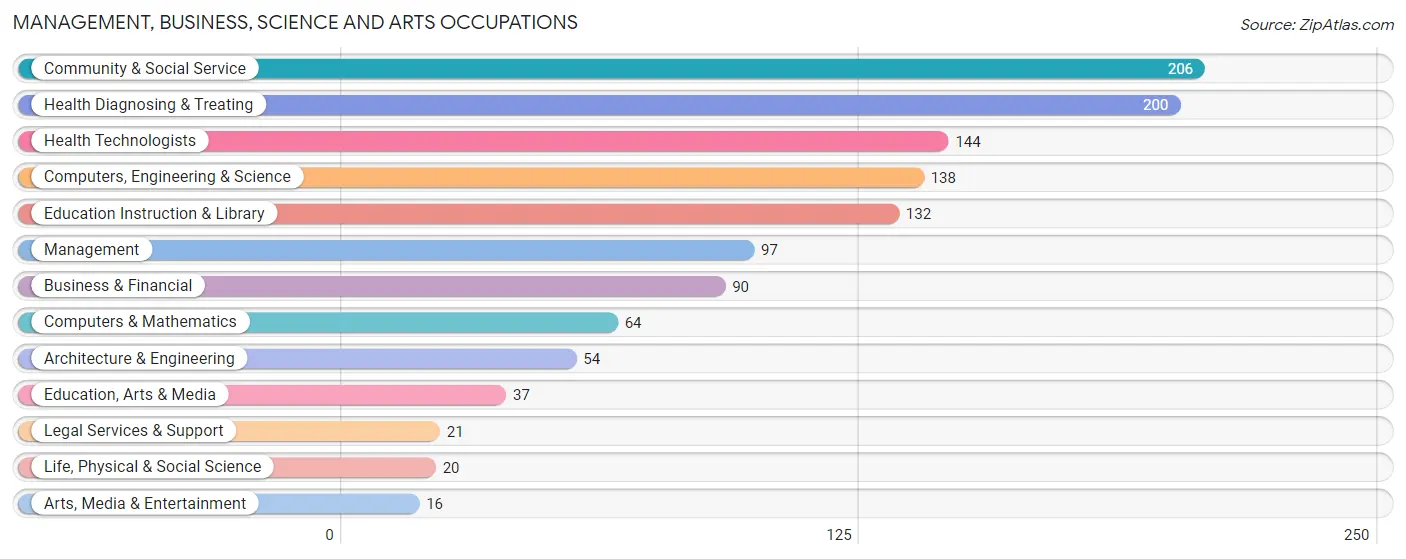
Management, Business, Science and Arts Occupations
The most common Management, Business, Science and Arts occupations in Star City are Community & Social Service (206 | 15.4%), Health Diagnosing & Treating (200 | 14.9%), Health Technologists (144 | 10.7%), Computers, Engineering & Science (138 | 10.3%), and Education Instruction & Library (132 | 9.9%).
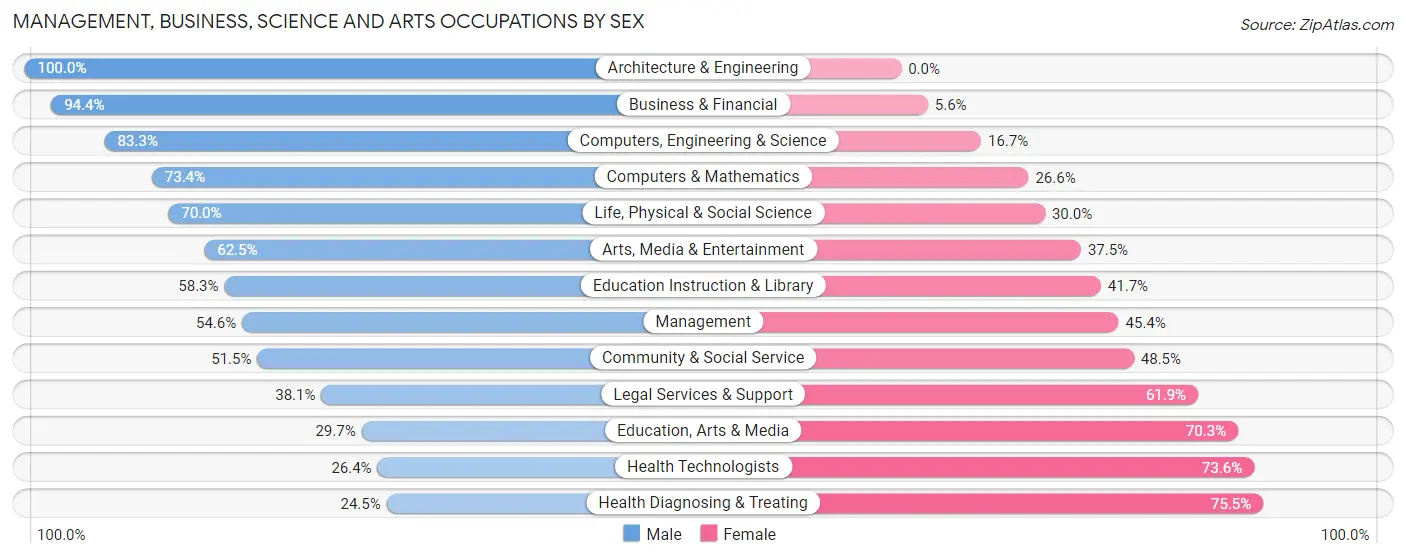
Management, Business, Science and Arts Occupations by Sex
Within the Management, Business, Science and Arts occupations in Star City, the most male-oriented occupations are Architecture & Engineering (100.0%), Business & Financial (94.4%), and Computers, Engineering & Science (83.3%), while the most female-oriented occupations are Health Diagnosing & Treating (75.5%), Health Technologists (73.6%), and Education, Arts & Media (70.3%).
| Occupation | Male | Female |
| Management | 53 (54.6%) | 44 (45.4%) |
| Business & Financial | 85 (94.4%) | 5 (5.6%) |
| Computers, Engineering & Science | 115 (83.3%) | 23 (16.7%) |
| Computers & Mathematics | 47 (73.4%) | 17 (26.6%) |
| Architecture & Engineering | 54 (100.0%) | 0 (0.0%) |
| Life, Physical & Social Science | 14 (70.0%) | 6 (30.0%) |
| Community & Social Service | 106 (51.5%) | 100 (48.5%) |
| Education, Arts & Media | 11 (29.7%) | 26 (70.3%) |
| Legal Services & Support | 8 (38.1%) | 13 (61.9%) |
| Education Instruction & Library | 77 (58.3%) | 55 (41.7%) |
| Arts, Media & Entertainment | 10 (62.5%) | 6 (37.5%) |
| Health Diagnosing & Treating | 49 (24.5%) | 151 (75.5%) |
| Health Technologists | 38 (26.4%) | 106 (73.6%) |
| Total (Category) | 408 (55.8%) | 323 (44.2%) |
| Total (Overall) | 724 (54.0%) | 616 (46.0%) |
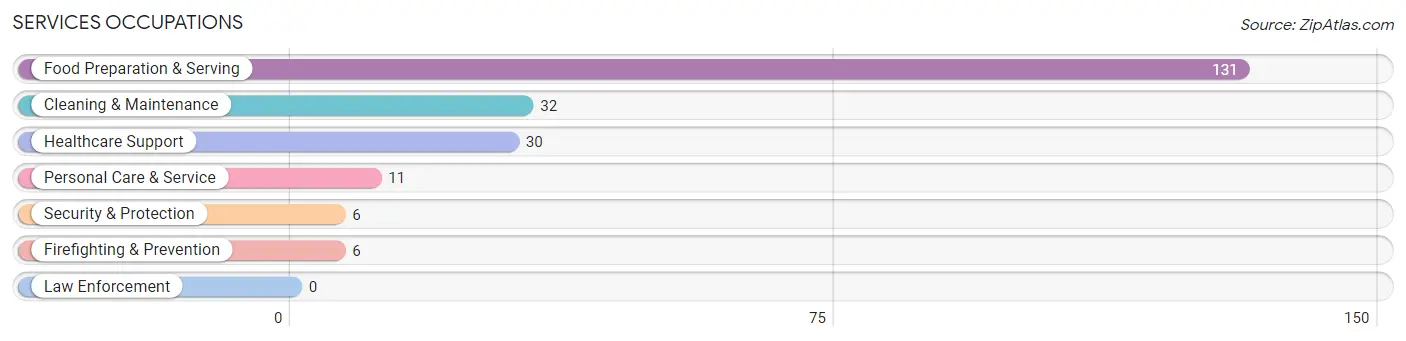
Services Occupations
The most common Services occupations in Star City are Food Preparation & Serving (131 | 9.8%), Cleaning & Maintenance (32 | 2.4%), Healthcare Support (30 | 2.2%), Personal Care & Service (11 | 0.8%), and Security & Protection (6 | 0.4%).
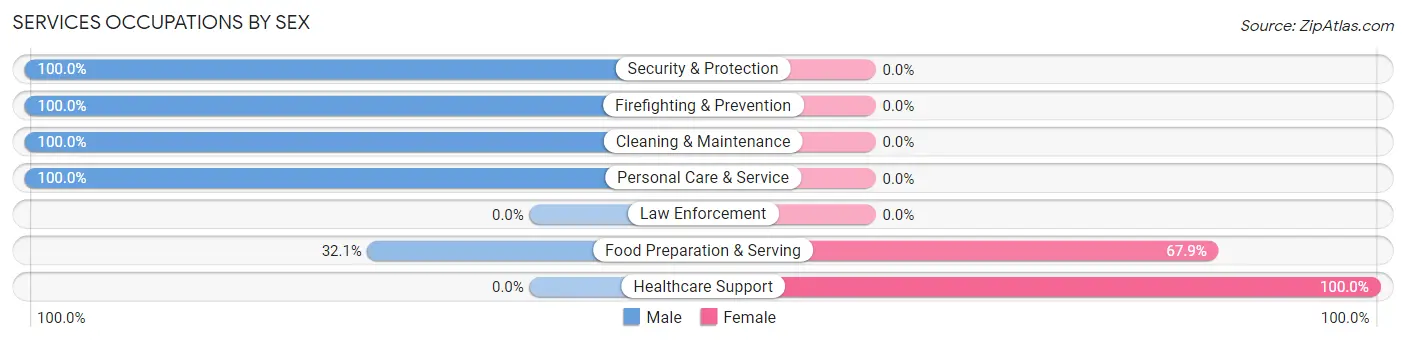
Services Occupations by Sex
Within the Services occupations in Star City, the most male-oriented occupations are Security & Protection (100.0%), Firefighting & Prevention (100.0%), and Cleaning & Maintenance (100.0%), while the most female-oriented occupations are Healthcare Support (100.0%), and Food Preparation & Serving (67.9%).
| Occupation | Male | Female |
| Healthcare Support | 0 (0.0%) | 30 (100.0%) |
| Security & Protection | 6 (100.0%) | 0 (0.0%) |
| Firefighting & Prevention | 6 (100.0%) | 0 (0.0%) |
| Law Enforcement | 0 (0.0%) | 0 (0.0%) |
| Food Preparation & Serving | 42 (32.1%) | 89 (67.9%) |
| Cleaning & Maintenance | 32 (100.0%) | 0 (0.0%) |
| Personal Care & Service | 11 (100.0%) | 0 (0.0%) |
| Total (Category) | 91 (43.3%) | 119 (56.7%) |
| Total (Overall) | 724 (54.0%) | 616 (46.0%) |
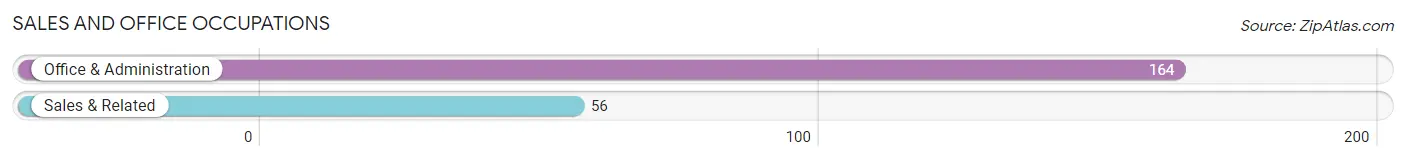
Sales and Office Occupations
The most common Sales and Office occupations in Star City are Office & Administration (164 | 12.2%), and Sales & Related (56 | 4.2%).
Sales and Office Occupations by Sex
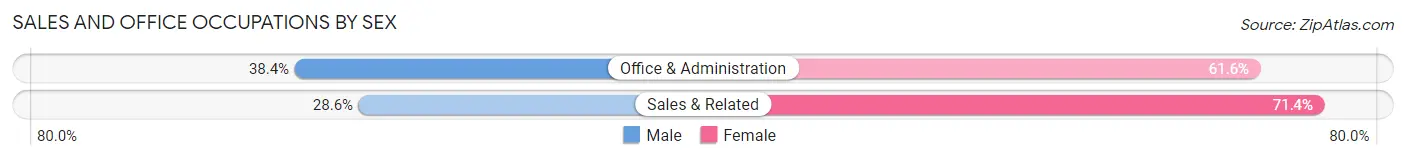
| Occupation | Male | Female |
| Sales & Related | 16 (28.6%) | 40 (71.4%) |
| Office & Administration | 63 (38.4%) | 101 (61.6%) |
| Total (Category) | 79 (35.9%) | 141 (64.1%) |
| Total (Overall) | 724 (54.0%) | 616 (46.0%) |
Natural Resources, Construction and Maintenance Occupations
The most common Natural Resources, Construction and Maintenance occupations in Star City are Construction & Extraction (32 | 2.4%), Installation, Maintenance & Repair (26 | 1.9%), and Farming, Fishing & Forestry (9 | 0.7%).

Natural Resources, Construction and Maintenance Occupations by Sex

| Occupation | Male | Female |
| Farming, Fishing & Forestry | 9 (100.0%) | 0 (0.0%) |
| Construction & Extraction | 32 (100.0%) | 0 (0.0%) |
| Installation, Maintenance & Repair | 26 (100.0%) | 0 (0.0%) |
| Total (Category) | 67 (100.0%) | 0 (0.0%) |
| Total (Overall) | 724 (54.0%) | 616 (46.0%) |
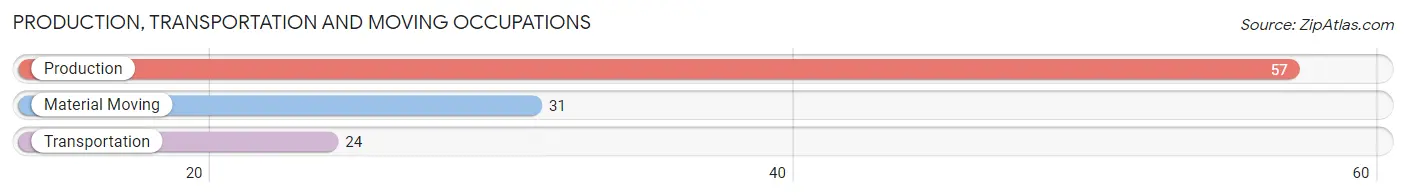
Production, Transportation and Moving Occupations
The most common Production, Transportation and Moving occupations in Star City are Production (57 | 4.3%), Material Moving (31 | 2.3%), and Transportation (24 | 1.8%).
Production, Transportation and Moving Occupations by Sex
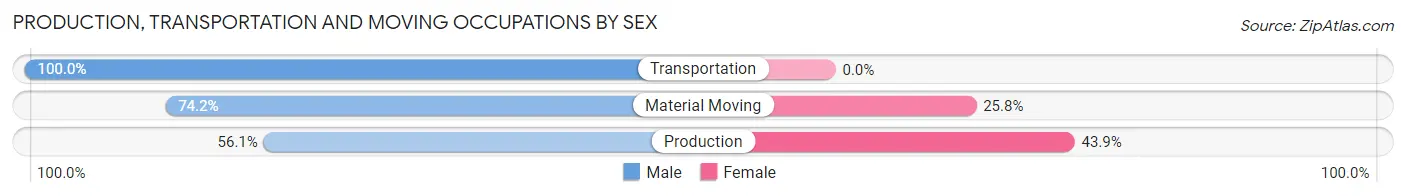
| Occupation | Male | Female |
| Production | 32 (56.1%) | 25 (43.9%) |
| Transportation | 24 (100.0%) | 0 (0.0%) |
| Material Moving | 23 (74.2%) | 8 (25.8%) |
| Total (Category) | 79 (70.5%) | 33 (29.5%) |
| Total (Overall) | 724 (54.0%) | 616 (46.0%) |
Employment Industries by Sex in Star City
Employment Industries in Star City
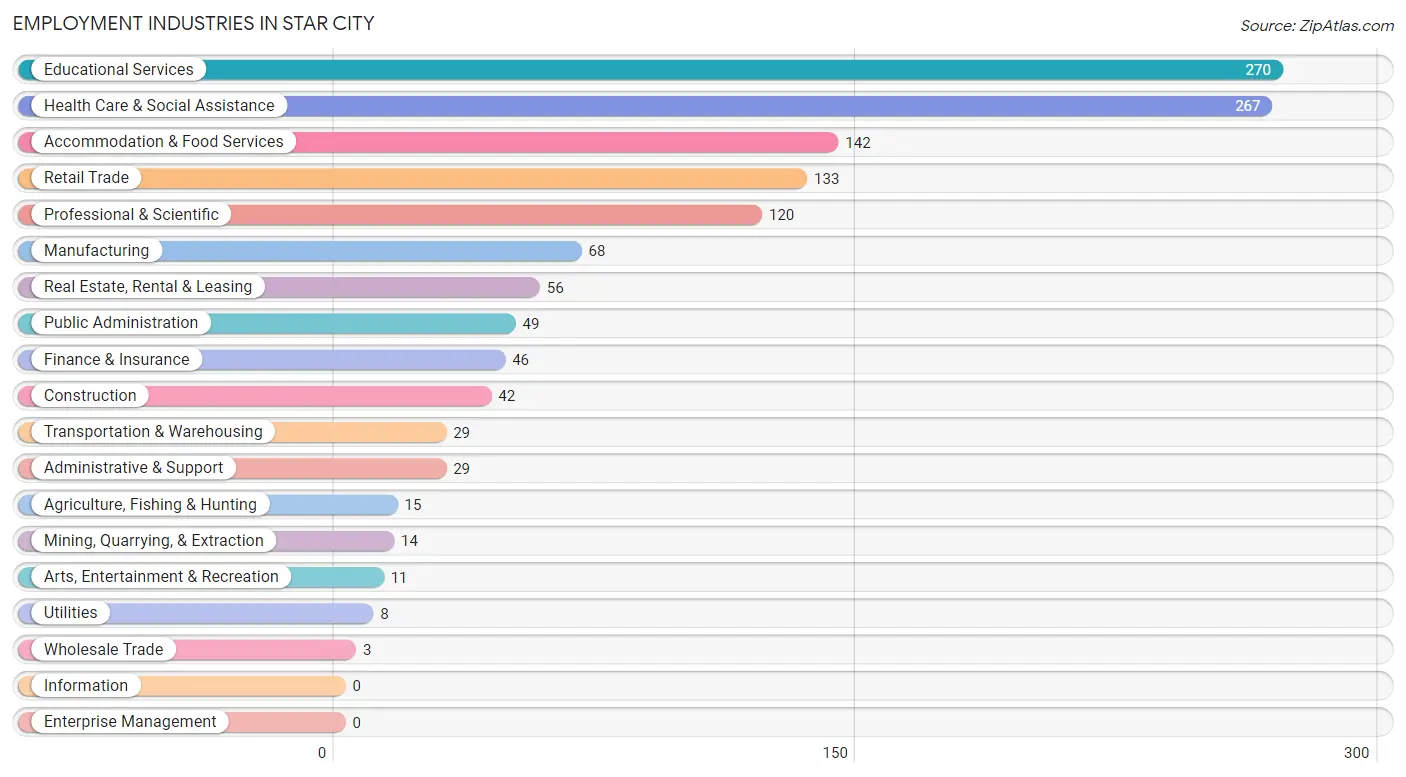
The major employment industries in Star City include Educational Services (270 | 20.2%), Health Care & Social Assistance (267 | 19.9%), Accommodation & Food Services (142 | 10.6%), Retail Trade (133 | 9.9%), and Professional & Scientific (120 | 9.0%).
Employment Industries by Sex in Star City
The Star City industries that see more men than women are Agriculture, Fishing & Hunting (100.0%), Mining, Quarrying, & Extraction (100.0%), and Construction (100.0%), whereas the industries that tend to have a higher number of women are Public Administration (77.5%), Health Care & Social Assistance (77.5%), and Retail Trade (66.2%).
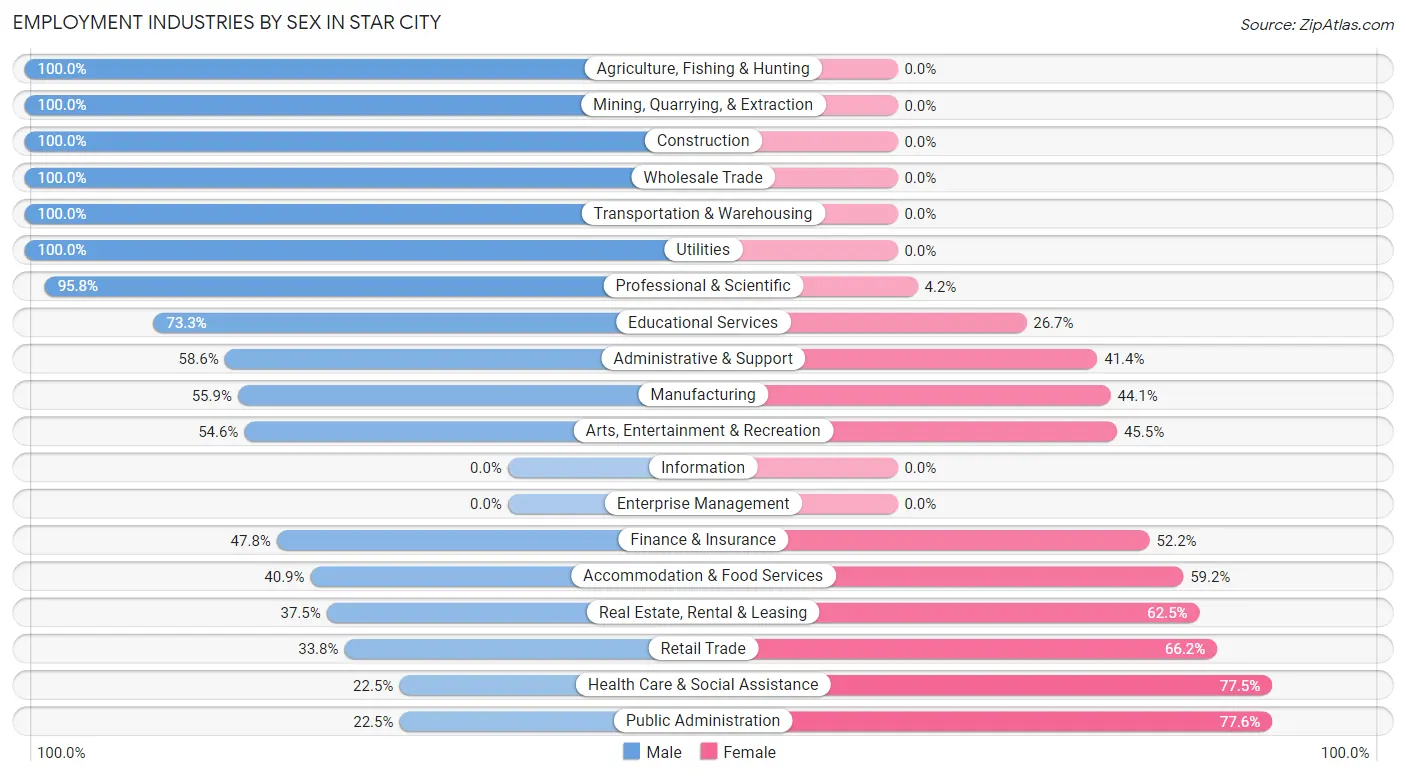
| Industry | Male | Female |
| Agriculture, Fishing & Hunting | 15 (100.0%) | 0 (0.0%) |
| Mining, Quarrying, & Extraction | 14 (100.0%) | 0 (0.0%) |
| Construction | 42 (100.0%) | 0 (0.0%) |
| Manufacturing | 38 (55.9%) | 30 (44.1%) |
| Wholesale Trade | 3 (100.0%) | 0 (0.0%) |
| Retail Trade | 45 (33.8%) | 88 (66.2%) |
| Transportation & Warehousing | 29 (100.0%) | 0 (0.0%) |
| Utilities | 8 (100.0%) | 0 (0.0%) |
| Information | 0 (0.0%) | 0 (0.0%) |
| Finance & Insurance | 22 (47.8%) | 24 (52.2%) |
| Real Estate, Rental & Leasing | 21 (37.5%) | 35 (62.5%) |
| Professional & Scientific | 115 (95.8%) | 5 (4.2%) |
| Enterprise Management | 0 (0.0%) | 0 (0.0%) |
| Administrative & Support | 17 (58.6%) | 12 (41.4%) |
| Educational Services | 198 (73.3%) | 72 (26.7%) |
| Health Care & Social Assistance | 60 (22.5%) | 207 (77.5%) |
| Arts, Entertainment & Recreation | 6 (54.5%) | 5 (45.5%) |
| Accommodation & Food Services | 58 (40.8%) | 84 (59.2%) |
| Public Administration | 11 (22.5%) | 38 (77.5%) |
| Total | 724 (54.0%) | 616 (46.0%) |
Education in Star City
School Enrollment in Star City
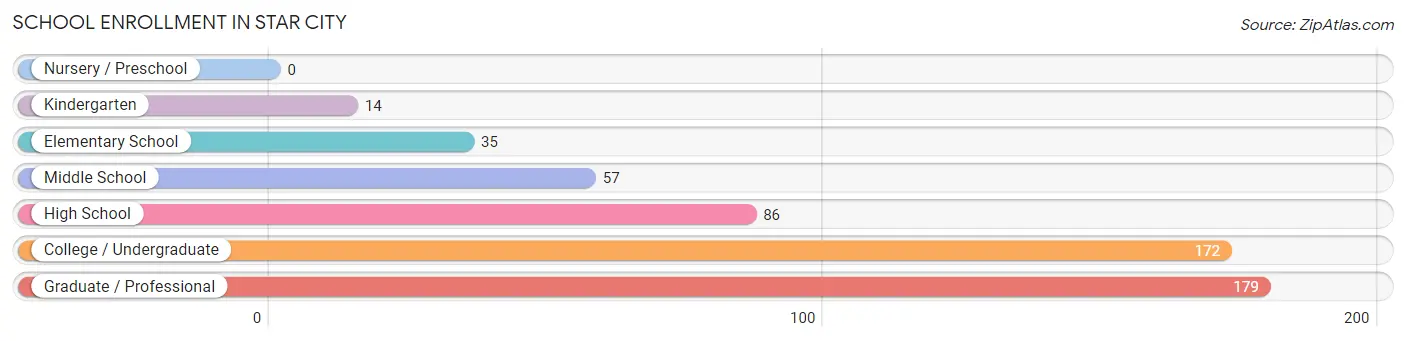
The most common levels of schooling among the 543 students in Star City are graduate / professional (179 | 33.0%), college / undergraduate (172 | 31.7%), and high school (86 | 15.8%).
| School Level | # Students | % Students |
| Nursery / Preschool | 0 | 0.0% |
| Kindergarten | 14 | 2.6% |
| Elementary School | 35 | 6.5% |
| Middle School | 57 | 10.5% |
| High School | 86 | 15.8% |
| College / Undergraduate | 172 | 31.7% |
| Graduate / Professional | 179 | 33.0% |
| Total | 543 | 100.0% |
School Enrollment by Age by Funding Source in Star City
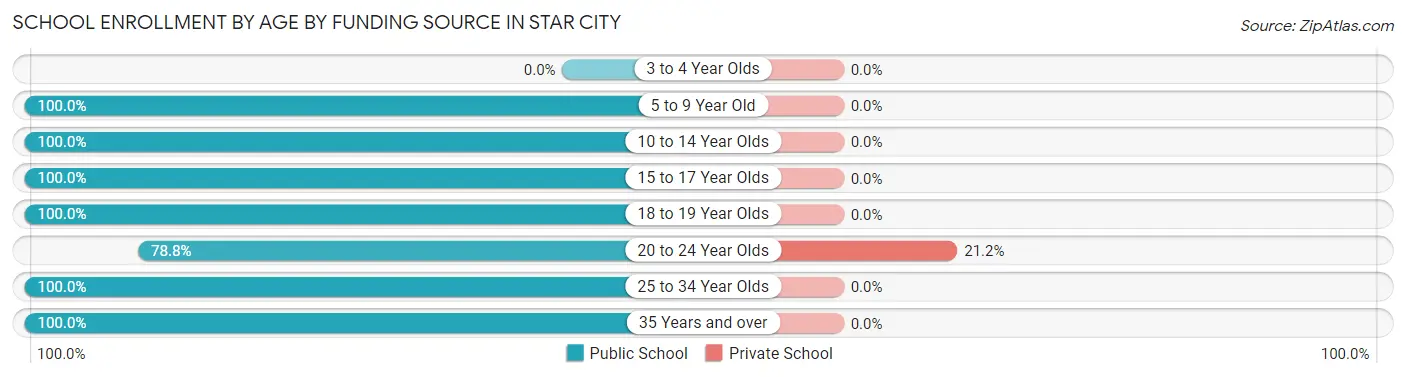
Out of a total of 543 students who are enrolled in schools in Star City, 40 (7.4%) attend a private institution, while the remaining 503 (92.6%) are enrolled in public schools. The age group of 20 to 24 year olds has the highest likelihood of being enrolled in private schools, with 40 (21.2% in the age bracket) enrolled. Conversely, the age group of 5 to 9 year old has the lowest likelihood of being enrolled in a private school, with 59 (100.0% in the age bracket) attending a public institution.
| Age Bracket | Public School | Private School |
| 3 to 4 Year Olds | 0 (0.0%) | 0 (0.0%) |
| 5 to 9 Year Old | 59 (100.0%) | 0 (0.0%) |
| 10 to 14 Year Olds | 47 (100.0%) | 0 (0.0%) |
| 15 to 17 Year Olds | 79 (100.0%) | 0 (0.0%) |
| 18 to 19 Year Olds | 24 (100.0%) | 0 (0.0%) |
| 20 to 24 Year Olds | 149 (78.8%) | 40 (21.2%) |
| 25 to 34 Year Olds | 121 (100.0%) | 0 (0.0%) |
| 35 Years and over | 24 (100.0%) | 0 (0.0%) |
| Total | 503 (92.6%) | 40 (7.4%) |
Educational Attainment by Field of Study in Star City
Science & technology (103 | 11.0%), business (101 | 10.8%), engineering (97 | 10.3%), social sciences (91 | 9.7%), and education (79 | 8.4%) are the most common fields of study among 939 individuals in Star City who have obtained a bachelor's degree or higher.
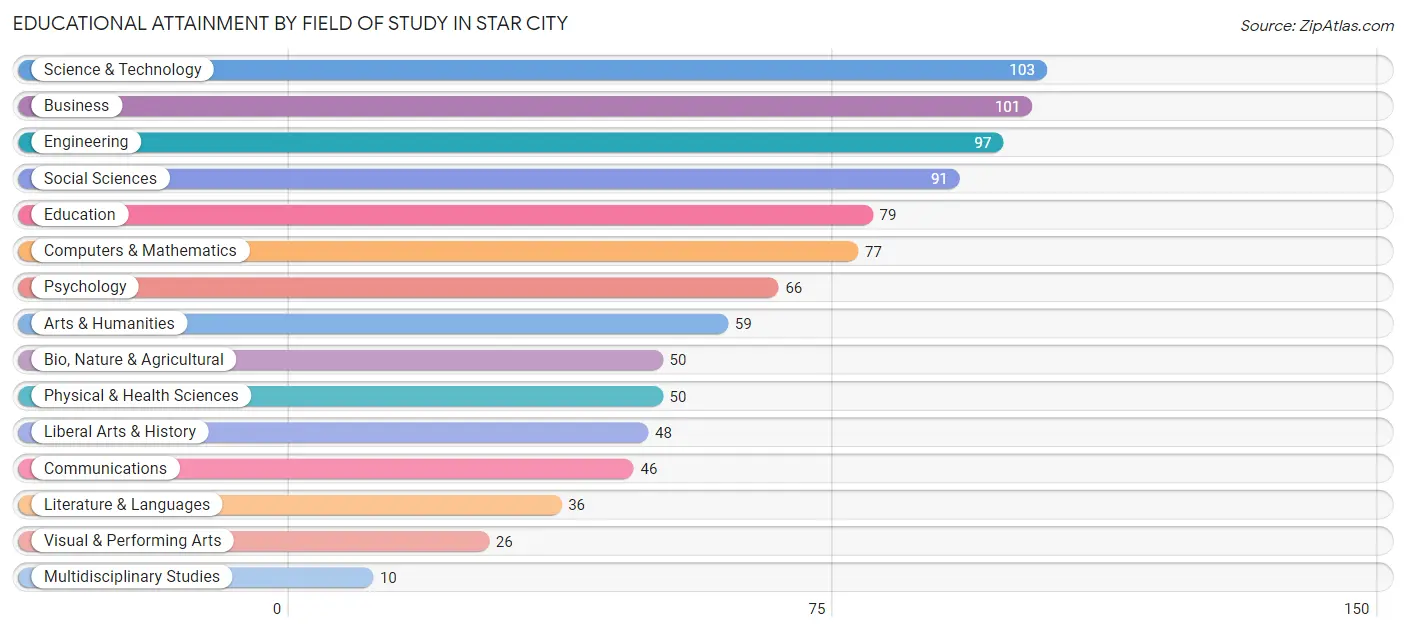
| Field of Study | # Graduates | % Graduates |
| Computers & Mathematics | 77 | 8.2% |
| Bio, Nature & Agricultural | 50 | 5.3% |
| Physical & Health Sciences | 50 | 5.3% |
| Psychology | 66 | 7.0% |
| Social Sciences | 91 | 9.7% |
| Engineering | 97 | 10.3% |
| Multidisciplinary Studies | 10 | 1.1% |
| Science & Technology | 103 | 11.0% |
| Business | 101 | 10.8% |
| Education | 79 | 8.4% |
| Literature & Languages | 36 | 3.8% |
| Liberal Arts & History | 48 | 5.1% |
| Visual & Performing Arts | 26 | 2.8% |
| Communications | 46 | 4.9% |
| Arts & Humanities | 59 | 6.3% |
| Total | 939 | 100.0% |
Transportation & Commute in Star City
Vehicle Availability by Sex in Star City
The most prevalent vehicle ownership categories in Star City are males with 2 vehicles (348, accounting for 47.4%) and females with 2 vehicles (266, making up 57.1%).
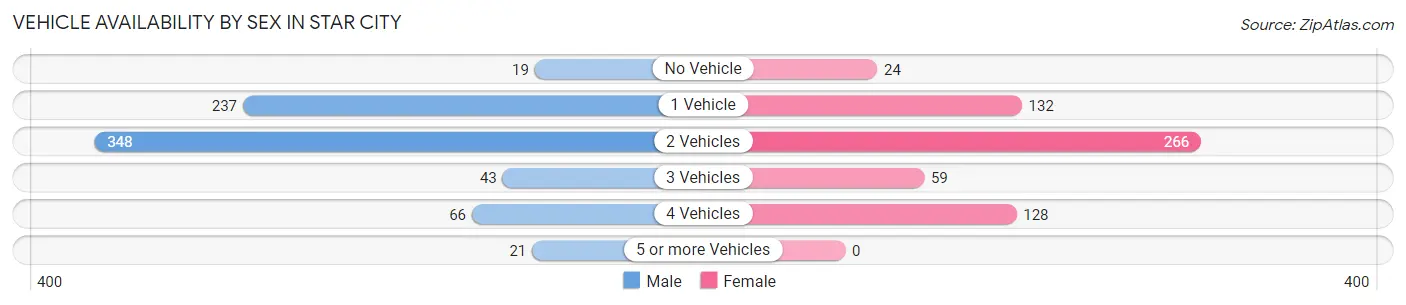
| Vehicles Available | Male | Female |
| No Vehicle | 19 (2.6%) | 24 (3.9%) |
| 1 Vehicle | 237 (32.3%) | 132 (21.7%) |
| 2 Vehicles | 348 (47.4%) | 266 (43.7%) |
| 3 Vehicles | 43 (5.9%) | 59 (9.7%) |
| 4 Vehicles | 66 (9.0%) | 128 (21.0%) |
| 5 or more Vehicles | 21 (2.9%) | 0 (0.0%) |
| Total | 734 (100.0%) | 609 (100.0%) |
Commute Time in Star City
The most frequently occuring commute durations in Star City are 10 to 14 minutes (288 commuters, 24.9%), 5 to 9 minutes (205 commuters, 17.7%), and 20 to 24 minutes (189 commuters, 16.4%).
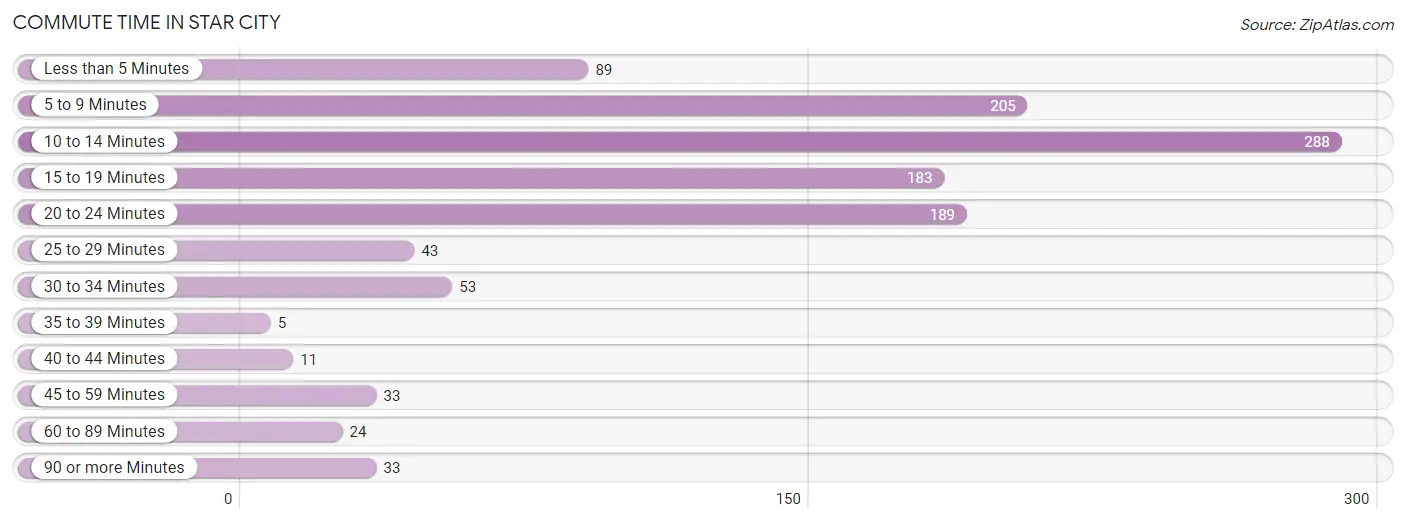
| Commute Time | # Commuters | % Commuters |
| Less than 5 Minutes | 89 | 7.7% |
| 5 to 9 Minutes | 205 | 17.7% |
| 10 to 14 Minutes | 288 | 24.9% |
| 15 to 19 Minutes | 183 | 15.8% |
| 20 to 24 Minutes | 189 | 16.4% |
| 25 to 29 Minutes | 43 | 3.7% |
| 30 to 34 Minutes | 53 | 4.6% |
| 35 to 39 Minutes | 5 | 0.4% |
| 40 to 44 Minutes | 11 | 0.9% |
| 45 to 59 Minutes | 33 | 2.9% |
| 60 to 89 Minutes | 24 | 2.1% |
| 90 or more Minutes | 33 | 2.9% |
Commute Time by Sex in Star City
The most common commute times in Star City are 5 to 9 minutes (148 commuters, 22.9%) for males and 10 to 14 minutes (181 commuters, 35.6%) for females.
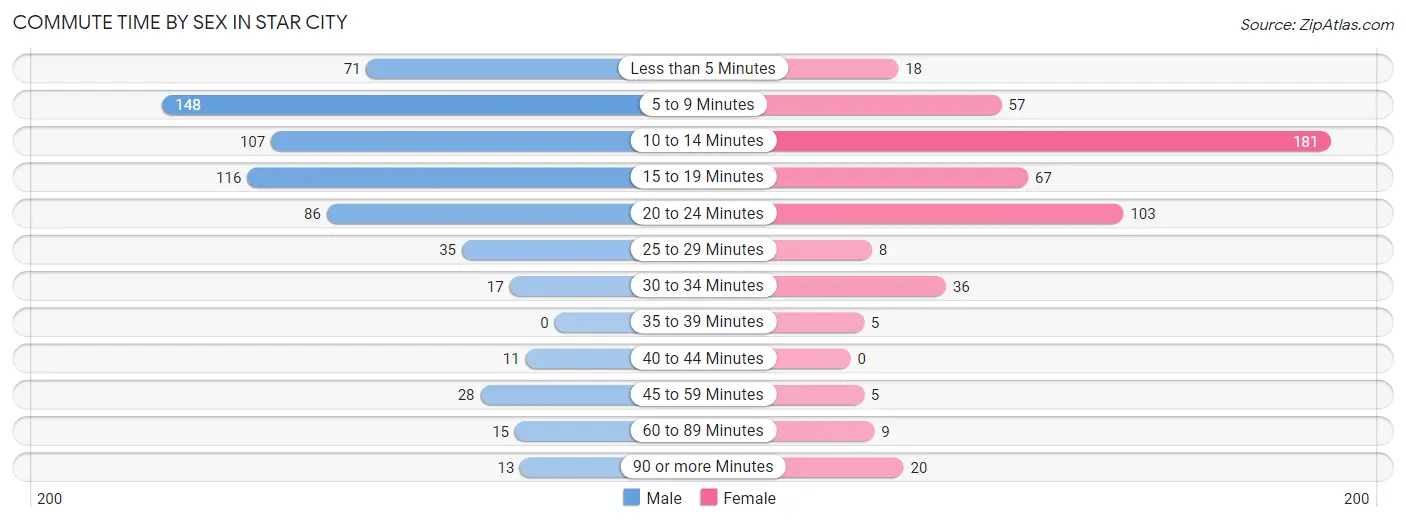
| Commute Time | Male | Female |
| Less than 5 Minutes | 71 (11.0%) | 18 (3.5%) |
| 5 to 9 Minutes | 148 (22.9%) | 57 (11.2%) |
| 10 to 14 Minutes | 107 (16.5%) | 181 (35.6%) |
| 15 to 19 Minutes | 116 (17.9%) | 67 (13.2%) |
| 20 to 24 Minutes | 86 (13.3%) | 103 (20.2%) |
| 25 to 29 Minutes | 35 (5.4%) | 8 (1.6%) |
| 30 to 34 Minutes | 17 (2.6%) | 36 (7.1%) |
| 35 to 39 Minutes | 0 (0.0%) | 5 (1.0%) |
| 40 to 44 Minutes | 11 (1.7%) | 0 (0.0%) |
| 45 to 59 Minutes | 28 (4.3%) | 5 (1.0%) |
| 60 to 89 Minutes | 15 (2.3%) | 9 (1.8%) |
| 90 or more Minutes | 13 (2.0%) | 20 (3.9%) |
Time of Departure to Work by Sex in Star City
The most frequent times of departure to work in Star City are 8:30 AM to 8:59 AM (140, 21.6%) for males and 6:30 AM to 6:59 AM (66, 13.0%) for females.
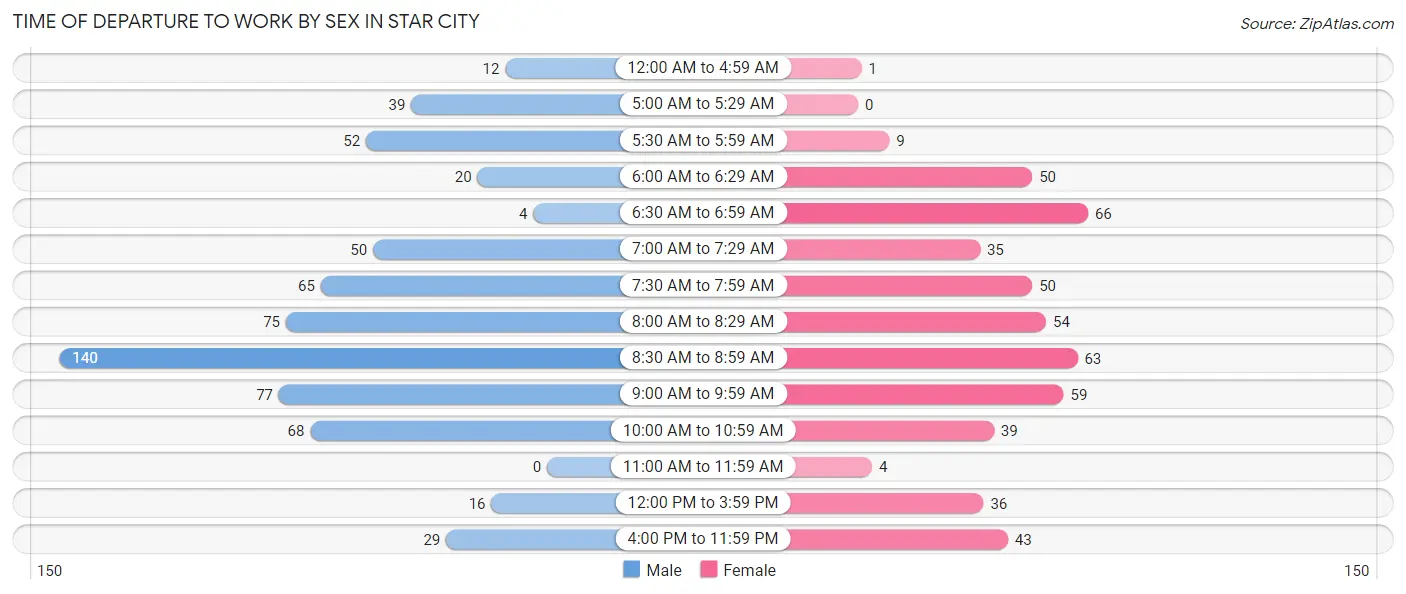
| Time of Departure | Male | Female |
| 12:00 AM to 4:59 AM | 12 (1.8%) | 1 (0.2%) |
| 5:00 AM to 5:29 AM | 39 (6.0%) | 0 (0.0%) |
| 5:30 AM to 5:59 AM | 52 (8.0%) | 9 (1.8%) |
| 6:00 AM to 6:29 AM | 20 (3.1%) | 50 (9.8%) |
| 6:30 AM to 6:59 AM | 4 (0.6%) | 66 (13.0%) |
| 7:00 AM to 7:29 AM | 50 (7.7%) | 35 (6.9%) |
| 7:30 AM to 7:59 AM | 65 (10.1%) | 50 (9.8%) |
| 8:00 AM to 8:29 AM | 75 (11.6%) | 54 (10.6%) |
| 8:30 AM to 8:59 AM | 140 (21.6%) | 63 (12.4%) |
| 9:00 AM to 9:59 AM | 77 (11.9%) | 59 (11.6%) |
| 10:00 AM to 10:59 AM | 68 (10.5%) | 39 (7.7%) |
| 11:00 AM to 11:59 AM | 0 (0.0%) | 4 (0.8%) |
| 12:00 PM to 3:59 PM | 16 (2.5%) | 36 (7.1%) |
| 4:00 PM to 11:59 PM | 29 (4.5%) | 43 (8.5%) |
| Total | 647 (100.0%) | 509 (100.0%) |
Housing Occupancy in Star City
Occupancy by Ownership in Star City
Of the total 1,032 dwellings in Star City, owner-occupied units account for 480 (46.5%), while renter-occupied units make up 552 (53.5%).
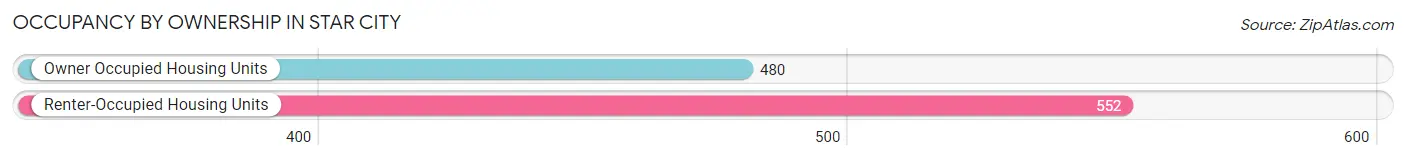
| Occupancy | # Housing Units | % Housing Units |
| Owner Occupied Housing Units | 480 | 46.5% |
| Renter-Occupied Housing Units | 552 | 53.5% |
| Total Occupied Housing Units | 1,032 | 100.0% |
Occupancy by Household Size in Star City
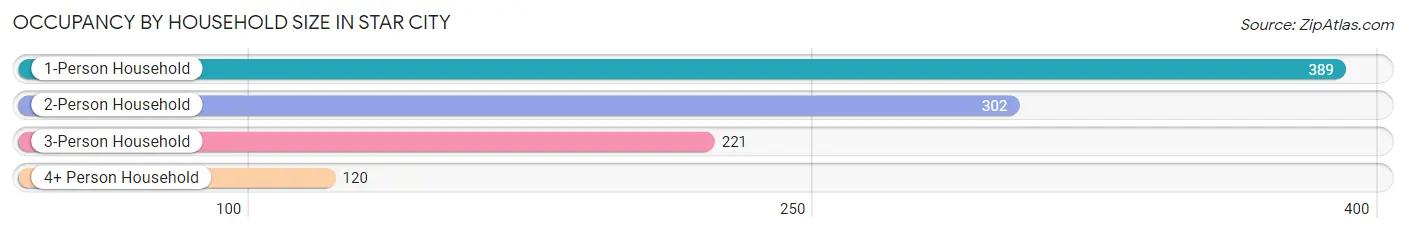
| Household Size | # Housing Units | % Housing Units |
| 1-Person Household | 389 | 37.7% |
| 2-Person Household | 302 | 29.3% |
| 3-Person Household | 221 | 21.4% |
| 4+ Person Household | 120 | 11.6% |
| Total Housing Units | 1,032 | 100.0% |
Occupancy by Ownership by Household Size in Star City
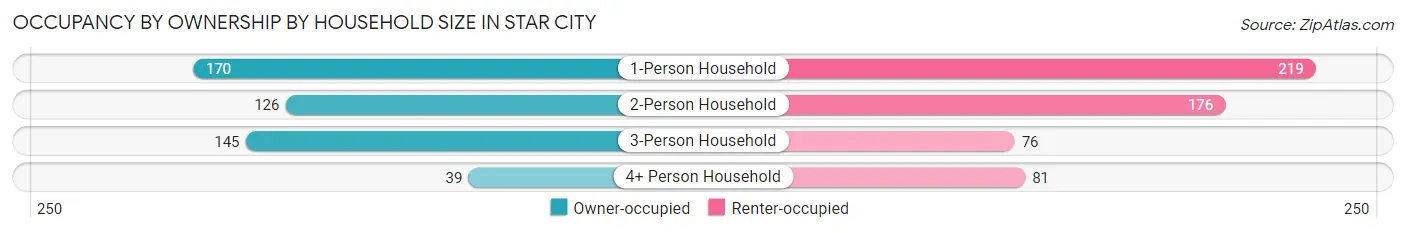
| Household Size | Owner-occupied | Renter-occupied |
| 1-Person Household | 170 (43.7%) | 219 (56.3%) |
| 2-Person Household | 126 (41.7%) | 176 (58.3%) |
| 3-Person Household | 145 (65.6%) | 76 (34.4%) |
| 4+ Person Household | 39 (32.5%) | 81 (67.5%) |
| Total Housing Units | 480 (46.5%) | 552 (53.5%) |
Occupancy by Educational Attainment in Star City
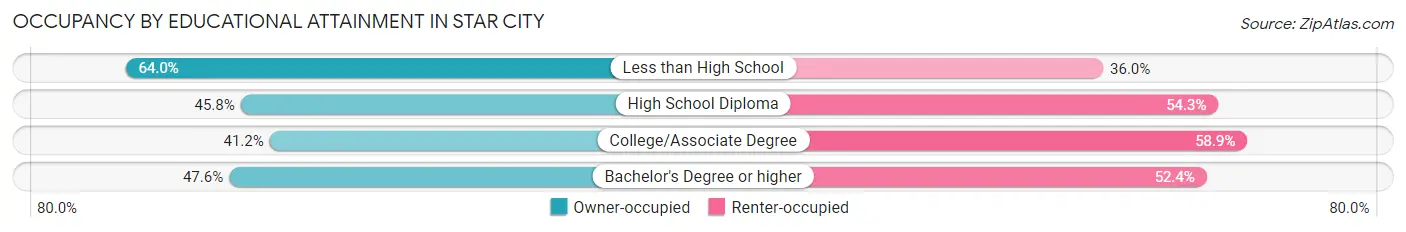
| Household Size | Owner-occupied | Renter-occupied |
| Less than High School | 16 (64.0%) | 9 (36.0%) |
| High School Diploma | 70 (45.8%) | 83 (54.2%) |
| College/Associate Degree | 79 (41.1%) | 113 (58.9%) |
| Bachelor's Degree or higher | 315 (47.6%) | 347 (52.4%) |
Occupancy by Age of Householder in Star City
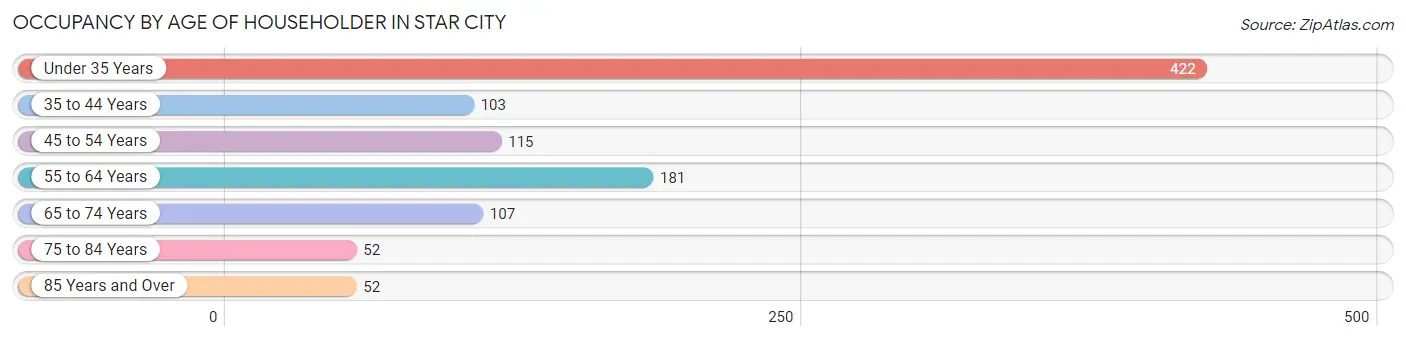
| Age Bracket | # Households | % Households |
| Under 35 Years | 422 | 40.9% |
| 35 to 44 Years | 103 | 10.0% |
| 45 to 54 Years | 115 | 11.1% |
| 55 to 64 Years | 181 | 17.5% |
| 65 to 74 Years | 107 | 10.4% |
| 75 to 84 Years | 52 | 5.0% |
| 85 Years and Over | 52 | 5.0% |
| Total | 1,032 | 100.0% |
Housing Finances in Star City
Median Income by Occupancy in Star City
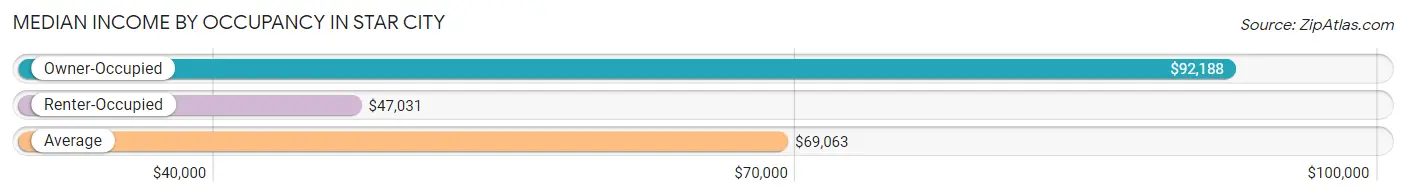
| Occupancy Type | # Households | Median Income |
| Owner-Occupied | 480 (46.5%) | $92,188 |
| Renter-Occupied | 552 (53.5%) | $47,031 |
| Average | 1,032 (100.0%) | $69,063 |
Occupancy by Householder Income Bracket in Star City
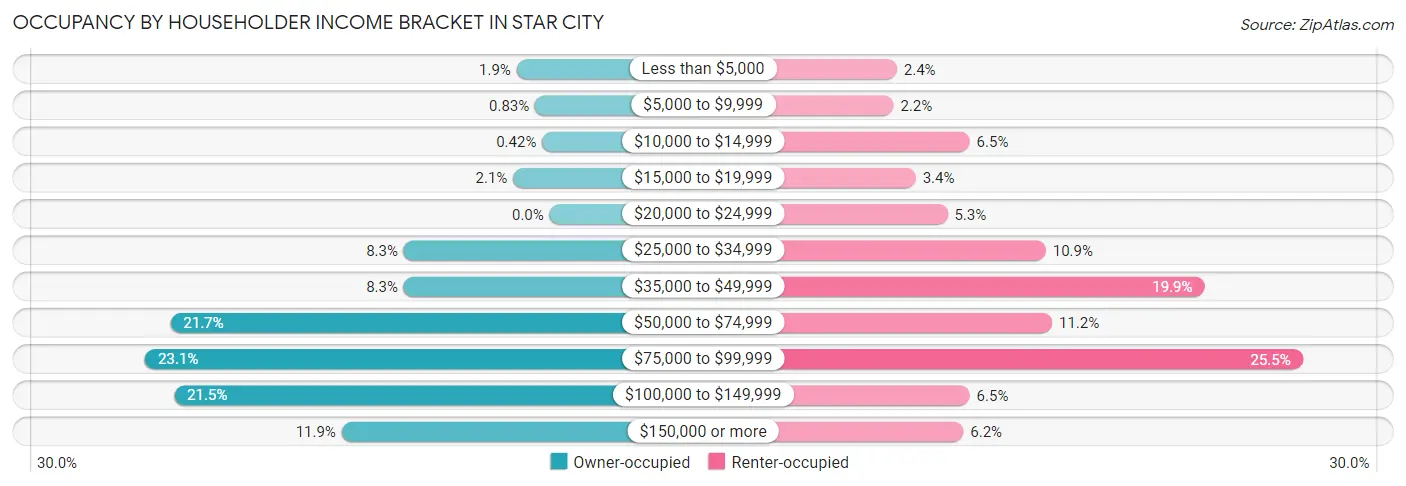
| Income Bracket | Owner-occupied | Renter-occupied |
| Less than $5,000 | 9 (1.9%) | 13 (2.4%) |
| $5,000 to $9,999 | 4 (0.8%) | 12 (2.2%) |
| $10,000 to $14,999 | 2 (0.4%) | 36 (6.5%) |
| $15,000 to $19,999 | 10 (2.1%) | 19 (3.4%) |
| $20,000 to $24,999 | 0 (0.0%) | 29 (5.2%) |
| $25,000 to $34,999 | 40 (8.3%) | 60 (10.9%) |
| $35,000 to $49,999 | 40 (8.3%) | 110 (19.9%) |
| $50,000 to $74,999 | 104 (21.7%) | 62 (11.2%) |
| $75,000 to $99,999 | 111 (23.1%) | 141 (25.5%) |
| $100,000 to $149,999 | 103 (21.5%) | 36 (6.5%) |
| $150,000 or more | 57 (11.9%) | 34 (6.2%) |
| Total | 480 (100.0%) | 552 (100.0%) |
Monthly Housing Cost Tiers in Star City
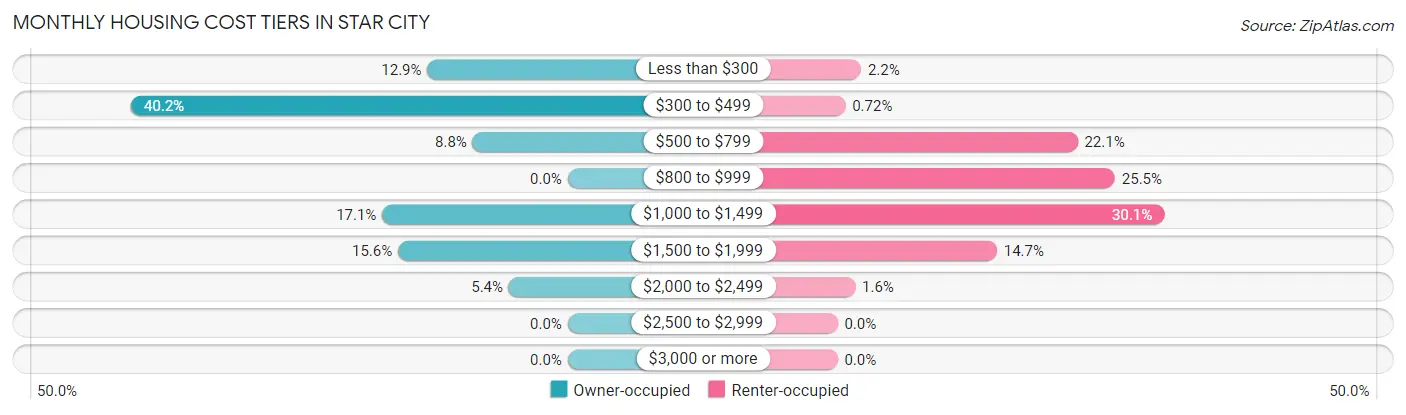
| Monthly Cost | Owner-occupied | Renter-occupied |
| Less than $300 | 62 (12.9%) | 12 (2.2%) |
| $300 to $499 | 193 (40.2%) | 4 (0.7%) |
| $500 to $799 | 42 (8.7%) | 122 (22.1%) |
| $800 to $999 | 0 (0.0%) | 141 (25.5%) |
| $1,000 to $1,499 | 82 (17.1%) | 166 (30.1%) |
| $1,500 to $1,999 | 75 (15.6%) | 81 (14.7%) |
| $2,000 to $2,499 | 26 (5.4%) | 9 (1.6%) |
| $2,500 to $2,999 | 0 (0.0%) | 0 (0.0%) |
| $3,000 or more | 0 (0.0%) | 0 (0.0%) |
| Total | 480 (100.0%) | 552 (100.0%) |
Physical Housing Characteristics in Star City
Housing Structures in Star City
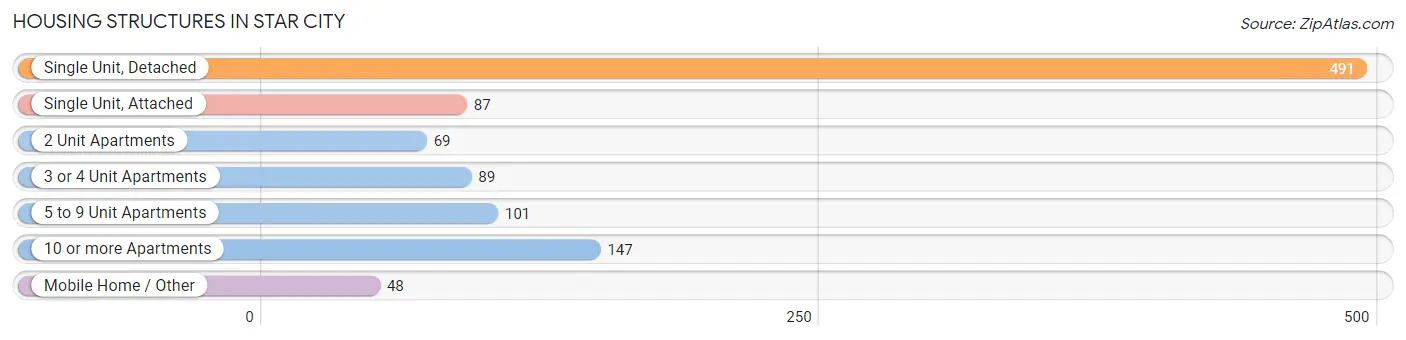
| Structure Type | # Housing Units | % Housing Units |
| Single Unit, Detached | 491 | 47.6% |
| Single Unit, Attached | 87 | 8.4% |
| 2 Unit Apartments | 69 | 6.7% |
| 3 or 4 Unit Apartments | 89 | 8.6% |
| 5 to 9 Unit Apartments | 101 | 9.8% |
| 10 or more Apartments | 147 | 14.2% |
| Mobile Home / Other | 48 | 4.6% |
| Total | 1,032 | 100.0% |
Housing Structures by Occupancy in Star City
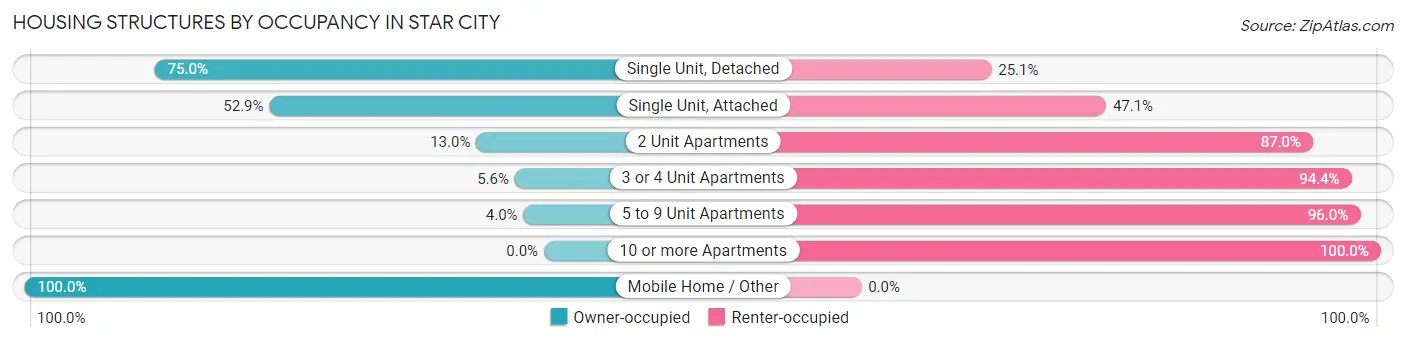
| Structure Type | Owner-occupied | Renter-occupied |
| Single Unit, Detached | 368 (75.0%) | 123 (25.1%) |
| Single Unit, Attached | 46 (52.9%) | 41 (47.1%) |
| 2 Unit Apartments | 9 (13.0%) | 60 (87.0%) |
| 3 or 4 Unit Apartments | 5 (5.6%) | 84 (94.4%) |
| 5 to 9 Unit Apartments | 4 (4.0%) | 97 (96.0%) |
| 10 or more Apartments | 0 (0.0%) | 147 (100.0%) |
| Mobile Home / Other | 48 (100.0%) | 0 (0.0%) |
| Total | 480 (46.5%) | 552 (53.5%) |
Housing Structures by Number of Rooms in Star City
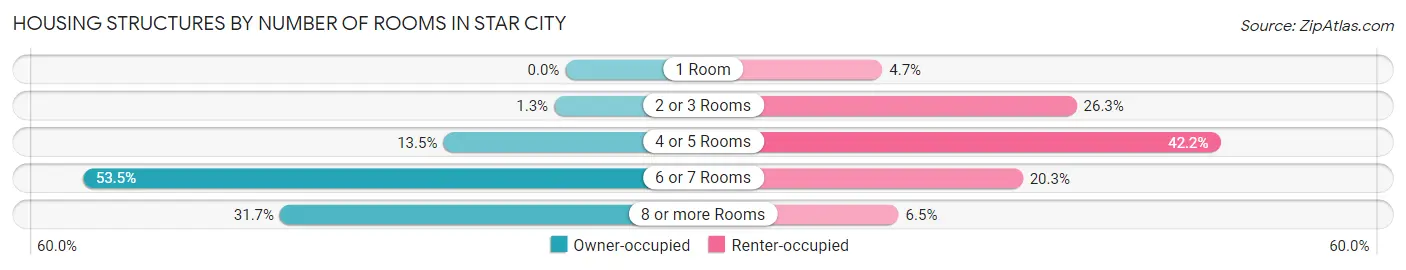
| Number of Rooms | Owner-occupied | Renter-occupied |
| 1 Room | 0 (0.0%) | 26 (4.7%) |
| 2 or 3 Rooms | 6 (1.3%) | 145 (26.3%) |
| 4 or 5 Rooms | 65 (13.5%) | 233 (42.2%) |
| 6 or 7 Rooms | 257 (53.5%) | 112 (20.3%) |
| 8 or more Rooms | 152 (31.7%) | 36 (6.5%) |
| Total | 480 (100.0%) | 552 (100.0%) |
Housing Structure by Heating Type in Star City
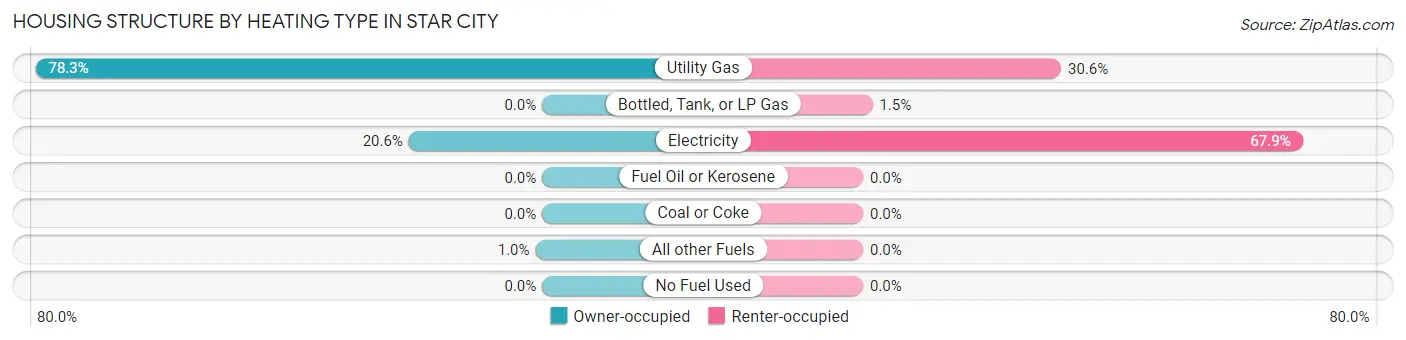
| Heating Type | Owner-occupied | Renter-occupied |
| Utility Gas | 376 (78.3%) | 169 (30.6%) |
| Bottled, Tank, or LP Gas | 0 (0.0%) | 8 (1.5%) |
| Electricity | 99 (20.6%) | 375 (67.9%) |
| Fuel Oil or Kerosene | 0 (0.0%) | 0 (0.0%) |
| Coal or Coke | 0 (0.0%) | 0 (0.0%) |
| All other Fuels | 5 (1.0%) | 0 (0.0%) |
| No Fuel Used | 0 (0.0%) | 0 (0.0%) |
| Total | 480 (100.0%) | 552 (100.0%) |
Household Vehicle Usage in Star City
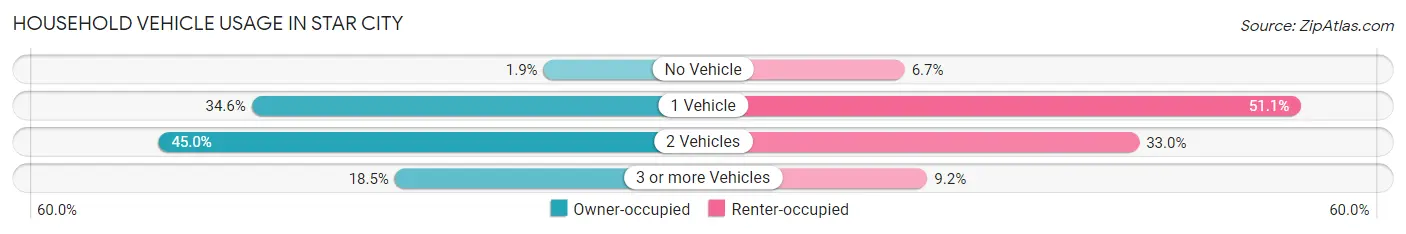
| Vehicles per Household | Owner-occupied | Renter-occupied |
| No Vehicle | 9 (1.9%) | 37 (6.7%) |
| 1 Vehicle | 166 (34.6%) | 282 (51.1%) |
| 2 Vehicles | 216 (45.0%) | 182 (33.0%) |
| 3 or more Vehicles | 89 (18.5%) | 51 (9.2%) |
| Total | 480 (100.0%) | 552 (100.0%) |
Real Estate & Mortgages in Star City
Real Estate and Mortgage Overview in Star City
| Characteristic | Without Mortgage | With Mortgage |
| Housing Units | 279 | 201 |
| Median Property Value | $250,300 | $247,700 |
| Median Household Income | $66,908 | $26 |
| Monthly Housing Costs | $370 | $0 |
| Real Estate Taxes | $989 | $0 |
Property Value by Mortgage Status in Star City
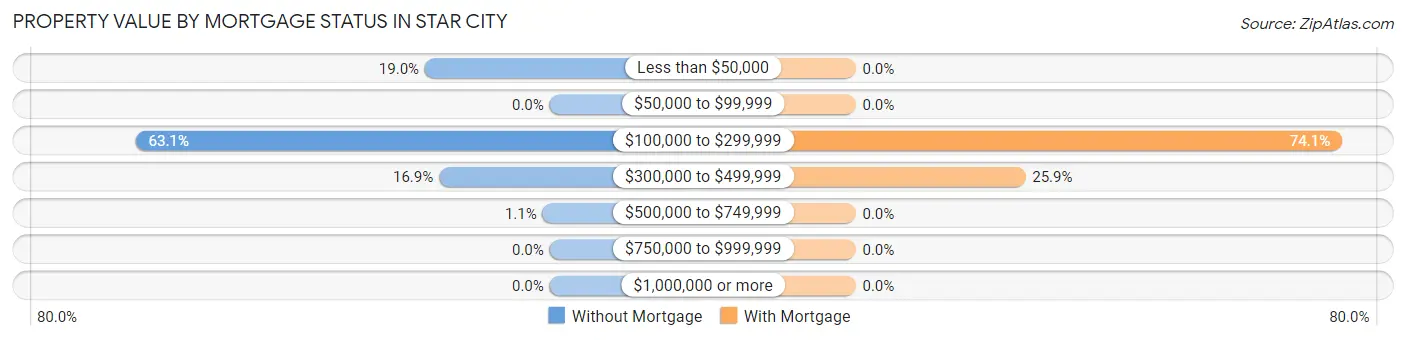
| Property Value | Without Mortgage | With Mortgage |
| Less than $50,000 | 53 (19.0%) | 0 (0.0%) |
| $50,000 to $99,999 | 0 (0.0%) | 0 (0.0%) |
| $100,000 to $299,999 | 176 (63.1%) | 149 (74.1%) |
| $300,000 to $499,999 | 47 (16.9%) | 52 (25.9%) |
| $500,000 to $749,999 | 3 (1.1%) | 0 (0.0%) |
| $750,000 to $999,999 | 0 (0.0%) | 0 (0.0%) |
| $1,000,000 or more | 0 (0.0%) | 0 (0.0%) |
| Total | 279 (100.0%) | 201 (100.0%) |
Household Income by Mortgage Status in Star City
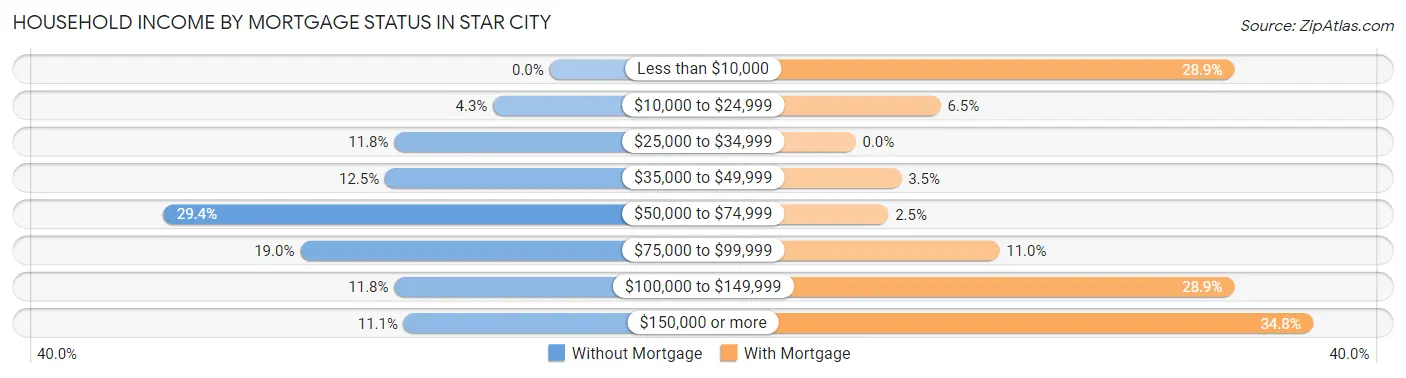
| Household Income | Without Mortgage | With Mortgage |
| Less than $10,000 | 0 (0.0%) | 58 (28.9%) |
| $10,000 to $24,999 | 12 (4.3%) | 13 (6.5%) |
| $25,000 to $34,999 | 33 (11.8%) | 0 (0.0%) |
| $35,000 to $49,999 | 35 (12.5%) | 7 (3.5%) |
| $50,000 to $74,999 | 82 (29.4%) | 5 (2.5%) |
| $75,000 to $99,999 | 53 (19.0%) | 22 (11.0%) |
| $100,000 to $149,999 | 33 (11.8%) | 58 (28.9%) |
| $150,000 or more | 31 (11.1%) | 70 (34.8%) |
| Total | 279 (100.0%) | 201 (100.0%) |
Property Value to Household Income Ratio in Star City
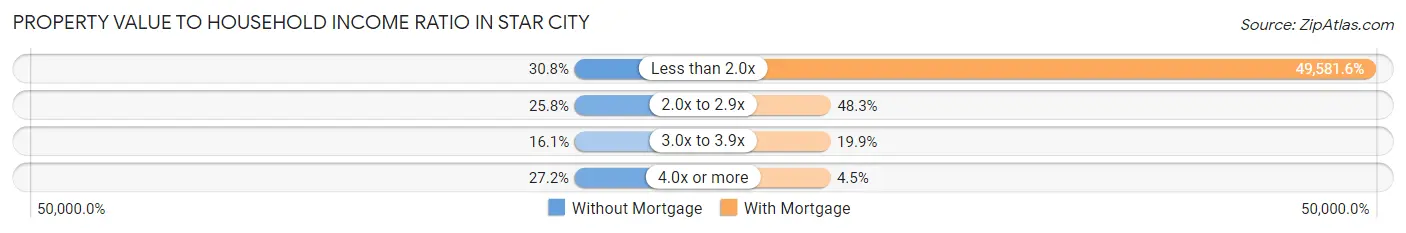
| Value-to-Income Ratio | Without Mortgage | With Mortgage |
| Less than 2.0x | 86 (30.8%) | 99,659 (49,581.6%) |
| 2.0x to 2.9x | 72 (25.8%) | 97 (48.3%) |
| 3.0x to 3.9x | 45 (16.1%) | 40 (19.9%) |
| 4.0x or more | 76 (27.2%) | 9 (4.5%) |
| Total | 279 (100.0%) | 201 (100.0%) |
Real Estate Taxes by Mortgage Status in Star City
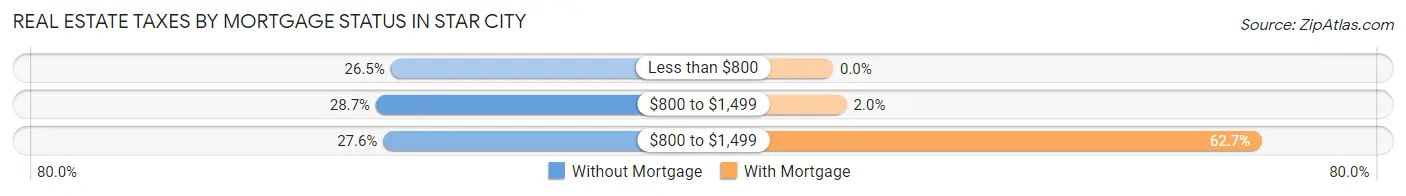
| Property Taxes | Without Mortgage | With Mortgage |
| Less than $800 | 74 (26.5%) | 0 (0.0%) |
| $800 to $1,499 | 80 (28.7%) | 4 (2.0%) |
| $800 to $1,499 | 77 (27.6%) | 126 (62.7%) |
| Total | 279 (100.0%) | 201 (100.0%) |
Health & Disability in Star City
Health Insurance Coverage by Age in Star City
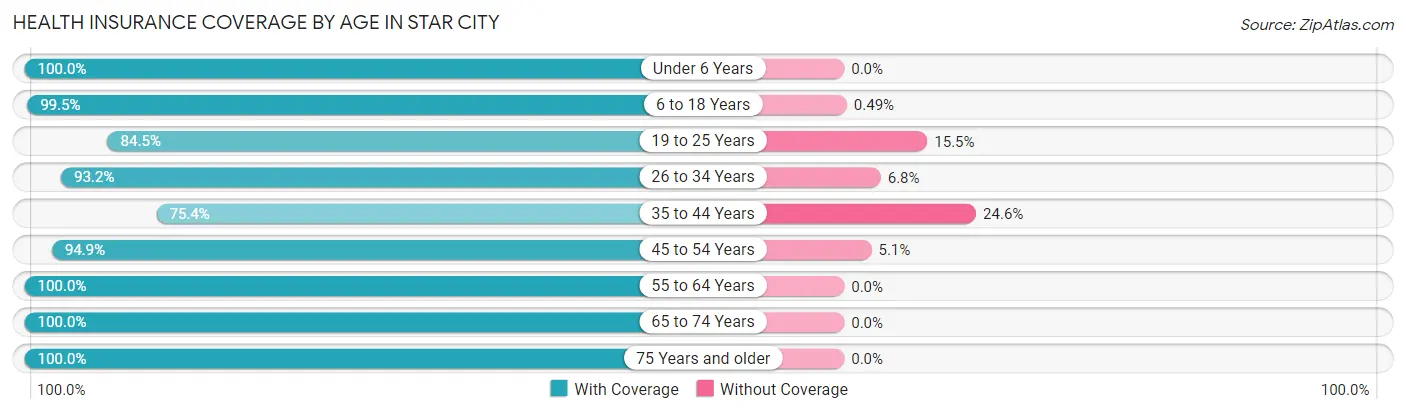
| Age Bracket | With Coverage | Without Coverage |
| Under 6 Years | 38 (100.0%) | 0 (0.0%) |
| 6 to 18 Years | 202 (99.5%) | 1 (0.5%) |
| 19 to 25 Years | 371 (84.5%) | 68 (15.5%) |
| 26 to 34 Years | 397 (93.2%) | 29 (6.8%) |
| 35 to 44 Years | 184 (75.4%) | 60 (24.6%) |
| 45 to 54 Years | 168 (94.9%) | 9 (5.1%) |
| 55 to 64 Years | 321 (100.0%) | 0 (0.0%) |
| 65 to 74 Years | 170 (100.0%) | 0 (0.0%) |
| 75 Years and older | 125 (100.0%) | 0 (0.0%) |
| Total | 1,976 (92.2%) | 167 (7.8%) |
Health Insurance Coverage by Citizenship Status in Star City

| Citizenship Status | With Coverage | Without Coverage |
| Native Born | 38 (100.0%) | 0 (0.0%) |
| Foreign Born, Citizen | 202 (99.5%) | 1 (0.5%) |
| Foreign Born, not a Citizen | 371 (84.5%) | 68 (15.5%) |
Health Insurance Coverage by Household Income in Star City
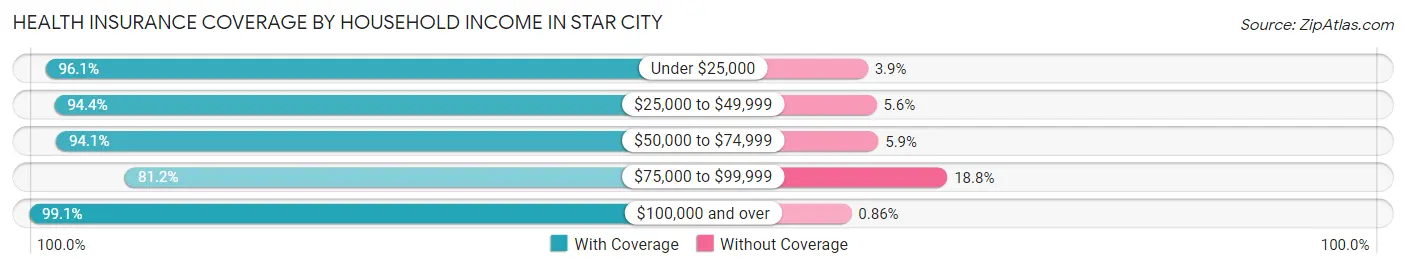
| Household Income | With Coverage | Without Coverage |
| Under $25,000 | 147 (96.1%) | 6 (3.9%) |
| $25,000 to $49,999 | 357 (94.4%) | 21 (5.6%) |
| $50,000 to $74,999 | 287 (94.1%) | 18 (5.9%) |
| $75,000 to $99,999 | 496 (81.2%) | 115 (18.8%) |
| $100,000 and over | 688 (99.1%) | 6 (0.9%) |
Public vs Private Health Insurance Coverage by Age in Star City
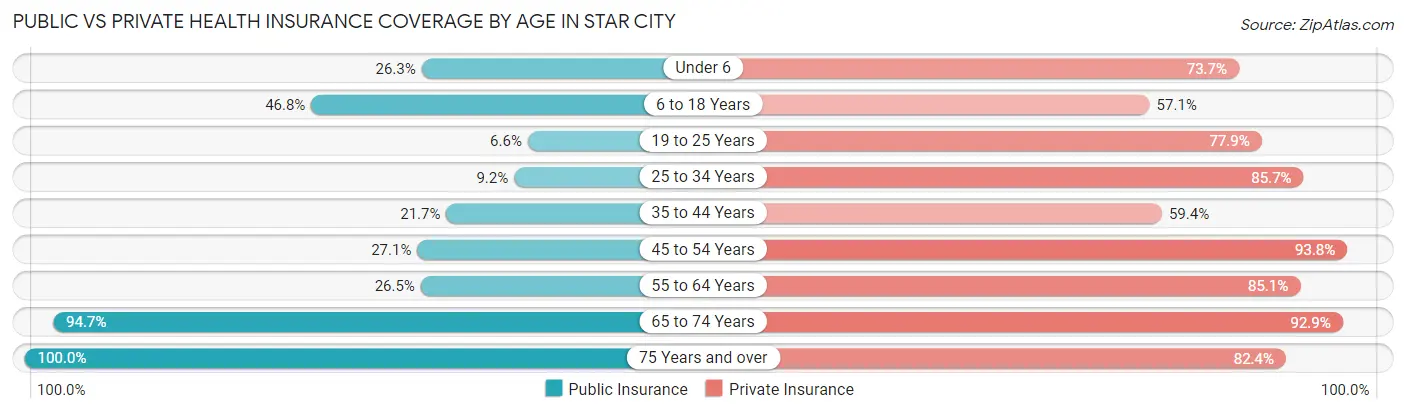
| Age Bracket | Public Insurance | Private Insurance |
| Under 6 | 10 (26.3%) | 28 (73.7%) |
| 6 to 18 Years | 95 (46.8%) | 116 (57.1%) |
| 19 to 25 Years | 29 (6.6%) | 342 (77.9%) |
| 25 to 34 Years | 39 (9.1%) | 365 (85.7%) |
| 35 to 44 Years | 53 (21.7%) | 145 (59.4%) |
| 45 to 54 Years | 48 (27.1%) | 166 (93.8%) |
| 55 to 64 Years | 85 (26.5%) | 273 (85.1%) |
| 65 to 74 Years | 161 (94.7%) | 158 (92.9%) |
| 75 Years and over | 125 (100.0%) | 103 (82.4%) |
| Total | 645 (30.1%) | 1,696 (79.1%) |
Disability Status by Sex by Age in Star City
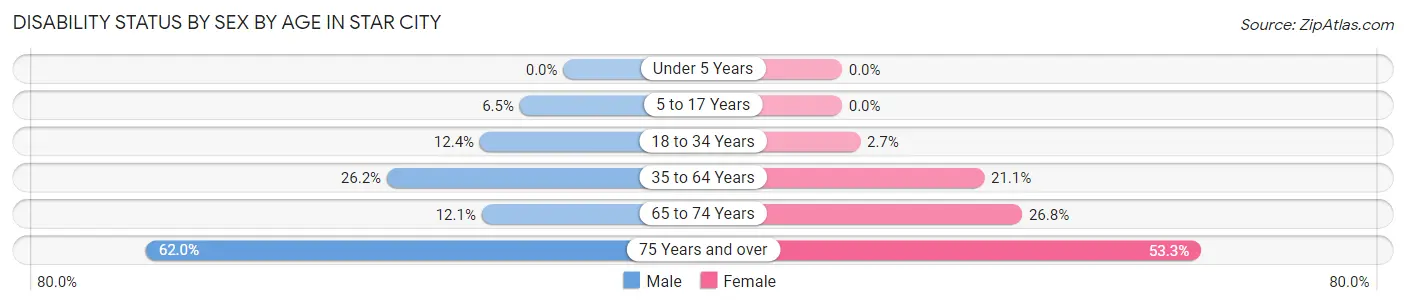
| Age Bracket | Male | Female |
| Under 5 Years | 0 (0.0%) | 0 (0.0%) |
| 5 to 17 Years | 9 (6.5%) | 0 (0.0%) |
| 18 to 34 Years | 54 (12.4%) | 12 (2.7%) |
| 35 to 64 Years | 115 (26.2%) | 64 (21.1%) |
| 65 to 74 Years | 12 (12.1%) | 19 (26.8%) |
| 75 Years and over | 31 (62.0%) | 40 (53.3%) |
Disability Class by Sex by Age in Star City
Disability Class: Hearing Difficulty
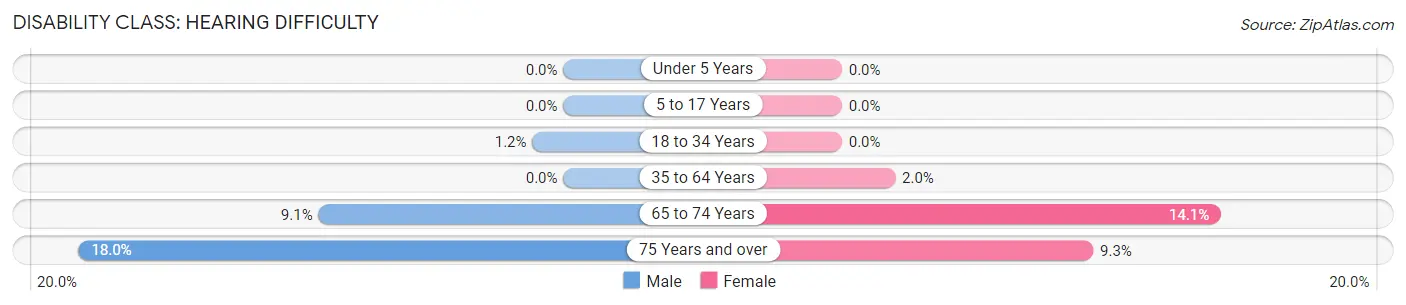
| Age Bracket | Male | Female |
| Under 5 Years | 0 (0.0%) | 0 (0.0%) |
| 5 to 17 Years | 0 (0.0%) | 0 (0.0%) |
| 18 to 34 Years | 5 (1.1%) | 0 (0.0%) |
| 35 to 64 Years | 0 (0.0%) | 6 (2.0%) |
| 65 to 74 Years | 9 (9.1%) | 10 (14.1%) |
| 75 Years and over | 9 (18.0%) | 7 (9.3%) |
Disability Class: Vision Difficulty
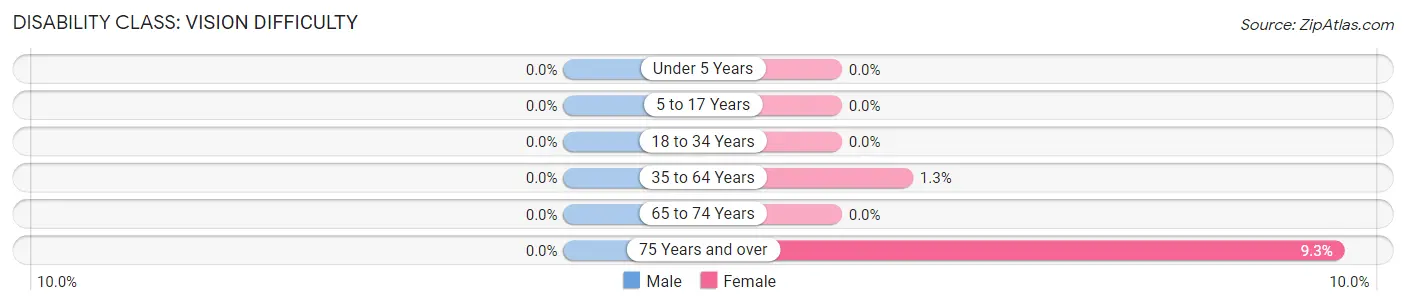
| Age Bracket | Male | Female |
| Under 5 Years | 0 (0.0%) | 0 (0.0%) |
| 5 to 17 Years | 0 (0.0%) | 0 (0.0%) |
| 18 to 34 Years | 0 (0.0%) | 0 (0.0%) |
| 35 to 64 Years | 0 (0.0%) | 4 (1.3%) |
| 65 to 74 Years | 0 (0.0%) | 0 (0.0%) |
| 75 Years and over | 0 (0.0%) | 7 (9.3%) |
Disability Class: Cognitive Difficulty
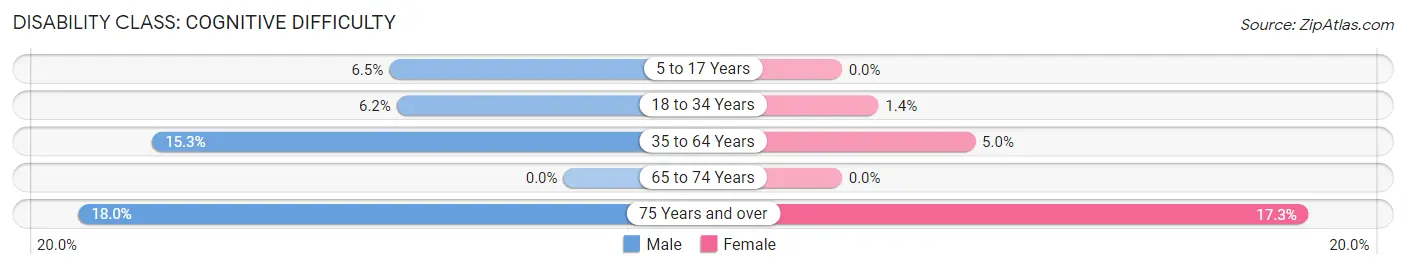
| Age Bracket | Male | Female |
| 5 to 17 Years | 9 (6.5%) | 0 (0.0%) |
| 18 to 34 Years | 27 (6.2%) | 6 (1.4%) |
| 35 to 64 Years | 67 (15.3%) | 15 (5.0%) |
| 65 to 74 Years | 0 (0.0%) | 0 (0.0%) |
| 75 Years and over | 9 (18.0%) | 13 (17.3%) |
Disability Class: Ambulatory Difficulty
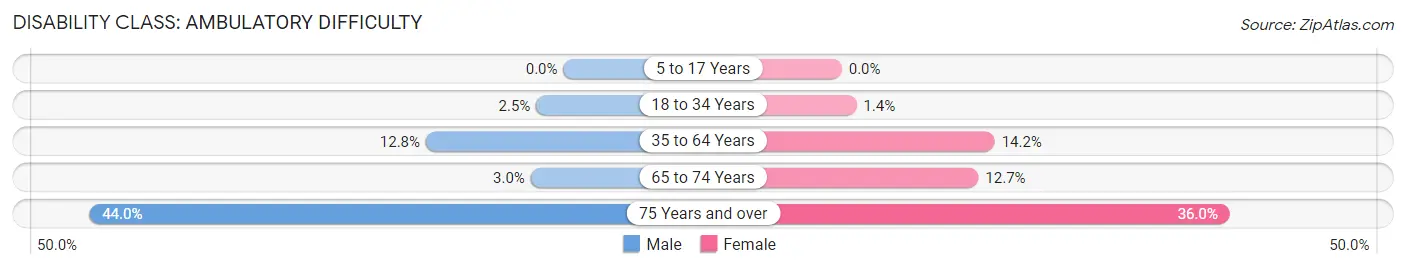
| Age Bracket | Male | Female |
| 5 to 17 Years | 0 (0.0%) | 0 (0.0%) |
| 18 to 34 Years | 11 (2.5%) | 6 (1.4%) |
| 35 to 64 Years | 56 (12.8%) | 43 (14.2%) |
| 65 to 74 Years | 3 (3.0%) | 9 (12.7%) |
| 75 Years and over | 22 (44.0%) | 27 (36.0%) |
Disability Class: Self-Care Difficulty
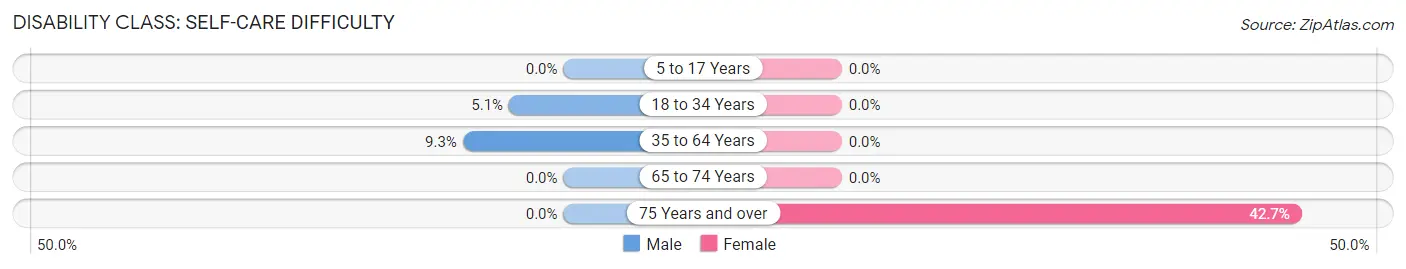
| Age Bracket | Male | Female |
| 5 to 17 Years | 0 (0.0%) | 0 (0.0%) |
| 18 to 34 Years | 22 (5.1%) | 0 (0.0%) |
| 35 to 64 Years | 41 (9.3%) | 0 (0.0%) |
| 65 to 74 Years | 0 (0.0%) | 0 (0.0%) |
| 75 Years and over | 0 (0.0%) | 32 (42.7%) |
Technology Access in Star City
Computing Device Access in Star City
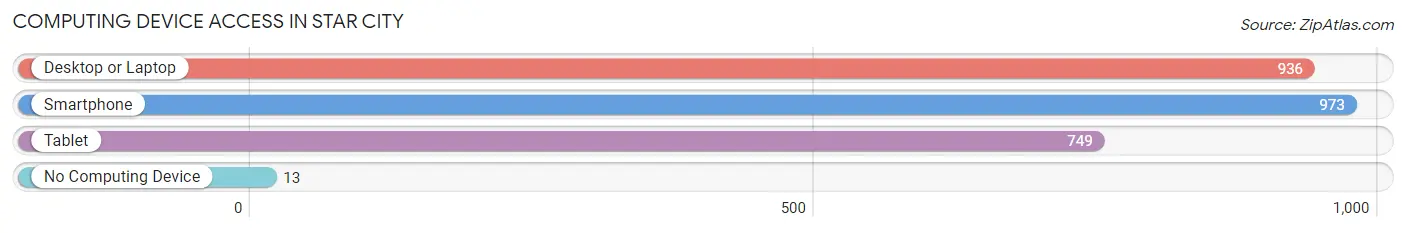
| Device Type | # Households | % Households |
| Desktop or Laptop | 936 | 90.7% |
| Smartphone | 973 | 94.3% |
| Tablet | 749 | 72.6% |
| No Computing Device | 13 | 1.3% |
| Total | 1,032 | 100.0% |
Internet Access in Star City
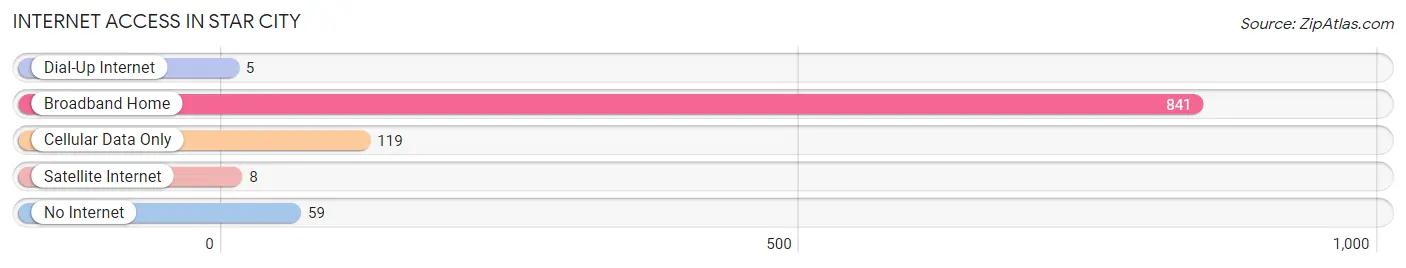
| Internet Type | # Households | % Households |
| Dial-Up Internet | 5 | 0.5% |
| Broadband Home | 841 | 81.5% |
| Cellular Data Only | 119 | 11.5% |
| Satellite Internet | 8 | 0.8% |
| No Internet | 59 | 5.7% |
| Total | 1,032 | 100.0% |
Star City Summary
Star City is a town located in Monongalia County, West Virginia. It is situated along the Monongahela River, just north of Morgantown. The town was founded in 1872 and was originally known as Starlingtown. The name was changed to Star City in 1891.
History
Star City was founded in 1872 by a group of settlers from Pennsylvania. The town was originally known as Starlingtown, but the name was changed to Star City in 1891. The town was named after the star-shaped pattern of streets that were laid out in the town.
The town grew rapidly in the late 19th century, and by the early 20th century, it had become a bustling industrial center. The town was home to several coal mines, steel mills, and other industries. The town was also home to a large number of immigrants, including Italians, Poles, and Greeks.
The town was also home to a large number of African Americans, who were employed in the coal mines and steel mills. The town was also home to a large number of African American churches, which served as a center of the community.
In the late 20th century, the town began to decline as the coal and steel industries declined. The town was also affected by the decline of the railroad industry. The town has since become a bedroom community for Morgantown, and many of the residents commute to Morgantown for work.
Geography
Star City is located in Monongalia County, West Virginia. It is situated along the Monongahela River, just north of Morgantown. The town is located in the Appalachian Mountains, and the terrain is mostly hilly and forested.
The climate in Star City is humid continental, with hot summers and cold winters. The average annual temperature is around 50 degrees Fahrenheit. The average annual precipitation is around 40 inches.
Economy
The economy of Star City is largely based on the service industry. The town is home to several restaurants, bars, and other businesses. The town is also home to a number of retail stores, including a Walmart Supercenter.
The town is also home to a number of manufacturing companies, including a steel mill and a paper mill. The town is also home to a number of coal mines, which provide employment for many of the town’s residents.
Demographics
As of the 2010 census, the population of Star City was 2,945. The racial makeup of the town was 94.3% White, 2.3% African American, 0.3% Native American, 0.7% Asian, 0.1% Pacific Islander, and 1.3% from other races. The median household income was $35,938, and the median family income was $41,938.
The town is home to a large number of immigrants, including Italians, Poles, and Greeks. The town is also home to a large number of African Americans, who are employed in the coal mines and steel mills. The town is also home to a large number of African American churches, which serve as a center of the community.
Common Questions
What is Per Capita Income in Star City?
Per Capita income in Star City is $38,837.
What is the Median Family Income in Star City?
Median Family Income in Star City is $91,680.
What is the Median Household income in Star City?
Median Household Income in Star City is $69,063.
What is Income or Wage Gap in Star City?
Income or Wage Gap in Star City is 9.0%.
Women in Star City earn 91.0 cents for every dollar earned by a man.
What is Inequality or Gini Index in Star City?
Inequality or Gini Index in Star City is 0.40.
What is the Total Population of Star City?
Total Population of Star City is 2,167.
What is the Total Male Population of Star City?
Total Male Population of Star City is 1,182.
What is the Total Female Population of Star City?
Total Female Population of Star City is 985.
What is the Ratio of Males per 100 Females in Star City?
There are 120.00 Males per 100 Females in Star City.
What is the Ratio of Females per 100 Males in Star City?
There are 83.33 Females per 100 Males in Star City.
What is the Median Population Age in Star City?
Median Population Age in Star City is 33.8 Years.
What is the Average Family Size in Star City
Average Family Size in Star City is 2.8 People.
What is the Average Household Size in Star City
Average Household Size in Star City is 2.1 People.
How Large is the Labor Force in Star City?
There are 1,376 People in the Labor Forcein in Star City.
What is the Percentage of People in the Labor Force in Star City?
68.4% of People are in the Labor Force in Star City.
What is the Unemployment Rate in Star City?
Unemployment Rate in Star City is 1.0%.