Youngsville, NC Map & Demographics
Youngsville Map
Youngsville Overview
$36,249
PER CAPITA INCOME
$86,146
AVG FAMILY INCOME
$73,472
AVG HOUSEHOLD INCOME
17.1%
WAGE / INCOME GAP [ % ]
82.9¢/ $1
WAGE / INCOME GAP [ $ ]
0.39
INEQUALITY / GINI INDEX
2,421
TOTAL POPULATION
1,234
MALE POPULATION
1,187
FEMALE POPULATION
103.96
MALES / 100 FEMALES
96.19
FEMALES / 100 MALES
30.3
MEDIAN AGE
3.1
AVG FAMILY SIZE
2.6
AVG HOUSEHOLD SIZE
1,439
LABOR FORCE [ PEOPLE ]
80.0%
PERCENT IN LABOR FORCE
3.6%
UNEMPLOYMENT RATE
Youngsville Zip Codes
Youngsville Area Codes
Income in Youngsville
Income Overview in Youngsville
Per Capita Income in Youngsville is $36,249, while median incomes of families and households are $86,146 and $73,472 respectively.
| Characteristic | Number | Measure |
| Per Capita Income | 2,421 | $36,249 |
| Median Family Income | 665 | $86,146 |
| Mean Family Income | 665 | $104,540 |
| Median Household Income | 940 | $73,472 |
| Mean Household Income | 940 | $93,798 |
| Income Deficit | 665 | $0 |
| Wage / Income Gap (%) | 2,421 | 17.07% |
| Wage / Income Gap ($) | 2,421 | 82.93¢ per $1 |
| Gini / Inequality Index | 2,421 | 0.39 |
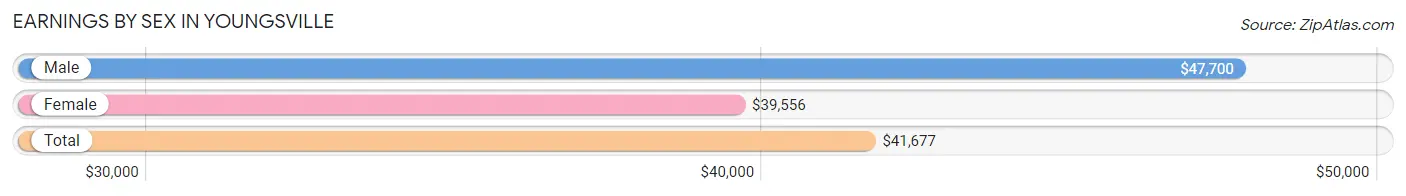
Earnings by Sex in Youngsville
Average Earnings in Youngsville are $41,677, $47,700 for men and $39,556 for women, a difference of 17.1%.
| Sex | Number | Average Earnings |
| Male | 694 (47.4%) | $47,700 |
| Female | 771 (52.6%) | $39,556 |
| Total | 1,465 (100.0%) | $41,677 |
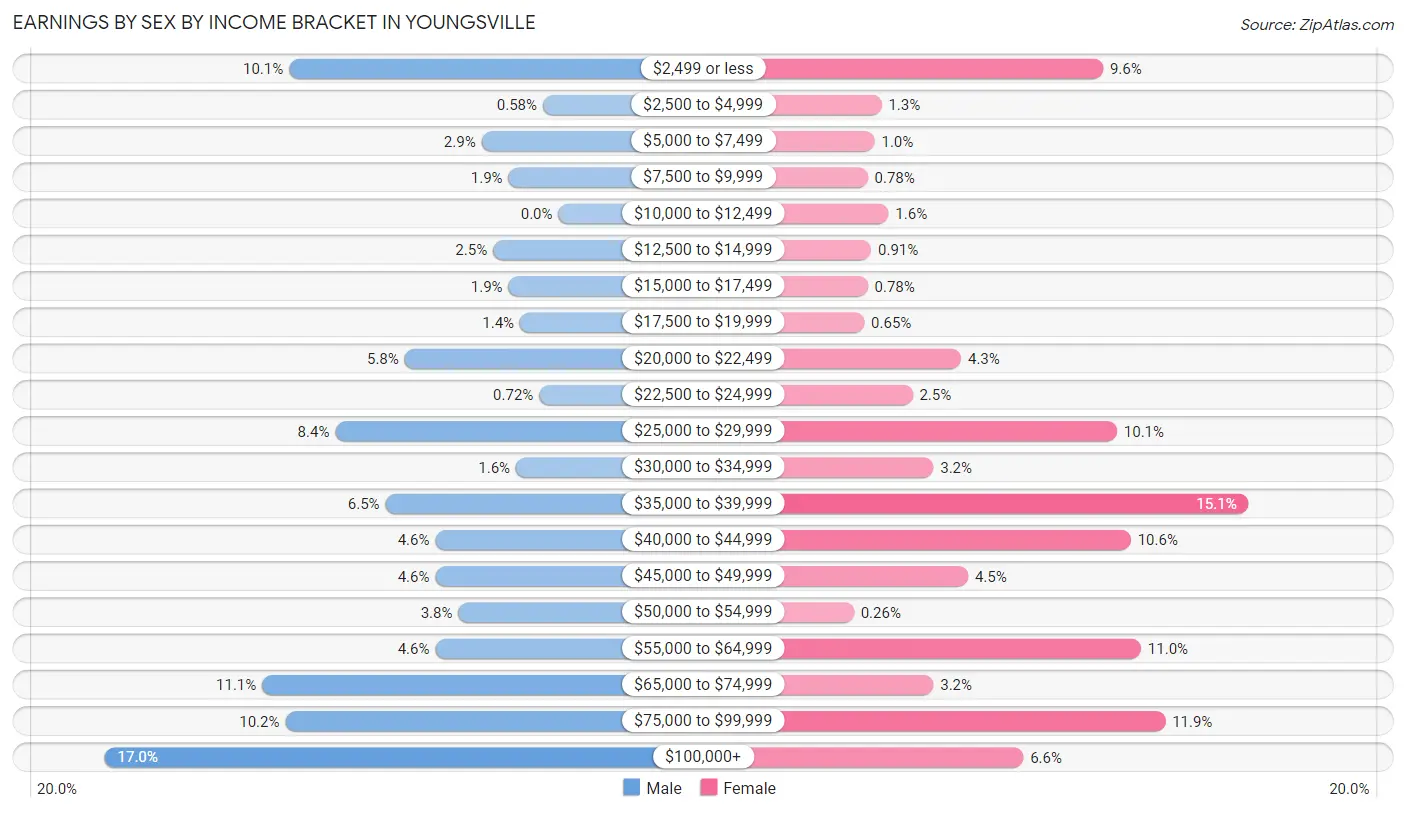
Earnings by Sex by Income Bracket in Youngsville
The most common earnings brackets in Youngsville are $100,000+ for men (118 | 17.0%) and $35,000 to $39,999 for women (116 | 15.0%).
| Income | Male | Female |
| $2,499 or less | 70 (10.1%) | 74 (9.6%) |
| $2,500 to $4,999 | 4 (0.6%) | 10 (1.3%) |
| $5,000 to $7,499 | 20 (2.9%) | 8 (1.0%) |
| $7,500 to $9,999 | 13 (1.9%) | 6 (0.8%) |
| $10,000 to $12,499 | 0 (0.0%) | 12 (1.6%) |
| $12,500 to $14,999 | 17 (2.5%) | 7 (0.9%) |
| $15,000 to $17,499 | 13 (1.9%) | 6 (0.8%) |
| $17,500 to $19,999 | 10 (1.4%) | 5 (0.6%) |
| $20,000 to $22,499 | 40 (5.8%) | 33 (4.3%) |
| $22,500 to $24,999 | 5 (0.7%) | 19 (2.5%) |
| $25,000 to $29,999 | 58 (8.4%) | 78 (10.1%) |
| $30,000 to $34,999 | 11 (1.6%) | 25 (3.2%) |
| $35,000 to $39,999 | 45 (6.5%) | 116 (15.0%) |
| $40,000 to $44,999 | 32 (4.6%) | 82 (10.6%) |
| $45,000 to $49,999 | 32 (4.6%) | 35 (4.5%) |
| $50,000 to $54,999 | 26 (3.7%) | 2 (0.3%) |
| $55,000 to $64,999 | 32 (4.6%) | 85 (11.0%) |
| $65,000 to $74,999 | 77 (11.1%) | 25 (3.2%) |
| $75,000 to $99,999 | 71 (10.2%) | 92 (11.9%) |
| $100,000+ | 118 (17.0%) | 51 (6.6%) |
| Total | 694 (100.0%) | 771 (100.0%) |
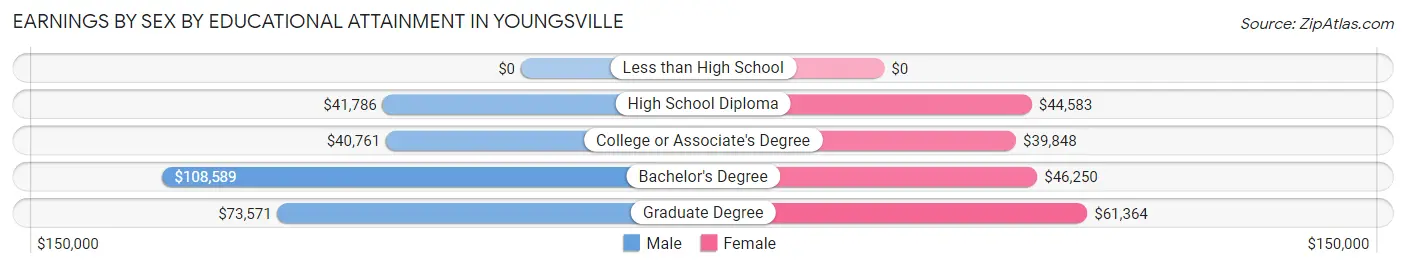
Earnings by Sex by Educational Attainment in Youngsville
Average earnings in Youngsville are $56,923 for men and $43,996 for women, a difference of 22.7%. Men with an educational attainment of bachelor's degree enjoy the highest average annual earnings of $108,589, while those with college or associate's degree education earn the least with $40,761. Women with an educational attainment of graduate degree earn the most with the average annual earnings of $61,364, while those with college or associate's degree education have the smallest earnings of $39,848.
| Educational Attainment | Male Income | Female Income |
| Less than High School | - | - |
| High School Diploma | $41,786 | $44,583 |
| College or Associate's Degree | $40,761 | $39,848 |
| Bachelor's Degree | $108,589 | $46,250 |
| Graduate Degree | $73,571 | $61,364 |
| Total | $56,923 | $43,996 |
Family Income in Youngsville
Family Income Brackets in Youngsville
According to the Youngsville family income data, there are 126 families falling into the $35,000 to $49,999 income range, which is the most common income bracket and makes up 19.0% of all families. Conversely, the less than $10,000 income bracket is the least frequent group with only 2 families (0.3%) belonging to this category.
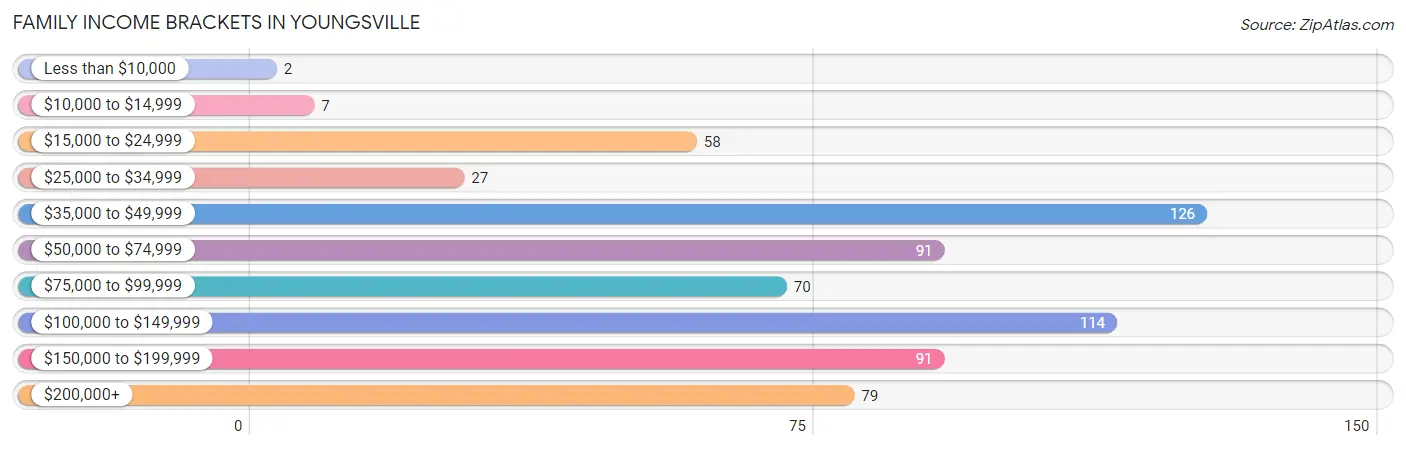
| Income Bracket | # Families | % Families |
| Less than $10,000 | 2 | 0.3% |
| $10,000 to $14,999 | 7 | 1.1% |
| $15,000 to $24,999 | 58 | 8.7% |
| $25,000 to $34,999 | 27 | 4.1% |
| $35,000 to $49,999 | 126 | 18.9% |
| $50,000 to $74,999 | 91 | 13.7% |
| $75,000 to $99,999 | 70 | 10.5% |
| $100,000 to $149,999 | 114 | 17.1% |
| $150,000 to $199,999 | 91 | 13.7% |
| $200,000+ | 79 | 11.9% |
Family Income by Famaliy Size in Youngsville
5-person families (54 | 8.1%) account for the highest median family income in Youngsville with $136,591 per family, while 2-person families (270 | 40.6%) have the highest median income of $37,500 per family member.
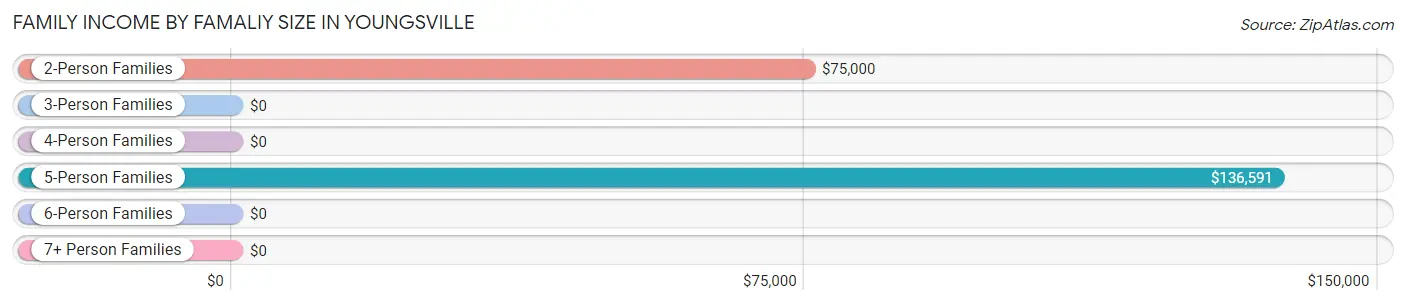
| Income Bracket | # Families | Median Income |
| 2-Person Families | 270 (40.6%) | $75,000 |
| 3-Person Families | 243 (36.5%) | $0 |
| 4-Person Families | 49 (7.4%) | $0 |
| 5-Person Families | 54 (8.1%) | $136,591 |
| 6-Person Families | 41 (6.2%) | $0 |
| 7+ Person Families | 8 (1.2%) | $0 |
| Total | 665 (100.0%) | $86,146 |
Family Income by Number of Earners in Youngsville
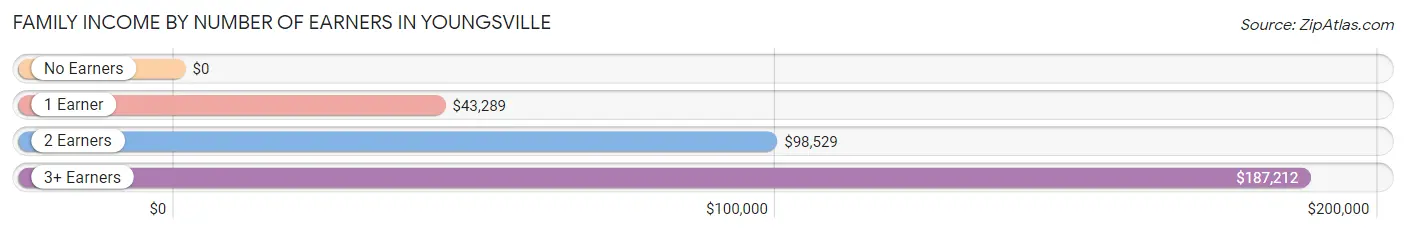
| Number of Earners | # Families | Median Income |
| No Earners | 24 (3.6%) | $0 |
| 1 Earner | 192 (28.9%) | $43,289 |
| 2 Earners | 376 (56.5%) | $98,529 |
| 3+ Earners | 73 (11.0%) | $187,212 |
| Total | 665 (100.0%) | $86,146 |
Household Income in Youngsville
Household Income Brackets in Youngsville
With 211 households falling in the category, the $35,000 to $49,999 income range is the most frequent in Youngsville, accounting for 22.5% of all households. In contrast, only 13 households (1.4%) fall into the $10,000 to $14,999 income bracket, making it the least populous group.
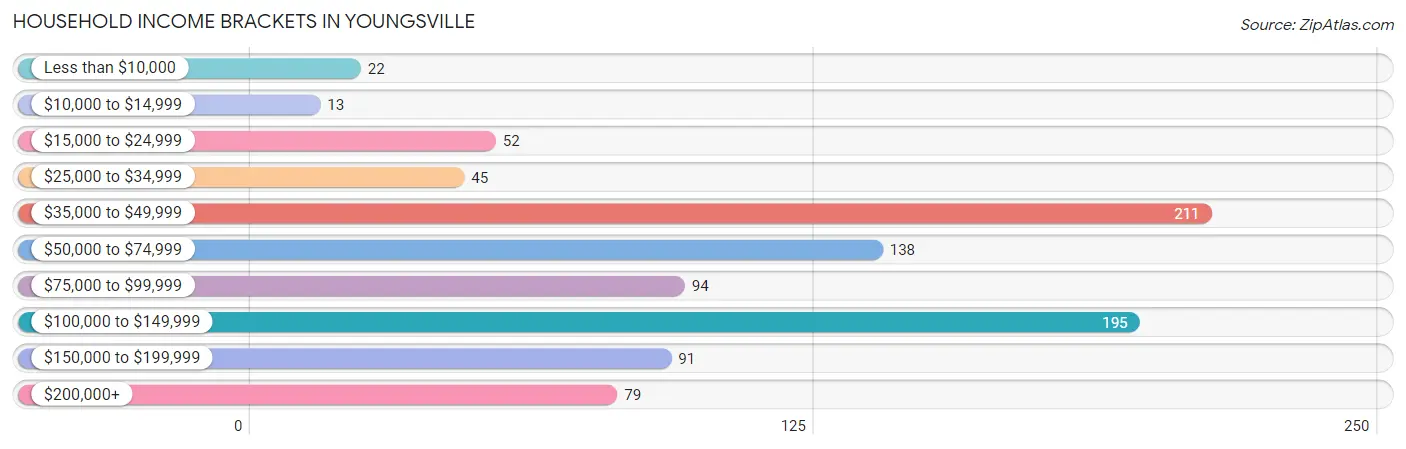
| Income Bracket | # Households | % Households |
| Less than $10,000 | 22 | 2.3% |
| $10,000 to $14,999 | 13 | 1.4% |
| $15,000 to $24,999 | 52 | 5.5% |
| $25,000 to $34,999 | 45 | 4.8% |
| $35,000 to $49,999 | 211 | 22.4% |
| $50,000 to $74,999 | 138 | 14.7% |
| $75,000 to $99,999 | 94 | 10.0% |
| $100,000 to $149,999 | 195 | 20.7% |
| $150,000 to $199,999 | 91 | 9.7% |
| $200,000+ | 79 | 8.4% |
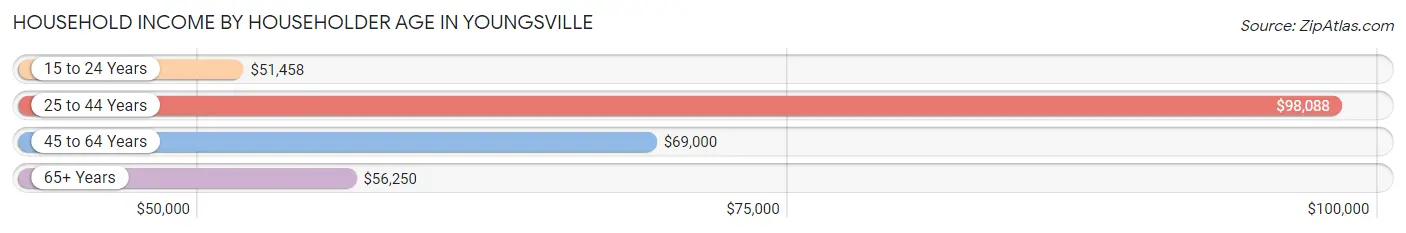
Household Income by Householder Age in Youngsville
The median household income in Youngsville is $73,472, with the highest median household income of $98,088 found in the 25 to 44 years age bracket for the primary householder. A total of 452 households (48.1%) fall into this category. Meanwhile, the 15 to 24 years age bracket for the primary householder has the lowest median household income of $51,458, with 79 households (8.4%) in this group.
| Income Bracket | # Households | Median Income |
| 15 to 24 Years | 79 (8.4%) | $51,458 |
| 25 to 44 Years | 452 (48.1%) | $98,088 |
| 45 to 64 Years | 290 (30.8%) | $69,000 |
| 65+ Years | 119 (12.7%) | $56,250 |
| Total | 940 (100.0%) | $73,472 |
Poverty in Youngsville
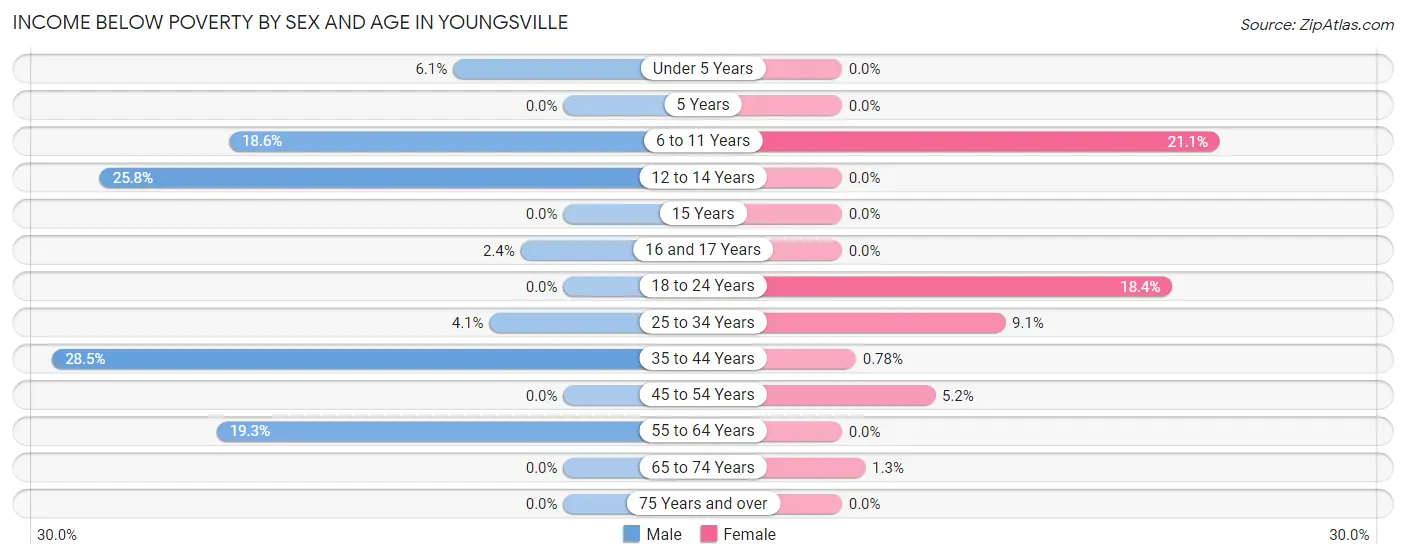
Income Below Poverty by Sex and Age in Youngsville
With 10.3% poverty level for males and 6.8% for females among the residents of Youngsville, 35 to 44 year old males and 6 to 11 year old females are the most vulnerable to poverty, with 37 males (28.5%) and 32 females (21.0%) in their respective age groups living below the poverty level.
| Age Bracket | Male | Female |
| Under 5 Years | 7 (6.1%) | 0 (0.0%) |
| 5 Years | 0 (0.0%) | 0 (0.0%) |
| 6 to 11 Years | 27 (18.6%) | 32 (21.0%) |
| 12 to 14 Years | 24 (25.8%) | 0 (0.0%) |
| 15 Years | 0 (0.0%) | 0 (0.0%) |
| 16 and 17 Years | 2 (2.4%) | 0 (0.0%) |
| 18 to 24 Years | 0 (0.0%) | 23 (18.4%) |
| 25 to 34 Years | 8 (4.1%) | 16 (9.1%) |
| 35 to 44 Years | 37 (28.5%) | 2 (0.8%) |
| 45 to 54 Years | 0 (0.0%) | 7 (5.2%) |
| 55 to 64 Years | 22 (19.3%) | 0 (0.0%) |
| 65 to 74 Years | 0 (0.0%) | 1 (1.3%) |
| 75 Years and over | 0 (0.0%) | 0 (0.0%) |
| Total | 127 (10.3%) | 81 (6.8%) |
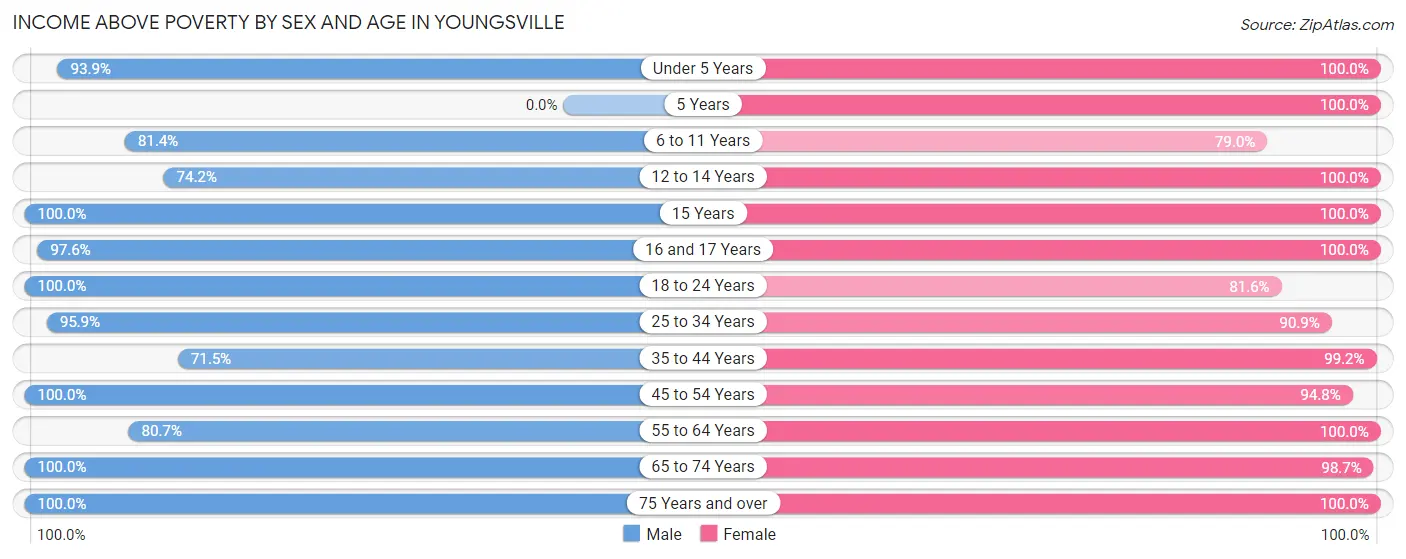
Income Above Poverty by Sex and Age in Youngsville
According to the poverty statistics in Youngsville, males aged 15 years and females aged under 5 years are the age groups that are most secure financially, with 100.0% of males and 100.0% of females in these age groups living above the poverty line.
| Age Bracket | Male | Female |
| Under 5 Years | 107 (93.9%) | 12 (100.0%) |
| 5 Years | 0 (0.0%) | 44 (100.0%) |
| 6 to 11 Years | 118 (81.4%) | 120 (78.9%) |
| 12 to 14 Years | 69 (74.2%) | 17 (100.0%) |
| 15 Years | 25 (100.0%) | 20 (100.0%) |
| 16 and 17 Years | 82 (97.6%) | 34 (100.0%) |
| 18 to 24 Years | 105 (100.0%) | 102 (81.6%) |
| 25 to 34 Years | 186 (95.9%) | 160 (90.9%) |
| 35 to 44 Years | 93 (71.5%) | 254 (99.2%) |
| 45 to 54 Years | 152 (100.0%) | 128 (94.8%) |
| 55 to 64 Years | 92 (80.7%) | 103 (100.0%) |
| 65 to 74 Years | 59 (100.0%) | 76 (98.7%) |
| 75 Years and over | 19 (100.0%) | 36 (100.0%) |
| Total | 1,107 (89.7%) | 1,106 (93.2%) |
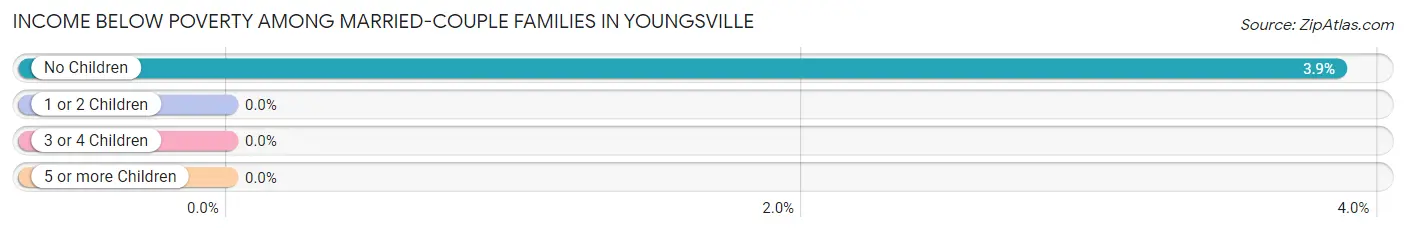
Income Below Poverty Among Married-Couple Families in Youngsville
The poverty statistics for married-couple families in Youngsville show that 1.9% or 8 of the total 412 families live below the poverty line. Families with no children have the highest poverty rate of 3.9%, comprising of 8 families. On the other hand, families with 1 or 2 children have the lowest poverty rate of 0.0%, which includes 0 families.
| Children | Above Poverty | Below Poverty |
| No Children | 199 (96.1%) | 8 (3.9%) |
| 1 or 2 Children | 160 (100.0%) | 0 (0.0%) |
| 3 or 4 Children | 40 (100.0%) | 0 (0.0%) |
| 5 or more Children | 5 (100.0%) | 0 (0.0%) |
| Total | 404 (98.1%) | 8 (1.9%) |
Income Below Poverty Among Single-Parent Households in Youngsville
According to the poverty data in Youngsville, 45.1% or 37 single-father households and 9.4% or 16 single-mother households are living below the poverty line. Among single-father households, those with 1 or 2 children have the highest poverty rate, with 37 households (45.1%) experiencing poverty. Likewise, among single-mother households, those with 3 or 4 children have the highest poverty rate, with 9 households (100.0%) falling below the poverty line.
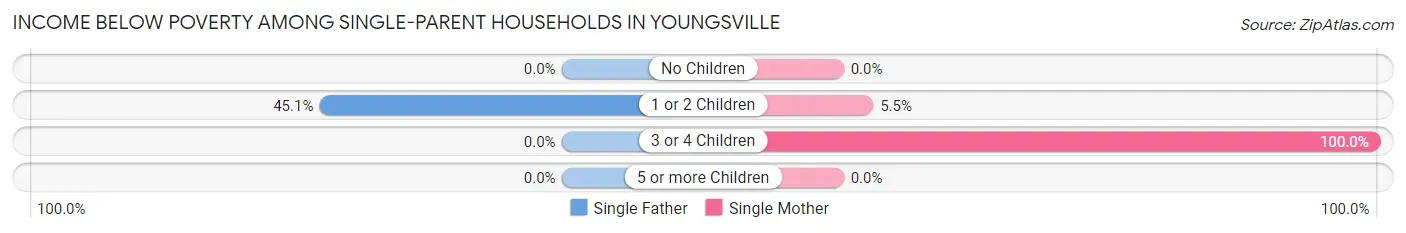
| Children | Single Father | Single Mother |
| No Children | 0 (0.0%) | 0 (0.0%) |
| 1 or 2 Children | 37 (45.1%) | 7 (5.5%) |
| 3 or 4 Children | 0 (0.0%) | 9 (100.0%) |
| 5 or more Children | 0 (0.0%) | 0 (0.0%) |
| Total | 37 (45.1%) | 16 (9.4%) |
Income Below Poverty Among Married-Couple vs Single-Parent Households in Youngsville
The poverty data for Youngsville shows that 8 of the married-couple family households (1.9%) and 53 of the single-parent households (20.9%) are living below the poverty level. Within the married-couple family households, those with no children have the highest poverty rate, with 8 households (3.9%) falling below the poverty line. Among the single-parent households, those with 3 or 4 children have the highest poverty rate, with 9 household (100.0%) living below poverty.
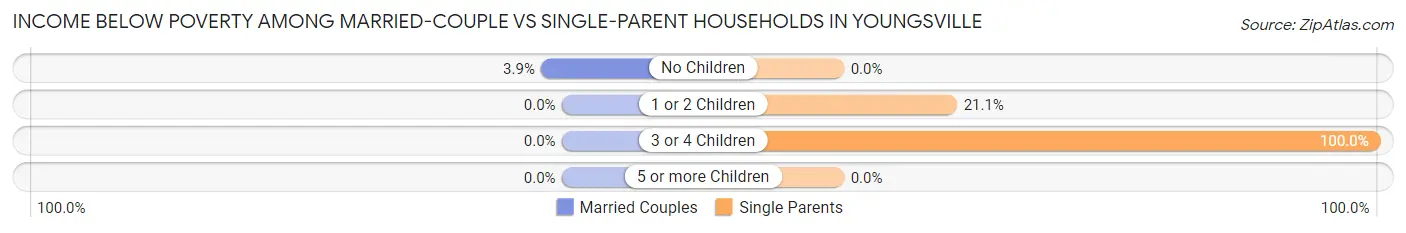
| Children | Married-Couple Families | Single-Parent Households |
| No Children | 8 (3.9%) | 0 (0.0%) |
| 1 or 2 Children | 0 (0.0%) | 44 (21.0%) |
| 3 or 4 Children | 0 (0.0%) | 9 (100.0%) |
| 5 or more Children | 0 (0.0%) | 0 (0.0%) |
| Total | 8 (1.9%) | 53 (20.9%) |
Race in Youngsville
The most populous races in Youngsville are White / Caucasian (1,203 | 49.7%), Black / African American (916 | 37.8%), and Hispanic or Latino (235 | 9.7%).
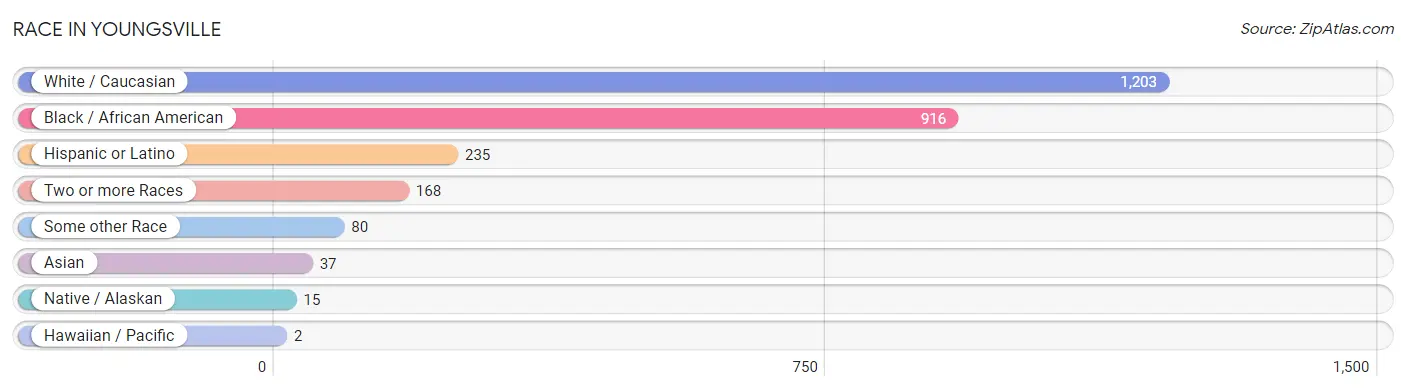
| Race | # Population | % Population |
| Asian | 37 | 1.5% |
| Black / African American | 916 | 37.8% |
| Hawaiian / Pacific | 2 | 0.1% |
| Hispanic or Latino | 235 | 9.7% |
| Native / Alaskan | 15 | 0.6% |
| White / Caucasian | 1,203 | 49.7% |
| Two or more Races | 168 | 6.9% |
| Some other Race | 80 | 3.3% |
| Total | 2,421 | 100.0% |
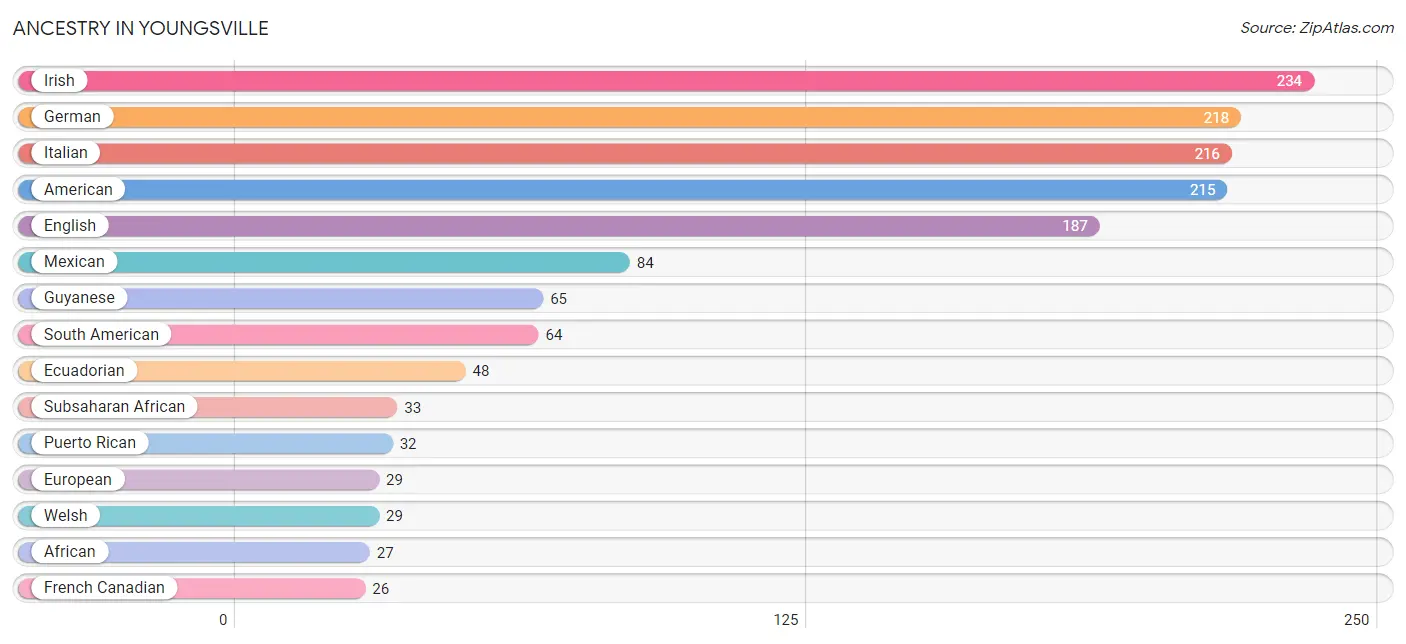
Ancestry in Youngsville
The most populous ancestries reported in Youngsville are Irish (234 | 9.7%), German (218 | 9.0%), Italian (216 | 8.9%), American (215 | 8.9%), and English (187 | 7.7%), together accounting for 44.2% of all Youngsville residents.
| Ancestry | # Population | % Population |
| African | 27 | 1.1% |
| American | 215 | 8.9% |
| Argentinean | 4 | 0.2% |
| British | 7 | 0.3% |
| Burmese | 3 | 0.1% |
| Central American | 17 | 0.7% |
| Cherokee | 20 | 0.8% |
| Cuban | 6 | 0.3% |
| Czech | 3 | 0.1% |
| Dutch | 16 | 0.7% |
| Ecuadorian | 48 | 2.0% |
| English | 187 | 7.7% |
| European | 29 | 1.2% |
| French | 25 | 1.0% |
| French Canadian | 26 | 1.1% |
| German | 218 | 9.0% |
| Ghanaian | 6 | 0.3% |
| Guyanese | 65 | 2.7% |
| Hungarian | 4 | 0.2% |
| Indian (Asian) | 16 | 0.7% |
| Irish | 234 | 9.7% |
| Italian | 216 | 8.9% |
| Laotian | 1 | 0.0% |
| Malaysian | 9 | 0.4% |
| Mexican | 84 | 3.5% |
| Native Hawaiian | 2 | 0.1% |
| Norwegian | 5 | 0.2% |
| Peruvian | 12 | 0.5% |
| Polish | 17 | 0.7% |
| Puerto Rican | 32 | 1.3% |
| Russian | 15 | 0.6% |
| Salvadoran | 17 | 0.7% |
| Scandinavian | 5 | 0.2% |
| Scotch-Irish | 18 | 0.7% |
| Scottish | 12 | 0.5% |
| Slovak | 11 | 0.4% |
| South American | 64 | 2.6% |
| Spanish | 16 | 0.7% |
| Sri Lankan | 8 | 0.3% |
| Subsaharan African | 33 | 1.4% |
| Swedish | 6 | 0.3% |
| Swiss | 2 | 0.1% |
| Trinidadian and Tobagonian | 11 | 0.4% |
| Ukrainian | 16 | 0.7% |
| Welsh | 29 | 1.2% | View All 45 Rows |
Immigrants in Youngsville
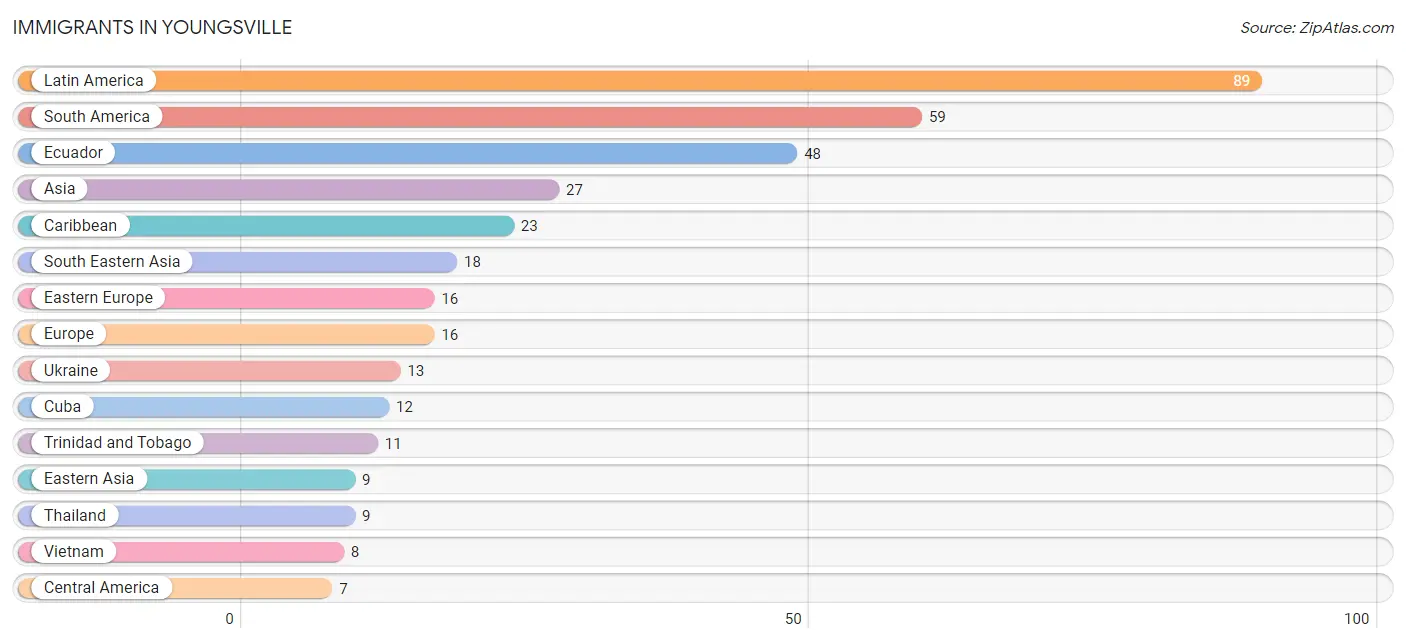
The most numerous immigrant groups reported in Youngsville came from Latin America (89 | 3.7%), South America (59 | 2.4%), Ecuador (48 | 2.0%), Asia (27 | 1.1%), and Caribbean (23 | 0.9%), together accounting for 10.2% of all Youngsville residents.
| Immigration Origin | # Population | % Population |
| Argentina | 4 | 0.2% |
| Asia | 27 | 1.1% |
| Caribbean | 23 | 0.9% |
| Central America | 7 | 0.3% |
| China | 6 | 0.3% |
| Cuba | 12 | 0.5% |
| Eastern Asia | 9 | 0.4% |
| Eastern Europe | 16 | 0.7% |
| Ecuador | 48 | 2.0% |
| El Salvador | 7 | 0.3% |
| Europe | 16 | 0.7% |
| Indonesia | 1 | 0.0% |
| Korea | 3 | 0.1% |
| Latin America | 89 | 3.7% |
| Peru | 7 | 0.3% |
| Russia | 3 | 0.1% |
| South America | 59 | 2.4% |
| South Eastern Asia | 18 | 0.7% |
| Thailand | 9 | 0.4% |
| Trinidad and Tobago | 11 | 0.4% |
| Ukraine | 13 | 0.5% |
| Vietnam | 8 | 0.3% | View All 22 Rows |
Sex and Age in Youngsville
Sex and Age in Youngsville
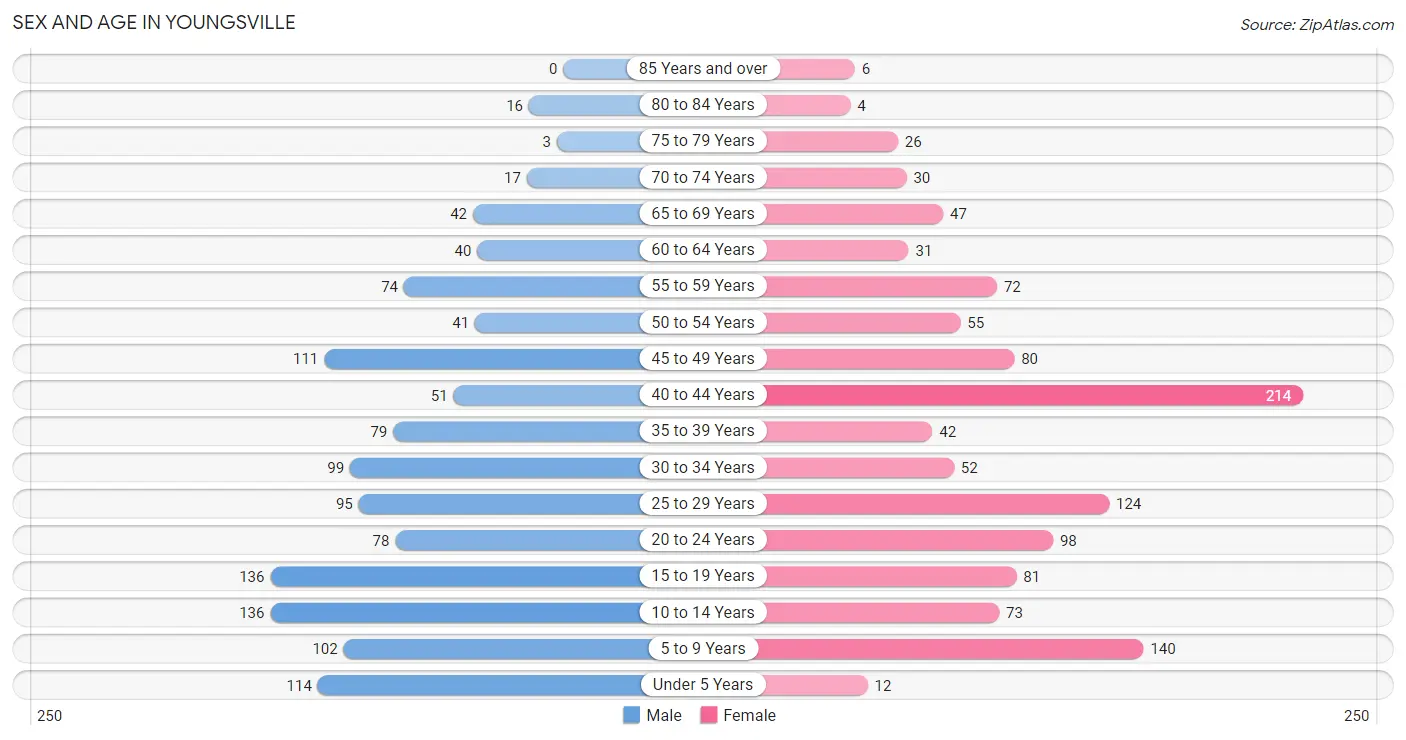
The most populous age groups in Youngsville are 10 to 14 Years (136 | 11.0%) for men and 40 to 44 Years (214 | 18.0%) for women.
| Age Bracket | Male | Female |
| Under 5 Years | 114 (9.2%) | 12 (1.0%) |
| 5 to 9 Years | 102 (8.3%) | 140 (11.8%) |
| 10 to 14 Years | 136 (11.0%) | 73 (6.1%) |
| 15 to 19 Years | 136 (11.0%) | 81 (6.8%) |
| 20 to 24 Years | 78 (6.3%) | 98 (8.3%) |
| 25 to 29 Years | 95 (7.7%) | 124 (10.4%) |
| 30 to 34 Years | 99 (8.0%) | 52 (4.4%) |
| 35 to 39 Years | 79 (6.4%) | 42 (3.5%) |
| 40 to 44 Years | 51 (4.1%) | 214 (18.0%) |
| 45 to 49 Years | 111 (9.0%) | 80 (6.7%) |
| 50 to 54 Years | 41 (3.3%) | 55 (4.6%) |
| 55 to 59 Years | 74 (6.0%) | 72 (6.1%) |
| 60 to 64 Years | 40 (3.2%) | 31 (2.6%) |
| 65 to 69 Years | 42 (3.4%) | 47 (4.0%) |
| 70 to 74 Years | 17 (1.4%) | 30 (2.5%) |
| 75 to 79 Years | 3 (0.2%) | 26 (2.2%) |
| 80 to 84 Years | 16 (1.3%) | 4 (0.3%) |
| 85 Years and over | 0 (0.0%) | 6 (0.5%) |
| Total | 1,234 (100.0%) | 1,187 (100.0%) |
Families and Households in Youngsville
Median Family Size in Youngsville
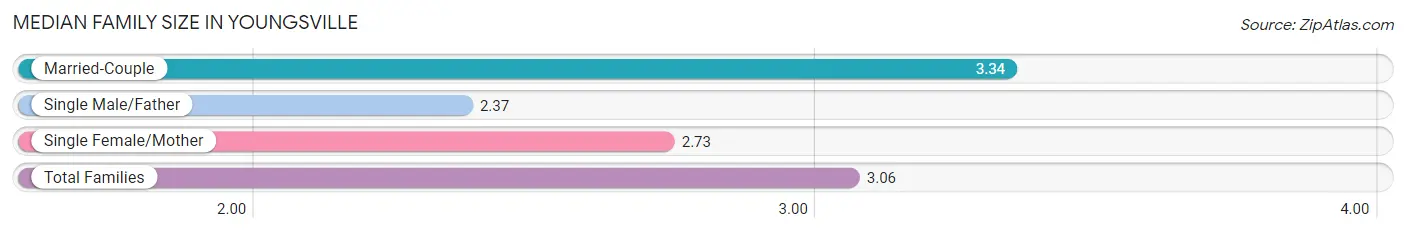
The median family size in Youngsville is 3.06 persons per family, with married-couple families (412 | 62.0%) accounting for the largest median family size of 3.34 persons per family. On the other hand, single male/father families (82 | 12.3%) represent the smallest median family size with 2.37 persons per family.
| Family Type | # Families | Family Size |
| Married-Couple | 412 (62.0%) | 3.34 |
| Single Male/Father | 82 (12.3%) | 2.37 |
| Single Female/Mother | 171 (25.7%) | 2.73 |
| Total Families | 665 (100.0%) | 3.06 |
Median Household Size in Youngsville
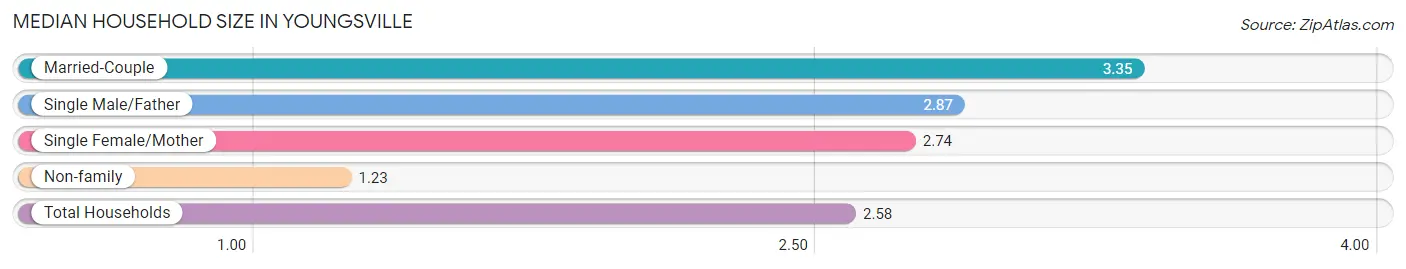
The median household size in Youngsville is 2.58 persons per household, with married-couple households (412 | 43.8%) accounting for the largest median household size of 3.35 persons per household. non-family households (275 | 29.3%) represent the smallest median household size with 1.23 persons per household.
| Household Type | # Households | Household Size |
| Married-Couple | 412 (43.8%) | 3.35 |
| Single Male/Father | 82 (8.7%) | 2.87 |
| Single Female/Mother | 171 (18.2%) | 2.74 |
| Non-family | 275 (29.3%) | 1.23 |
| Total Households | 940 (100.0%) | 2.58 |
Household Size by Marriage Status in Youngsville
Out of a total of 940 households in Youngsville, 665 (70.7%) are family households, while 275 (29.3%) are nonfamily households. The most numerous type of family households are 2-person households, comprising 268, and the most common type of nonfamily households are 1-person households, comprising 215.
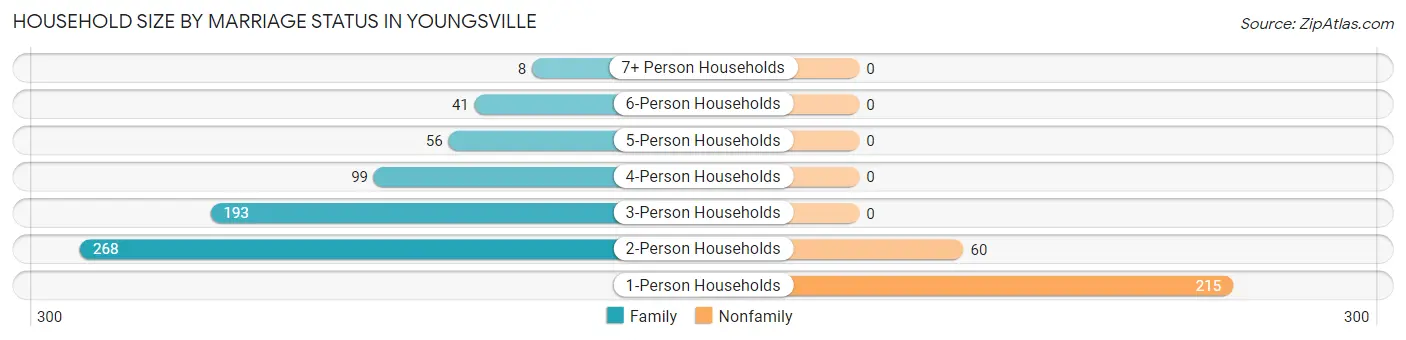
| Household Size | Family Households | Nonfamily Households |
| 1-Person Households | - | 215 (22.9%) |
| 2-Person Households | 268 (28.5%) | 60 (6.4%) |
| 3-Person Households | 193 (20.5%) | 0 (0.0%) |
| 4-Person Households | 99 (10.5%) | 0 (0.0%) |
| 5-Person Households | 56 (6.0%) | 0 (0.0%) |
| 6-Person Households | 41 (4.4%) | 0 (0.0%) |
| 7+ Person Households | 8 (0.9%) | 0 (0.0%) |
| Total | 665 (70.7%) | 275 (29.3%) |
Female Fertility in Youngsville
Fertility by Age in Youngsville
Average fertility rate in Youngsville is 32.0 births per 1,000 women. Women in the age bracket of 20 to 34 years have the highest fertility rate with 80.0 births per 1,000 women. Women in the age bracket of 20 to 34 years acount for 100.0% of all women with births.
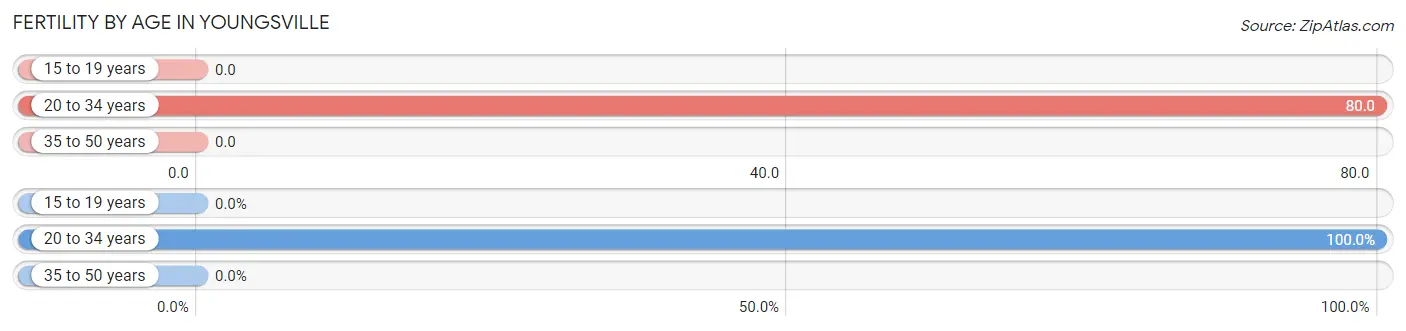
| Age Bracket | Women with Births | Births / 1,000 Women |
| 15 to 19 years | 0 (0.0%) | 0.0 |
| 20 to 34 years | 22 (100.0%) | 80.0 |
| 35 to 50 years | 0 (0.0%) | 0.0 |
| Total | 22 (100.0%) | 32.0 |
Fertility by Age by Marriage Status in Youngsville
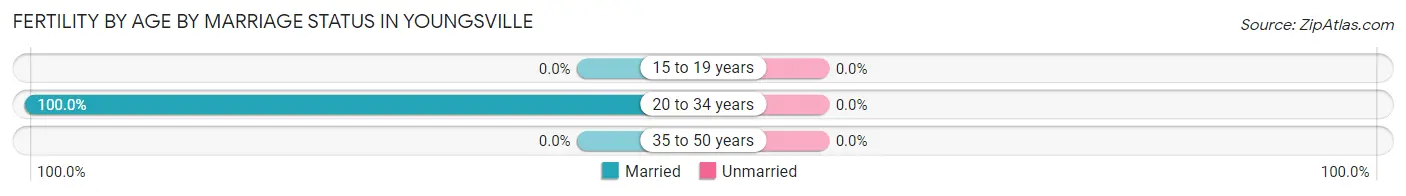
| Age Bracket | Married | Unmarried |
| 15 to 19 years | 0 (0.0%) | 0 (0.0%) |
| 20 to 34 years | 22 (100.0%) | 0 (0.0%) |
| 35 to 50 years | 0 (0.0%) | 0 (0.0%) |
| Total | 22 (100.0%) | 0 (0.0%) |
Fertility by Education in Youngsville
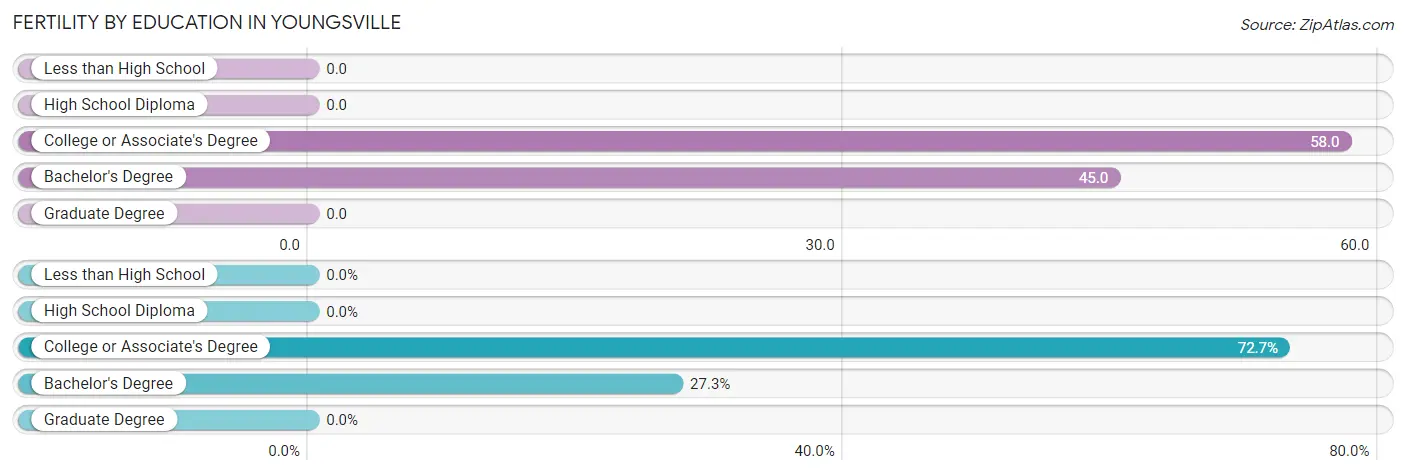
| Educational Attainment | Women with Births | Births / 1,000 Women |
| Less than High School | 0 (0.0%) | 0.0 |
| High School Diploma | 0 (0.0%) | 0.0 |
| College or Associate's Degree | 16 (72.7%) | 58.0 |
| Bachelor's Degree | 6 (27.3%) | 45.0 |
| Graduate Degree | 0 (0.0%) | 0.0 |
| Total | 22 (100.0%) | 32.0 |
Fertility by Education by Marriage Status in Youngsville
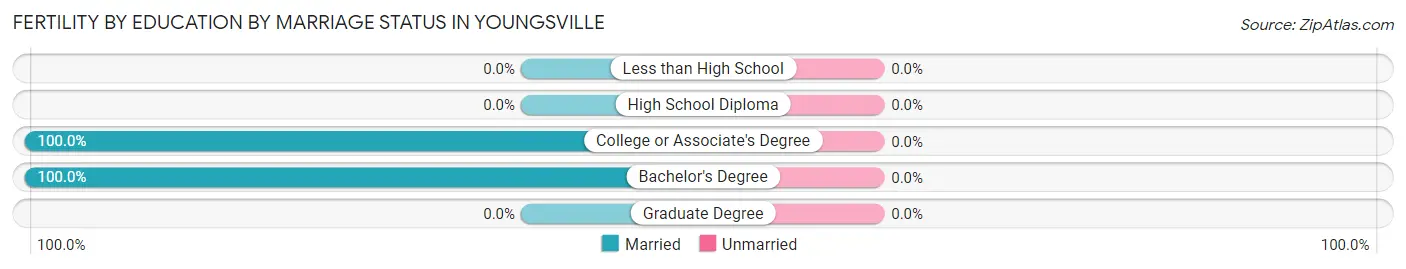
| Educational Attainment | Married | Unmarried |
| Less than High School | 0 (0.0%) | 0 (0.0%) |
| High School Diploma | 0 (0.0%) | 0 (0.0%) |
| College or Associate's Degree | 16 (100.0%) | 0 (0.0%) |
| Bachelor's Degree | 6 (100.0%) | 0 (0.0%) |
| Graduate Degree | 0 (0.0%) | 0 (0.0%) |
| Total | 22 (100.0%) | 0 (0.0%) |
Employment Characteristics in Youngsville
Employment by Class of Employer in Youngsville
Among the 1,388 employed individuals in Youngsville, private company employees (889 | 64.0%), state government employees (184 | 13.3%), and local government employees (86 | 6.2%) make up the most common classes of employment.
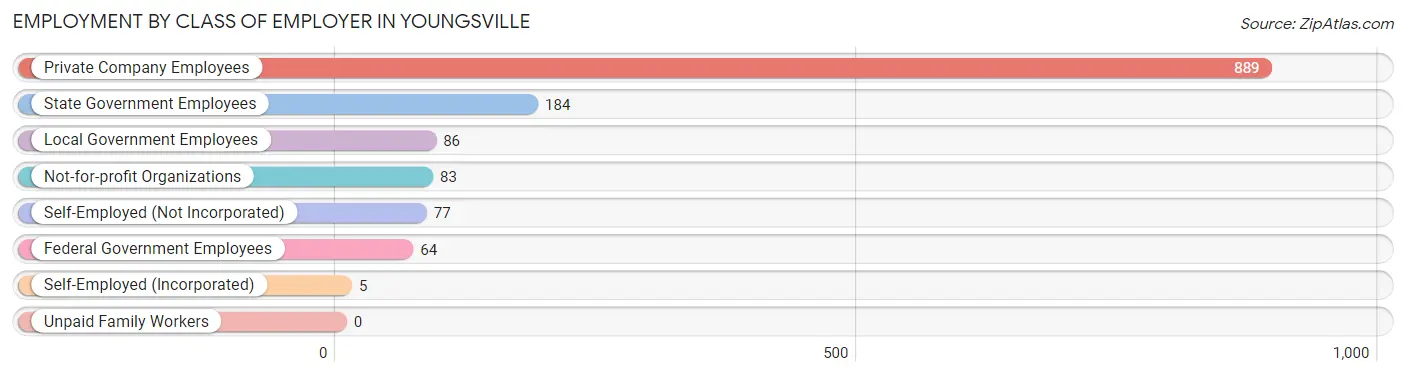
| Employer Class | # Employees | % Employees |
| Private Company Employees | 889 | 64.0% |
| Self-Employed (Incorporated) | 5 | 0.4% |
| Self-Employed (Not Incorporated) | 77 | 5.6% |
| Not-for-profit Organizations | 83 | 6.0% |
| Local Government Employees | 86 | 6.2% |
| State Government Employees | 184 | 13.3% |
| Federal Government Employees | 64 | 4.6% |
| Unpaid Family Workers | 0 | 0.0% |
| Total | 1,388 | 100.0% |
Employment Status by Age in Youngsville
According to the labor force statistics for Youngsville, out of the total population over 16 years of age (1,799), 80.0% or 1,439 individuals are in the labor force, with 3.6% or 52 of them unemployed. The age group with the highest labor force participation rate is 30 to 34 years, with 100.0% or 151 individuals in the labor force. Within the labor force, the 16 to 19 years age range has the highest percentage of unemployed individuals, with 20.5% or 23 of them being unemployed.
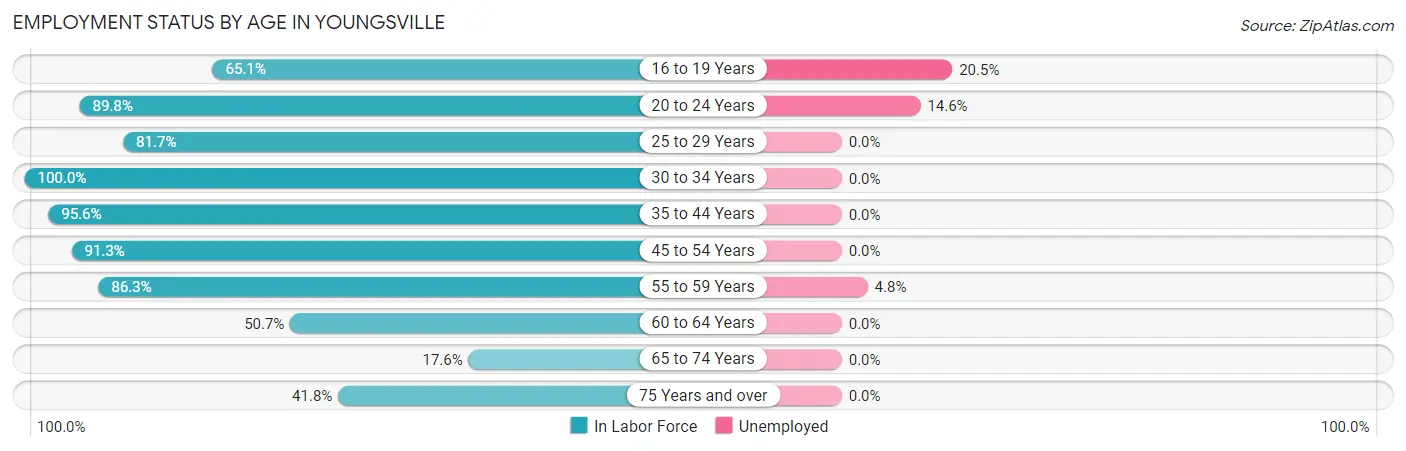
| Age Bracket | In Labor Force | Unemployed |
| 16 to 19 Years | 112 (65.1%) | 23 (20.5%) |
| 20 to 24 Years | 158 (89.8%) | 23 (14.6%) |
| 25 to 29 Years | 179 (81.7%) | 0 (0.0%) |
| 30 to 34 Years | 151 (100.0%) | 0 (0.0%) |
| 35 to 44 Years | 369 (95.6%) | 0 (0.0%) |
| 45 to 54 Years | 262 (91.3%) | 0 (0.0%) |
| 55 to 59 Years | 126 (86.3%) | 6 (4.8%) |
| 60 to 64 Years | 36 (50.7%) | 0 (0.0%) |
| 65 to 74 Years | 24 (17.6%) | 0 (0.0%) |
| 75 Years and over | 23 (41.8%) | 0 (0.0%) |
| Total | 1,439 (80.0%) | 52 (3.6%) |
Employment Status by Educational Attainment in Youngsville
According to labor force statistics for Youngsville, 89.1% of individuals (1,123) out of the total population between 25 and 64 years of age (1,260) are in the labor force, with 0.5% or 6 of them being unemployed. The group with the highest labor force participation rate are those with the educational attainment of less than high school, with 100.0% or 41 individuals in the labor force. Within the labor force, individuals with college / associate degree education have the highest percentage of unemployment, with 0.9% or 4 of them being unemployed.
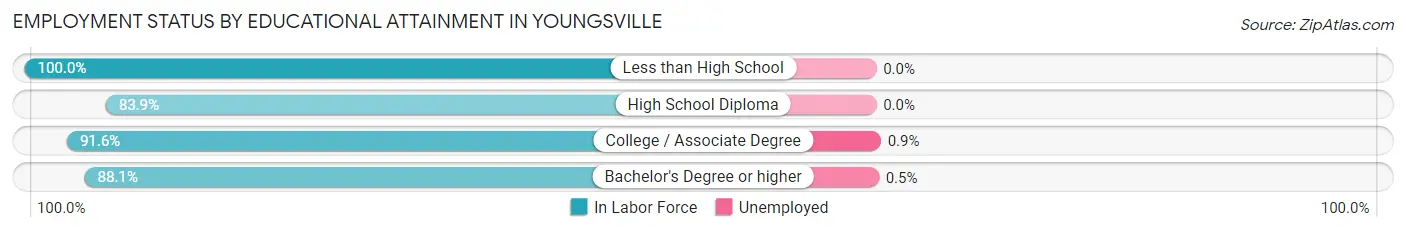
| Educational Attainment | In Labor Force | Unemployed |
| Less than High School | 41 (100.0%) | 0 (0.0%) |
| High School Diploma | 198 (83.9%) | 0 (0.0%) |
| College / Associate Degree | 470 (91.6%) | 5 (0.9%) |
| Bachelor's Degree or higher | 414 (88.1%) | 2 (0.5%) |
| Total | 1,123 (89.1%) | 6 (0.5%) |
Employment Occupations by Sex in Youngsville
Management, Business, Science and Arts Occupations
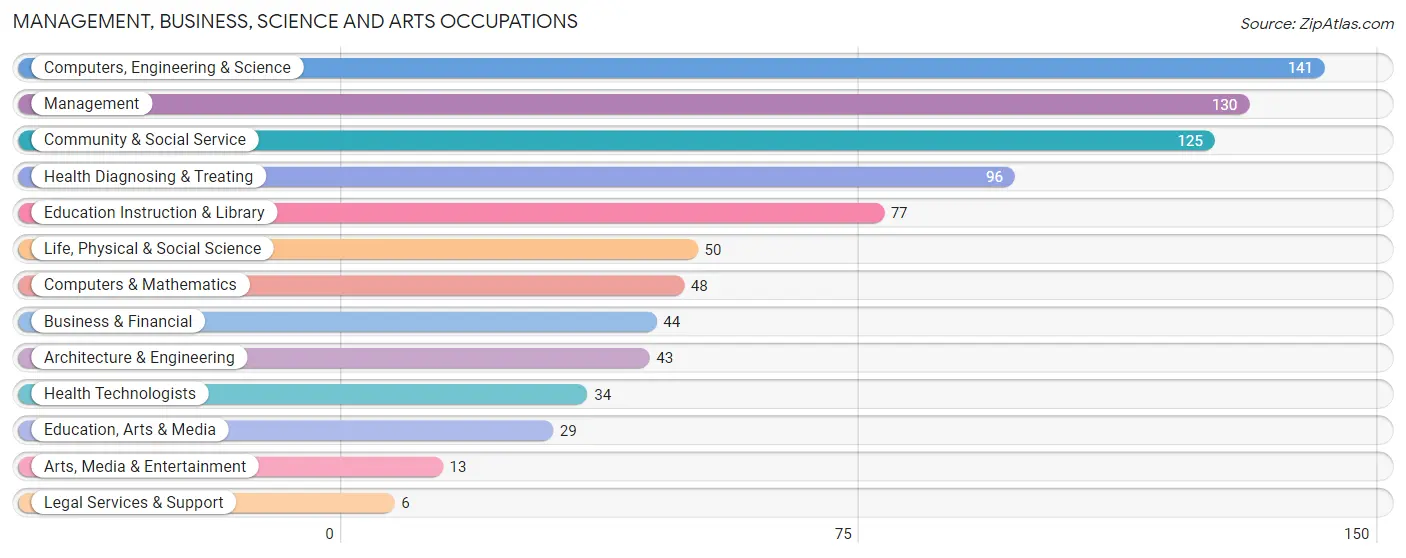
The most common Management, Business, Science and Arts occupations in Youngsville are Computers, Engineering & Science (141 | 10.2%), Management (130 | 9.4%), Community & Social Service (125 | 9.0%), Health Diagnosing & Treating (96 | 6.9%), and Education Instruction & Library (77 | 5.6%).
Management, Business, Science and Arts Occupations by Sex
Within the Management, Business, Science and Arts occupations in Youngsville, the most male-oriented occupations are Architecture & Engineering (90.7%), Education, Arts & Media (75.9%), and Management (65.4%), while the most female-oriented occupations are Legal Services & Support (100.0%), Health Technologists (100.0%), and Life, Physical & Social Science (96.0%).
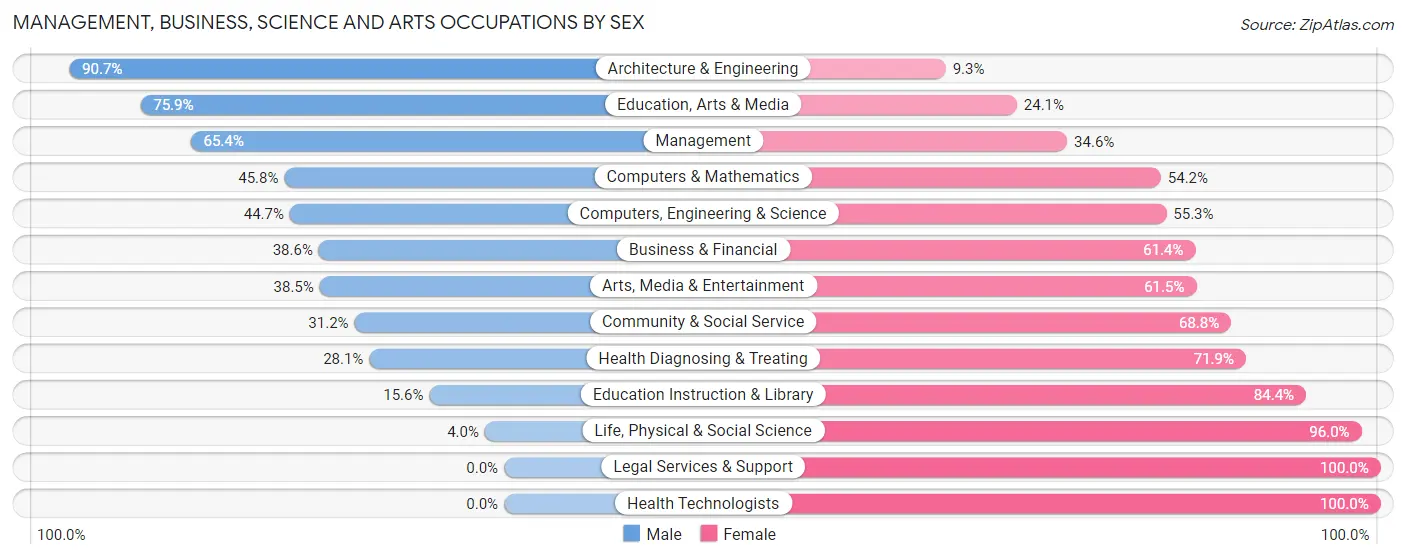
| Occupation | Male | Female |
| Management | 85 (65.4%) | 45 (34.6%) |
| Business & Financial | 17 (38.6%) | 27 (61.4%) |
| Computers, Engineering & Science | 63 (44.7%) | 78 (55.3%) |
| Computers & Mathematics | 22 (45.8%) | 26 (54.2%) |
| Architecture & Engineering | 39 (90.7%) | 4 (9.3%) |
| Life, Physical & Social Science | 2 (4.0%) | 48 (96.0%) |
| Community & Social Service | 39 (31.2%) | 86 (68.8%) |
| Education, Arts & Media | 22 (75.9%) | 7 (24.1%) |
| Legal Services & Support | 0 (0.0%) | 6 (100.0%) |
| Education Instruction & Library | 12 (15.6%) | 65 (84.4%) |
| Arts, Media & Entertainment | 5 (38.5%) | 8 (61.5%) |
| Health Diagnosing & Treating | 27 (28.1%) | 69 (71.9%) |
| Health Technologists | 0 (0.0%) | 34 (100.0%) |
| Total (Category) | 231 (43.1%) | 305 (56.9%) |
| Total (Overall) | 676 (48.7%) | 712 (51.3%) |
Services Occupations
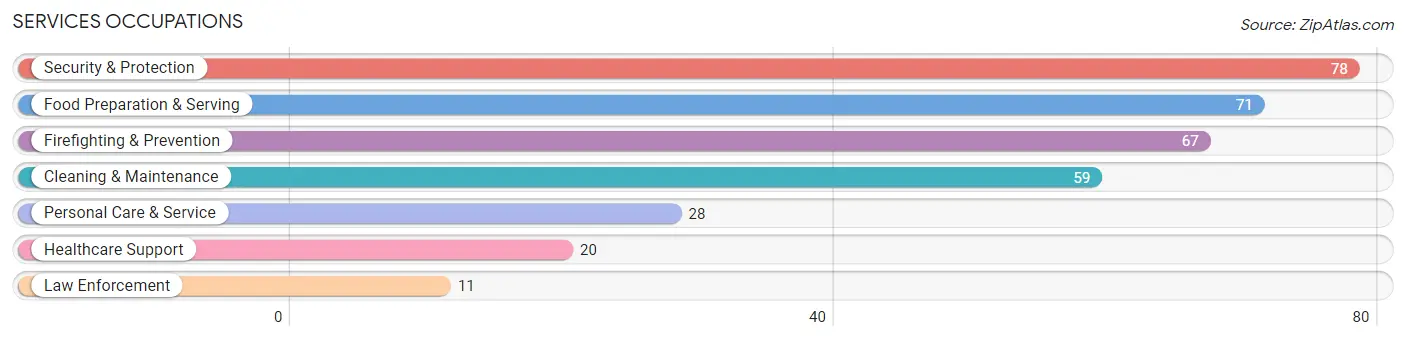
The most common Services occupations in Youngsville are Security & Protection (78 | 5.6%), Food Preparation & Serving (71 | 5.1%), Firefighting & Prevention (67 | 4.8%), Cleaning & Maintenance (59 | 4.3%), and Personal Care & Service (28 | 2.0%).
Services Occupations by Sex
Within the Services occupations in Youngsville, the most male-oriented occupations are Law Enforcement (100.0%), Food Preparation & Serving (81.7%), and Cleaning & Maintenance (79.7%), while the most female-oriented occupations are Healthcare Support (100.0%), Personal Care & Service (100.0%), and Firefighting & Prevention (28.4%).
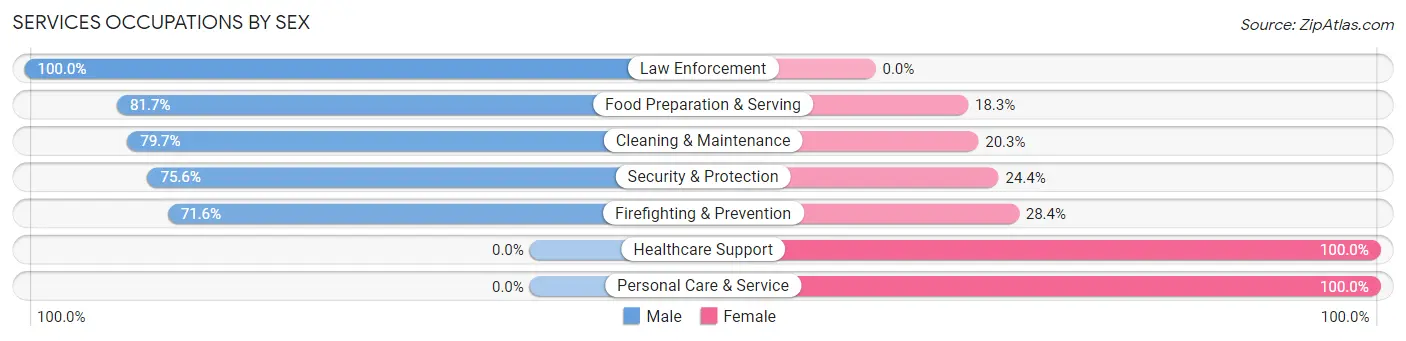
| Occupation | Male | Female |
| Healthcare Support | 0 (0.0%) | 20 (100.0%) |
| Security & Protection | 59 (75.6%) | 19 (24.4%) |
| Firefighting & Prevention | 48 (71.6%) | 19 (28.4%) |
| Law Enforcement | 11 (100.0%) | 0 (0.0%) |
| Food Preparation & Serving | 58 (81.7%) | 13 (18.3%) |
| Cleaning & Maintenance | 47 (79.7%) | 12 (20.3%) |
| Personal Care & Service | 0 (0.0%) | 28 (100.0%) |
| Total (Category) | 164 (64.1%) | 92 (35.9%) |
| Total (Overall) | 676 (48.7%) | 712 (51.3%) |
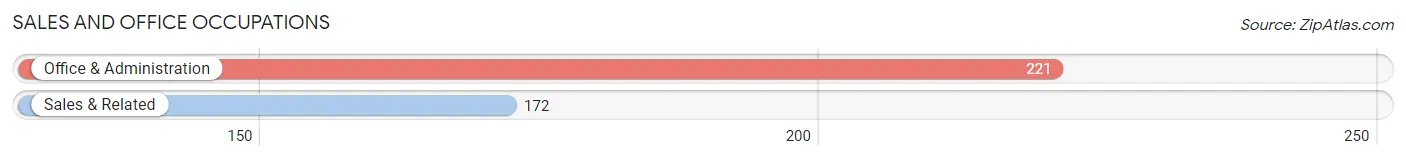
Sales and Office Occupations
The most common Sales and Office occupations in Youngsville are Office & Administration (221 | 15.9%), and Sales & Related (172 | 12.4%).
Sales and Office Occupations by Sex

| Occupation | Male | Female |
| Sales & Related | 108 (62.8%) | 64 (37.2%) |
| Office & Administration | 33 (14.9%) | 188 (85.1%) |
| Total (Category) | 141 (35.9%) | 252 (64.1%) |
| Total (Overall) | 676 (48.7%) | 712 (51.3%) |
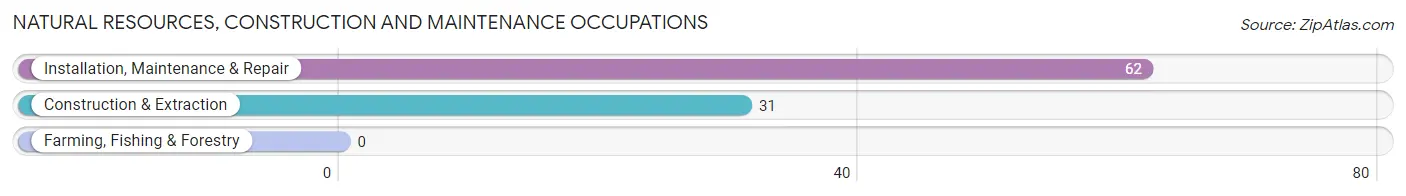
Natural Resources, Construction and Maintenance Occupations
The most common Natural Resources, Construction and Maintenance occupations in Youngsville are Installation, Maintenance & Repair (62 | 4.5%), and Construction & Extraction (31 | 2.2%).
Natural Resources, Construction and Maintenance Occupations by Sex
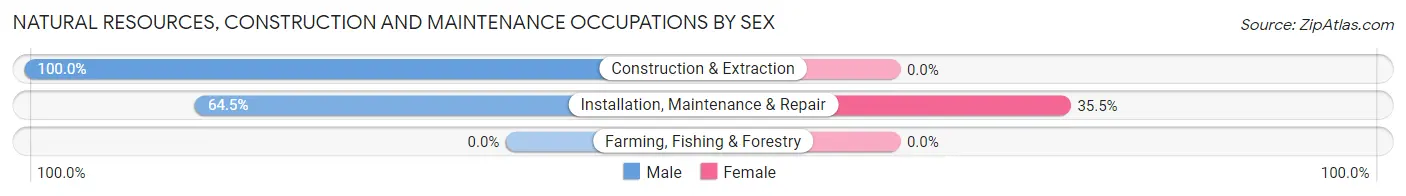
| Occupation | Male | Female |
| Farming, Fishing & Forestry | 0 (0.0%) | 0 (0.0%) |
| Construction & Extraction | 31 (100.0%) | 0 (0.0%) |
| Installation, Maintenance & Repair | 40 (64.5%) | 22 (35.5%) |
| Total (Category) | 71 (76.3%) | 22 (23.7%) |
| Total (Overall) | 676 (48.7%) | 712 (51.3%) |
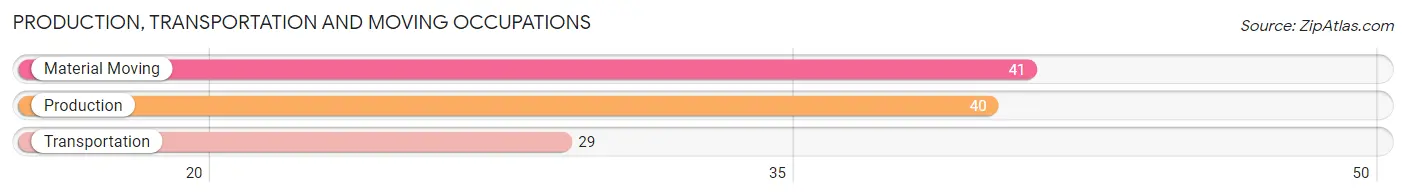
Production, Transportation and Moving Occupations
The most common Production, Transportation and Moving occupations in Youngsville are Material Moving (41 | 2.9%), Production (40 | 2.9%), and Transportation (29 | 2.1%).
Production, Transportation and Moving Occupations by Sex
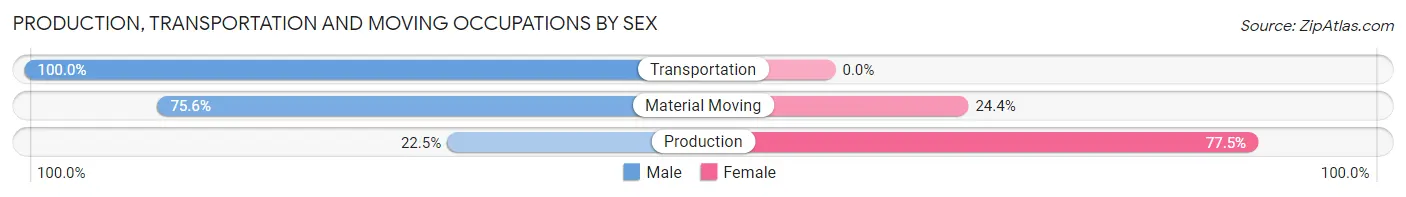
| Occupation | Male | Female |
| Production | 9 (22.5%) | 31 (77.5%) |
| Transportation | 29 (100.0%) | 0 (0.0%) |
| Material Moving | 31 (75.6%) | 10 (24.4%) |
| Total (Category) | 69 (62.7%) | 41 (37.3%) |
| Total (Overall) | 676 (48.7%) | 712 (51.3%) |
Employment Industries by Sex in Youngsville
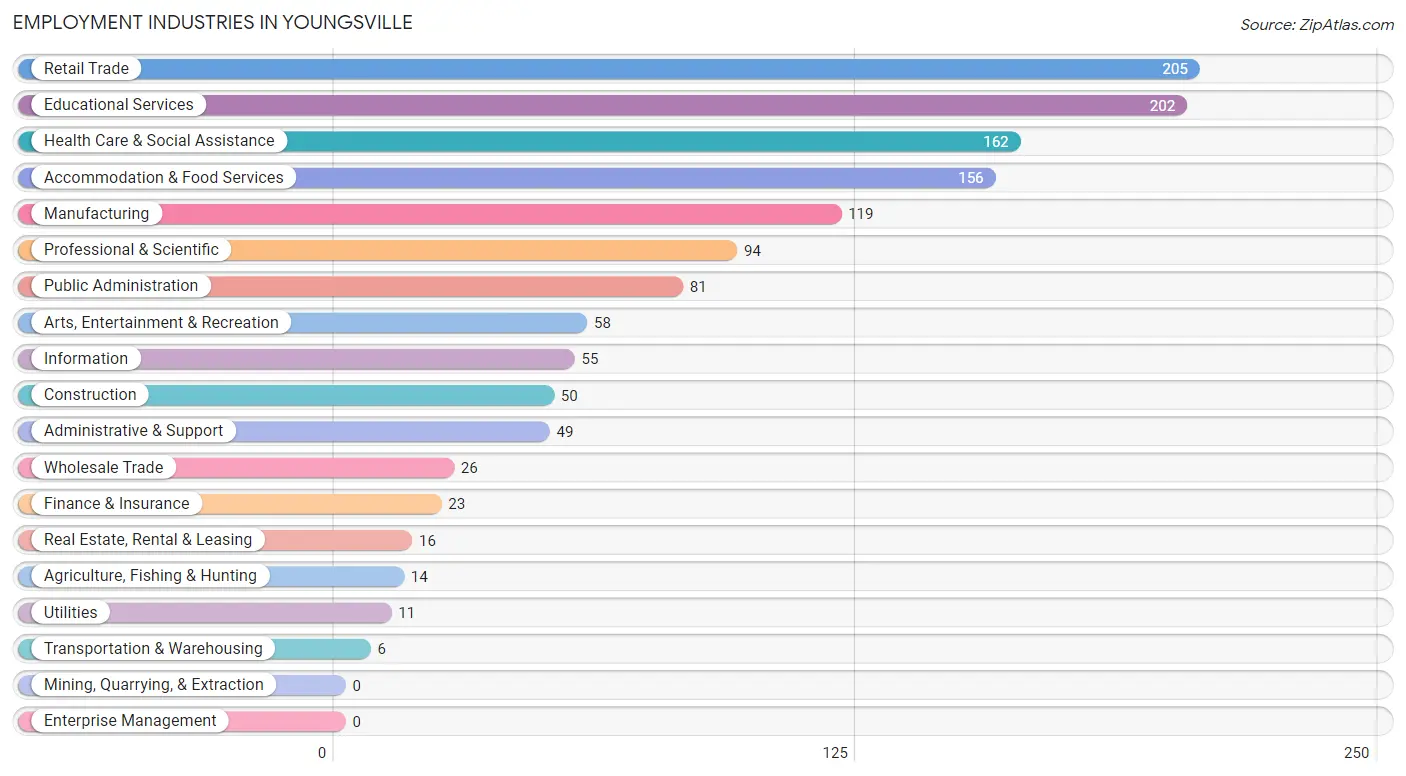
Employment Industries in Youngsville
The major employment industries in Youngsville include Retail Trade (205 | 14.8%), Educational Services (202 | 14.5%), Health Care & Social Assistance (162 | 11.7%), Accommodation & Food Services (156 | 11.2%), and Manufacturing (119 | 8.6%).
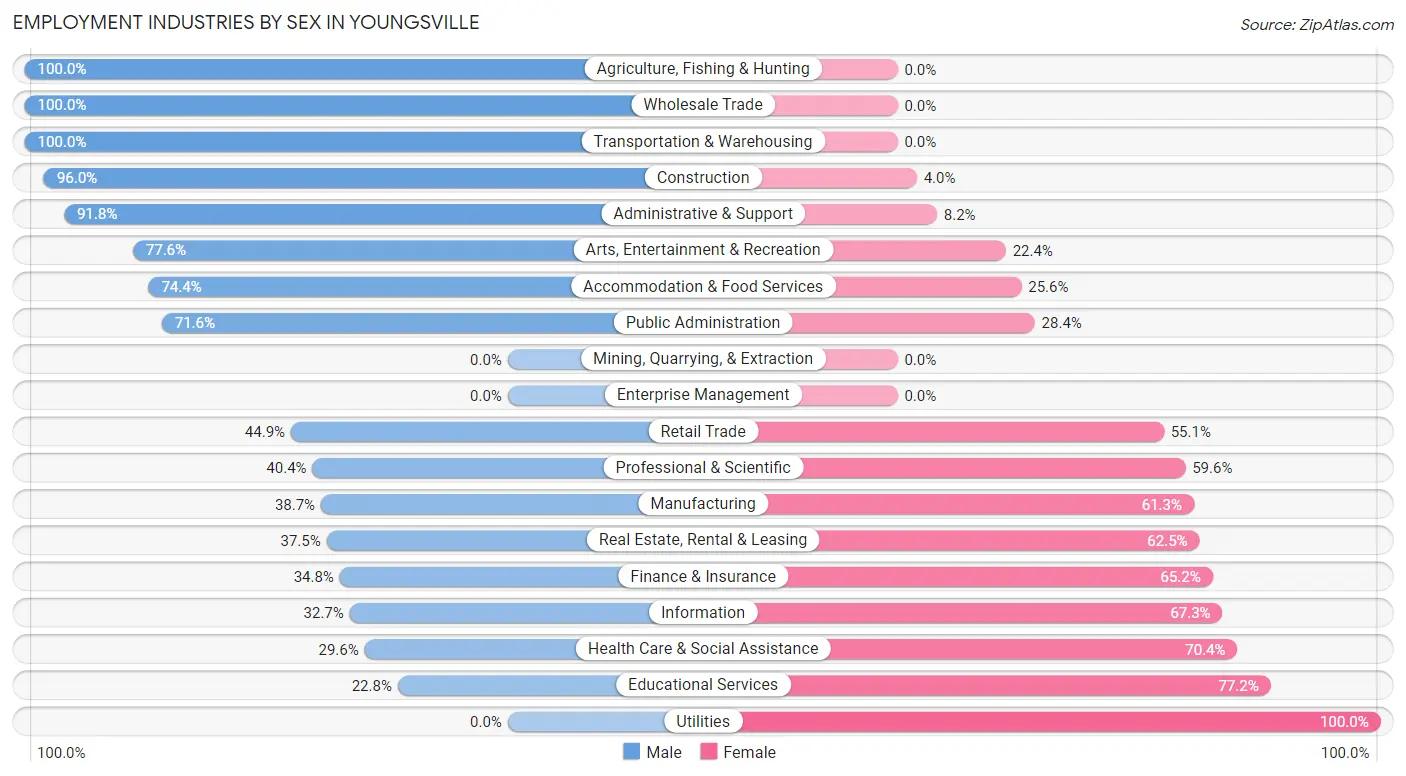
Employment Industries by Sex in Youngsville
The Youngsville industries that see more men than women are Agriculture, Fishing & Hunting (100.0%), Wholesale Trade (100.0%), and Transportation & Warehousing (100.0%), whereas the industries that tend to have a higher number of women are Utilities (100.0%), Educational Services (77.2%), and Health Care & Social Assistance (70.4%).
| Industry | Male | Female |
| Agriculture, Fishing & Hunting | 14 (100.0%) | 0 (0.0%) |
| Mining, Quarrying, & Extraction | 0 (0.0%) | 0 (0.0%) |
| Construction | 48 (96.0%) | 2 (4.0%) |
| Manufacturing | 46 (38.7%) | 73 (61.3%) |
| Wholesale Trade | 26 (100.0%) | 0 (0.0%) |
| Retail Trade | 92 (44.9%) | 113 (55.1%) |
| Transportation & Warehousing | 6 (100.0%) | 0 (0.0%) |
| Utilities | 0 (0.0%) | 11 (100.0%) |
| Information | 18 (32.7%) | 37 (67.3%) |
| Finance & Insurance | 8 (34.8%) | 15 (65.2%) |
| Real Estate, Rental & Leasing | 6 (37.5%) | 10 (62.5%) |
| Professional & Scientific | 38 (40.4%) | 56 (59.6%) |
| Enterprise Management | 0 (0.0%) | 0 (0.0%) |
| Administrative & Support | 45 (91.8%) | 4 (8.2%) |
| Educational Services | 46 (22.8%) | 156 (77.2%) |
| Health Care & Social Assistance | 48 (29.6%) | 114 (70.4%) |
| Arts, Entertainment & Recreation | 45 (77.6%) | 13 (22.4%) |
| Accommodation & Food Services | 116 (74.4%) | 40 (25.6%) |
| Public Administration | 58 (71.6%) | 23 (28.4%) |
| Total | 676 (48.7%) | 712 (51.3%) |
Education in Youngsville
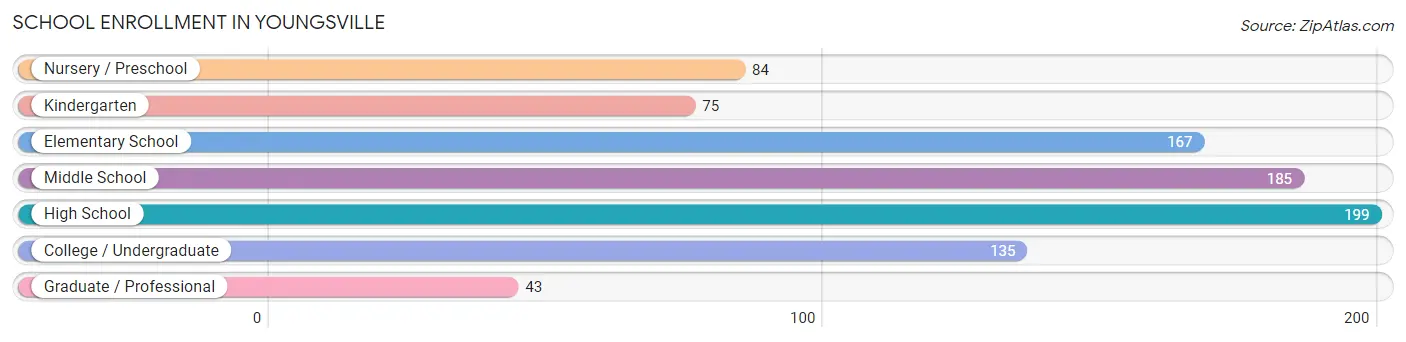
School Enrollment in Youngsville
The most common levels of schooling among the 888 students in Youngsville are high school (199 | 22.4%), middle school (185 | 20.8%), and elementary school (167 | 18.8%).
| School Level | # Students | % Students |
| Nursery / Preschool | 84 | 9.5% |
| Kindergarten | 75 | 8.5% |
| Elementary School | 167 | 18.8% |
| Middle School | 185 | 20.8% |
| High School | 199 | 22.4% |
| College / Undergraduate | 135 | 15.2% |
| Graduate / Professional | 43 | 4.8% |
| Total | 888 | 100.0% |
School Enrollment by Age by Funding Source in Youngsville
Out of a total of 888 students who are enrolled in schools in Youngsville, 177 (19.9%) attend a private institution, while the remaining 711 (80.1%) are enrolled in public schools. The age group of 25 to 34 year olds has the highest likelihood of being enrolled in private schools, with 20 (74.1% in the age bracket) enrolled. Conversely, the age group of 3 to 4 year olds has the lowest likelihood of being enrolled in a private school, with 84 (100.0% in the age bracket) attending a public institution.
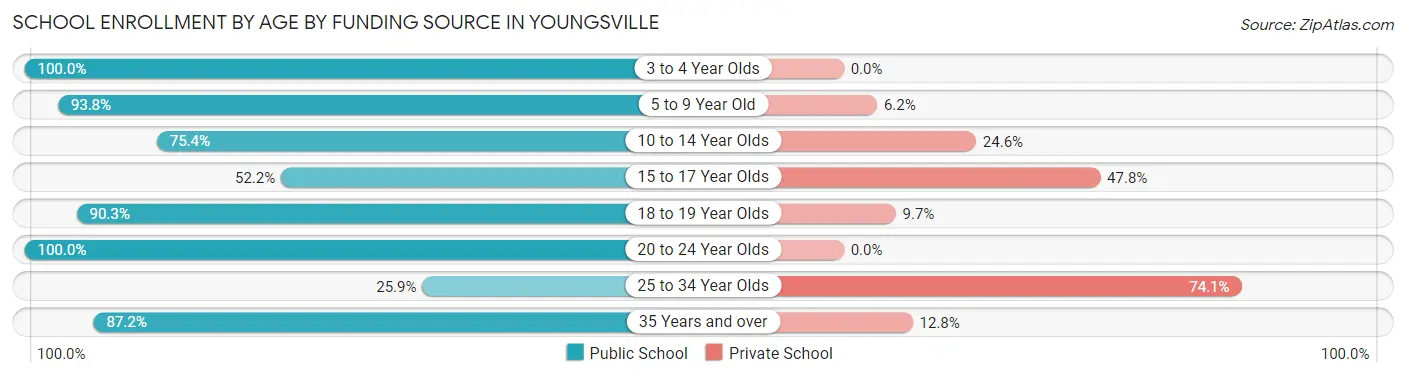
| Age Bracket | Public School | Private School |
| 3 to 4 Year Olds | 84 (100.0%) | 0 (0.0%) |
| 5 to 9 Year Old | 227 (93.8%) | 15 (6.2%) |
| 10 to 14 Year Olds | 153 (75.4%) | 50 (24.6%) |
| 15 to 17 Year Olds | 82 (52.2%) | 75 (47.8%) |
| 18 to 19 Year Olds | 28 (90.3%) | 3 (9.7%) |
| 20 to 24 Year Olds | 35 (100.0%) | 0 (0.0%) |
| 25 to 34 Year Olds | 7 (25.9%) | 20 (74.1%) |
| 35 Years and over | 95 (87.2%) | 14 (12.8%) |
| Total | 711 (80.1%) | 177 (19.9%) |
Educational Attainment by Field of Study in Youngsville
Business (154 | 29.8%), education (81 | 15.7%), science & technology (69 | 13.4%), arts & humanities (45 | 8.7%), and engineering (41 | 7.9%) are the most common fields of study among 517 individuals in Youngsville who have obtained a bachelor's degree or higher.
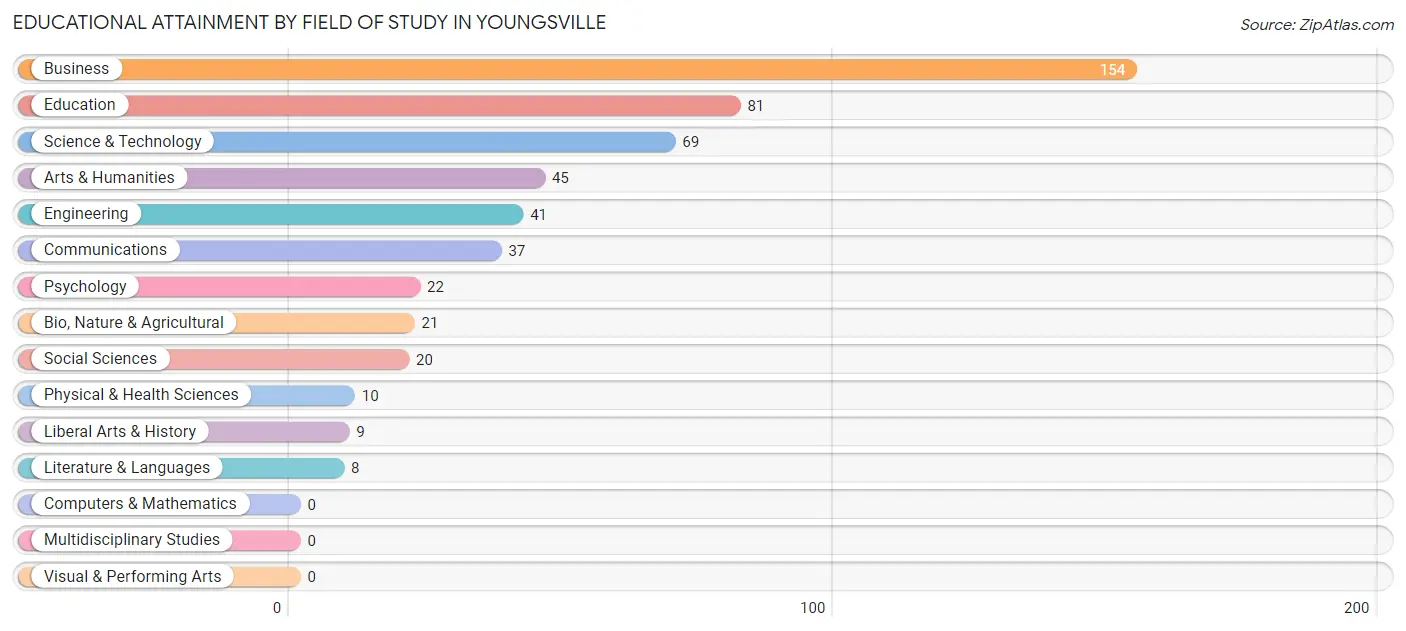
| Field of Study | # Graduates | % Graduates |
| Computers & Mathematics | 0 | 0.0% |
| Bio, Nature & Agricultural | 21 | 4.1% |
| Physical & Health Sciences | 10 | 1.9% |
| Psychology | 22 | 4.3% |
| Social Sciences | 20 | 3.9% |
| Engineering | 41 | 7.9% |
| Multidisciplinary Studies | 0 | 0.0% |
| Science & Technology | 69 | 13.4% |
| Business | 154 | 29.8% |
| Education | 81 | 15.7% |
| Literature & Languages | 8 | 1.5% |
| Liberal Arts & History | 9 | 1.7% |
| Visual & Performing Arts | 0 | 0.0% |
| Communications | 37 | 7.2% |
| Arts & Humanities | 45 | 8.7% |
| Total | 517 | 100.0% |
Transportation & Commute in Youngsville
Vehicle Availability by Sex in Youngsville
The most prevalent vehicle ownership categories in Youngsville are males with 2 vehicles (355, accounting for 52.5%) and females with 2 vehicles (287, making up 49.9%).
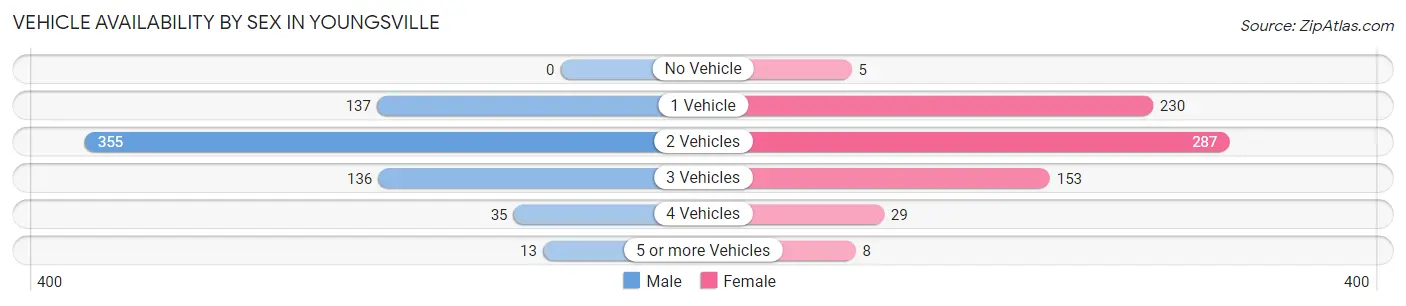
| Vehicles Available | Male | Female |
| No Vehicle | 0 (0.0%) | 5 (0.7%) |
| 1 Vehicle | 137 (20.3%) | 230 (32.3%) |
| 2 Vehicles | 355 (52.5%) | 287 (40.3%) |
| 3 Vehicles | 136 (20.1%) | 153 (21.5%) |
| 4 Vehicles | 35 (5.2%) | 29 (4.1%) |
| 5 or more Vehicles | 13 (1.9%) | 8 (1.1%) |
| Total | 676 (100.0%) | 712 (100.0%) |
Commute Time in Youngsville
The most frequently occuring commute durations in Youngsville are 5 to 9 minutes (232 commuters, 19.1%), 45 to 59 minutes (177 commuters, 14.6%), and 20 to 24 minutes (151 commuters, 12.4%).
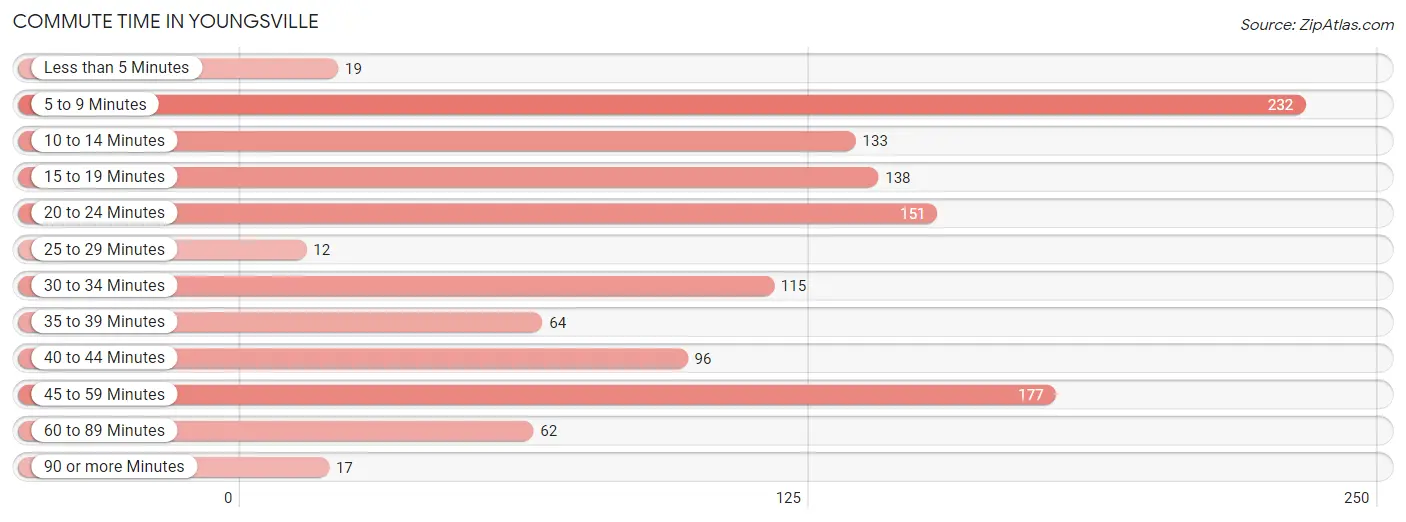
| Commute Time | # Commuters | % Commuters |
| Less than 5 Minutes | 19 | 1.6% |
| 5 to 9 Minutes | 232 | 19.1% |
| 10 to 14 Minutes | 133 | 10.9% |
| 15 to 19 Minutes | 138 | 11.4% |
| 20 to 24 Minutes | 151 | 12.4% |
| 25 to 29 Minutes | 12 | 1.0% |
| 30 to 34 Minutes | 115 | 9.5% |
| 35 to 39 Minutes | 64 | 5.3% |
| 40 to 44 Minutes | 96 | 7.9% |
| 45 to 59 Minutes | 177 | 14.6% |
| 60 to 89 Minutes | 62 | 5.1% |
| 90 or more Minutes | 17 | 1.4% |
Commute Time by Sex in Youngsville
The most common commute times in Youngsville are 5 to 9 minutes (173 commuters, 28.4%) for males and 20 to 24 minutes (137 commuters, 22.5%) for females.
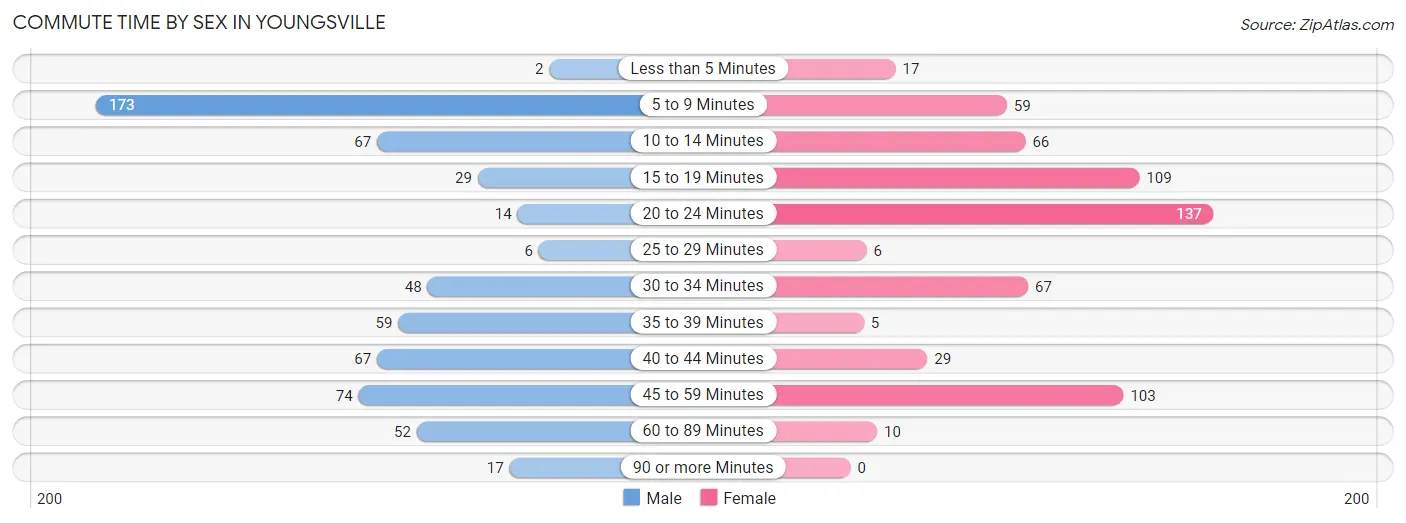
| Commute Time | Male | Female |
| Less than 5 Minutes | 2 (0.3%) | 17 (2.8%) |
| 5 to 9 Minutes | 173 (28.4%) | 59 (9.7%) |
| 10 to 14 Minutes | 67 (11.0%) | 66 (10.9%) |
| 15 to 19 Minutes | 29 (4.8%) | 109 (17.9%) |
| 20 to 24 Minutes | 14 (2.3%) | 137 (22.5%) |
| 25 to 29 Minutes | 6 (1.0%) | 6 (1.0%) |
| 30 to 34 Minutes | 48 (7.9%) | 67 (11.0%) |
| 35 to 39 Minutes | 59 (9.7%) | 5 (0.8%) |
| 40 to 44 Minutes | 67 (11.0%) | 29 (4.8%) |
| 45 to 59 Minutes | 74 (12.2%) | 103 (16.9%) |
| 60 to 89 Minutes | 52 (8.6%) | 10 (1.6%) |
| 90 or more Minutes | 17 (2.8%) | 0 (0.0%) |
Time of Departure to Work by Sex in Youngsville
The most frequent times of departure to work in Youngsville are 7:00 AM to 7:29 AM (187, 30.8%) for males and 8:00 AM to 8:29 AM (123, 20.2%) for females.
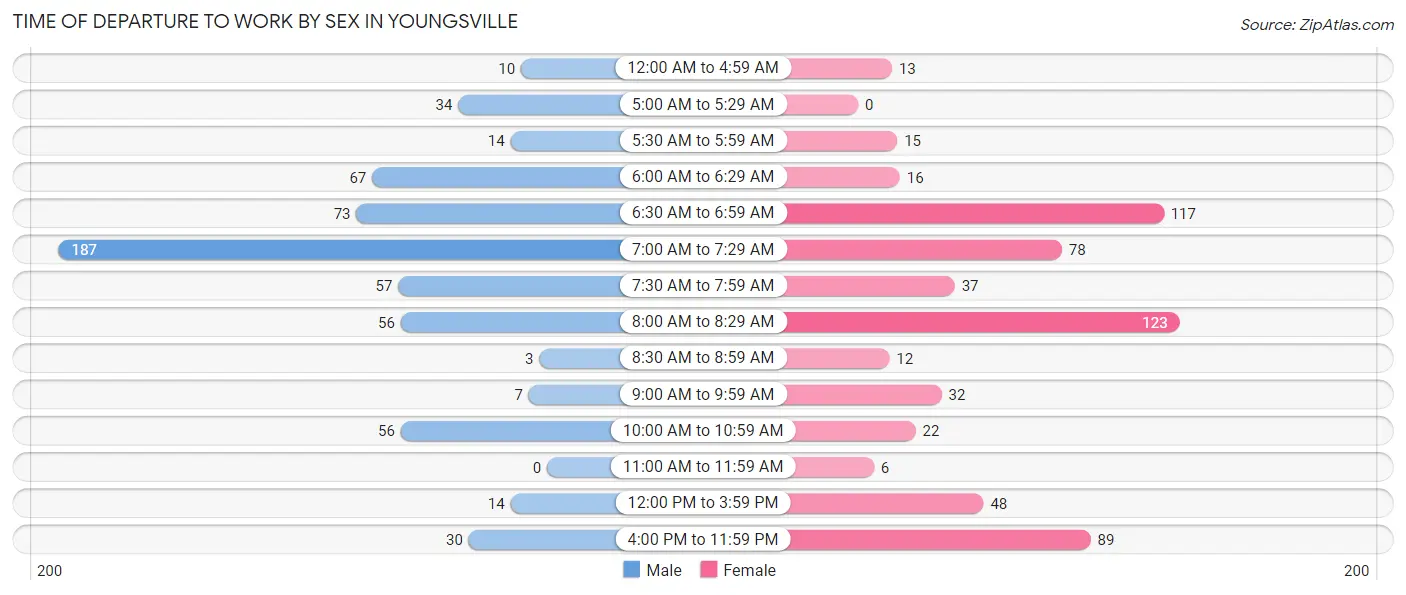
| Time of Departure | Male | Female |
| 12:00 AM to 4:59 AM | 10 (1.6%) | 13 (2.1%) |
| 5:00 AM to 5:29 AM | 34 (5.6%) | 0 (0.0%) |
| 5:30 AM to 5:59 AM | 14 (2.3%) | 15 (2.5%) |
| 6:00 AM to 6:29 AM | 67 (11.0%) | 16 (2.6%) |
| 6:30 AM to 6:59 AM | 73 (12.0%) | 117 (19.2%) |
| 7:00 AM to 7:29 AM | 187 (30.8%) | 78 (12.8%) |
| 7:30 AM to 7:59 AM | 57 (9.4%) | 37 (6.1%) |
| 8:00 AM to 8:29 AM | 56 (9.2%) | 123 (20.2%) |
| 8:30 AM to 8:59 AM | 3 (0.5%) | 12 (2.0%) |
| 9:00 AM to 9:59 AM | 7 (1.1%) | 32 (5.3%) |
| 10:00 AM to 10:59 AM | 56 (9.2%) | 22 (3.6%) |
| 11:00 AM to 11:59 AM | 0 (0.0%) | 6 (1.0%) |
| 12:00 PM to 3:59 PM | 14 (2.3%) | 48 (7.9%) |
| 4:00 PM to 11:59 PM | 30 (4.9%) | 89 (14.6%) |
| Total | 608 (100.0%) | 608 (100.0%) |
Housing Occupancy in Youngsville
Occupancy by Ownership in Youngsville
Of the total 940 dwellings in Youngsville, owner-occupied units account for 462 (49.1%), while renter-occupied units make up 478 (50.8%).
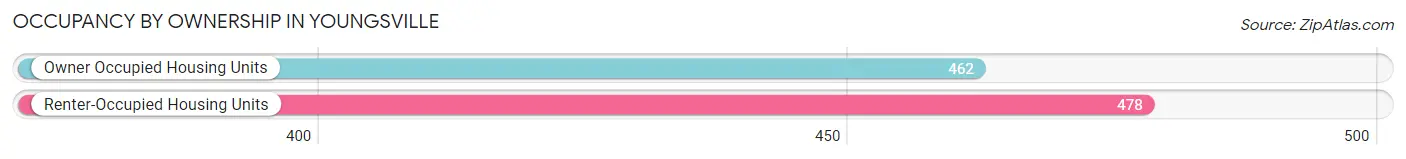
| Occupancy | # Housing Units | % Housing Units |
| Owner Occupied Housing Units | 462 | 49.1% |
| Renter-Occupied Housing Units | 478 | 50.8% |
| Total Occupied Housing Units | 940 | 100.0% |
Occupancy by Household Size in Youngsville
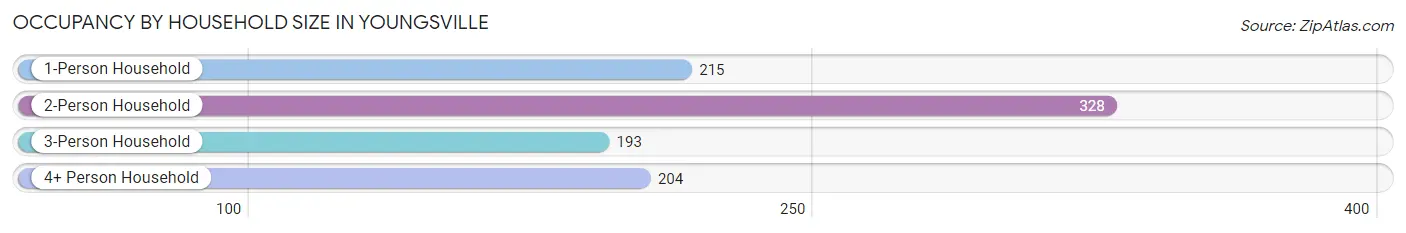
| Household Size | # Housing Units | % Housing Units |
| 1-Person Household | 215 | 22.9% |
| 2-Person Household | 328 | 34.9% |
| 3-Person Household | 193 | 20.5% |
| 4+ Person Household | 204 | 21.7% |
| Total Housing Units | 940 | 100.0% |
Occupancy by Ownership by Household Size in Youngsville
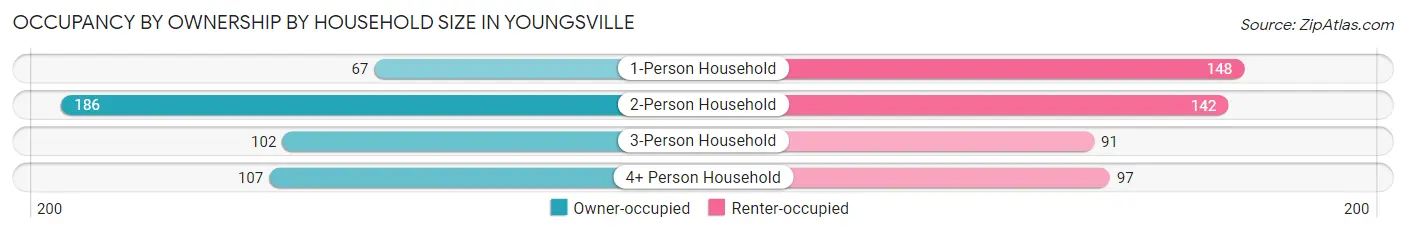
| Household Size | Owner-occupied | Renter-occupied |
| 1-Person Household | 67 (31.2%) | 148 (68.8%) |
| 2-Person Household | 186 (56.7%) | 142 (43.3%) |
| 3-Person Household | 102 (52.8%) | 91 (47.1%) |
| 4+ Person Household | 107 (52.4%) | 97 (47.5%) |
| Total Housing Units | 462 (49.1%) | 478 (50.8%) |
Occupancy by Educational Attainment in Youngsville
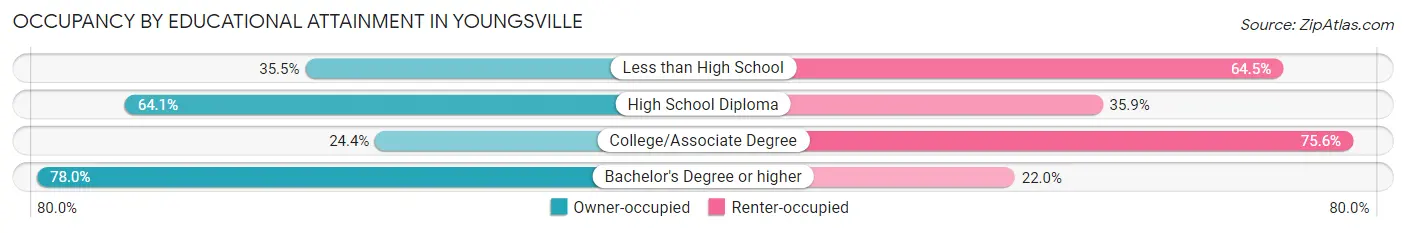
| Household Size | Owner-occupied | Renter-occupied |
| Less than High School | 11 (35.5%) | 20 (64.5%) |
| High School Diploma | 75 (64.1%) | 42 (35.9%) |
| College/Associate Degree | 110 (24.4%) | 341 (75.6%) |
| Bachelor's Degree or higher | 266 (78.0%) | 75 (22.0%) |
Occupancy by Age of Householder in Youngsville
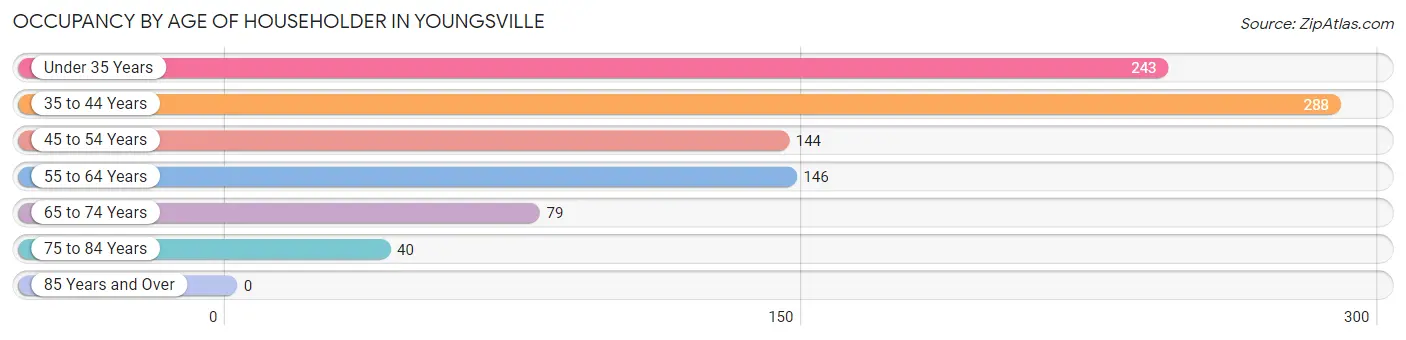
| Age Bracket | # Households | % Households |
| Under 35 Years | 243 | 25.9% |
| 35 to 44 Years | 288 | 30.6% |
| 45 to 54 Years | 144 | 15.3% |
| 55 to 64 Years | 146 | 15.5% |
| 65 to 74 Years | 79 | 8.4% |
| 75 to 84 Years | 40 | 4.3% |
| 85 Years and Over | 0 | 0.0% |
| Total | 940 | 100.0% |
Housing Finances in Youngsville
Median Income by Occupancy in Youngsville
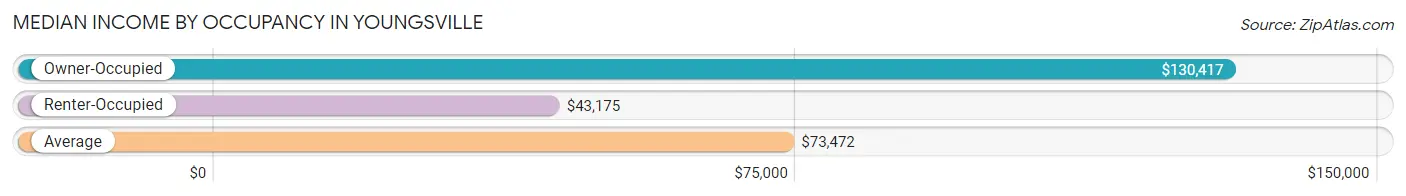
| Occupancy Type | # Households | Median Income |
| Owner-Occupied | 462 (49.1%) | $130,417 |
| Renter-Occupied | 478 (50.8%) | $43,175 |
| Average | 940 (100.0%) | $73,472 |
Occupancy by Householder Income Bracket in Youngsville
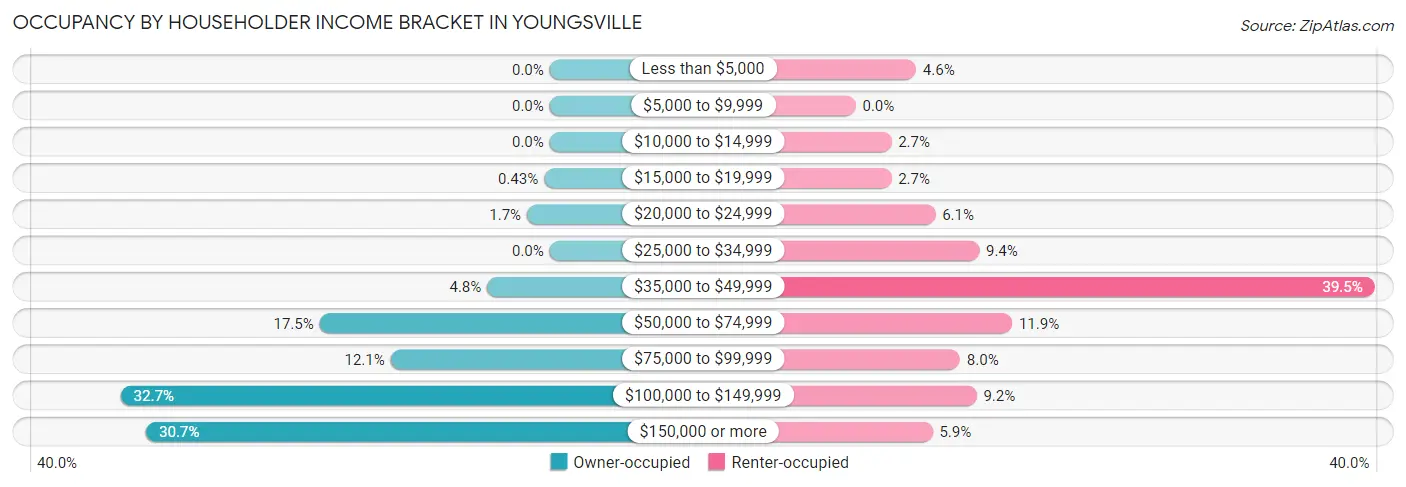
| Income Bracket | Owner-occupied | Renter-occupied |
| Less than $5,000 | 0 (0.0%) | 22 (4.6%) |
| $5,000 to $9,999 | 0 (0.0%) | 0 (0.0%) |
| $10,000 to $14,999 | 0 (0.0%) | 13 (2.7%) |
| $15,000 to $19,999 | 2 (0.4%) | 13 (2.7%) |
| $20,000 to $24,999 | 8 (1.7%) | 29 (6.1%) |
| $25,000 to $34,999 | 0 (0.0%) | 45 (9.4%) |
| $35,000 to $49,999 | 22 (4.8%) | 189 (39.5%) |
| $50,000 to $74,999 | 81 (17.5%) | 57 (11.9%) |
| $75,000 to $99,999 | 56 (12.1%) | 38 (8.0%) |
| $100,000 to $149,999 | 151 (32.7%) | 44 (9.2%) |
| $150,000 or more | 142 (30.7%) | 28 (5.9%) |
| Total | 462 (100.0%) | 478 (100.0%) |
Monthly Housing Cost Tiers in Youngsville
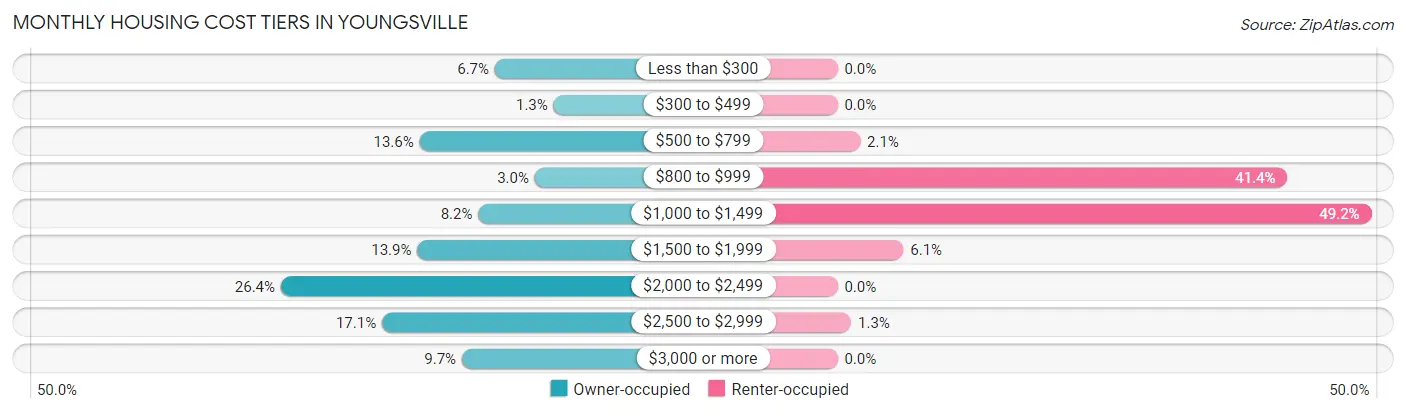
| Monthly Cost | Owner-occupied | Renter-occupied |
| Less than $300 | 31 (6.7%) | 0 (0.0%) |
| $300 to $499 | 6 (1.3%) | 0 (0.0%) |
| $500 to $799 | 63 (13.6%) | 10 (2.1%) |
| $800 to $999 | 14 (3.0%) | 198 (41.4%) |
| $1,000 to $1,499 | 38 (8.2%) | 235 (49.2%) |
| $1,500 to $1,999 | 64 (13.9%) | 29 (6.1%) |
| $2,000 to $2,499 | 122 (26.4%) | 0 (0.0%) |
| $2,500 to $2,999 | 79 (17.1%) | 6 (1.3%) |
| $3,000 or more | 45 (9.7%) | 0 (0.0%) |
| Total | 462 (100.0%) | 478 (100.0%) |
Physical Housing Characteristics in Youngsville
Housing Structures in Youngsville
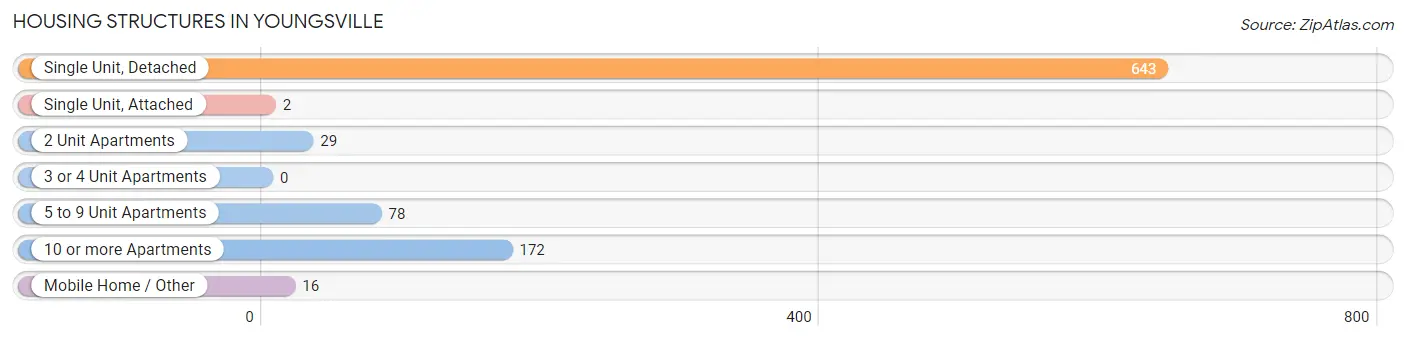
| Structure Type | # Housing Units | % Housing Units |
| Single Unit, Detached | 643 | 68.4% |
| Single Unit, Attached | 2 | 0.2% |
| 2 Unit Apartments | 29 | 3.1% |
| 3 or 4 Unit Apartments | 0 | 0.0% |
| 5 to 9 Unit Apartments | 78 | 8.3% |
| 10 or more Apartments | 172 | 18.3% |
| Mobile Home / Other | 16 | 1.7% |
| Total | 940 | 100.0% |
Housing Structures by Occupancy in Youngsville
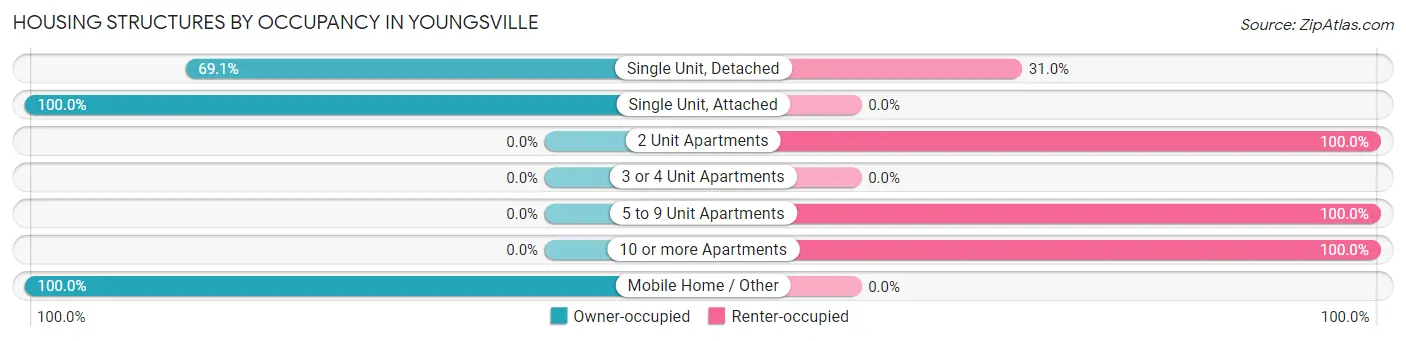
| Structure Type | Owner-occupied | Renter-occupied |
| Single Unit, Detached | 444 (69.1%) | 199 (30.9%) |
| Single Unit, Attached | 2 (100.0%) | 0 (0.0%) |
| 2 Unit Apartments | 0 (0.0%) | 29 (100.0%) |
| 3 or 4 Unit Apartments | 0 (0.0%) | 0 (0.0%) |
| 5 to 9 Unit Apartments | 0 (0.0%) | 78 (100.0%) |
| 10 or more Apartments | 0 (0.0%) | 172 (100.0%) |
| Mobile Home / Other | 16 (100.0%) | 0 (0.0%) |
| Total | 462 (49.1%) | 478 (50.8%) |
Housing Structures by Number of Rooms in Youngsville
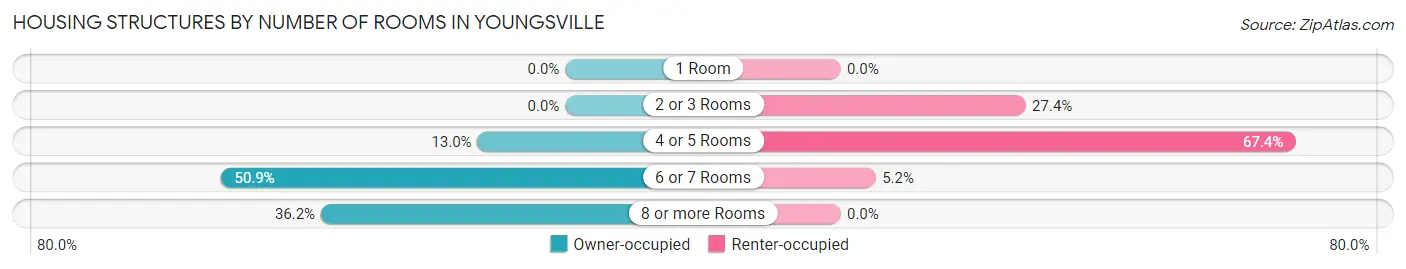
| Number of Rooms | Owner-occupied | Renter-occupied |
| 1 Room | 0 (0.0%) | 0 (0.0%) |
| 2 or 3 Rooms | 0 (0.0%) | 131 (27.4%) |
| 4 or 5 Rooms | 60 (13.0%) | 322 (67.4%) |
| 6 or 7 Rooms | 235 (50.9%) | 25 (5.2%) |
| 8 or more Rooms | 167 (36.1%) | 0 (0.0%) |
| Total | 462 (100.0%) | 478 (100.0%) |
Housing Structure by Heating Type in Youngsville
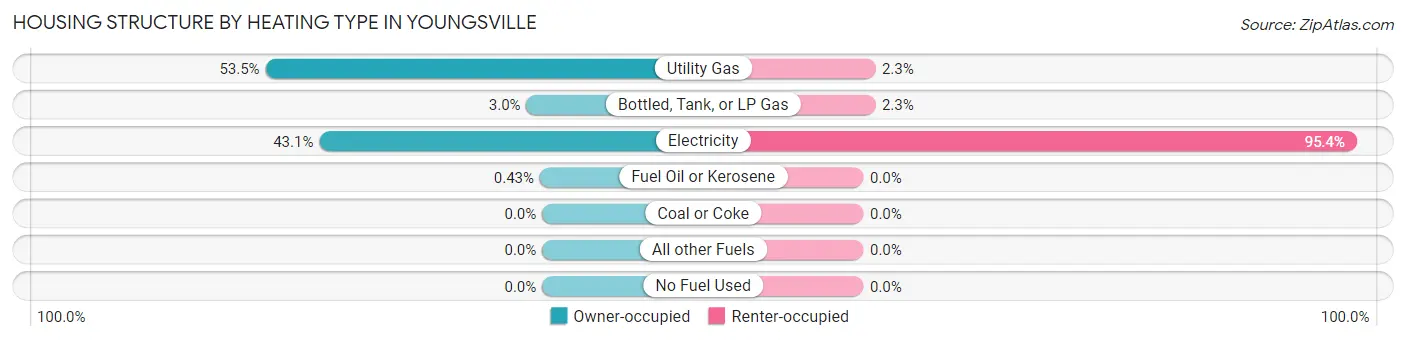
| Heating Type | Owner-occupied | Renter-occupied |
| Utility Gas | 247 (53.5%) | 11 (2.3%) |
| Bottled, Tank, or LP Gas | 14 (3.0%) | 11 (2.3%) |
| Electricity | 199 (43.1%) | 456 (95.4%) |
| Fuel Oil or Kerosene | 2 (0.4%) | 0 (0.0%) |
| Coal or Coke | 0 (0.0%) | 0 (0.0%) |
| All other Fuels | 0 (0.0%) | 0 (0.0%) |
| No Fuel Used | 0 (0.0%) | 0 (0.0%) |
| Total | 462 (100.0%) | 478 (100.0%) |
Household Vehicle Usage in Youngsville
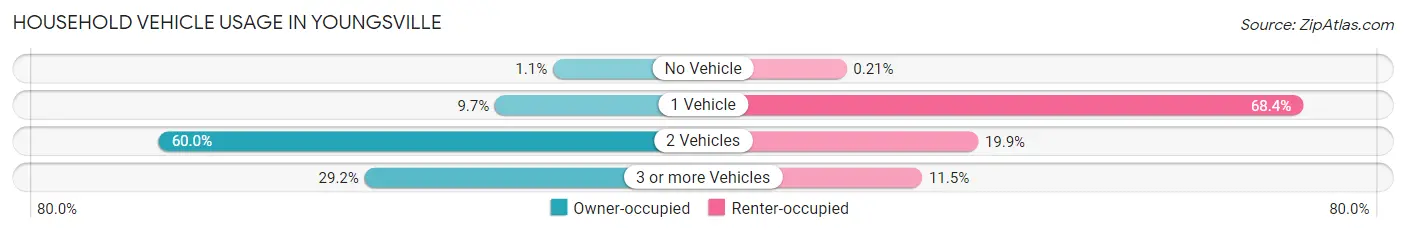
| Vehicles per Household | Owner-occupied | Renter-occupied |
| No Vehicle | 5 (1.1%) | 1 (0.2%) |
| 1 Vehicle | 45 (9.7%) | 327 (68.4%) |
| 2 Vehicles | 277 (60.0%) | 95 (19.9%) |
| 3 or more Vehicles | 135 (29.2%) | 55 (11.5%) |
| Total | 462 (100.0%) | 478 (100.0%) |
Real Estate & Mortgages in Youngsville
Real Estate and Mortgage Overview in Youngsville
| Characteristic | Without Mortgage | With Mortgage |
| Housing Units | 98 | 364 |
| Median Property Value | - | - |
| Median Household Income | $97,941 | $137 |
| Monthly Housing Costs | $540 | $45 |
| Real Estate Taxes | $2,185 | $6 |
Property Value by Mortgage Status in Youngsville
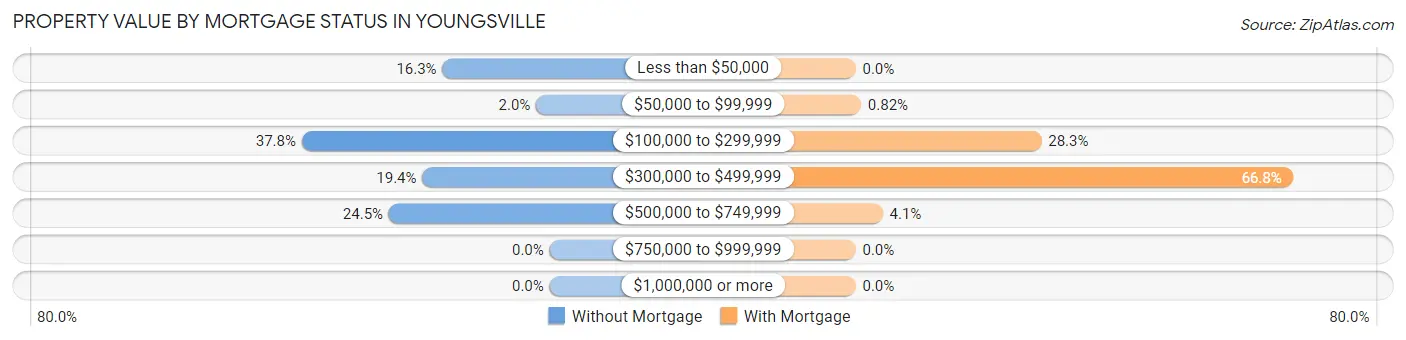
| Property Value | Without Mortgage | With Mortgage |
| Less than $50,000 | 16 (16.3%) | 0 (0.0%) |
| $50,000 to $99,999 | 2 (2.0%) | 3 (0.8%) |
| $100,000 to $299,999 | 37 (37.8%) | 103 (28.3%) |
| $300,000 to $499,999 | 19 (19.4%) | 243 (66.8%) |
| $500,000 to $749,999 | 24 (24.5%) | 15 (4.1%) |
| $750,000 to $999,999 | 0 (0.0%) | 0 (0.0%) |
| $1,000,000 or more | 0 (0.0%) | 0 (0.0%) |
| Total | 98 (100.0%) | 364 (100.0%) |
Household Income by Mortgage Status in Youngsville
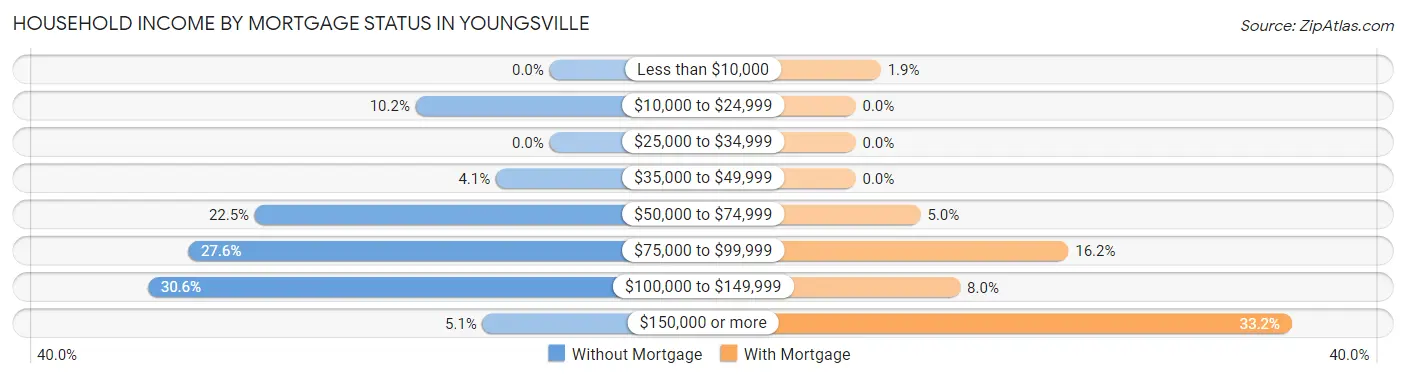
| Household Income | Without Mortgage | With Mortgage |
| Less than $10,000 | 0 (0.0%) | 7 (1.9%) |
| $10,000 to $24,999 | 10 (10.2%) | 0 (0.0%) |
| $25,000 to $34,999 | 0 (0.0%) | 0 (0.0%) |
| $35,000 to $49,999 | 4 (4.1%) | 0 (0.0%) |
| $50,000 to $74,999 | 22 (22.5%) | 18 (5.0%) |
| $75,000 to $99,999 | 27 (27.6%) | 59 (16.2%) |
| $100,000 to $149,999 | 30 (30.6%) | 29 (8.0%) |
| $150,000 or more | 5 (5.1%) | 121 (33.2%) |
| Total | 98 (100.0%) | 364 (100.0%) |
Property Value to Household Income Ratio in Youngsville
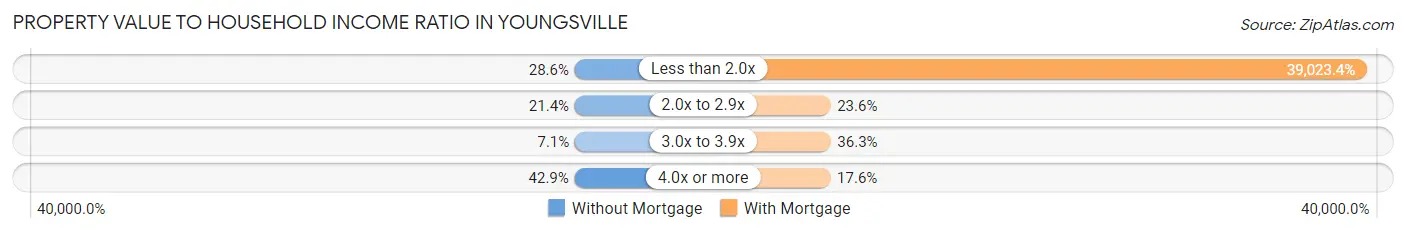
| Value-to-Income Ratio | Without Mortgage | With Mortgage |
| Less than 2.0x | 28 (28.6%) | 142,045 (39,023.3%) |
| 2.0x to 2.9x | 21 (21.4%) | 86 (23.6%) |
| 3.0x to 3.9x | 7 (7.1%) | 132 (36.3%) |
| 4.0x or more | 42 (42.9%) | 64 (17.6%) |
| Total | 98 (100.0%) | 364 (100.0%) |
Real Estate Taxes by Mortgage Status in Youngsville
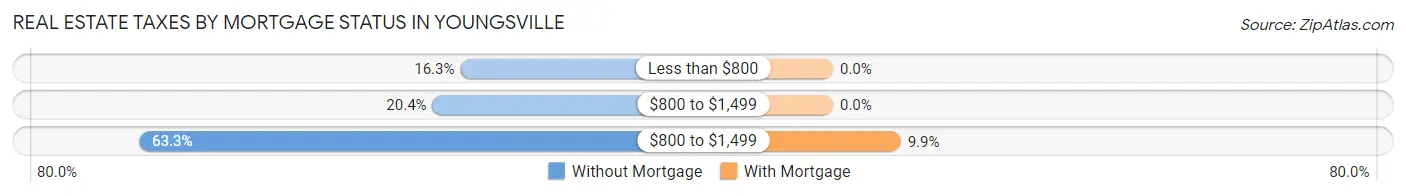
| Property Taxes | Without Mortgage | With Mortgage |
| Less than $800 | 16 (16.3%) | 0 (0.0%) |
| $800 to $1,499 | 20 (20.4%) | 0 (0.0%) |
| $800 to $1,499 | 62 (63.3%) | 36 (9.9%) |
| Total | 98 (100.0%) | 364 (100.0%) |
Health & Disability in Youngsville
Health Insurance Coverage by Age in Youngsville
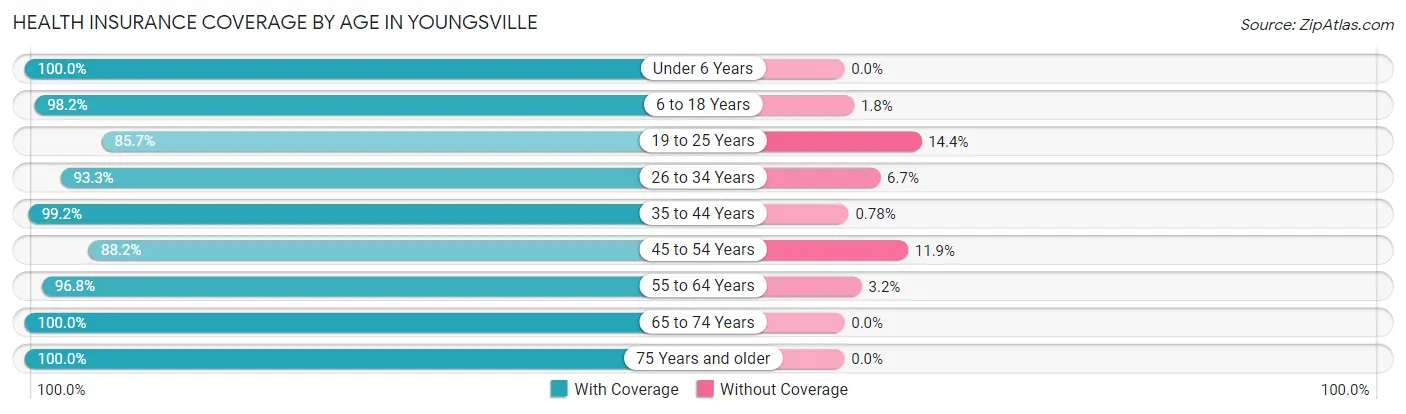
| Age Bracket | With Coverage | Without Coverage |
| Under 6 Years | 170 (100.0%) | 0 (0.0%) |
| 6 to 18 Years | 600 (98.2%) | 11 (1.8%) |
| 19 to 25 Years | 197 (85.7%) | 33 (14.3%) |
| 26 to 34 Years | 307 (93.3%) | 22 (6.7%) |
| 35 to 44 Years | 383 (99.2%) | 3 (0.8%) |
| 45 to 54 Years | 253 (88.1%) | 34 (11.8%) |
| 55 to 64 Years | 210 (96.8%) | 7 (3.2%) |
| 65 to 74 Years | 136 (100.0%) | 0 (0.0%) |
| 75 Years and older | 55 (100.0%) | 0 (0.0%) |
| Total | 2,311 (95.5%) | 110 (4.5%) |
Health Insurance Coverage by Citizenship Status in Youngsville
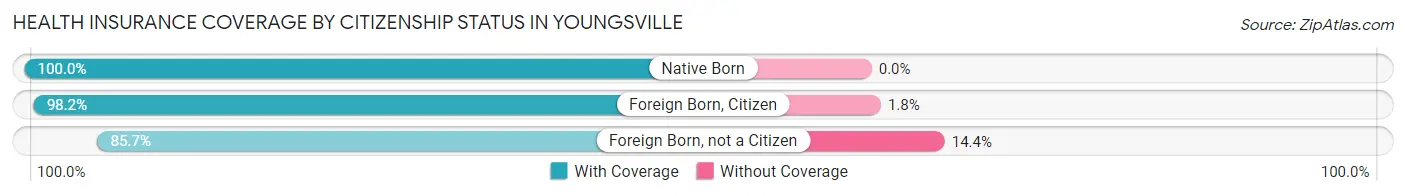
| Citizenship Status | With Coverage | Without Coverage |
| Native Born | 170 (100.0%) | 0 (0.0%) |
| Foreign Born, Citizen | 600 (98.2%) | 11 (1.8%) |
| Foreign Born, not a Citizen | 197 (85.7%) | 33 (14.3%) |
Health Insurance Coverage by Household Income in Youngsville
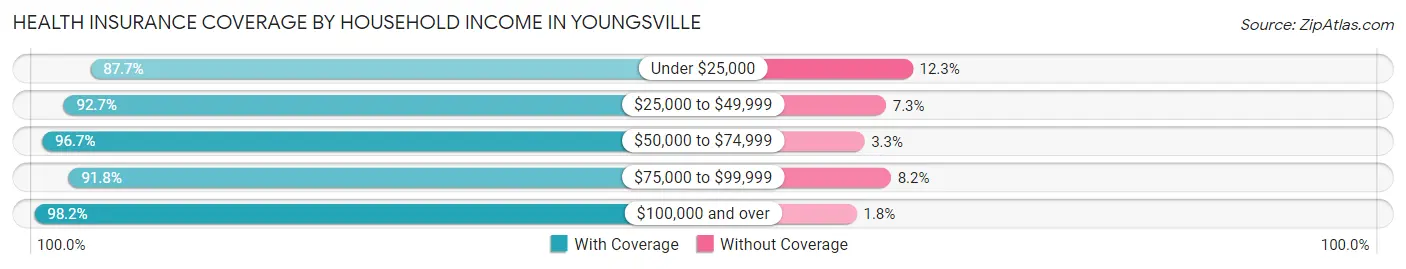
| Household Income | With Coverage | Without Coverage |
| Under $25,000 | 121 (87.7%) | 17 (12.3%) |
| $25,000 to $49,999 | 444 (92.7%) | 35 (7.3%) |
| $50,000 to $74,999 | 325 (96.7%) | 11 (3.3%) |
| $75,000 to $99,999 | 290 (91.8%) | 26 (8.2%) |
| $100,000 and over | 1,131 (98.2%) | 21 (1.8%) |
Public vs Private Health Insurance Coverage by Age in Youngsville
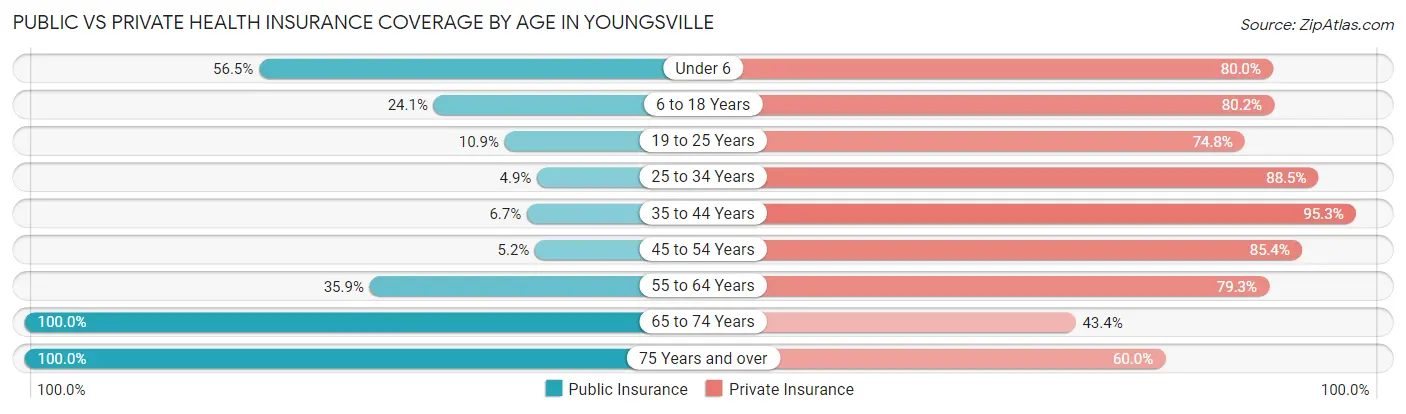
| Age Bracket | Public Insurance | Private Insurance |
| Under 6 | 96 (56.5%) | 136 (80.0%) |
| 6 to 18 Years | 147 (24.1%) | 490 (80.2%) |
| 19 to 25 Years | 25 (10.9%) | 172 (74.8%) |
| 25 to 34 Years | 16 (4.9%) | 291 (88.4%) |
| 35 to 44 Years | 26 (6.7%) | 368 (95.3%) |
| 45 to 54 Years | 15 (5.2%) | 245 (85.4%) |
| 55 to 64 Years | 78 (35.9%) | 172 (79.3%) |
| 65 to 74 Years | 136 (100.0%) | 59 (43.4%) |
| 75 Years and over | 55 (100.0%) | 33 (60.0%) |
| Total | 594 (24.5%) | 1,966 (81.2%) |
Disability Status by Sex by Age in Youngsville
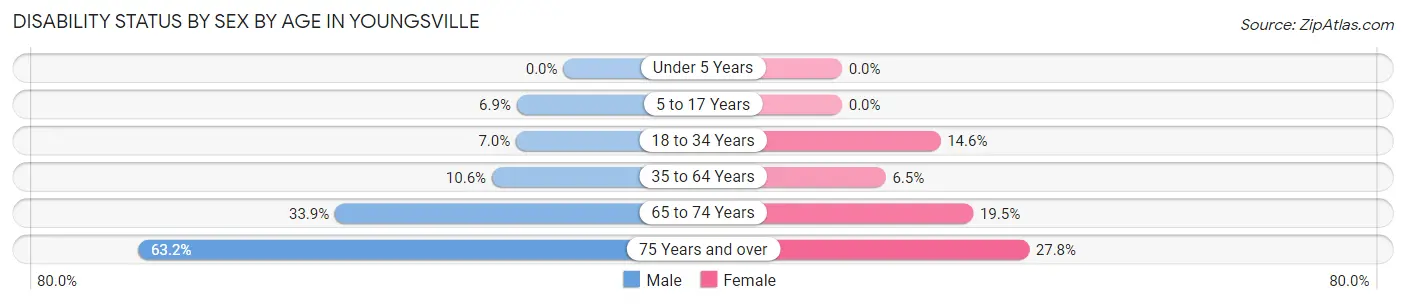
| Age Bracket | Male | Female |
| Under 5 Years | 0 (0.0%) | 0 (0.0%) |
| 5 to 17 Years | 24 (6.9%) | 0 (0.0%) |
| 18 to 34 Years | 21 (7.0%) | 44 (14.6%) |
| 35 to 64 Years | 42 (10.6%) | 32 (6.5%) |
| 65 to 74 Years | 20 (33.9%) | 15 (19.5%) |
| 75 Years and over | 12 (63.2%) | 10 (27.8%) |
Disability Class by Sex by Age in Youngsville
Disability Class: Hearing Difficulty
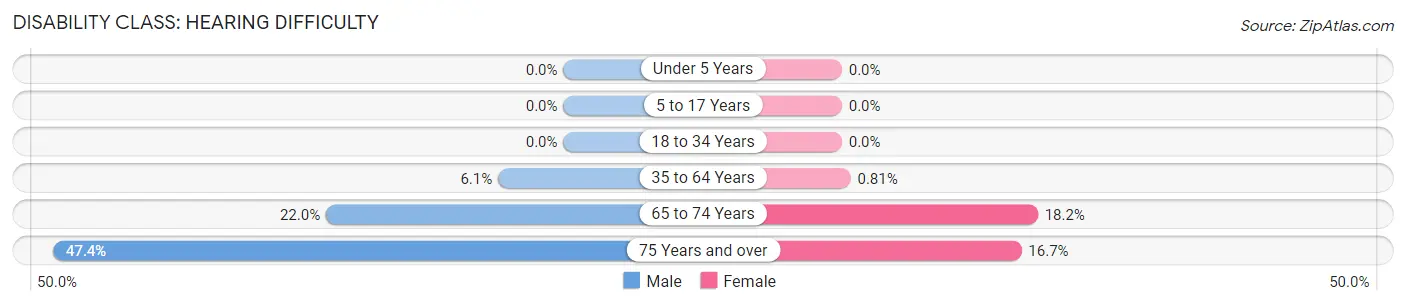
| Age Bracket | Male | Female |
| Under 5 Years | 0 (0.0%) | 0 (0.0%) |
| 5 to 17 Years | 0 (0.0%) | 0 (0.0%) |
| 18 to 34 Years | 0 (0.0%) | 0 (0.0%) |
| 35 to 64 Years | 24 (6.1%) | 4 (0.8%) |
| 65 to 74 Years | 13 (22.0%) | 14 (18.2%) |
| 75 Years and over | 9 (47.4%) | 6 (16.7%) |
Disability Class: Vision Difficulty
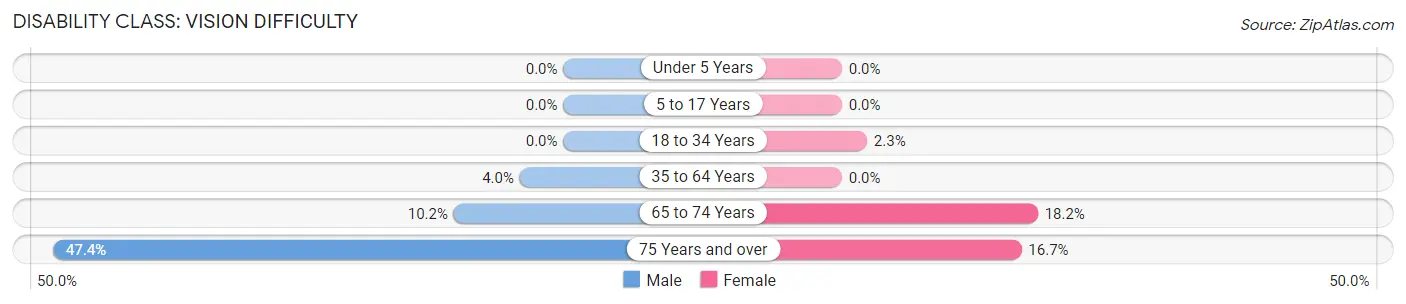
| Age Bracket | Male | Female |
| Under 5 Years | 0 (0.0%) | 0 (0.0%) |
| 5 to 17 Years | 0 (0.0%) | 0 (0.0%) |
| 18 to 34 Years | 0 (0.0%) | 7 (2.3%) |
| 35 to 64 Years | 16 (4.0%) | 0 (0.0%) |
| 65 to 74 Years | 6 (10.2%) | 14 (18.2%) |
| 75 Years and over | 9 (47.4%) | 6 (16.7%) |
Disability Class: Cognitive Difficulty
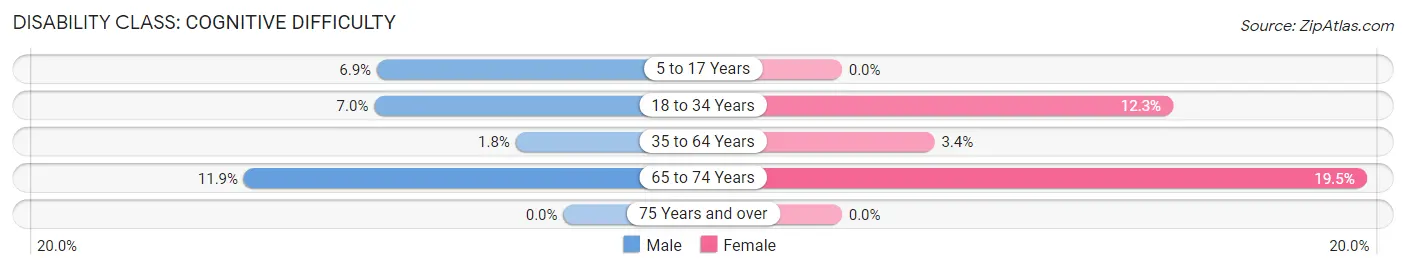
| Age Bracket | Male | Female |
| 5 to 17 Years | 24 (6.9%) | 0 (0.0%) |
| 18 to 34 Years | 21 (7.0%) | 37 (12.3%) |
| 35 to 64 Years | 7 (1.8%) | 17 (3.4%) |
| 65 to 74 Years | 7 (11.9%) | 15 (19.5%) |
| 75 Years and over | 0 (0.0%) | 0 (0.0%) |
Disability Class: Ambulatory Difficulty
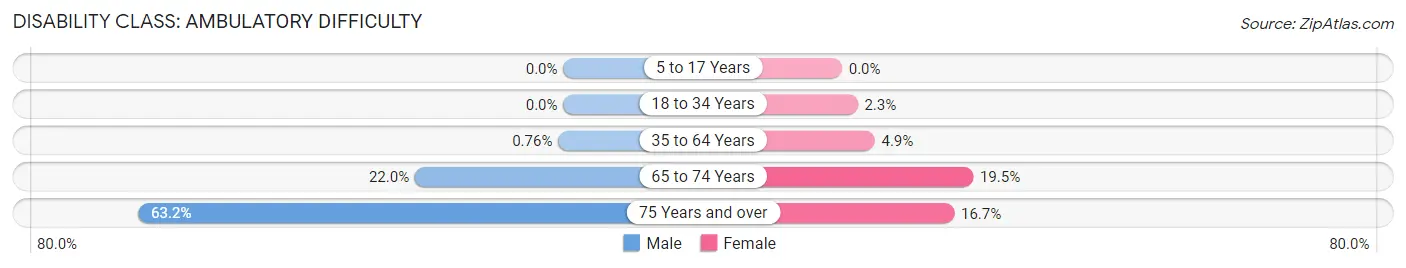
| Age Bracket | Male | Female |
| 5 to 17 Years | 0 (0.0%) | 0 (0.0%) |
| 18 to 34 Years | 0 (0.0%) | 7 (2.3%) |
| 35 to 64 Years | 3 (0.8%) | 24 (4.9%) |
| 65 to 74 Years | 13 (22.0%) | 15 (19.5%) |
| 75 Years and over | 12 (63.2%) | 6 (16.7%) |
Disability Class: Self-Care Difficulty
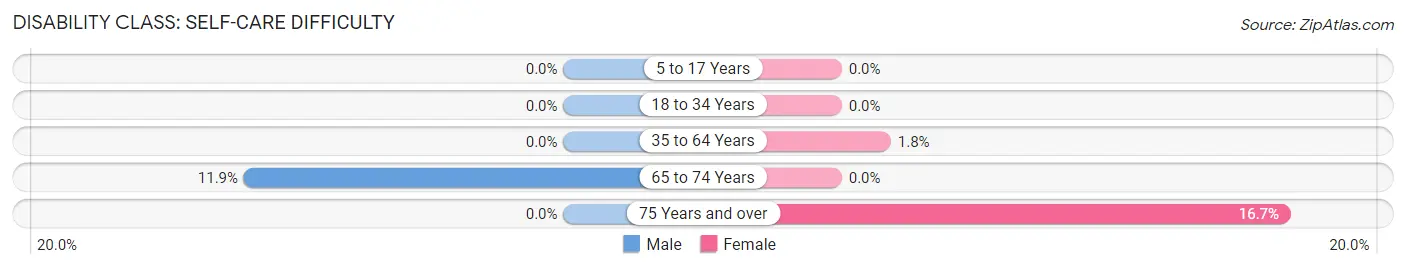
| Age Bracket | Male | Female |
| 5 to 17 Years | 0 (0.0%) | 0 (0.0%) |
| 18 to 34 Years | 0 (0.0%) | 0 (0.0%) |
| 35 to 64 Years | 0 (0.0%) | 9 (1.8%) |
| 65 to 74 Years | 7 (11.9%) | 0 (0.0%) |
| 75 Years and over | 0 (0.0%) | 6 (16.7%) |
Technology Access in Youngsville
Computing Device Access in Youngsville
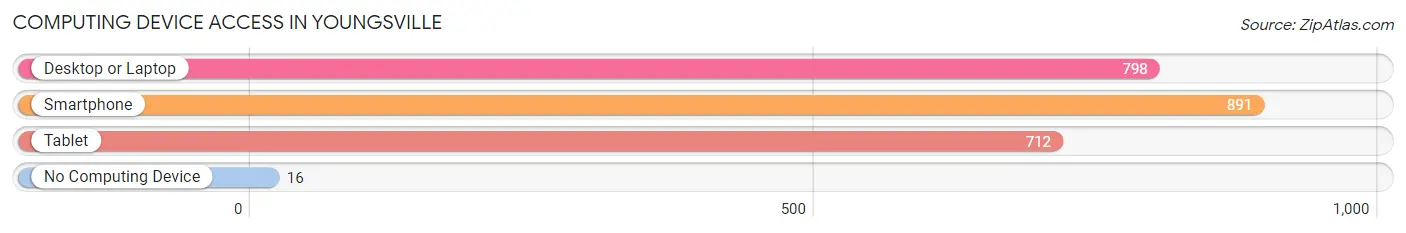
| Device Type | # Households | % Households |
| Desktop or Laptop | 798 | 84.9% |
| Smartphone | 891 | 94.8% |
| Tablet | 712 | 75.7% |
| No Computing Device | 16 | 1.7% |
| Total | 940 | 100.0% |
Internet Access in Youngsville
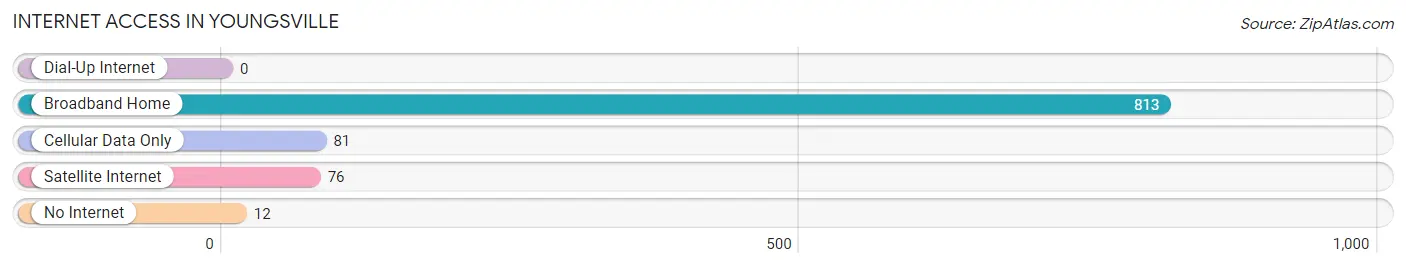
| Internet Type | # Households | % Households |
| Dial-Up Internet | 0 | 0.0% |
| Broadband Home | 813 | 86.5% |
| Cellular Data Only | 81 | 8.6% |
| Satellite Internet | 76 | 8.1% |
| No Internet | 12 | 1.3% |
| Total | 940 | 100.0% |
Youngsville Summary
Youngsville is a small town located in Franklin County, North Carolina. It is situated in the northeastern part of the state, about 30 miles northeast of Raleigh. The town has a population of approximately 2,000 people and is part of the Raleigh-Durham-Chapel Hill metropolitan area.
History
Youngsville was founded in 1790 by William Young, a Revolutionary War veteran. He purchased the land from the local Native Americans and established a small settlement. The town was originally known as Youngs Crossroads, as it was located at the intersection of two major roads. In 1820, the town was officially incorporated and renamed Youngsville.
The town grew slowly over the years, but it was not until the late 19th century that it began to experience significant growth. This was due to the arrival of the railroad, which connected Youngsville to the larger cities of Raleigh and Durham. The railroad also brought new industries to the area, such as lumber mills and textile factories.
In the early 20th century, Youngsville experienced a period of rapid growth. This was due to the arrival of the automobile, which allowed people to travel more easily and opened up new opportunities for businesses. The town also benefited from the construction of a new highway, which connected it to the larger cities of Raleigh and Durham.
Geography
Youngsville is located in the northeastern part of North Carolina, about 30 miles northeast of Raleigh. The town is situated in the Piedmont region of the state, which is characterized by rolling hills and forests. The town is located on the banks of the Neuse River, which flows through the area.
The climate in Youngsville is humid subtropical, with hot, humid summers and mild winters. The average annual temperature is around 60 degrees Fahrenheit, with an average high of around 80 degrees in the summer and an average low of around 40 degrees in the winter.
Economy
The economy of Youngsville is largely based on agriculture and manufacturing. The town is home to several large farms, which produce a variety of crops, including corn, soybeans, and tobacco. The town also has several manufacturing plants, which produce a variety of products, including furniture, textiles, and electronics.
The town also has a thriving tourism industry, as it is located close to several popular attractions, such as the North Carolina Zoo and the North Carolina Museum of Natural Sciences.
Demographics
As of the 2010 census, the population of Youngsville was 2,000 people. The racial makeup of the town was 94.2% White, 2.2% African American, 0.7% Native American, 0.7% Asian, 0.2% Pacific Islander, and 1.9% from other races. The median household income was $41,250, and the median family income was $50,000. The per capita income was $20,000.
Conclusion
Youngsville is a small town located in Franklin County, North Carolina. It has a population of approximately 2,000 people and is part of the Raleigh-Durham-Chapel Hill metropolitan area. The town was founded in 1790 and has a long history of agriculture and manufacturing. The town also has a thriving tourism industry, as it is located close to several popular attractions. The population of Youngsville is largely white, with a small percentage of African Americans, Native Americans, Asians, and Pacific Islanders. The median household income is $41,250, and the median family income is $50,000.
Common Questions
What is Per Capita Income in Youngsville?
Per Capita income in Youngsville is $36,249.
What is the Median Family Income in Youngsville?
Median Family Income in Youngsville is $86,146.
What is the Median Household income in Youngsville?
Median Household Income in Youngsville is $73,472.
What is Income or Wage Gap in Youngsville?
Income or Wage Gap in Youngsville is 17.1%.
Women in Youngsville earn 82.9 cents for every dollar earned by a man.
What is Inequality or Gini Index in Youngsville?
Inequality or Gini Index in Youngsville is 0.39.
What is the Total Population of Youngsville?
Total Population of Youngsville is 2,421.
What is the Total Male Population of Youngsville?
Total Male Population of Youngsville is 1,234.
What is the Total Female Population of Youngsville?
Total Female Population of Youngsville is 1,187.
What is the Ratio of Males per 100 Females in Youngsville?
There are 103.96 Males per 100 Females in Youngsville.
What is the Ratio of Females per 100 Males in Youngsville?
There are 96.19 Females per 100 Males in Youngsville.
What is the Median Population Age in Youngsville?
Median Population Age in Youngsville is 30.3 Years.
What is the Average Family Size in Youngsville
Average Family Size in Youngsville is 3.1 People.
What is the Average Household Size in Youngsville
Average Household Size in Youngsville is 2.6 People.
How Large is the Labor Force in Youngsville?
There are 1,439 People in the Labor Forcein in Youngsville.
What is the Percentage of People in the Labor Force in Youngsville?
80.0% of People are in the Labor Force in Youngsville.
What is the Unemployment Rate in Youngsville?
Unemployment Rate in Youngsville is 3.6%.