Brightwood, VA Map & Demographics
Brightwood Map
Brightwood Overview
$31,180
PER CAPITA INCOME
$85,404
AVG FAMILY INCOME
$85,735
AVG HOUSEHOLD INCOME
18.3%
WAGE / INCOME GAP [ % ]
81.7¢/ $1
WAGE / INCOME GAP [ $ ]
0.29
INEQUALITY / GINI INDEX
1,775
TOTAL POPULATION
855
MALE POPULATION
920
FEMALE POPULATION
92.93
MALES / 100 FEMALES
107.60
FEMALES / 100 MALES
36.9
MEDIAN AGE
3.7
AVG FAMILY SIZE
3.0
AVG HOUSEHOLD SIZE
983
LABOR FORCE [ PEOPLE ]
71.9%
PERCENT IN LABOR FORCE
3.0%
UNEMPLOYMENT RATE
Brightwood Zip Codes
Brightwood Area Codes
Income in Brightwood
Income Overview in Brightwood
Per Capita Income in Brightwood is $31,180, while median incomes of families and households are $85,404 and $85,735 respectively.
| Characteristic | Number | Measure |
| Per Capita Income | 1,775 | $31,180 |
| Median Family Income | 411 | $85,404 |
| Mean Family Income | 411 | $88,723 |
| Median Household Income | 582 | $85,735 |
| Mean Household Income | 582 | $88,122 |
| Income Deficit | 411 | $0 |
| Wage / Income Gap (%) | 1,775 | 18.34% |
| Wage / Income Gap ($) | 1,775 | 81.66¢ per $1 |
| Gini / Inequality Index | 1,775 | 0.29 |
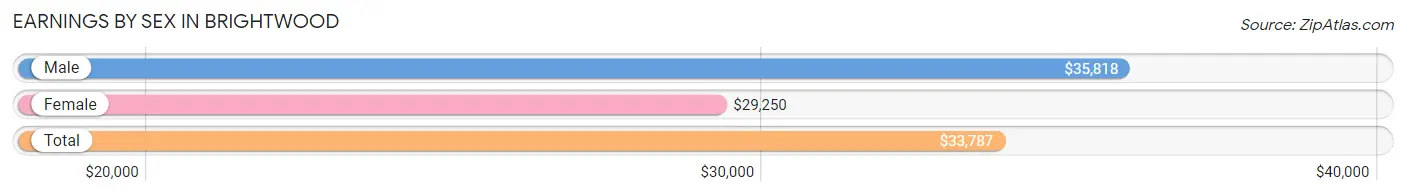
Earnings by Sex in Brightwood
Average Earnings in Brightwood are $33,787, $35,818 for men and $29,250 for women, a difference of 18.3%.
| Sex | Number | Average Earnings |
| Male | 548 (51.7%) | $35,818 |
| Female | 512 (48.3%) | $29,250 |
| Total | 1,060 (100.0%) | $33,787 |
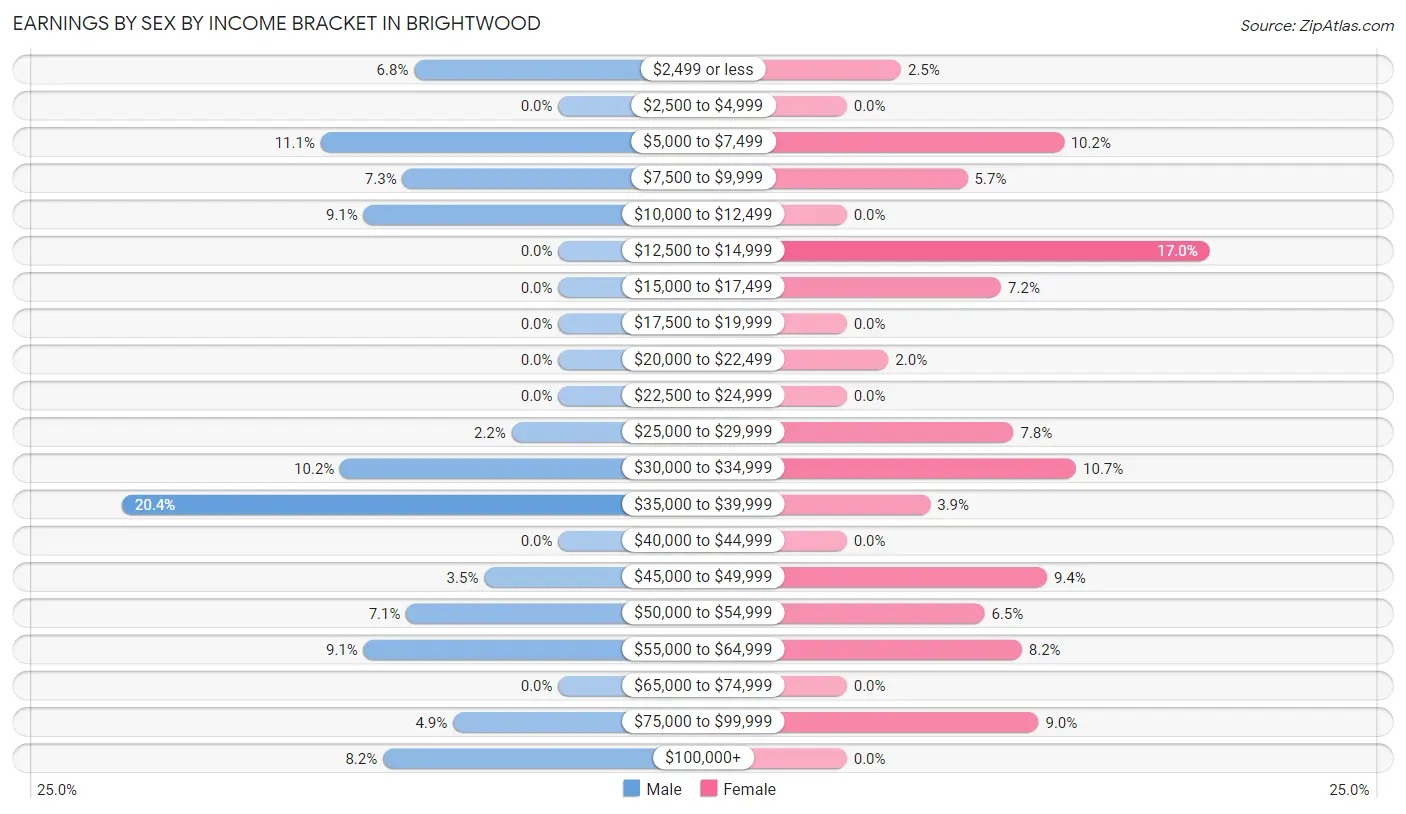
Earnings by Sex by Income Bracket in Brightwood
The most common earnings brackets in Brightwood are $35,000 to $39,999 for men (112 | 20.4%) and $12,500 to $14,999 for women (87 | 17.0%).
| Income | Male | Female |
| $2,499 or less | 37 (6.8%) | 13 (2.5%) |
| $2,500 to $4,999 | 0 (0.0%) | 0 (0.0%) |
| $5,000 to $7,499 | 61 (11.1%) | 52 (10.2%) |
| $7,500 to $9,999 | 40 (7.3%) | 29 (5.7%) |
| $10,000 to $12,499 | 50 (9.1%) | 0 (0.0%) |
| $12,500 to $14,999 | 0 (0.0%) | 87 (17.0%) |
| $15,000 to $17,499 | 0 (0.0%) | 37 (7.2%) |
| $17,500 to $19,999 | 0 (0.0%) | 0 (0.0%) |
| $20,000 to $22,499 | 0 (0.0%) | 10 (1.9%) |
| $22,500 to $24,999 | 0 (0.0%) | 0 (0.0%) |
| $25,000 to $29,999 | 12 (2.2%) | 40 (7.8%) |
| $30,000 to $34,999 | 56 (10.2%) | 55 (10.7%) |
| $35,000 to $39,999 | 112 (20.4%) | 20 (3.9%) |
| $40,000 to $44,999 | 0 (0.0%) | 0 (0.0%) |
| $45,000 to $49,999 | 19 (3.5%) | 48 (9.4%) |
| $50,000 to $54,999 | 39 (7.1%) | 33 (6.5%) |
| $55,000 to $64,999 | 50 (9.1%) | 42 (8.2%) |
| $65,000 to $74,999 | 0 (0.0%) | 0 (0.0%) |
| $75,000 to $99,999 | 27 (4.9%) | 46 (9.0%) |
| $100,000+ | 45 (8.2%) | 0 (0.0%) |
| Total | 548 (100.0%) | 512 (100.0%) |
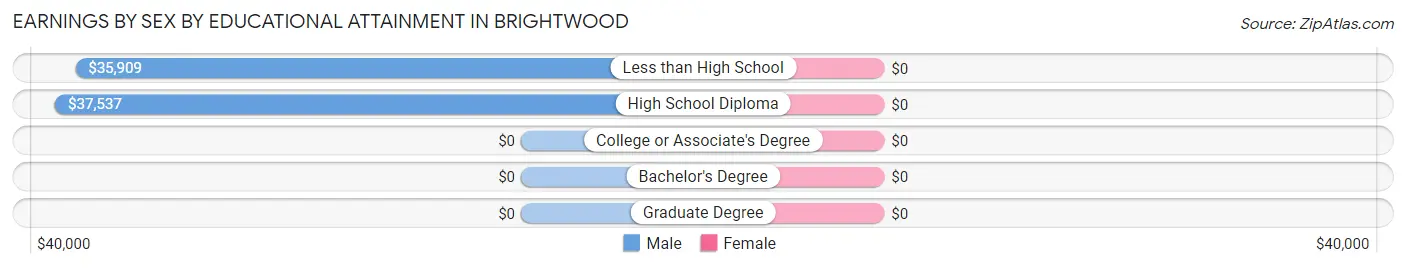
Earnings by Sex by Educational Attainment in Brightwood
| Educational Attainment | Male Income | Female Income |
| Less than High School | $35,909 | $0 |
| High School Diploma | $37,537 | $0 |
| College or Associate's Degree | - | - |
| Bachelor's Degree | - | - |
| Graduate Degree | - | - |
| Total | $35,818 | $33,977 |
Family Income in Brightwood
Family Income Brackets in Brightwood
According to the Brightwood family income data, there are 113 families falling into the $75,000 to $99,999 income range, which is the most common income bracket and makes up 27.5% of all families.
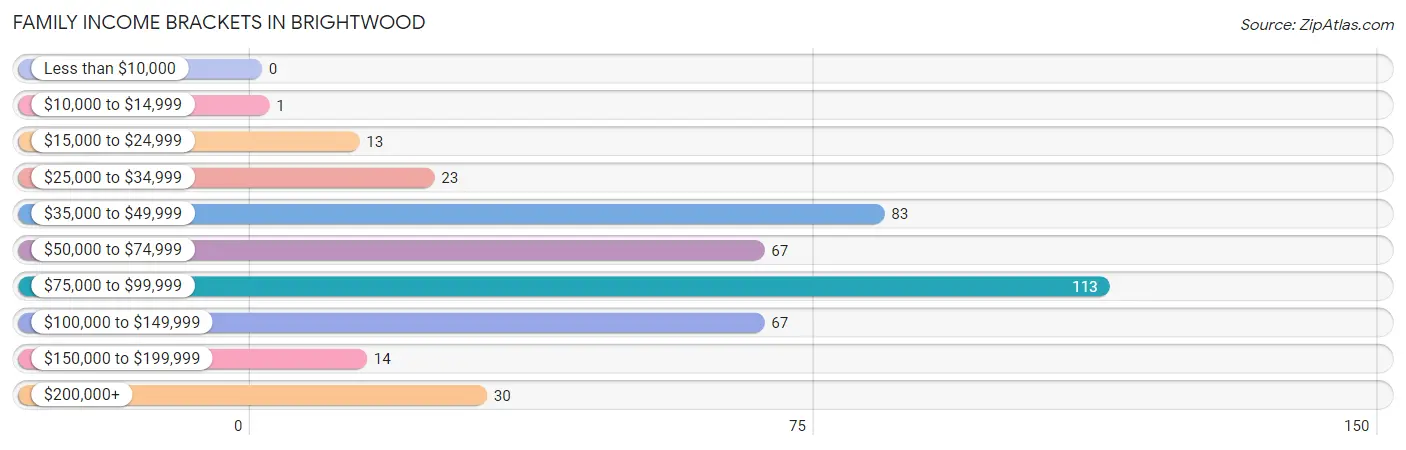
| Income Bracket | # Families | % Families |
| Less than $10,000 | 0 | 0.0% |
| $10,000 to $14,999 | 1 | 0.2% |
| $15,000 to $24,999 | 13 | 3.2% |
| $25,000 to $34,999 | 23 | 5.6% |
| $35,000 to $49,999 | 83 | 20.2% |
| $50,000 to $74,999 | 67 | 16.3% |
| $75,000 to $99,999 | 113 | 27.5% |
| $100,000 to $149,999 | 67 | 16.3% |
| $150,000 to $199,999 | 14 | 3.4% |
| $200,000+ | 30 | 7.3% |
Family Income by Famaliy Size in Brightwood
3-person families (18 | 4.4%) account for the highest median family income in Brightwood with $153,750 per family, while 3-person families (18 | 4.4%) have the highest median income of $51,250 per family member.
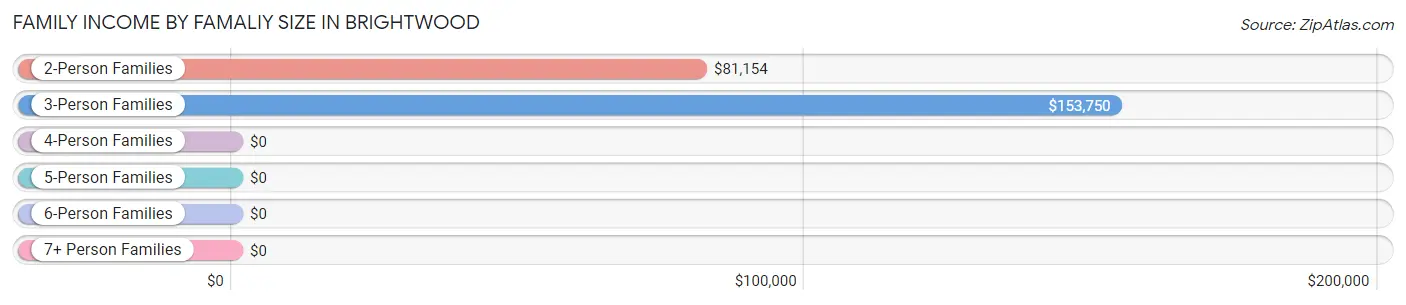
| Income Bracket | # Families | Median Income |
| 2-Person Families | 194 (47.2%) | $81,154 |
| 3-Person Families | 18 (4.4%) | $153,750 |
| 4-Person Families | 34 (8.3%) | $0 |
| 5-Person Families | 80 (19.5%) | $0 |
| 6-Person Families | 62 (15.1%) | $0 |
| 7+ Person Families | 23 (5.6%) | $0 |
| Total | 411 (100.0%) | $85,404 |
Family Income by Number of Earners in Brightwood
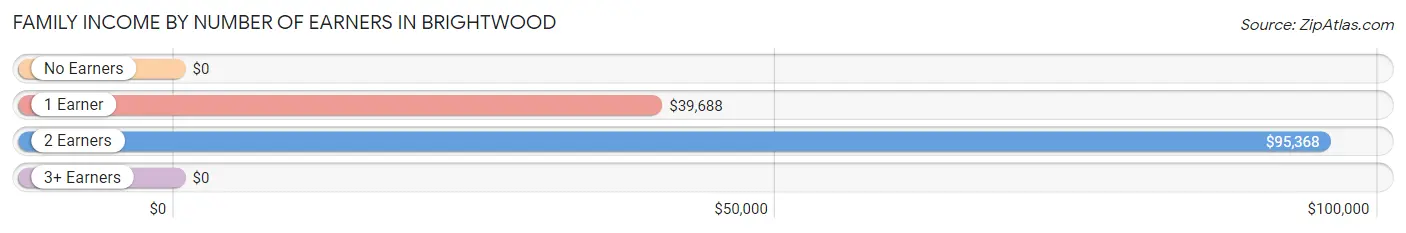
| Number of Earners | # Families | Median Income |
| No Earners | 70 (17.0%) | $0 |
| 1 Earner | 68 (16.6%) | $39,688 |
| 2 Earners | 188 (45.7%) | $95,368 |
| 3+ Earners | 85 (20.7%) | $0 |
| Total | 411 (100.0%) | $85,404 |
Household Income in Brightwood
Household Income Brackets in Brightwood
With 157 households falling in the category, the $100,000 to $149,999 income range is the most frequent in Brightwood, accounting for 27.0% of all households.
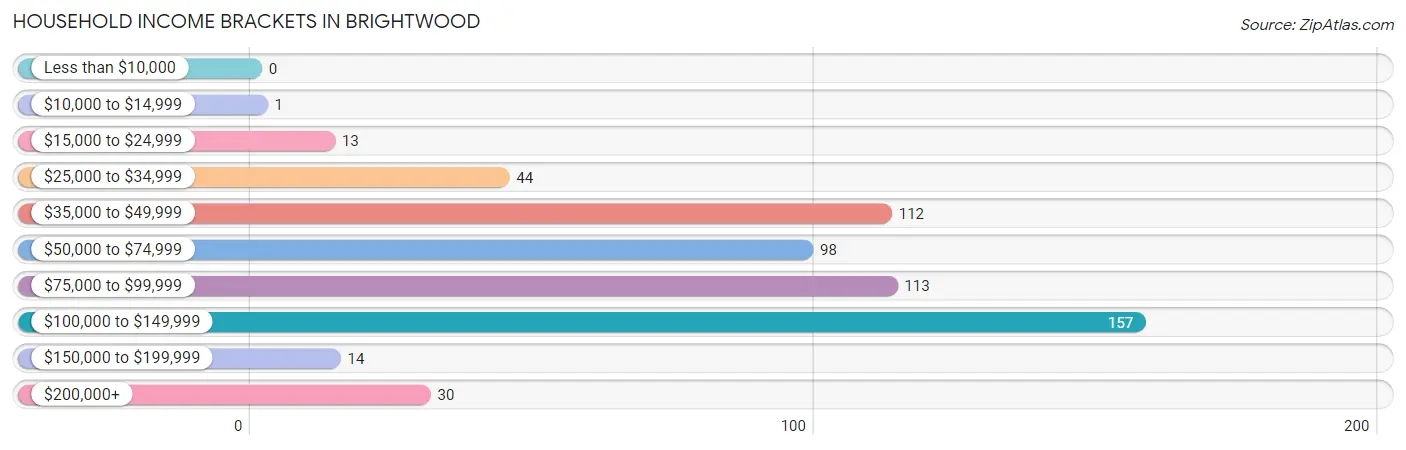
| Income Bracket | # Households | % Households |
| Less than $10,000 | 0 | 0.0% |
| $10,000 to $14,999 | 1 | 0.2% |
| $15,000 to $24,999 | 13 | 2.2% |
| $25,000 to $34,999 | 44 | 7.6% |
| $35,000 to $49,999 | 112 | 19.2% |
| $50,000 to $74,999 | 98 | 16.8% |
| $75,000 to $99,999 | 113 | 19.4% |
| $100,000 to $149,999 | 157 | 27.0% |
| $150,000 to $199,999 | 14 | 2.4% |
| $200,000+ | 30 | 5.2% |
Household Income by Householder Age in Brightwood
The median household income in Brightwood is $85,735, with the highest median household income of $113,000 found in the 65+ years age bracket for the primary householder. A total of 240 households (41.2%) fall into this category.
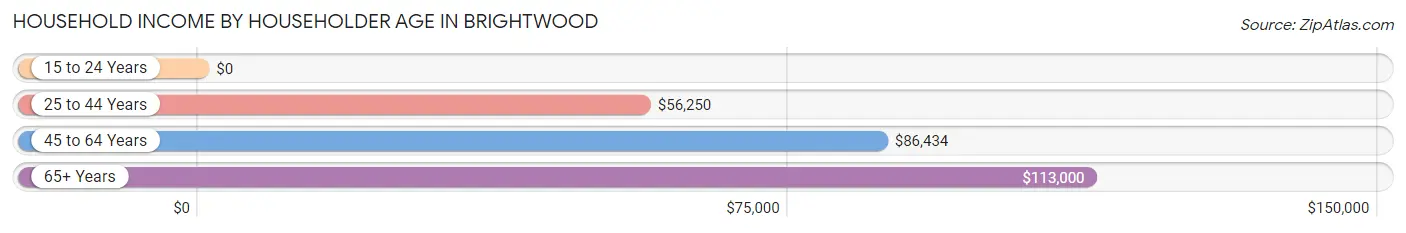
| Income Bracket | # Households | Median Income |
| 15 to 24 Years | 0 (0.0%) | $0 |
| 25 to 44 Years | 147 (25.3%) | $56,250 |
| 45 to 64 Years | 195 (33.5%) | $86,434 |
| 65+ Years | 240 (41.2%) | $113,000 |
| Total | 582 (100.0%) | $85,735 |
Poverty in Brightwood
Income Below Poverty by Sex and Age in Brightwood
With 1.9% poverty level for males and 3.7% for females among the residents of Brightwood, 25 to 34 year old males and 45 to 54 year old females are the most vulnerable to poverty, with 16 males (9.0%) and 29 females (32.2%) in their respective age groups living below the poverty level.
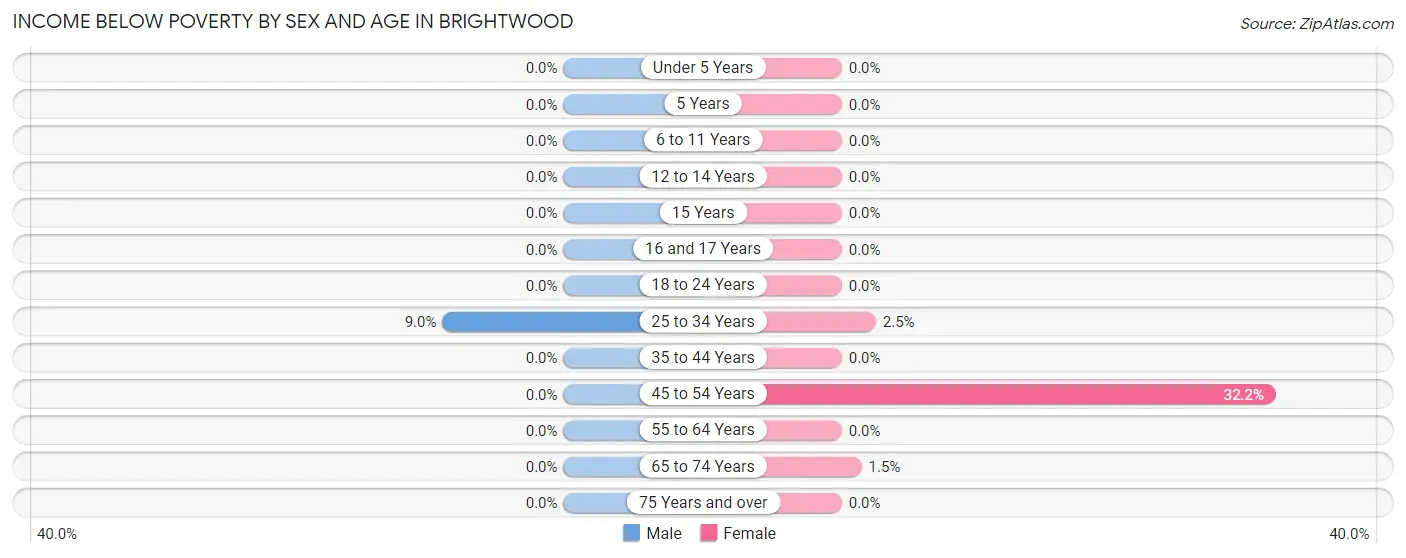
| Age Bracket | Male | Female |
| Under 5 Years | 0 (0.0%) | 0 (0.0%) |
| 5 Years | 0 (0.0%) | 0 (0.0%) |
| 6 to 11 Years | 0 (0.0%) | 0 (0.0%) |
| 12 to 14 Years | 0 (0.0%) | 0 (0.0%) |
| 15 Years | 0 (0.0%) | 0 (0.0%) |
| 16 and 17 Years | 0 (0.0%) | 0 (0.0%) |
| 18 to 24 Years | 0 (0.0%) | 0 (0.0%) |
| 25 to 34 Years | 16 (9.0%) | 4 (2.5%) |
| 35 to 44 Years | 0 (0.0%) | 0 (0.0%) |
| 45 to 54 Years | 0 (0.0%) | 29 (32.2%) |
| 55 to 64 Years | 0 (0.0%) | 0 (0.0%) |
| 65 to 74 Years | 0 (0.0%) | 1 (1.5%) |
| 75 Years and over | 0 (0.0%) | 0 (0.0%) |
| Total | 16 (1.9%) | 34 (3.7%) |
Income Above Poverty by Sex and Age in Brightwood
According to the poverty statistics in Brightwood, males aged under 5 years and females aged under 5 years are the age groups that are most secure financially, with 100.0% of males and 100.0% of females in these age groups living above the poverty line.
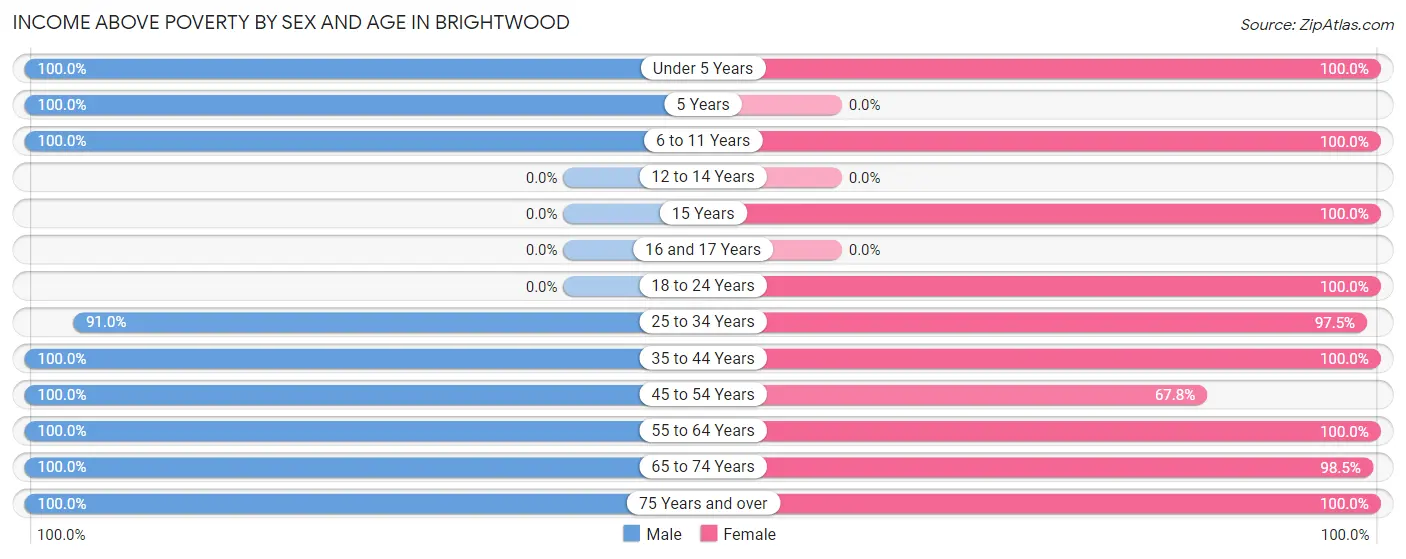
| Age Bracket | Male | Female |
| Under 5 Years | 94 (100.0%) | 84 (100.0%) |
| 5 Years | 51 (100.0%) | 0 (0.0%) |
| 6 to 11 Years | 51 (100.0%) | 102 (100.0%) |
| 12 to 14 Years | 0 (0.0%) | 0 (0.0%) |
| 15 Years | 0 (0.0%) | 26 (100.0%) |
| 16 and 17 Years | 0 (0.0%) | 0 (0.0%) |
| 18 to 24 Years | 0 (0.0%) | 114 (100.0%) |
| 25 to 34 Years | 162 (91.0%) | 154 (97.5%) |
| 35 to 44 Years | 133 (100.0%) | 73 (100.0%) |
| 45 to 54 Years | 81 (100.0%) | 61 (67.8%) |
| 55 to 64 Years | 105 (100.0%) | 109 (100.0%) |
| 65 to 74 Years | 62 (100.0%) | 67 (98.5%) |
| 75 Years and over | 100 (100.0%) | 96 (100.0%) |
| Total | 839 (98.1%) | 886 (96.3%) |
Income Below Poverty Among Married-Couple Families in Brightwood
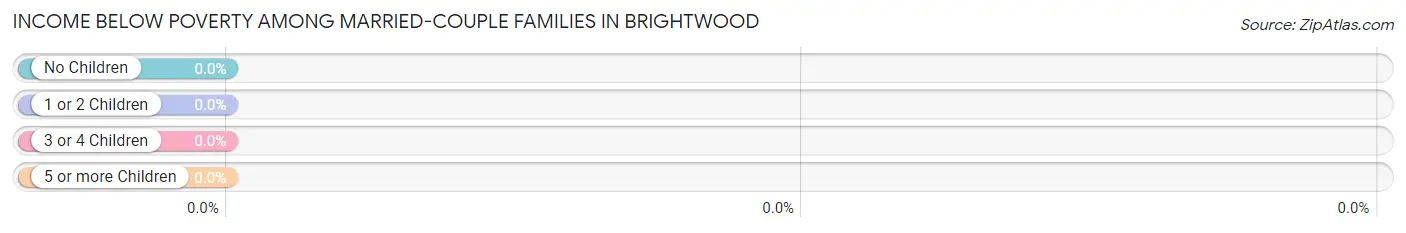
| Children | Above Poverty | Below Poverty |
| No Children | 142 (100.0%) | 0 (0.0%) |
| 1 or 2 Children | 34 (100.0%) | 0 (0.0%) |
| 3 or 4 Children | 115 (100.0%) | 0 (0.0%) |
| 5 or more Children | 0 (0.0%) | 0 (0.0%) |
| Total | 291 (100.0%) | 0 (0.0%) |
Income Below Poverty Among Single-Parent Households in Brightwood
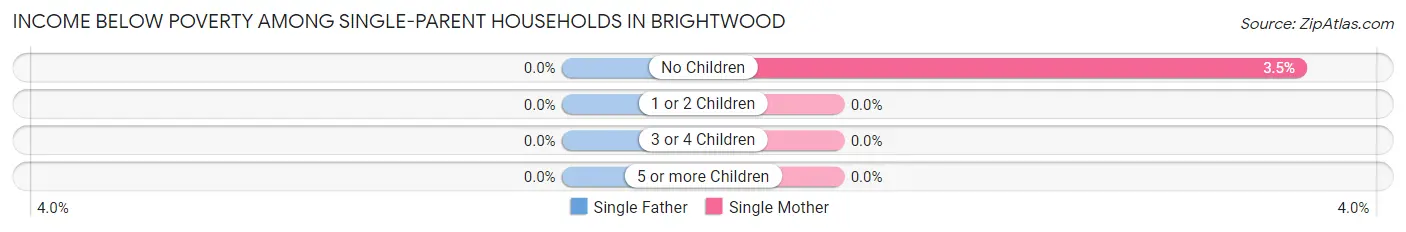
| Children | Single Father | Single Mother |
| No Children | 0 (0.0%) | 1 (3.5%) |
| 1 or 2 Children | 0 (0.0%) | 0 (0.0%) |
| 3 or 4 Children | 0 (0.0%) | 0 (0.0%) |
| 5 or more Children | 0 (0.0%) | 0 (0.0%) |
| Total | 0 (0.0%) | 1 (1.3%) |
Income Below Poverty Among Married-Couple vs Single-Parent Households in Brightwood
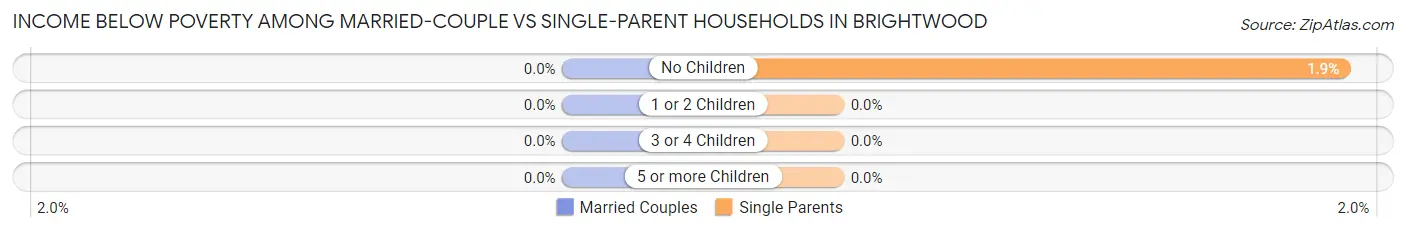
| Children | Married-Couple Families | Single-Parent Households |
| No Children | 0 (0.0%) | 1 (1.9%) |
| 1 or 2 Children | 0 (0.0%) | 0 (0.0%) |
| 3 or 4 Children | 0 (0.0%) | 0 (0.0%) |
| 5 or more Children | 0 (0.0%) | 0 (0.0%) |
| Total | 0 (0.0%) | 1 (0.8%) |
Race in Brightwood
The most populous races in Brightwood are White / Caucasian (1,650 | 93.0%), Two or more Races (114 | 6.4%), and Hispanic or Latino (38 | 2.1%).
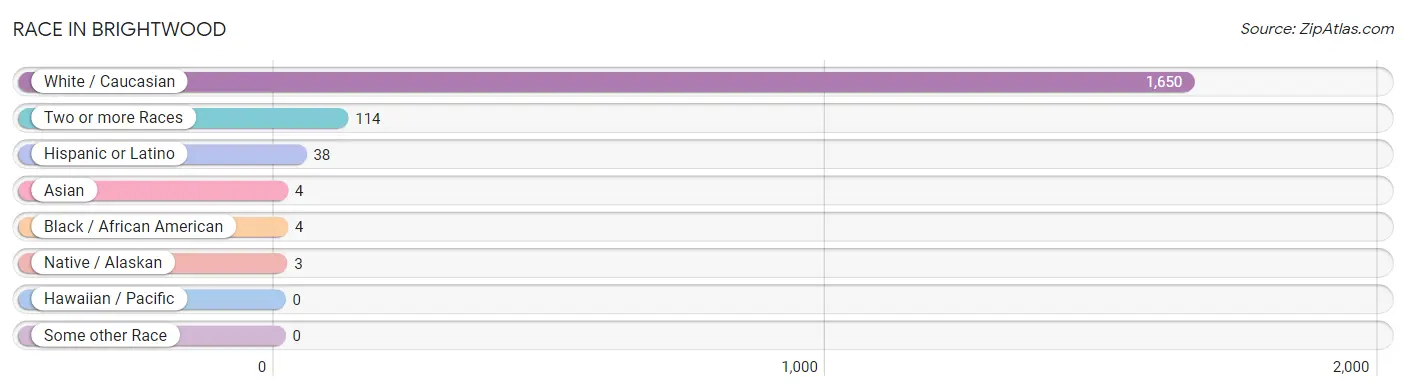
| Race | # Population | % Population |
| Asian | 4 | 0.2% |
| Black / African American | 4 | 0.2% |
| Hawaiian / Pacific | 0 | 0.0% |
| Hispanic or Latino | 38 | 2.1% |
| Native / Alaskan | 3 | 0.2% |
| White / Caucasian | 1,650 | 93.0% |
| Two or more Races | 114 | 6.4% |
| Some other Race | 0 | 0.0% |
| Total | 1,775 | 100.0% |
Ancestry in Brightwood
The most populous ancestries reported in Brightwood are German (525 | 29.6%), English (316 | 17.8%), Irish (303 | 17.1%), American (86 | 4.9%), and Czech (58 | 3.3%), together accounting for 72.6% of all Brightwood residents.
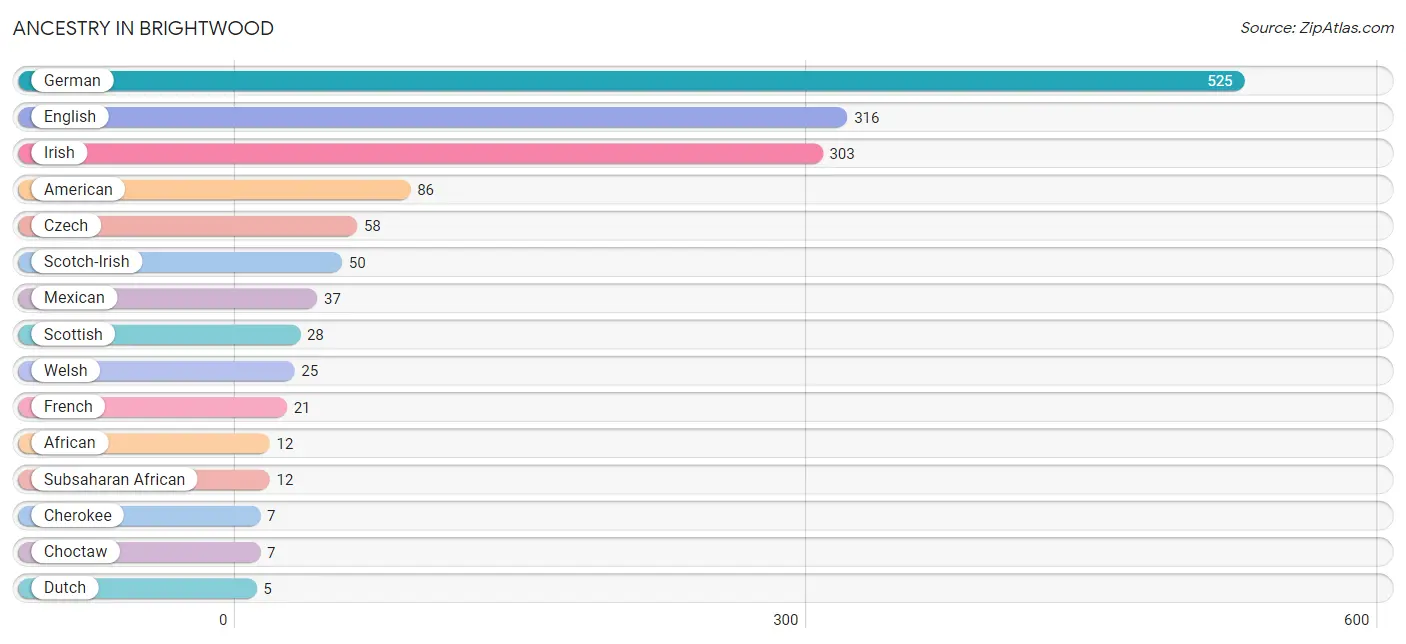
| Ancestry | # Population | % Population |
| African | 12 | 0.7% |
| American | 86 | 4.9% |
| Cherokee | 7 | 0.4% |
| Choctaw | 7 | 0.4% |
| Cuban | 1 | 0.1% |
| Czech | 58 | 3.3% |
| Dutch | 5 | 0.3% |
| English | 316 | 17.8% |
| French | 21 | 1.2% |
| German | 525 | 29.6% |
| Hungarian | 4 | 0.2% |
| Irish | 303 | 17.1% |
| Korean | 4 | 0.2% |
| Mexican | 37 | 2.1% |
| Scotch-Irish | 50 | 2.8% |
| Scottish | 28 | 1.6% |
| Subsaharan African | 12 | 0.7% |
| Thai | 4 | 0.2% |
| Welsh | 25 | 1.4% | View All 19 Rows |
Immigrants in Brightwood
The most numerous immigrant groups reported in Brightwood came from Asia (4 | 0.2%), Philippines (4 | 0.2%), and South Eastern Asia (4 | 0.2%), together accounting for 0.7% of all Brightwood residents.
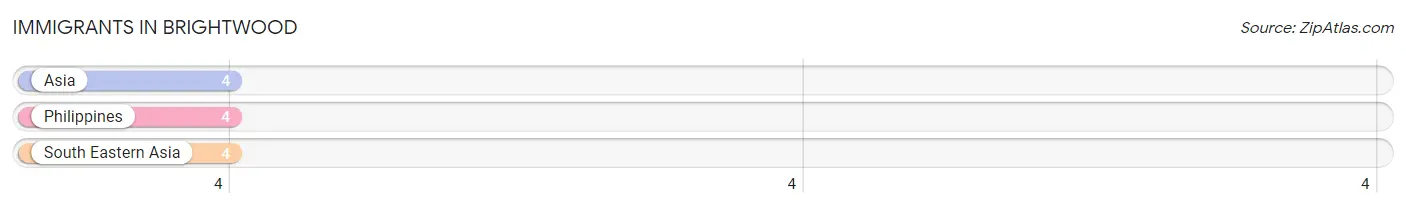
| Immigration Origin | # Population | % Population |
| Asia | 4 | 0.2% |
| Philippines | 4 | 0.2% |
| South Eastern Asia | 4 | 0.2% | View All 3 Rows |
Sex and Age in Brightwood
Sex and Age in Brightwood
The most populous age groups in Brightwood are 30 to 34 Years (162 | 19.0%) for men and 30 to 34 Years (121 | 13.2%) for women.
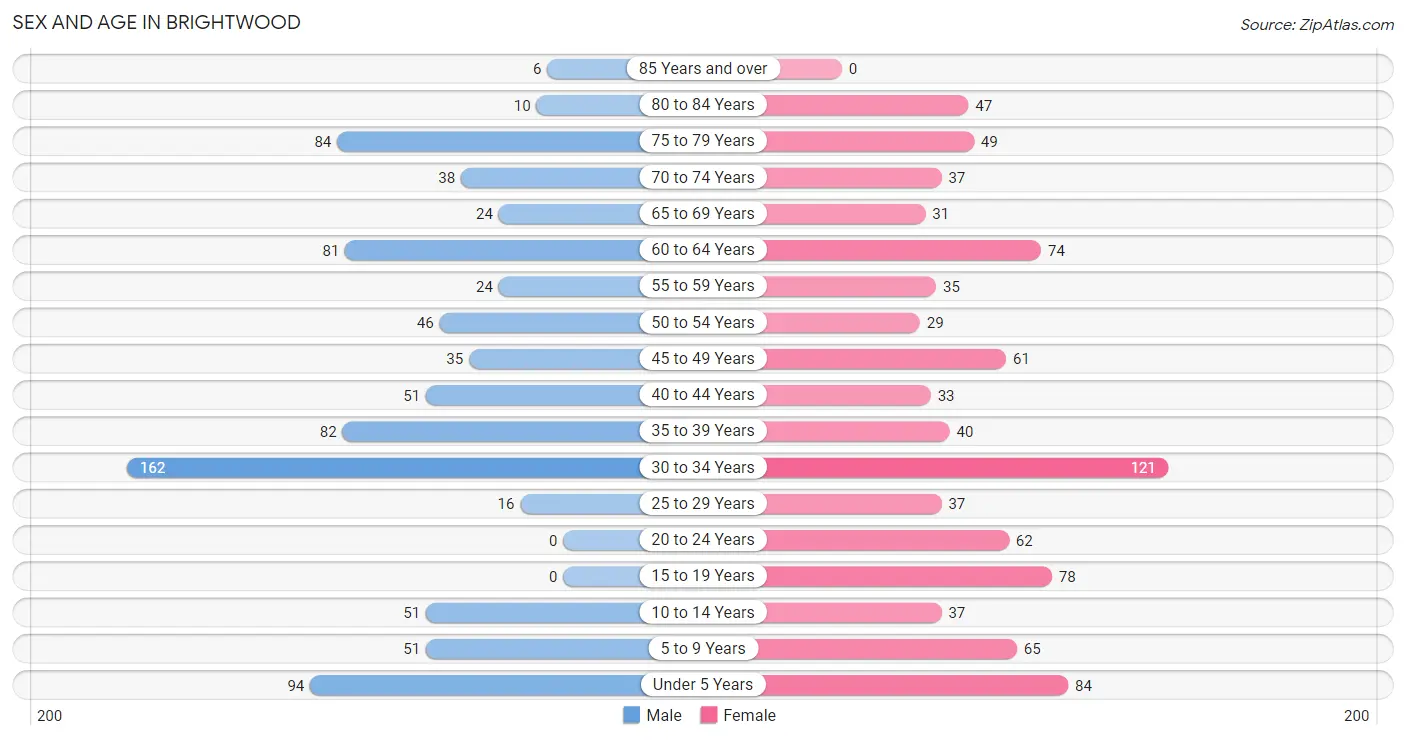
| Age Bracket | Male | Female |
| Under 5 Years | 94 (11.0%) | 84 (9.1%) |
| 5 to 9 Years | 51 (6.0%) | 65 (7.1%) |
| 10 to 14 Years | 51 (6.0%) | 37 (4.0%) |
| 15 to 19 Years | 0 (0.0%) | 78 (8.5%) |
| 20 to 24 Years | 0 (0.0%) | 62 (6.7%) |
| 25 to 29 Years | 16 (1.9%) | 37 (4.0%) |
| 30 to 34 Years | 162 (19.0%) | 121 (13.2%) |
| 35 to 39 Years | 82 (9.6%) | 40 (4.3%) |
| 40 to 44 Years | 51 (6.0%) | 33 (3.6%) |
| 45 to 49 Years | 35 (4.1%) | 61 (6.6%) |
| 50 to 54 Years | 46 (5.4%) | 29 (3.2%) |
| 55 to 59 Years | 24 (2.8%) | 35 (3.8%) |
| 60 to 64 Years | 81 (9.5%) | 74 (8.0%) |
| 65 to 69 Years | 24 (2.8%) | 31 (3.4%) |
| 70 to 74 Years | 38 (4.4%) | 37 (4.0%) |
| 75 to 79 Years | 84 (9.8%) | 49 (5.3%) |
| 80 to 84 Years | 10 (1.2%) | 47 (5.1%) |
| 85 Years and over | 6 (0.7%) | 0 (0.0%) |
| Total | 855 (100.0%) | 920 (100.0%) |
Families and Households in Brightwood
Median Family Size in Brightwood
The median family size in Brightwood is 3.67 persons per family, with single female/mother families (79 | 19.2%) accounting for the largest median family size of 4.72 persons per family. On the other hand, single male/father families (41 | 10.0%) represent the smallest median family size with 2.49 persons per family.
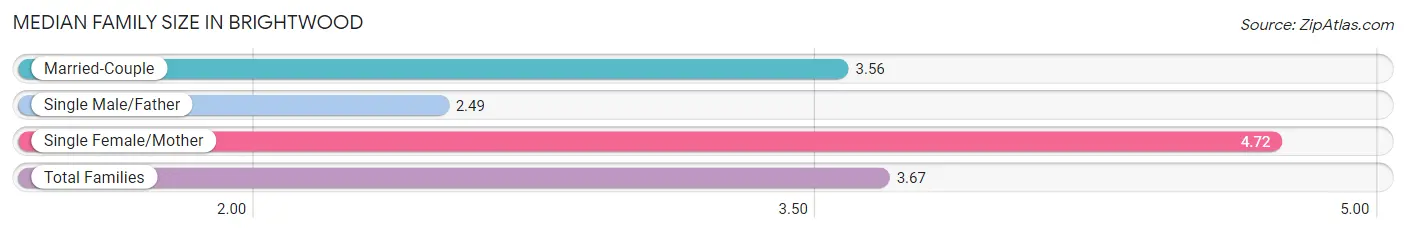
| Family Type | # Families | Family Size |
| Married-Couple | 291 (70.8%) | 3.56 |
| Single Male/Father | 41 (10.0%) | 2.49 |
| Single Female/Mother | 79 (19.2%) | 4.72 |
| Total Families | 411 (100.0%) | 3.67 |
Median Household Size in Brightwood
The median household size in Brightwood is 3.05 persons per household, with single female/mother households (79 | 13.6%) accounting for the largest median household size of 4.72 persons per household. non-family households (171 | 29.4%) represent the smallest median household size with 1.55 persons per household.
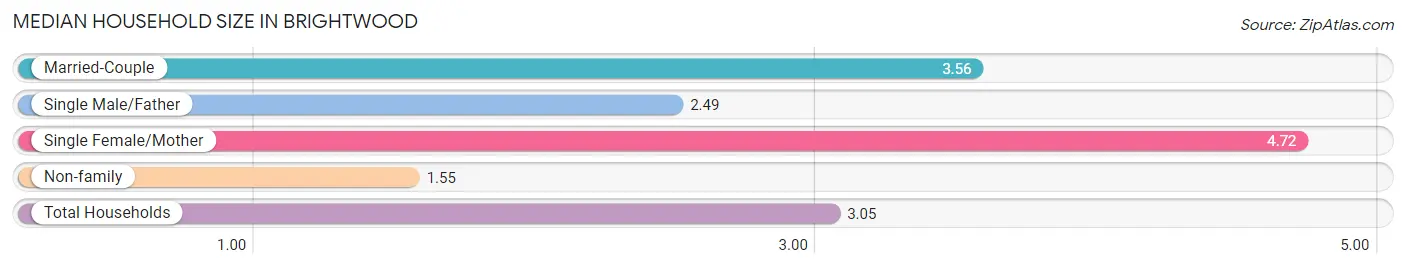
| Household Type | # Households | Household Size |
| Married-Couple | 291 (50.0%) | 3.56 |
| Single Male/Father | 41 (7.0%) | 2.49 |
| Single Female/Mother | 79 (13.6%) | 4.72 |
| Non-family | 171 (29.4%) | 1.55 |
| Total Households | 582 (100.0%) | 3.05 |
Household Size by Marriage Status in Brightwood
Out of a total of 582 households in Brightwood, 411 (70.6%) are family households, while 171 (29.4%) are nonfamily households. The most numerous type of family households are 2-person households, comprising 194, and the most common type of nonfamily households are 1-person households, comprising 109.
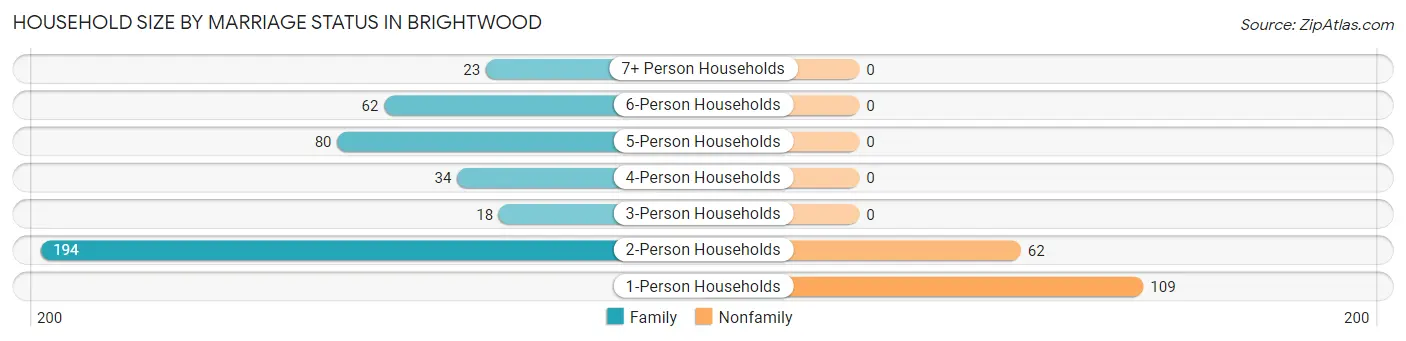
| Household Size | Family Households | Nonfamily Households |
| 1-Person Households | - | 109 (18.7%) |
| 2-Person Households | 194 (33.3%) | 62 (10.6%) |
| 3-Person Households | 18 (3.1%) | 0 (0.0%) |
| 4-Person Households | 34 (5.8%) | 0 (0.0%) |
| 5-Person Households | 80 (13.8%) | 0 (0.0%) |
| 6-Person Households | 62 (10.6%) | 0 (0.0%) |
| 7+ Person Households | 23 (4.0%) | 0 (0.0%) |
| Total | 411 (70.6%) | 171 (29.4%) |
Female Fertility in Brightwood
Fertility by Age in Brightwood
Average fertility rate in Brightwood is 144.0 births per 1,000 women. Women in the age bracket of 35 to 50 years have the highest fertility rate with 276.0 births per 1,000 women. Women in the age bracket of 35 to 50 years acount for 59.7% of all women with births.
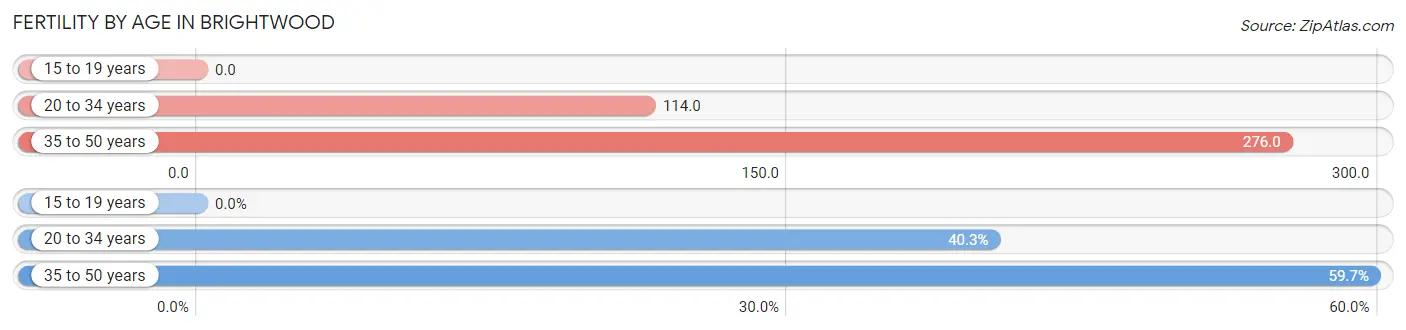
| Age Bracket | Women with Births | Births / 1,000 Women |
| 15 to 19 years | 0 (0.0%) | 0.0 |
| 20 to 34 years | 25 (40.3%) | 114.0 |
| 35 to 50 years | 37 (59.7%) | 276.0 |
| Total | 62 (100.0%) | 144.0 |
Fertility by Age by Marriage Status in Brightwood
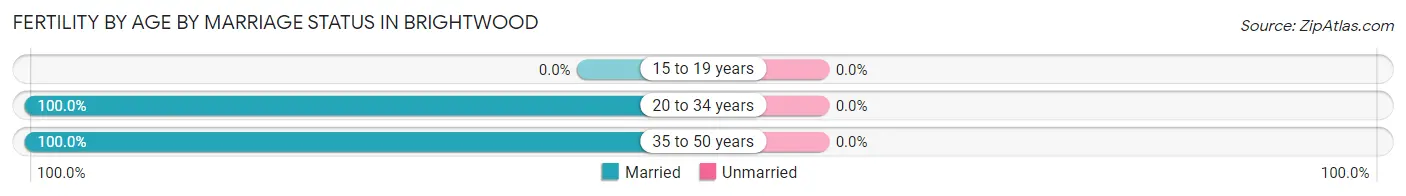
| Age Bracket | Married | Unmarried |
| 15 to 19 years | 0 (0.0%) | 0 (0.0%) |
| 20 to 34 years | 25 (100.0%) | 0 (0.0%) |
| 35 to 50 years | 37 (100.0%) | 0 (0.0%) |
| Total | 62 (100.0%) | 0 (0.0%) |
Fertility by Education in Brightwood
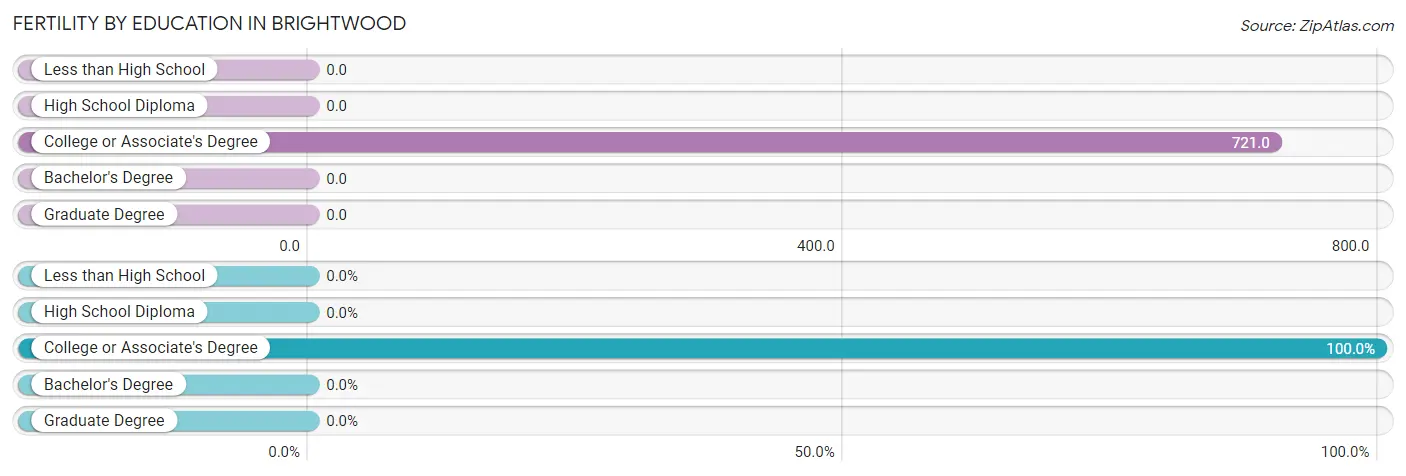
| Educational Attainment | Women with Births | Births / 1,000 Women |
| Less than High School | 0 (0.0%) | 0.0 |
| High School Diploma | 0 (0.0%) | 0.0 |
| College or Associate's Degree | 62 (100.0%) | 721.0 |
| Bachelor's Degree | 0 (0.0%) | 0.0 |
| Graduate Degree | 0 (0.0%) | 0.0 |
| Total | 62 (100.0%) | 144.0 |
Fertility by Education by Marriage Status in Brightwood
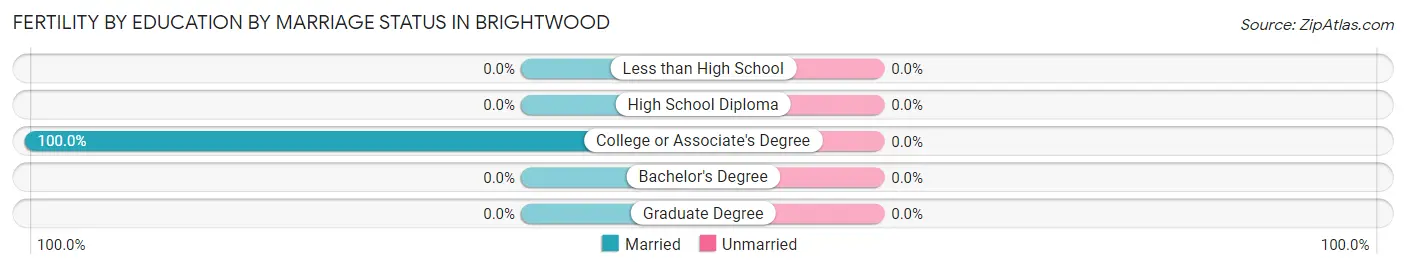
| Educational Attainment | Married | Unmarried |
| Less than High School | 0 (0.0%) | 0 (0.0%) |
| High School Diploma | 0 (0.0%) | 0 (0.0%) |
| College or Associate's Degree | 62 (100.0%) | 0 (0.0%) |
| Bachelor's Degree | 0 (0.0%) | 0 (0.0%) |
| Graduate Degree | 0 (0.0%) | 0 (0.0%) |
| Total | 62 (100.0%) | 0 (0.0%) |
Employment Characteristics in Brightwood
Employment by Class of Employer in Brightwood
Among the 895 employed individuals in Brightwood, private company employees (544 | 60.8%), local government employees (143 | 16.0%), and self-employed (not incorporated) (136 | 15.2%) make up the most common classes of employment.
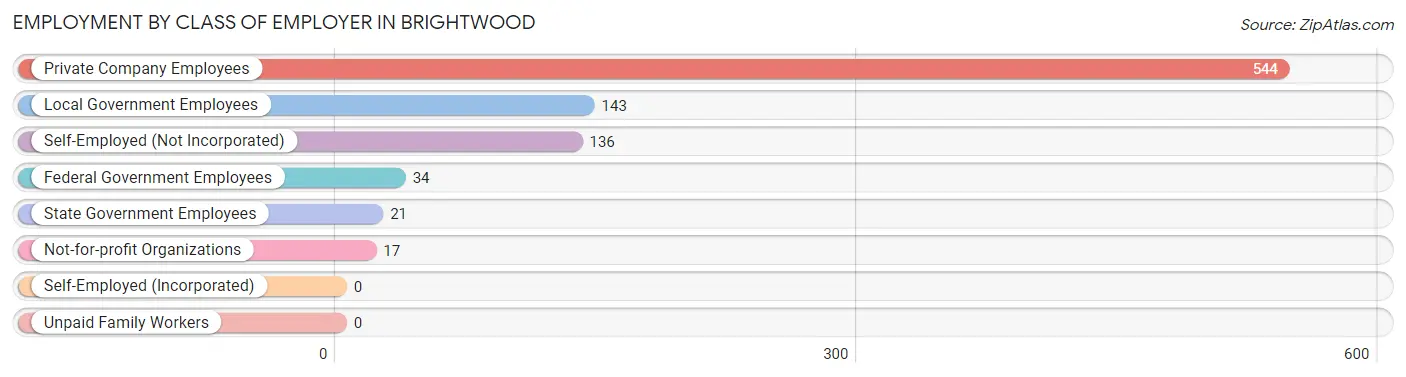
| Employer Class | # Employees | % Employees |
| Private Company Employees | 544 | 60.8% |
| Self-Employed (Incorporated) | 0 | 0.0% |
| Self-Employed (Not Incorporated) | 136 | 15.2% |
| Not-for-profit Organizations | 17 | 1.9% |
| Local Government Employees | 143 | 16.0% |
| State Government Employees | 21 | 2.4% |
| Federal Government Employees | 34 | 3.8% |
| Unpaid Family Workers | 0 | 0.0% |
| Total | 895 | 100.0% |
Employment Status by Age in Brightwood
According to the labor force statistics for Brightwood, out of the total population over 16 years of age (1,367), 71.9% or 983 individuals are in the labor force, with 3.0% or 29 of them unemployed. The age group with the highest labor force participation rate is 16 to 19 years, with 100.0% or 52 individuals in the labor force. Within the labor force, the 45 to 54 years age range has the highest percentage of unemployed individuals, with 17.6% or 29 of them being unemployed.
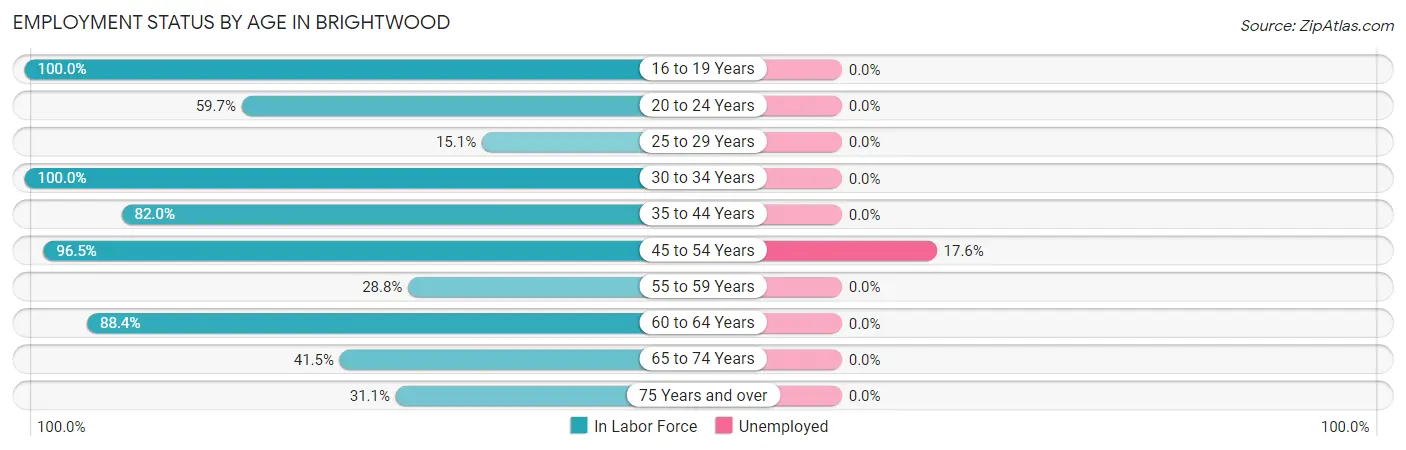
| Age Bracket | In Labor Force | Unemployed |
| 16 to 19 Years | 52 (100.0%) | 0 (0.0%) |
| 20 to 24 Years | 37 (59.7%) | 0 (0.0%) |
| 25 to 29 Years | 8 (15.1%) | 0 (0.0%) |
| 30 to 34 Years | 283 (100.0%) | 0 (0.0%) |
| 35 to 44 Years | 169 (82.0%) | 0 (0.0%) |
| 45 to 54 Years | 165 (96.5%) | 29 (17.6%) |
| 55 to 59 Years | 17 (28.8%) | 0 (0.0%) |
| 60 to 64 Years | 137 (88.4%) | 0 (0.0%) |
| 65 to 74 Years | 54 (41.5%) | 0 (0.0%) |
| 75 Years and over | 61 (31.1%) | 0 (0.0%) |
| Total | 983 (71.9%) | 29 (3.0%) |
Employment Status by Educational Attainment in Brightwood
According to labor force statistics for Brightwood, 84.0% of individuals (779) out of the total population between 25 and 64 years of age (927) are in the labor force, with 3.7% or 29 of them being unemployed. The group with the highest labor force participation rate are those with the educational attainment of less than high school, with 100.0% or 151 individuals in the labor force. Within the labor force, individuals with high school diploma education have the highest percentage of unemployment, with 7.9% or 29 of them being unemployed.
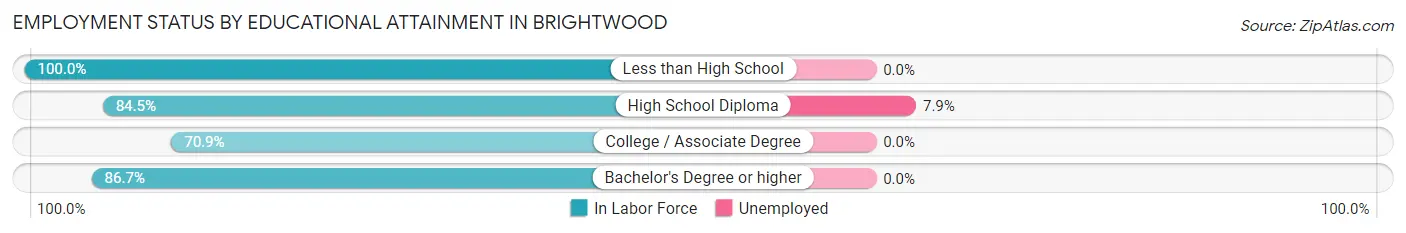
| Educational Attainment | In Labor Force | Unemployed |
| Less than High School | 151 (100.0%) | 0 (0.0%) |
| High School Diploma | 366 (84.5%) | 34 (7.9%) |
| College / Associate Degree | 158 (70.9%) | 0 (0.0%) |
| Bachelor's Degree or higher | 104 (86.7%) | 0 (0.0%) |
| Total | 779 (84.0%) | 34 (3.7%) |
Employment Occupations by Sex in Brightwood
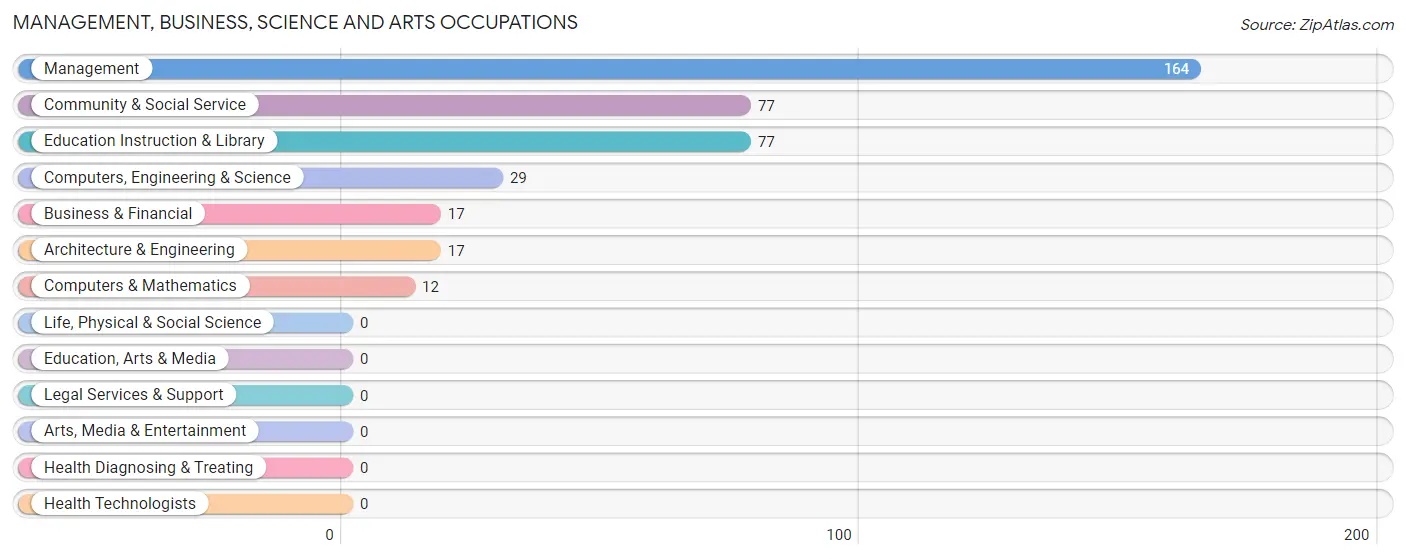
Management, Business, Science and Arts Occupations
The most common Management, Business, Science and Arts occupations in Brightwood are Management (164 | 17.2%), Community & Social Service (77 | 8.1%), Education Instruction & Library (77 | 8.1%), Computers, Engineering & Science (29 | 3.0%), and Business & Financial (17 | 1.8%).
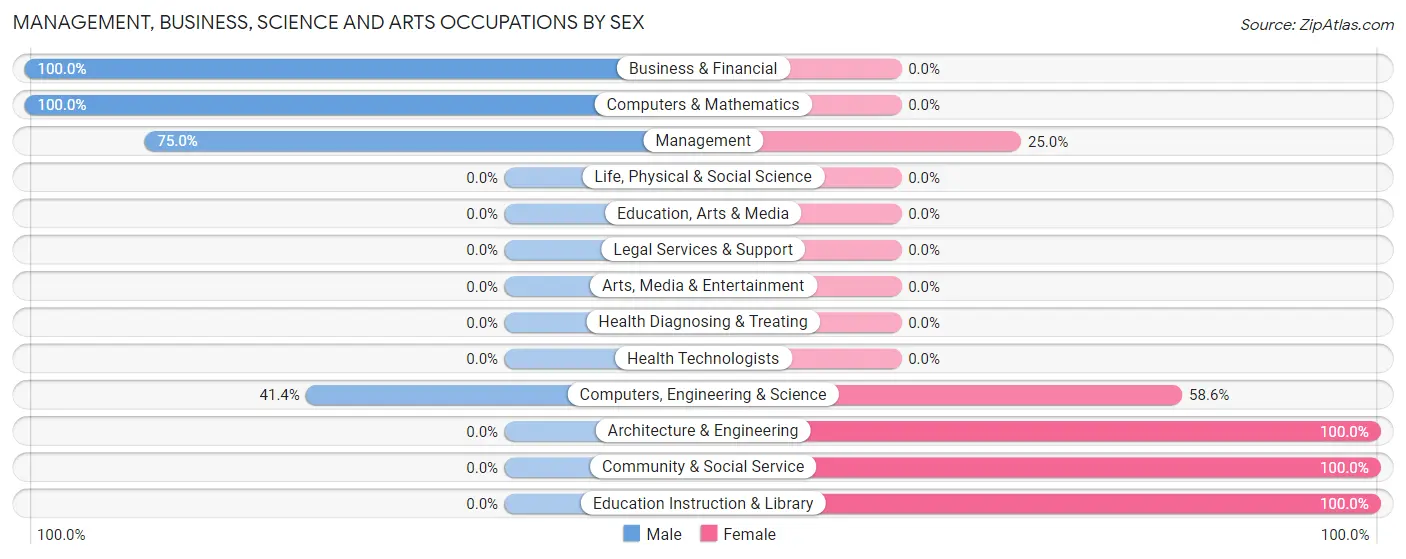
Management, Business, Science and Arts Occupations by Sex
Within the Management, Business, Science and Arts occupations in Brightwood, the most male-oriented occupations are Business & Financial (100.0%), Computers & Mathematics (100.0%), and Management (75.0%), while the most female-oriented occupations are Architecture & Engineering (100.0%), Community & Social Service (100.0%), and Education Instruction & Library (100.0%).
| Occupation | Male | Female |
| Management | 123 (75.0%) | 41 (25.0%) |
| Business & Financial | 17 (100.0%) | 0 (0.0%) |
| Computers, Engineering & Science | 12 (41.4%) | 17 (58.6%) |
| Computers & Mathematics | 12 (100.0%) | 0 (0.0%) |
| Architecture & Engineering | 0 (0.0%) | 17 (100.0%) |
| Life, Physical & Social Science | 0 (0.0%) | 0 (0.0%) |
| Community & Social Service | 0 (0.0%) | 77 (100.0%) |
| Education, Arts & Media | 0 (0.0%) | 0 (0.0%) |
| Legal Services & Support | 0 (0.0%) | 0 (0.0%) |
| Education Instruction & Library | 0 (0.0%) | 77 (100.0%) |
| Arts, Media & Entertainment | 0 (0.0%) | 0 (0.0%) |
| Health Diagnosing & Treating | 0 (0.0%) | 0 (0.0%) |
| Health Technologists | 0 (0.0%) | 0 (0.0%) |
| Total (Category) | 152 (53.0%) | 135 (47.0%) |
| Total (Overall) | 488 (51.1%) | 466 (48.8%) |
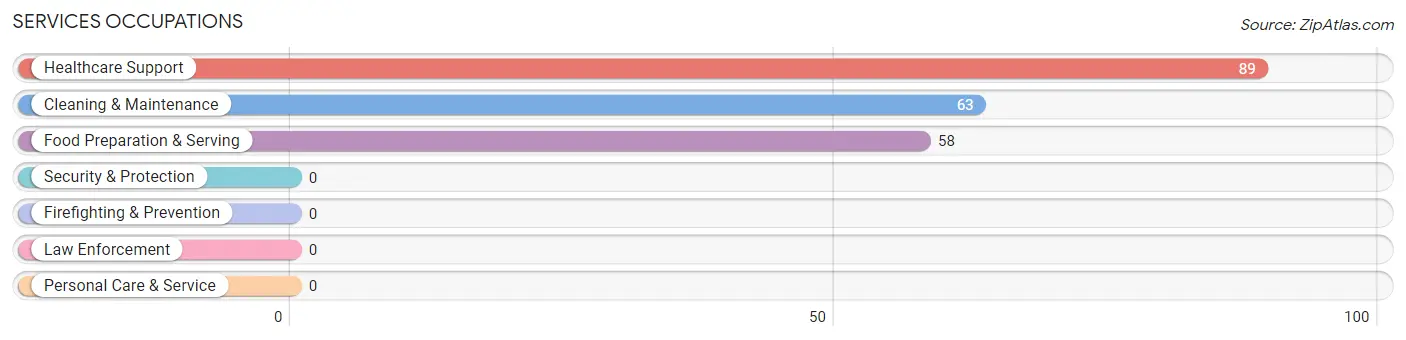
Services Occupations
The most common Services occupations in Brightwood are Healthcare Support (89 | 9.3%), Cleaning & Maintenance (63 | 6.6%), and Food Preparation & Serving (58 | 6.1%).
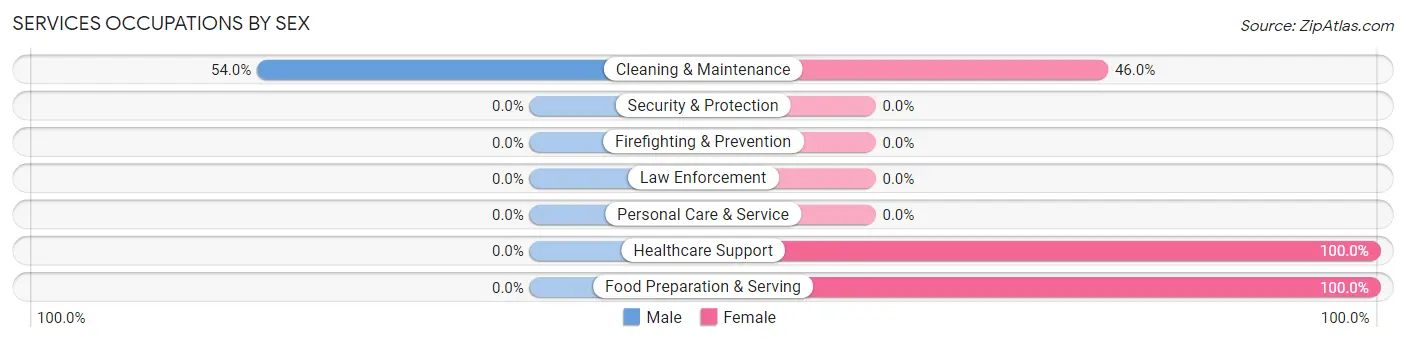
Services Occupations by Sex
| Occupation | Male | Female |
| Healthcare Support | 0 (0.0%) | 89 (100.0%) |
| Security & Protection | 0 (0.0%) | 0 (0.0%) |
| Firefighting & Prevention | 0 (0.0%) | 0 (0.0%) |
| Law Enforcement | 0 (0.0%) | 0 (0.0%) |
| Food Preparation & Serving | 0 (0.0%) | 58 (100.0%) |
| Cleaning & Maintenance | 34 (54.0%) | 29 (46.0%) |
| Personal Care & Service | 0 (0.0%) | 0 (0.0%) |
| Total (Category) | 34 (16.2%) | 176 (83.8%) |
| Total (Overall) | 488 (51.1%) | 466 (48.8%) |
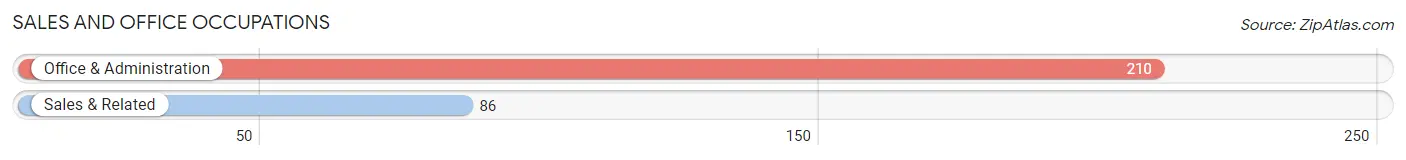
Sales and Office Occupations
The most common Sales and Office occupations in Brightwood are Office & Administration (210 | 22.0%), and Sales & Related (86 | 9.0%).
Sales and Office Occupations by Sex
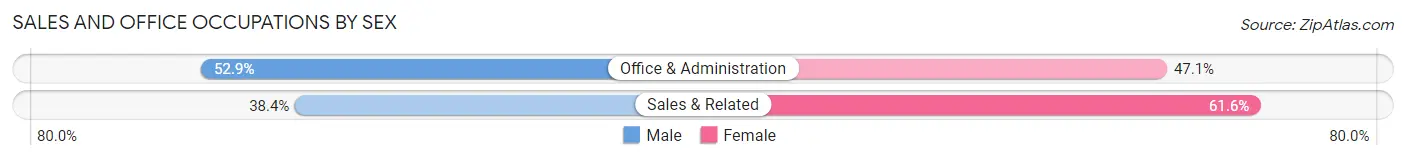
| Occupation | Male | Female |
| Sales & Related | 33 (38.4%) | 53 (61.6%) |
| Office & Administration | 111 (52.9%) | 99 (47.1%) |
| Total (Category) | 144 (48.6%) | 152 (51.3%) |
| Total (Overall) | 488 (51.1%) | 466 (48.8%) |
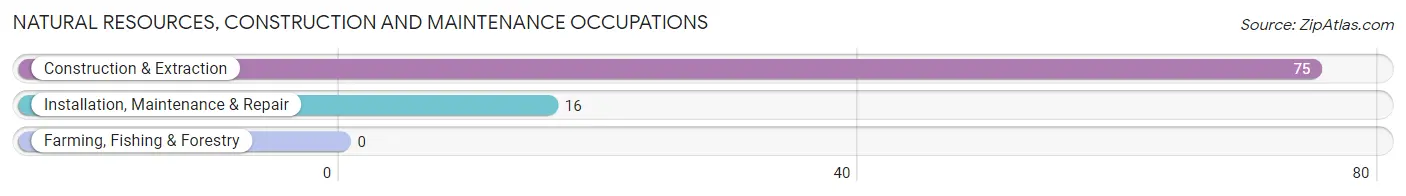
Natural Resources, Construction and Maintenance Occupations
The most common Natural Resources, Construction and Maintenance occupations in Brightwood are Construction & Extraction (75 | 7.9%), and Installation, Maintenance & Repair (16 | 1.7%).
Natural Resources, Construction and Maintenance Occupations by Sex
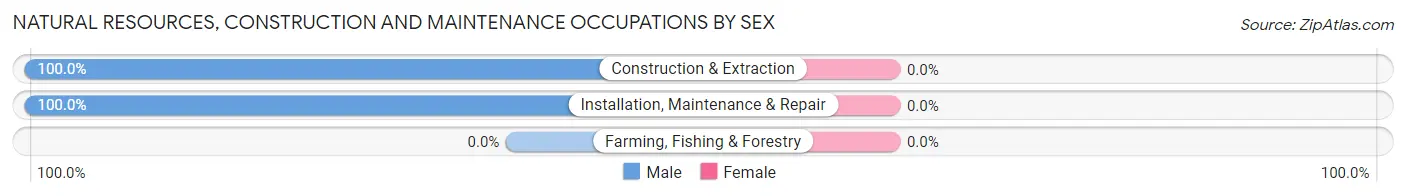
| Occupation | Male | Female |
| Farming, Fishing & Forestry | 0 (0.0%) | 0 (0.0%) |
| Construction & Extraction | 75 (100.0%) | 0 (0.0%) |
| Installation, Maintenance & Repair | 16 (100.0%) | 0 (0.0%) |
| Total (Category) | 91 (100.0%) | 0 (0.0%) |
| Total (Overall) | 488 (51.1%) | 466 (48.8%) |
Production, Transportation and Moving Occupations
The most common Production, Transportation and Moving occupations in Brightwood are , and Material Moving (70 | 7.3%).
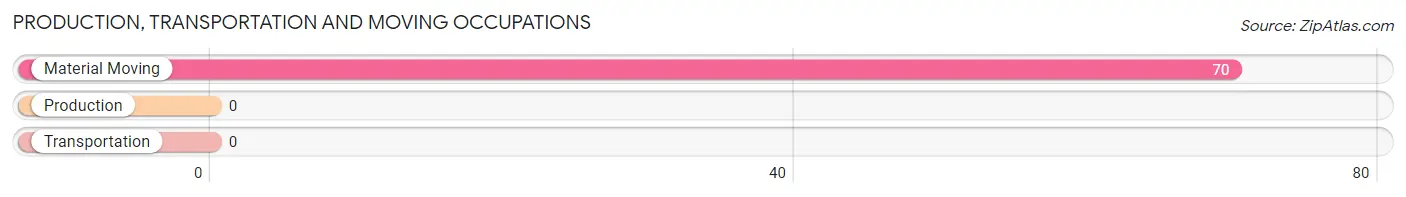
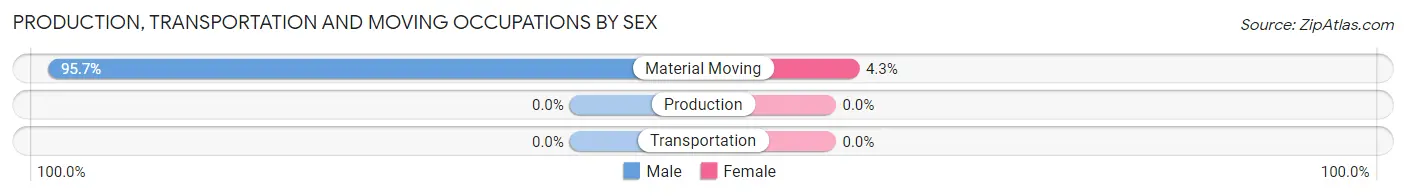
Production, Transportation and Moving Occupations by Sex
| Occupation | Male | Female |
| Production | 0 (0.0%) | 0 (0.0%) |
| Transportation | 0 (0.0%) | 0 (0.0%) |
| Material Moving | 67 (95.7%) | 3 (4.3%) |
| Total (Category) | 67 (95.7%) | 3 (4.3%) |
| Total (Overall) | 488 (51.1%) | 466 (48.8%) |
Employment Industries by Sex in Brightwood
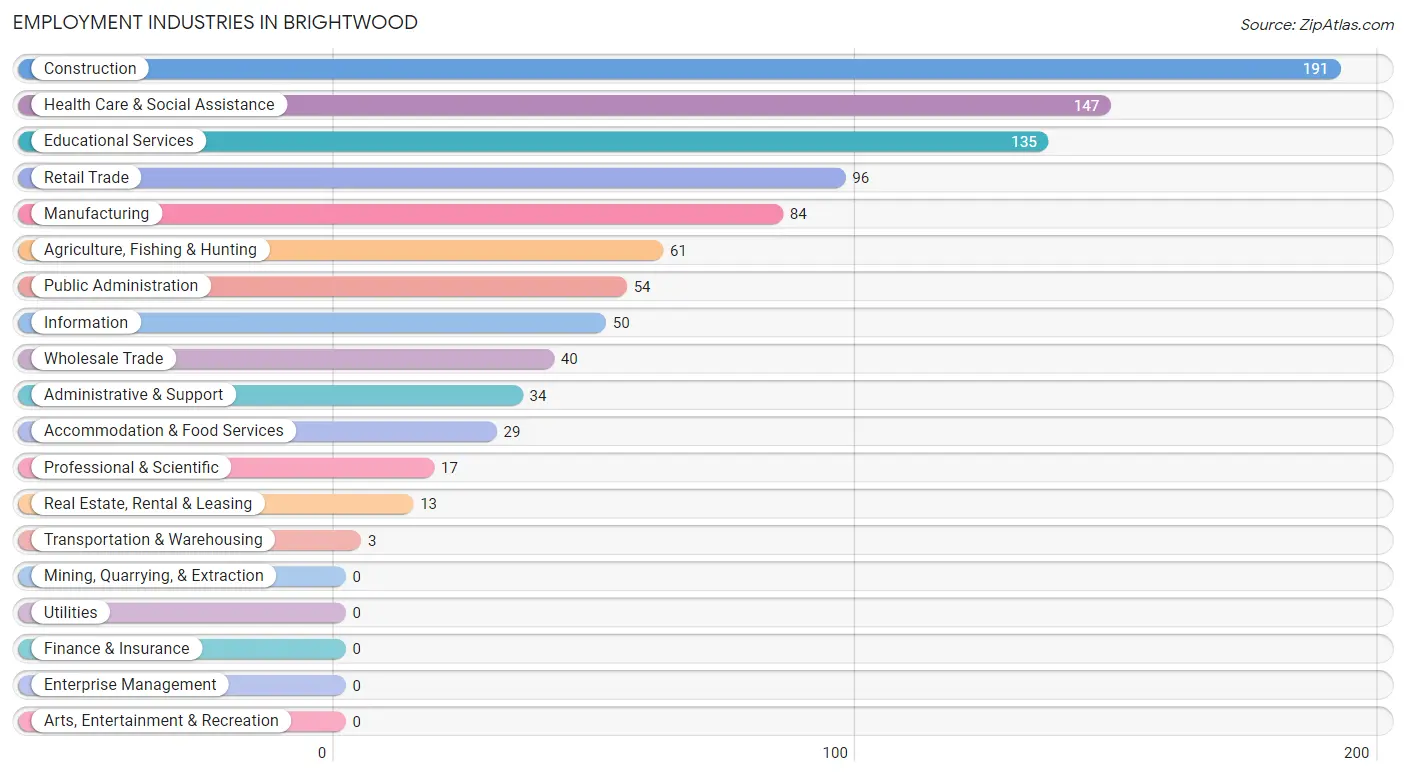
Employment Industries in Brightwood
The major employment industries in Brightwood include Construction (191 | 20.0%), Health Care & Social Assistance (147 | 15.4%), Educational Services (135 | 14.1%), Retail Trade (96 | 10.1%), and Manufacturing (84 | 8.8%).
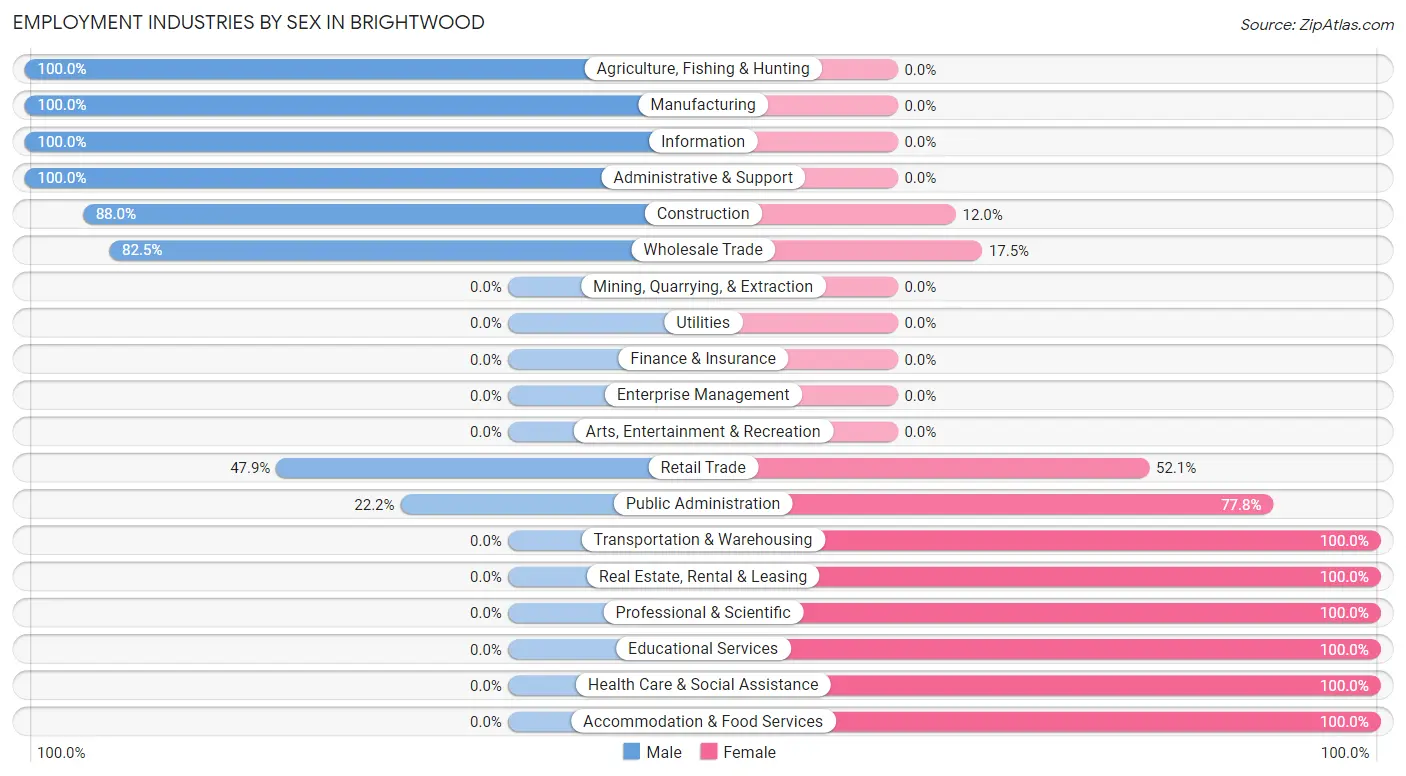
Employment Industries by Sex in Brightwood
The Brightwood industries that see more men than women are Agriculture, Fishing & Hunting (100.0%), Manufacturing (100.0%), and Information (100.0%), whereas the industries that tend to have a higher number of women are Transportation & Warehousing (100.0%), Real Estate, Rental & Leasing (100.0%), and Professional & Scientific (100.0%).
| Industry | Male | Female |
| Agriculture, Fishing & Hunting | 61 (100.0%) | 0 (0.0%) |
| Mining, Quarrying, & Extraction | 0 (0.0%) | 0 (0.0%) |
| Construction | 168 (88.0%) | 23 (12.0%) |
| Manufacturing | 84 (100.0%) | 0 (0.0%) |
| Wholesale Trade | 33 (82.5%) | 7 (17.5%) |
| Retail Trade | 46 (47.9%) | 50 (52.1%) |
| Transportation & Warehousing | 0 (0.0%) | 3 (100.0%) |
| Utilities | 0 (0.0%) | 0 (0.0%) |
| Information | 50 (100.0%) | 0 (0.0%) |
| Finance & Insurance | 0 (0.0%) | 0 (0.0%) |
| Real Estate, Rental & Leasing | 0 (0.0%) | 13 (100.0%) |
| Professional & Scientific | 0 (0.0%) | 17 (100.0%) |
| Enterprise Management | 0 (0.0%) | 0 (0.0%) |
| Administrative & Support | 34 (100.0%) | 0 (0.0%) |
| Educational Services | 0 (0.0%) | 135 (100.0%) |
| Health Care & Social Assistance | 0 (0.0%) | 147 (100.0%) |
| Arts, Entertainment & Recreation | 0 (0.0%) | 0 (0.0%) |
| Accommodation & Food Services | 0 (0.0%) | 29 (100.0%) |
| Public Administration | 12 (22.2%) | 42 (77.8%) |
| Total | 488 (51.1%) | 466 (48.8%) |
Education in Brightwood
School Enrollment in Brightwood
The most common levels of schooling among the 376 students in Brightwood are middle school (88 | 23.4%), college / undergraduate (79 | 21.0%), and high school (78 | 20.7%).
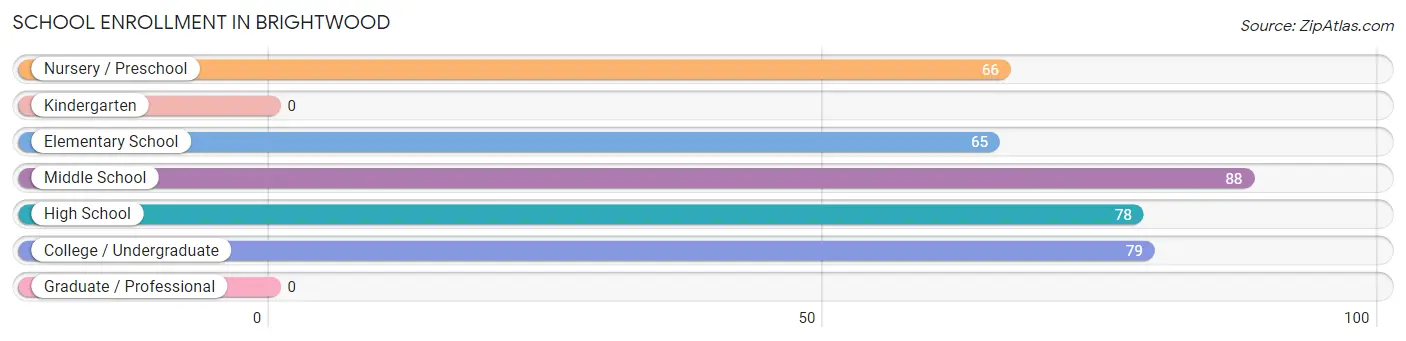
| School Level | # Students | % Students |
| Nursery / Preschool | 66 | 17.5% |
| Kindergarten | 0 | 0.0% |
| Elementary School | 65 | 17.3% |
| Middle School | 88 | 23.4% |
| High School | 78 | 20.7% |
| College / Undergraduate | 79 | 21.0% |
| Graduate / Professional | 0 | 0.0% |
| Total | 376 | 100.0% |
School Enrollment by Age by Funding Source in Brightwood
Out of a total of 376 students who are enrolled in schools in Brightwood, 15 (4.0%) attend a private institution, while the remaining 361 (96.0%) are enrolled in public schools. The age group of 3 to 4 year olds has the highest likelihood of being enrolled in private schools, with 15 (100.0% in the age bracket) enrolled. Conversely, the age group of 5 to 9 year old has the lowest likelihood of being enrolled in a private school, with 116 (100.0% in the age bracket) attending a public institution.
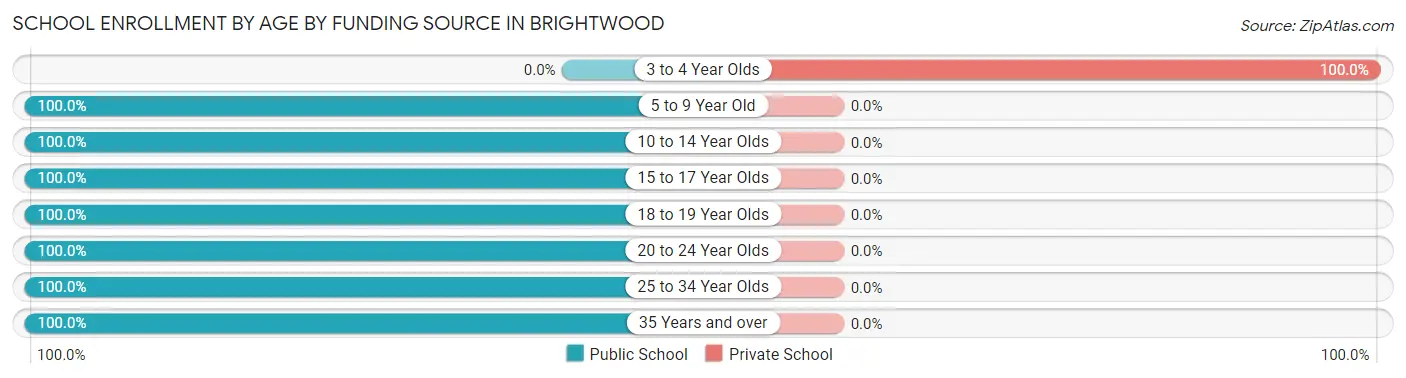
| Age Bracket | Public School | Private School |
| 3 to 4 Year Olds | 0 (0.0%) | 15 (100.0%) |
| 5 to 9 Year Old | 116 (100.0%) | 0 (0.0%) |
| 10 to 14 Year Olds | 88 (100.0%) | 0 (0.0%) |
| 15 to 17 Year Olds | 26 (100.0%) | 0 (0.0%) |
| 18 to 19 Year Olds | 52 (100.0%) | 0 (0.0%) |
| 20 to 24 Year Olds | 57 (100.0%) | 0 (0.0%) |
| 25 to 34 Year Olds | 16 (100.0%) | 0 (0.0%) |
| 35 Years and over | 6 (100.0%) | 0 (0.0%) |
| Total | 361 (96.0%) | 15 (4.0%) |
Educational Attainment by Field of Study in Brightwood
Physical & health sciences (61 | 26.8%), education (44 | 19.3%), business (38 | 16.7%), bio, nature & agricultural (34 | 14.9%), and science & technology (33 | 14.5%) are the most common fields of study among 228 individuals in Brightwood who have obtained a bachelor's degree or higher.
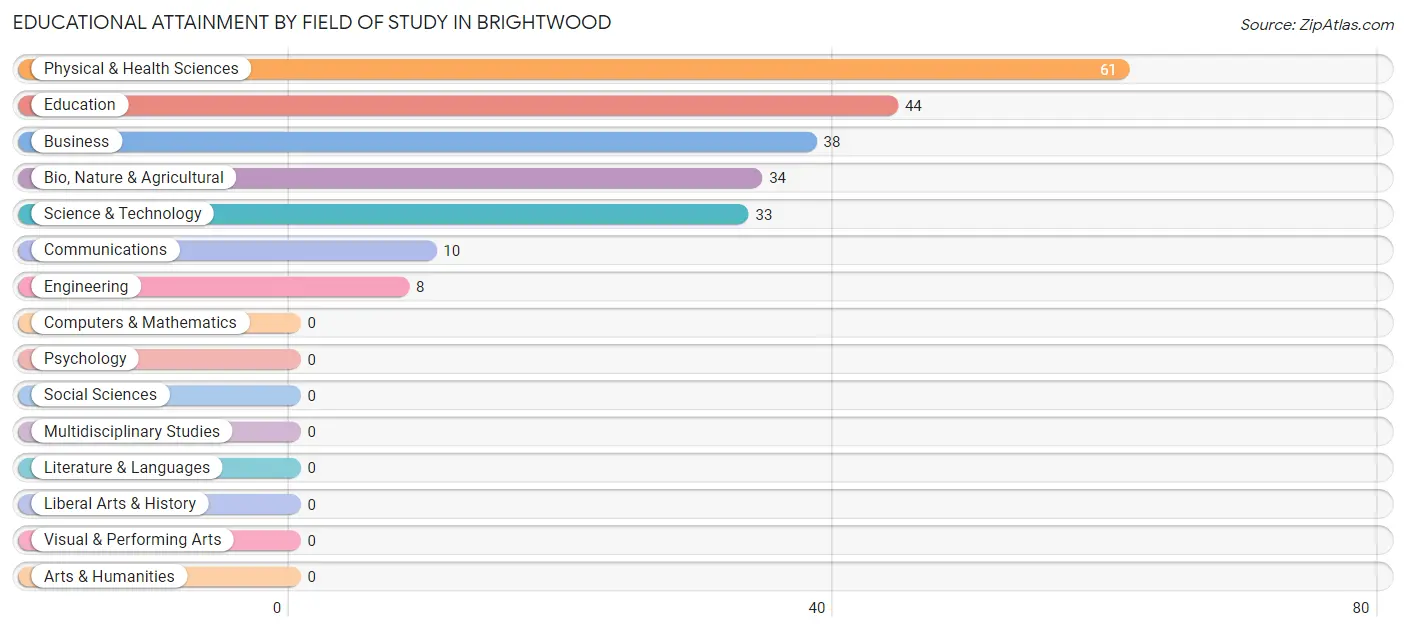
| Field of Study | # Graduates | % Graduates |
| Computers & Mathematics | 0 | 0.0% |
| Bio, Nature & Agricultural | 34 | 14.9% |
| Physical & Health Sciences | 61 | 26.8% |
| Psychology | 0 | 0.0% |
| Social Sciences | 0 | 0.0% |
| Engineering | 8 | 3.5% |
| Multidisciplinary Studies | 0 | 0.0% |
| Science & Technology | 33 | 14.5% |
| Business | 38 | 16.7% |
| Education | 44 | 19.3% |
| Literature & Languages | 0 | 0.0% |
| Liberal Arts & History | 0 | 0.0% |
| Visual & Performing Arts | 0 | 0.0% |
| Communications | 10 | 4.4% |
| Arts & Humanities | 0 | 0.0% |
| Total | 228 | 100.0% |
Transportation & Commute in Brightwood
Vehicle Availability by Sex in Brightwood
The most prevalent vehicle ownership categories in Brightwood are males with 3 vehicles (198, accounting for 41.6%) and females with 3 vehicles (171, making up 47.3%).
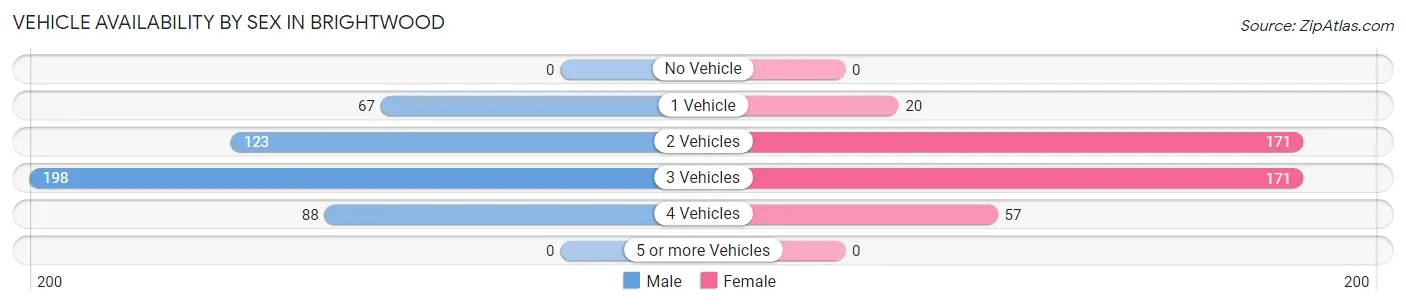
| Vehicles Available | Male | Female |
| No Vehicle | 0 (0.0%) | 0 (0.0%) |
| 1 Vehicle | 67 (14.1%) | 20 (4.8%) |
| 2 Vehicles | 123 (25.8%) | 171 (40.8%) |
| 3 Vehicles | 198 (41.6%) | 171 (40.8%) |
| 4 Vehicles | 88 (18.5%) | 57 (13.6%) |
| 5 or more Vehicles | 0 (0.0%) | 0 (0.0%) |
| Total | 476 (100.0%) | 419 (100.0%) |
Commute Time in Brightwood
The most frequently occuring commute durations in Brightwood are 30 to 34 minutes (158 commuters, 22.6%), 20 to 24 minutes (126 commuters, 18.0%), and 10 to 14 minutes (125 commuters, 17.9%).
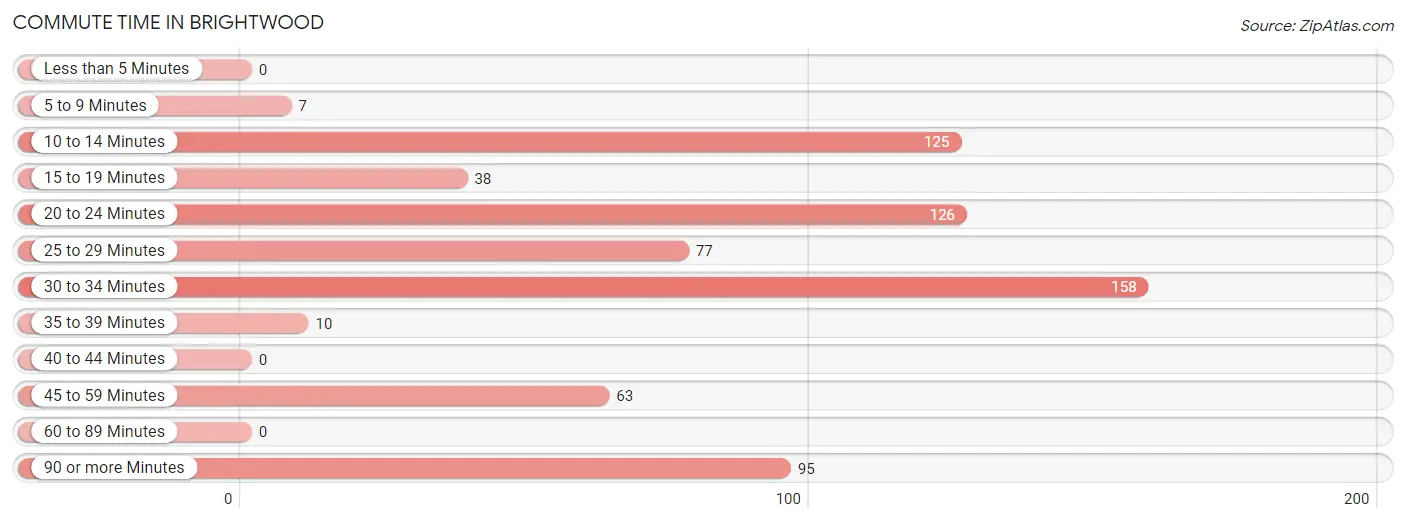
| Commute Time | # Commuters | % Commuters |
| Less than 5 Minutes | 0 | 0.0% |
| 5 to 9 Minutes | 7 | 1.0% |
| 10 to 14 Minutes | 125 | 17.9% |
| 15 to 19 Minutes | 38 | 5.4% |
| 20 to 24 Minutes | 126 | 18.0% |
| 25 to 29 Minutes | 77 | 11.0% |
| 30 to 34 Minutes | 158 | 22.6% |
| 35 to 39 Minutes | 10 | 1.4% |
| 40 to 44 Minutes | 0 | 0.0% |
| 45 to 59 Minutes | 63 | 9.0% |
| 60 to 89 Minutes | 0 | 0.0% |
| 90 or more Minutes | 95 | 13.6% |
Commute Time by Sex in Brightwood
The most common commute times in Brightwood are 30 to 34 minutes (129 commuters, 39.0%) for males and 20 to 24 minutes (97 commuters, 26.4%) for females.
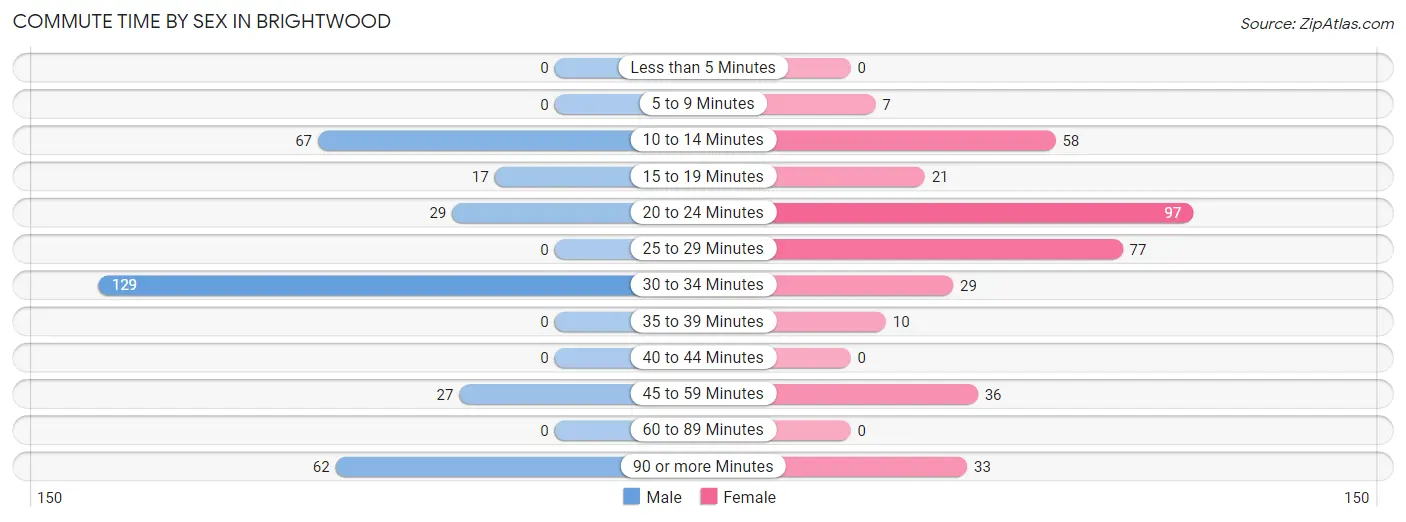
| Commute Time | Male | Female |
| Less than 5 Minutes | 0 (0.0%) | 0 (0.0%) |
| 5 to 9 Minutes | 0 (0.0%) | 7 (1.9%) |
| 10 to 14 Minutes | 67 (20.2%) | 58 (15.8%) |
| 15 to 19 Minutes | 17 (5.1%) | 21 (5.7%) |
| 20 to 24 Minutes | 29 (8.8%) | 97 (26.4%) |
| 25 to 29 Minutes | 0 (0.0%) | 77 (20.9%) |
| 30 to 34 Minutes | 129 (39.0%) | 29 (7.9%) |
| 35 to 39 Minutes | 0 (0.0%) | 10 (2.7%) |
| 40 to 44 Minutes | 0 (0.0%) | 0 (0.0%) |
| 45 to 59 Minutes | 27 (8.2%) | 36 (9.8%) |
| 60 to 89 Minutes | 0 (0.0%) | 0 (0.0%) |
| 90 or more Minutes | 62 (18.7%) | 33 (9.0%) |
Time of Departure to Work by Sex in Brightwood
The most frequent times of departure to work in Brightwood are 12:00 AM to 4:59 AM (128, 38.7%) for males and 7:00 AM to 7:29 AM (126, 34.2%) for females.
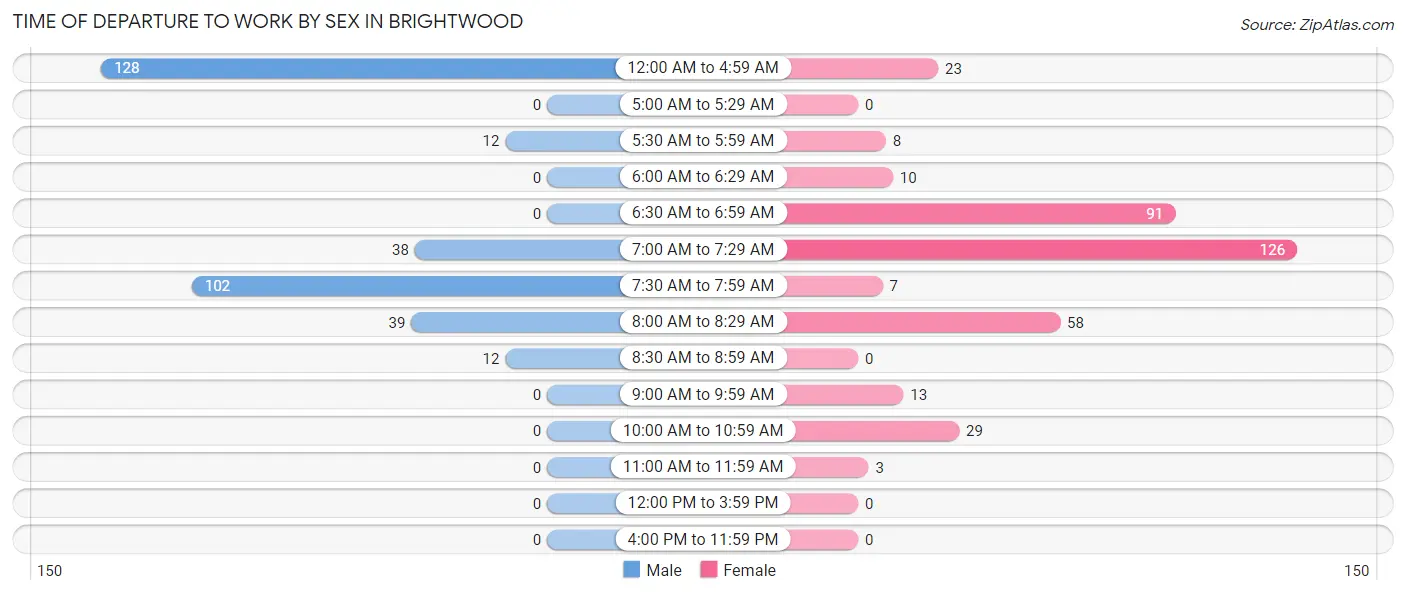
| Time of Departure | Male | Female |
| 12:00 AM to 4:59 AM | 128 (38.7%) | 23 (6.2%) |
| 5:00 AM to 5:29 AM | 0 (0.0%) | 0 (0.0%) |
| 5:30 AM to 5:59 AM | 12 (3.6%) | 8 (2.2%) |
| 6:00 AM to 6:29 AM | 0 (0.0%) | 10 (2.7%) |
| 6:30 AM to 6:59 AM | 0 (0.0%) | 91 (24.7%) |
| 7:00 AM to 7:29 AM | 38 (11.5%) | 126 (34.2%) |
| 7:30 AM to 7:59 AM | 102 (30.8%) | 7 (1.9%) |
| 8:00 AM to 8:29 AM | 39 (11.8%) | 58 (15.8%) |
| 8:30 AM to 8:59 AM | 12 (3.6%) | 0 (0.0%) |
| 9:00 AM to 9:59 AM | 0 (0.0%) | 13 (3.5%) |
| 10:00 AM to 10:59 AM | 0 (0.0%) | 29 (7.9%) |
| 11:00 AM to 11:59 AM | 0 (0.0%) | 3 (0.8%) |
| 12:00 PM to 3:59 PM | 0 (0.0%) | 0 (0.0%) |
| 4:00 PM to 11:59 PM | 0 (0.0%) | 0 (0.0%) |
| Total | 331 (100.0%) | 368 (100.0%) |
Housing Occupancy in Brightwood
Occupancy by Ownership in Brightwood
Of the total 582 dwellings in Brightwood, owner-occupied units account for 522 (89.7%), while renter-occupied units make up 60 (10.3%).
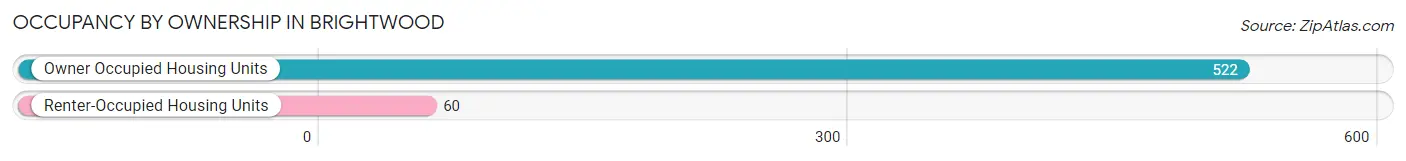
| Occupancy | # Housing Units | % Housing Units |
| Owner Occupied Housing Units | 522 | 89.7% |
| Renter-Occupied Housing Units | 60 | 10.3% |
| Total Occupied Housing Units | 582 | 100.0% |
Occupancy by Household Size in Brightwood
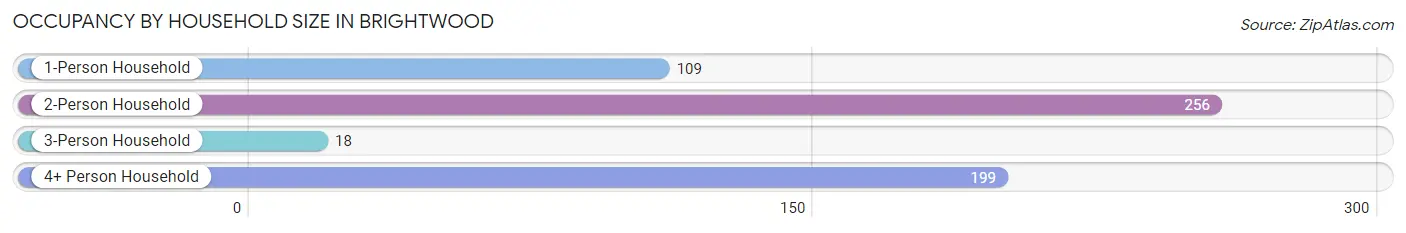
| Household Size | # Housing Units | % Housing Units |
| 1-Person Household | 109 | 18.7% |
| 2-Person Household | 256 | 44.0% |
| 3-Person Household | 18 | 3.1% |
| 4+ Person Household | 199 | 34.2% |
| Total Housing Units | 582 | 100.0% |
Occupancy by Ownership by Household Size in Brightwood
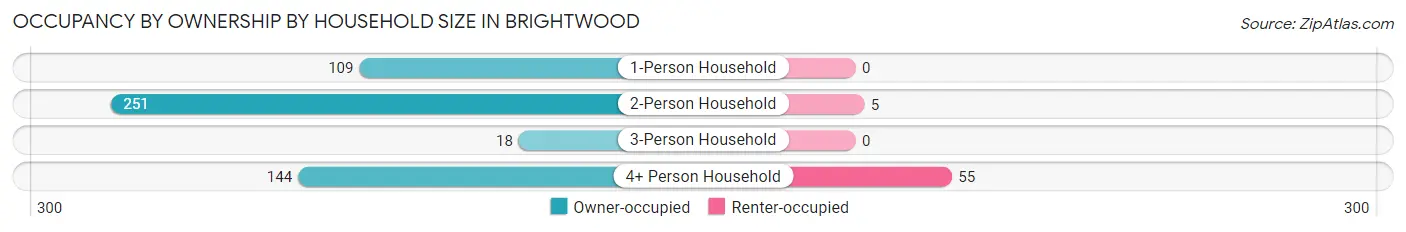
| Household Size | Owner-occupied | Renter-occupied |
| 1-Person Household | 109 (100.0%) | 0 (0.0%) |
| 2-Person Household | 251 (98.1%) | 5 (1.9%) |
| 3-Person Household | 18 (100.0%) | 0 (0.0%) |
| 4+ Person Household | 144 (72.4%) | 55 (27.6%) |
| Total Housing Units | 522 (89.7%) | 60 (10.3%) |
Occupancy by Educational Attainment in Brightwood
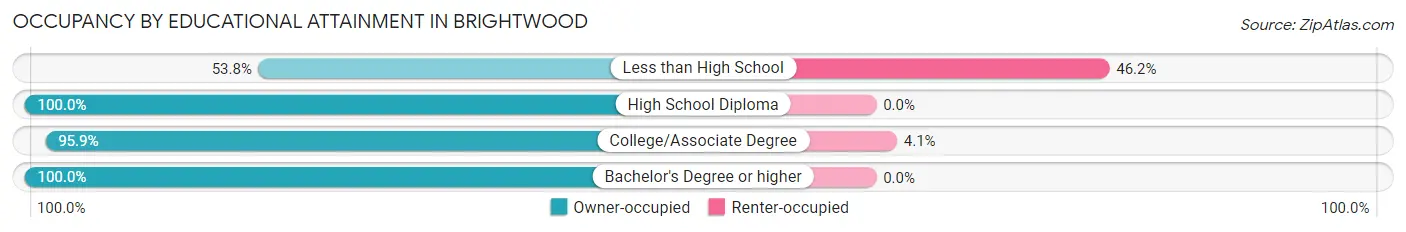
| Household Size | Owner-occupied | Renter-occupied |
| Less than High School | 64 (53.8%) | 55 (46.2%) |
| High School Diploma | 194 (100.0%) | 0 (0.0%) |
| College/Associate Degree | 117 (95.9%) | 5 (4.1%) |
| Bachelor's Degree or higher | 147 (100.0%) | 0 (0.0%) |
Occupancy by Age of Householder in Brightwood
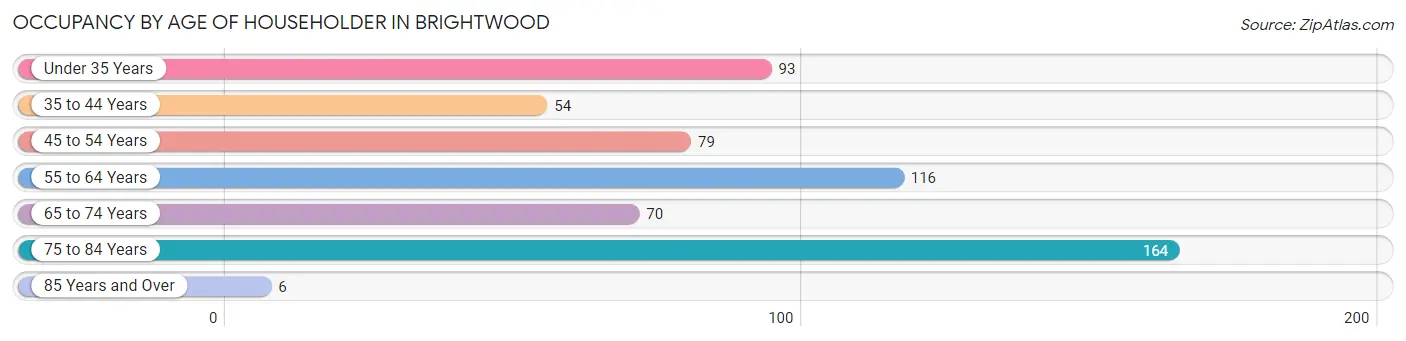
| Age Bracket | # Households | % Households |
| Under 35 Years | 93 | 16.0% |
| 35 to 44 Years | 54 | 9.3% |
| 45 to 54 Years | 79 | 13.6% |
| 55 to 64 Years | 116 | 19.9% |
| 65 to 74 Years | 70 | 12.0% |
| 75 to 84 Years | 164 | 28.2% |
| 85 Years and Over | 6 | 1.0% |
| Total | 582 | 100.0% |
Housing Finances in Brightwood
Median Income by Occupancy in Brightwood
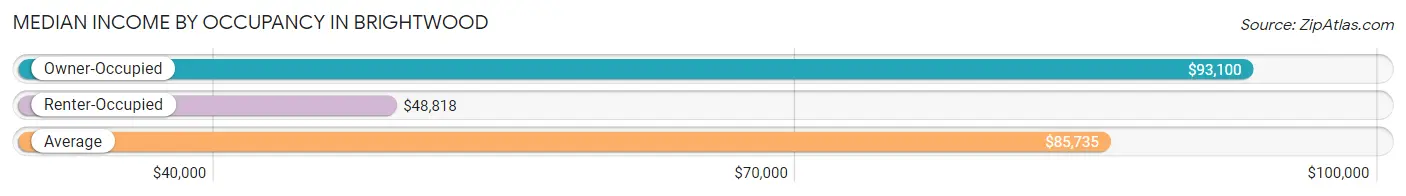
| Occupancy Type | # Households | Median Income |
| Owner-Occupied | 522 (89.7%) | $93,100 |
| Renter-Occupied | 60 (10.3%) | $48,818 |
| Average | 582 (100.0%) | $85,735 |
Occupancy by Householder Income Bracket in Brightwood
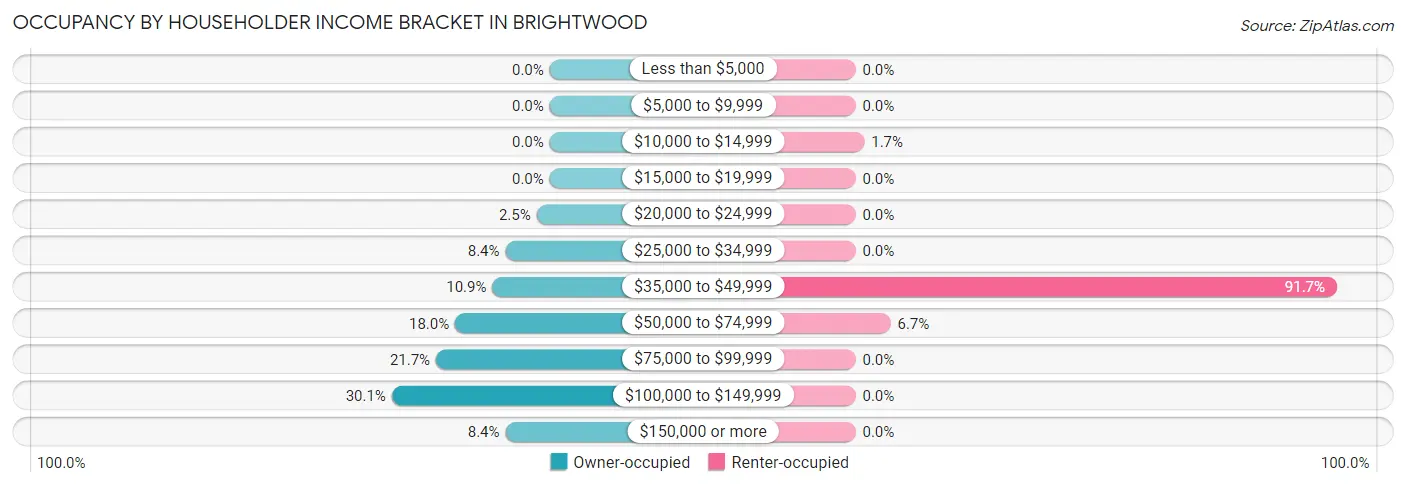
| Income Bracket | Owner-occupied | Renter-occupied |
| Less than $5,000 | 0 (0.0%) | 0 (0.0%) |
| $5,000 to $9,999 | 0 (0.0%) | 0 (0.0%) |
| $10,000 to $14,999 | 0 (0.0%) | 1 (1.7%) |
| $15,000 to $19,999 | 0 (0.0%) | 0 (0.0%) |
| $20,000 to $24,999 | 13 (2.5%) | 0 (0.0%) |
| $25,000 to $34,999 | 44 (8.4%) | 0 (0.0%) |
| $35,000 to $49,999 | 57 (10.9%) | 55 (91.7%) |
| $50,000 to $74,999 | 94 (18.0%) | 4 (6.7%) |
| $75,000 to $99,999 | 113 (21.6%) | 0 (0.0%) |
| $100,000 to $149,999 | 157 (30.1%) | 0 (0.0%) |
| $150,000 or more | 44 (8.4%) | 0 (0.0%) |
| Total | 522 (100.0%) | 60 (100.0%) |
Monthly Housing Cost Tiers in Brightwood
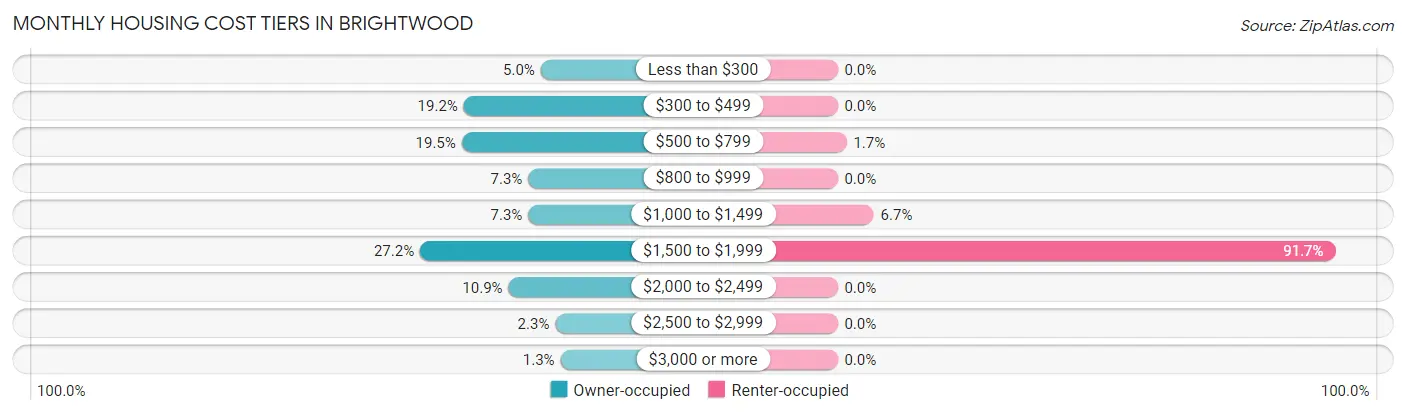
| Monthly Cost | Owner-occupied | Renter-occupied |
| Less than $300 | 26 (5.0%) | 0 (0.0%) |
| $300 to $499 | 100 (19.2%) | 0 (0.0%) |
| $500 to $799 | 102 (19.5%) | 1 (1.7%) |
| $800 to $999 | 38 (7.3%) | 0 (0.0%) |
| $1,000 to $1,499 | 38 (7.3%) | 4 (6.7%) |
| $1,500 to $1,999 | 142 (27.2%) | 55 (91.7%) |
| $2,000 to $2,499 | 57 (10.9%) | 0 (0.0%) |
| $2,500 to $2,999 | 12 (2.3%) | 0 (0.0%) |
| $3,000 or more | 7 (1.3%) | 0 (0.0%) |
| Total | 522 (100.0%) | 60 (100.0%) |
Physical Housing Characteristics in Brightwood
Housing Structures in Brightwood
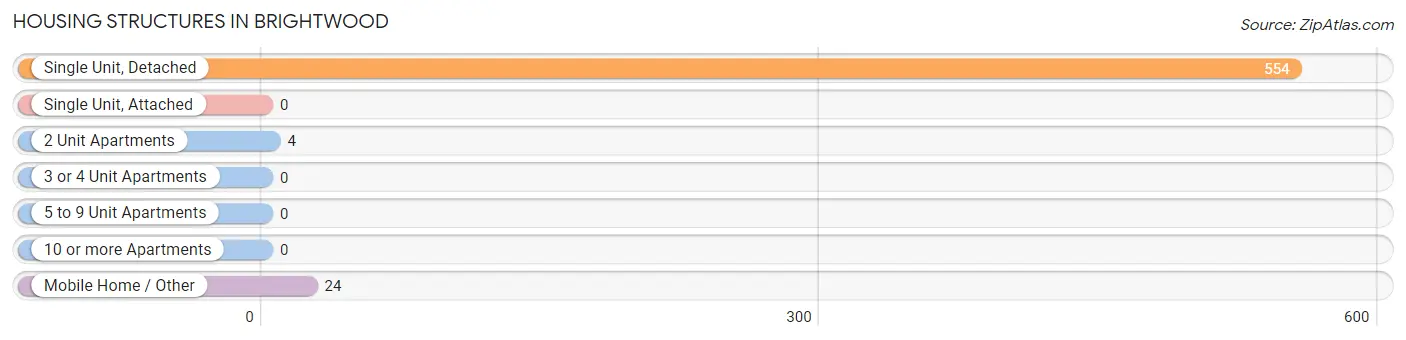
| Structure Type | # Housing Units | % Housing Units |
| Single Unit, Detached | 554 | 95.2% |
| Single Unit, Attached | 0 | 0.0% |
| 2 Unit Apartments | 4 | 0.7% |
| 3 or 4 Unit Apartments | 0 | 0.0% |
| 5 to 9 Unit Apartments | 0 | 0.0% |
| 10 or more Apartments | 0 | 0.0% |
| Mobile Home / Other | 24 | 4.1% |
| Total | 582 | 100.0% |
Housing Structures by Occupancy in Brightwood
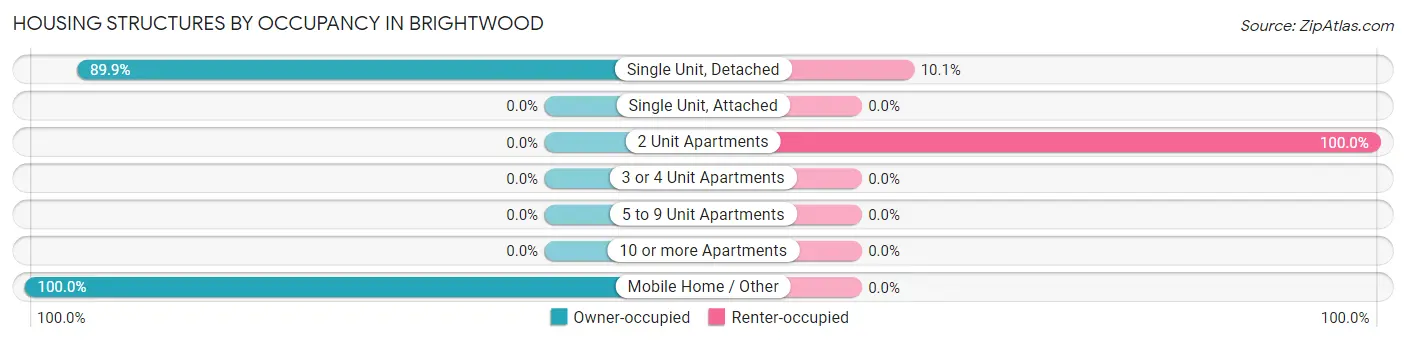
| Structure Type | Owner-occupied | Renter-occupied |
| Single Unit, Detached | 498 (89.9%) | 56 (10.1%) |
| Single Unit, Attached | 0 (0.0%) | 0 (0.0%) |
| 2 Unit Apartments | 0 (0.0%) | 4 (100.0%) |
| 3 or 4 Unit Apartments | 0 (0.0%) | 0 (0.0%) |
| 5 to 9 Unit Apartments | 0 (0.0%) | 0 (0.0%) |
| 10 or more Apartments | 0 (0.0%) | 0 (0.0%) |
| Mobile Home / Other | 24 (100.0%) | 0 (0.0%) |
| Total | 522 (89.7%) | 60 (10.3%) |
Housing Structures by Number of Rooms in Brightwood
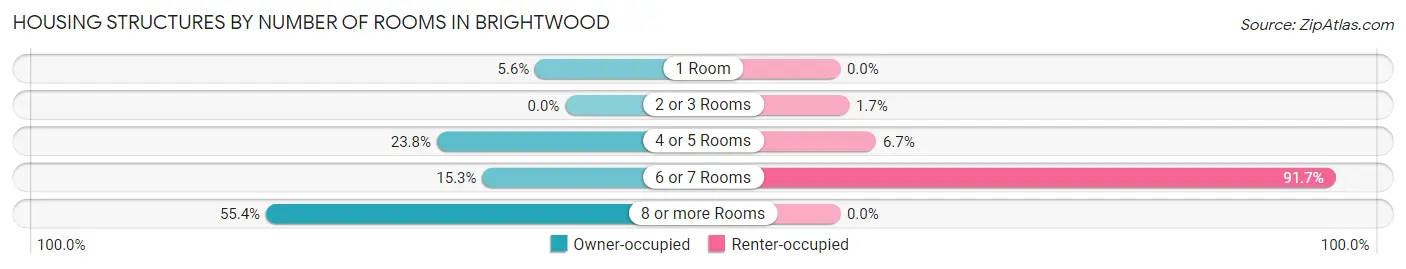
| Number of Rooms | Owner-occupied | Renter-occupied |
| 1 Room | 29 (5.6%) | 0 (0.0%) |
| 2 or 3 Rooms | 0 (0.0%) | 1 (1.7%) |
| 4 or 5 Rooms | 124 (23.7%) | 4 (6.7%) |
| 6 or 7 Rooms | 80 (15.3%) | 55 (91.7%) |
| 8 or more Rooms | 289 (55.4%) | 0 (0.0%) |
| Total | 522 (100.0%) | 60 (100.0%) |
Housing Structure by Heating Type in Brightwood
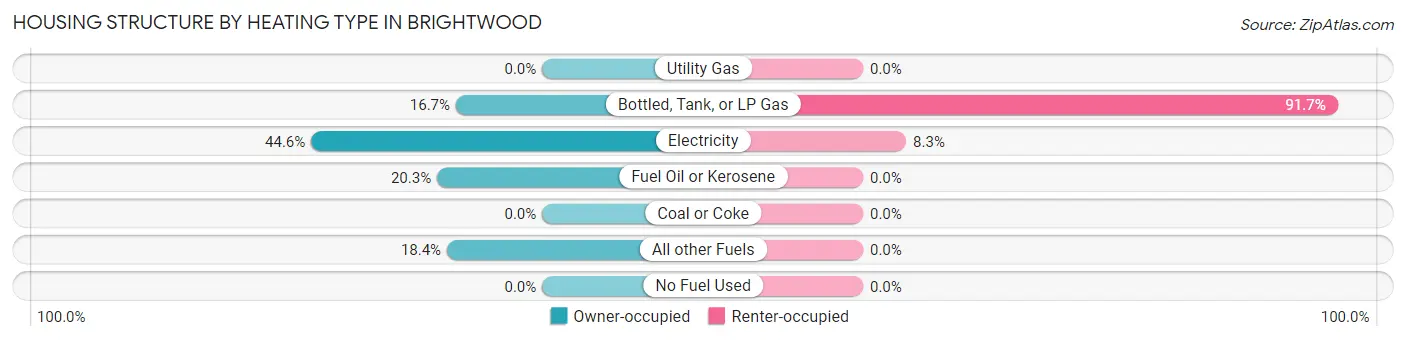
| Heating Type | Owner-occupied | Renter-occupied |
| Utility Gas | 0 (0.0%) | 0 (0.0%) |
| Bottled, Tank, or LP Gas | 87 (16.7%) | 55 (91.7%) |
| Electricity | 233 (44.6%) | 5 (8.3%) |
| Fuel Oil or Kerosene | 106 (20.3%) | 0 (0.0%) |
| Coal or Coke | 0 (0.0%) | 0 (0.0%) |
| All other Fuels | 96 (18.4%) | 0 (0.0%) |
| No Fuel Used | 0 (0.0%) | 0 (0.0%) |
| Total | 522 (100.0%) | 60 (100.0%) |
Household Vehicle Usage in Brightwood
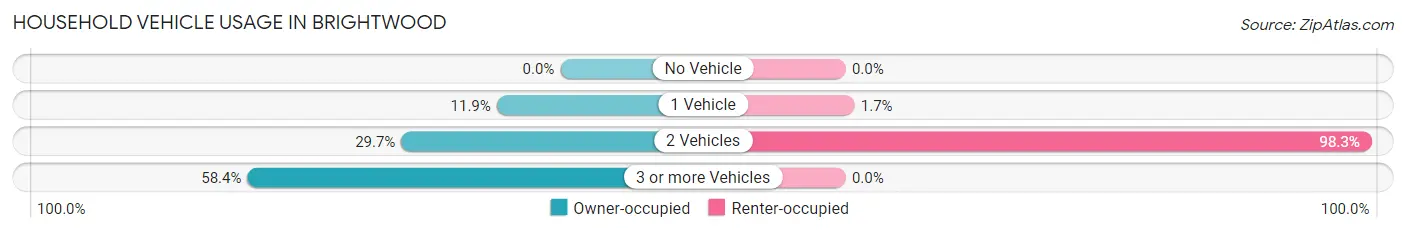
| Vehicles per Household | Owner-occupied | Renter-occupied |
| No Vehicle | 0 (0.0%) | 0 (0.0%) |
| 1 Vehicle | 62 (11.9%) | 1 (1.7%) |
| 2 Vehicles | 155 (29.7%) | 59 (98.3%) |
| 3 or more Vehicles | 305 (58.4%) | 0 (0.0%) |
| Total | 522 (100.0%) | 60 (100.0%) |
Real Estate & Mortgages in Brightwood
Real Estate and Mortgage Overview in Brightwood
| Characteristic | Without Mortgage | With Mortgage |
| Housing Units | 155 | 367 |
| Median Property Value | $227,500 | $362,500 |
| Median Household Income | $43,664 | $40 |
| Monthly Housing Costs | $415 | $7 |
| Real Estate Taxes | $1,224 | $8 |
Property Value by Mortgage Status in Brightwood
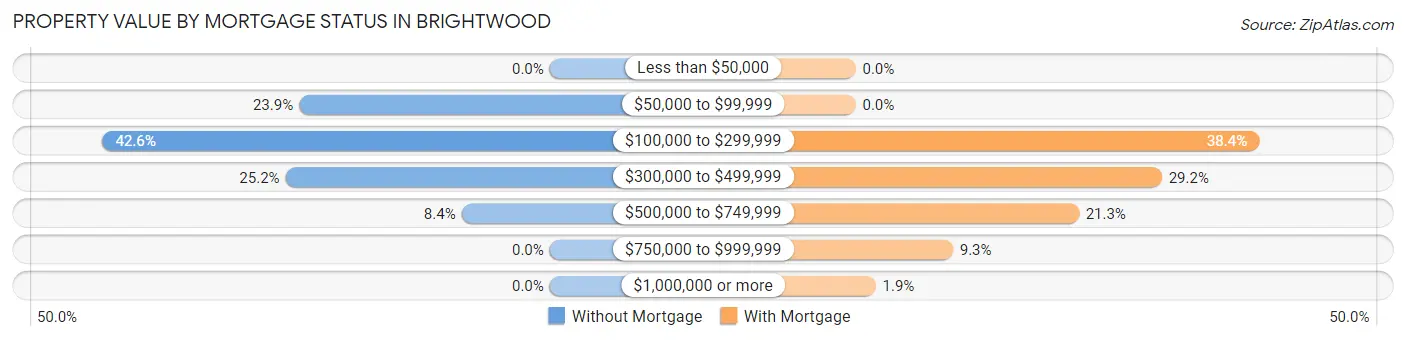
| Property Value | Without Mortgage | With Mortgage |
| Less than $50,000 | 0 (0.0%) | 0 (0.0%) |
| $50,000 to $99,999 | 37 (23.9%) | 0 (0.0%) |
| $100,000 to $299,999 | 66 (42.6%) | 141 (38.4%) |
| $300,000 to $499,999 | 39 (25.2%) | 107 (29.2%) |
| $500,000 to $749,999 | 13 (8.4%) | 78 (21.2%) |
| $750,000 to $999,999 | 0 (0.0%) | 34 (9.3%) |
| $1,000,000 or more | 0 (0.0%) | 7 (1.9%) |
| Total | 155 (100.0%) | 367 (100.0%) |
Household Income by Mortgage Status in Brightwood
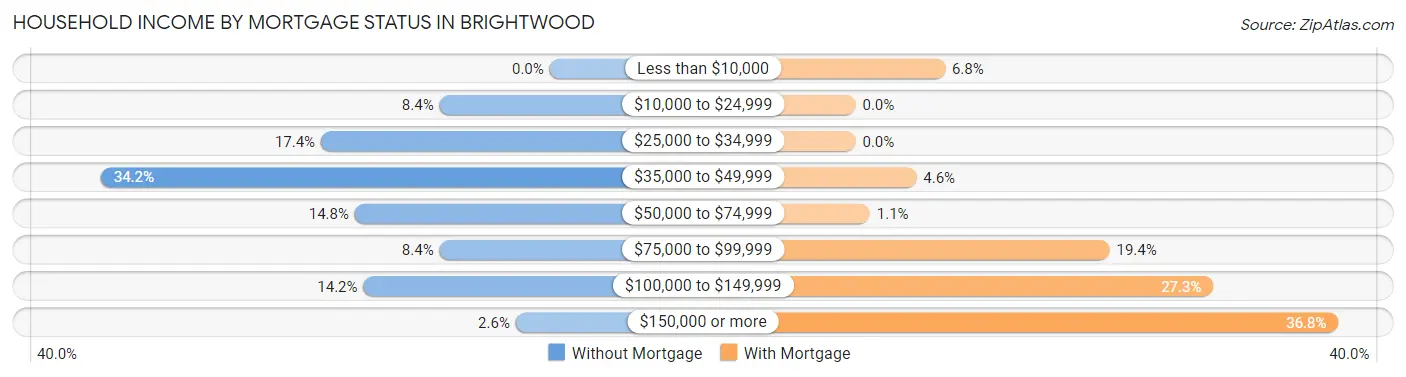
| Household Income | Without Mortgage | With Mortgage |
| Less than $10,000 | 0 (0.0%) | 25 (6.8%) |
| $10,000 to $24,999 | 13 (8.4%) | 0 (0.0%) |
| $25,000 to $34,999 | 27 (17.4%) | 0 (0.0%) |
| $35,000 to $49,999 | 53 (34.2%) | 17 (4.6%) |
| $50,000 to $74,999 | 23 (14.8%) | 4 (1.1%) |
| $75,000 to $99,999 | 13 (8.4%) | 71 (19.4%) |
| $100,000 to $149,999 | 22 (14.2%) | 100 (27.3%) |
| $150,000 or more | 4 (2.6%) | 135 (36.8%) |
| Total | 155 (100.0%) | 367 (100.0%) |
Property Value to Household Income Ratio in Brightwood
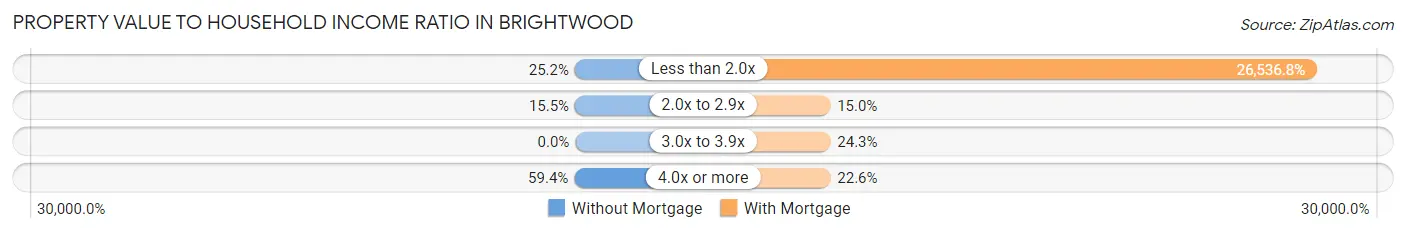
| Value-to-Income Ratio | Without Mortgage | With Mortgage |
| Less than 2.0x | 39 (25.2%) | 97,390 (26,536.8%) |
| 2.0x to 2.9x | 24 (15.5%) | 55 (15.0%) |
| 3.0x to 3.9x | 0 (0.0%) | 89 (24.2%) |
| 4.0x or more | 92 (59.4%) | 83 (22.6%) |
| Total | 155 (100.0%) | 367 (100.0%) |
Real Estate Taxes by Mortgage Status in Brightwood
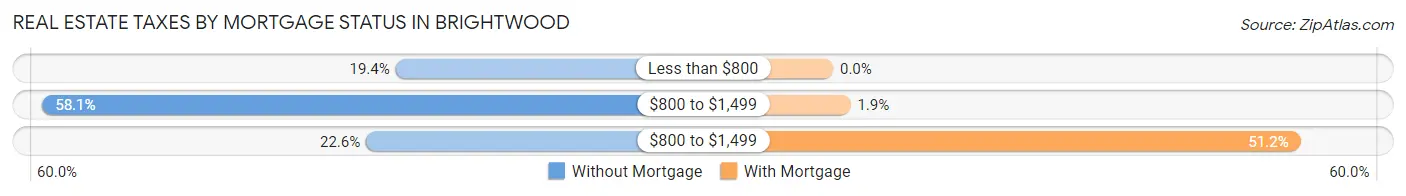
| Property Taxes | Without Mortgage | With Mortgage |
| Less than $800 | 30 (19.4%) | 0 (0.0%) |
| $800 to $1,499 | 90 (58.1%) | 7 (1.9%) |
| $800 to $1,499 | 35 (22.6%) | 188 (51.2%) |
| Total | 155 (100.0%) | 367 (100.0%) |
Health & Disability in Brightwood
Health Insurance Coverage by Age in Brightwood
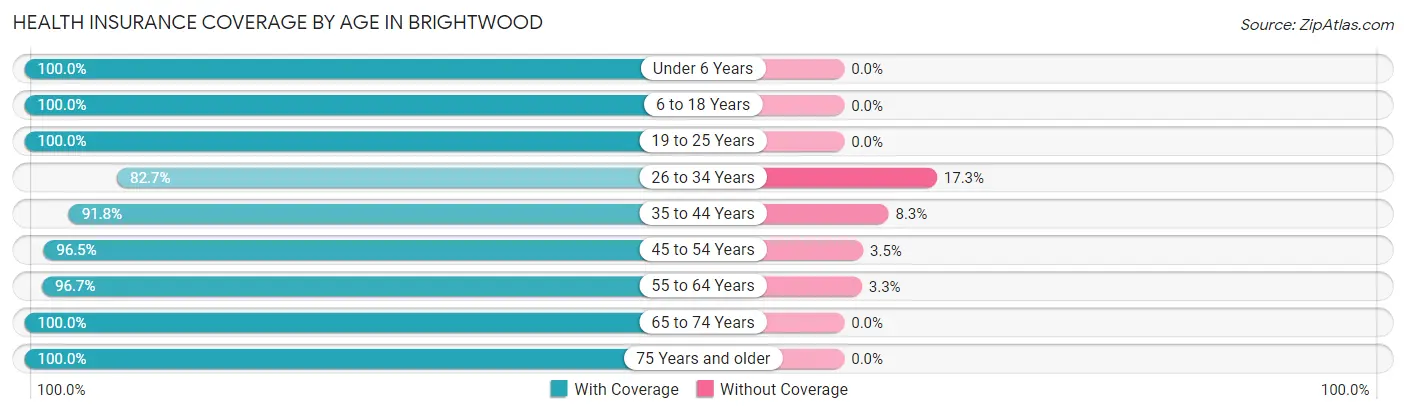
| Age Bracket | With Coverage | Without Coverage |
| Under 6 Years | 229 (100.0%) | 0 (0.0%) |
| 6 to 18 Years | 231 (100.0%) | 0 (0.0%) |
| 19 to 25 Years | 62 (100.0%) | 0 (0.0%) |
| 26 to 34 Years | 278 (82.7%) | 58 (17.3%) |
| 35 to 44 Years | 189 (91.7%) | 17 (8.3%) |
| 45 to 54 Years | 165 (96.5%) | 6 (3.5%) |
| 55 to 64 Years | 207 (96.7%) | 7 (3.3%) |
| 65 to 74 Years | 130 (100.0%) | 0 (0.0%) |
| 75 Years and older | 196 (100.0%) | 0 (0.0%) |
| Total | 1,687 (95.0%) | 88 (5.0%) |
Health Insurance Coverage by Citizenship Status in Brightwood
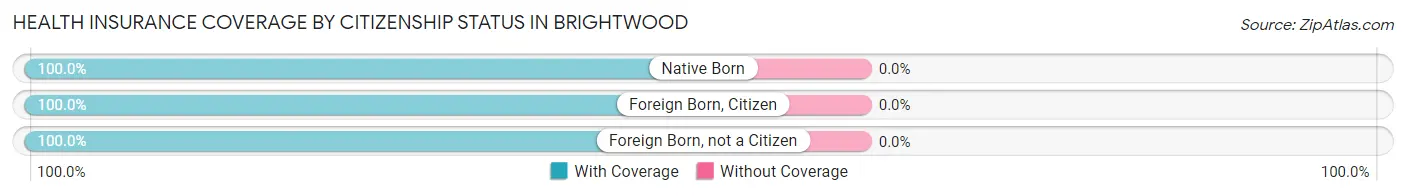
| Citizenship Status | With Coverage | Without Coverage |
| Native Born | 229 (100.0%) | 0 (0.0%) |
| Foreign Born, Citizen | 231 (100.0%) | 0 (0.0%) |
| Foreign Born, not a Citizen | 62 (100.0%) | 0 (0.0%) |
Health Insurance Coverage by Household Income in Brightwood
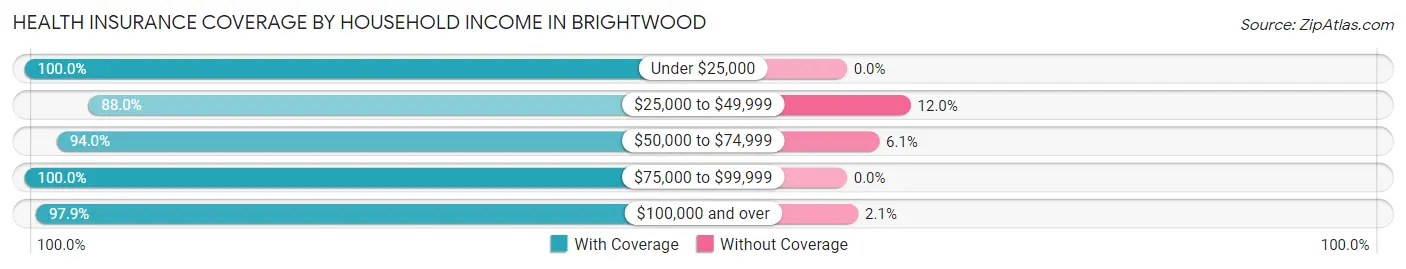
| Household Income | With Coverage | Without Coverage |
| Under $25,000 | 41 (100.0%) | 0 (0.0%) |
| $25,000 to $49,999 | 427 (88.0%) | 58 (12.0%) |
| $50,000 to $74,999 | 264 (94.0%) | 17 (6.0%) |
| $75,000 to $99,999 | 359 (100.0%) | 0 (0.0%) |
| $100,000 and over | 596 (97.9%) | 13 (2.1%) |
Public vs Private Health Insurance Coverage by Age in Brightwood
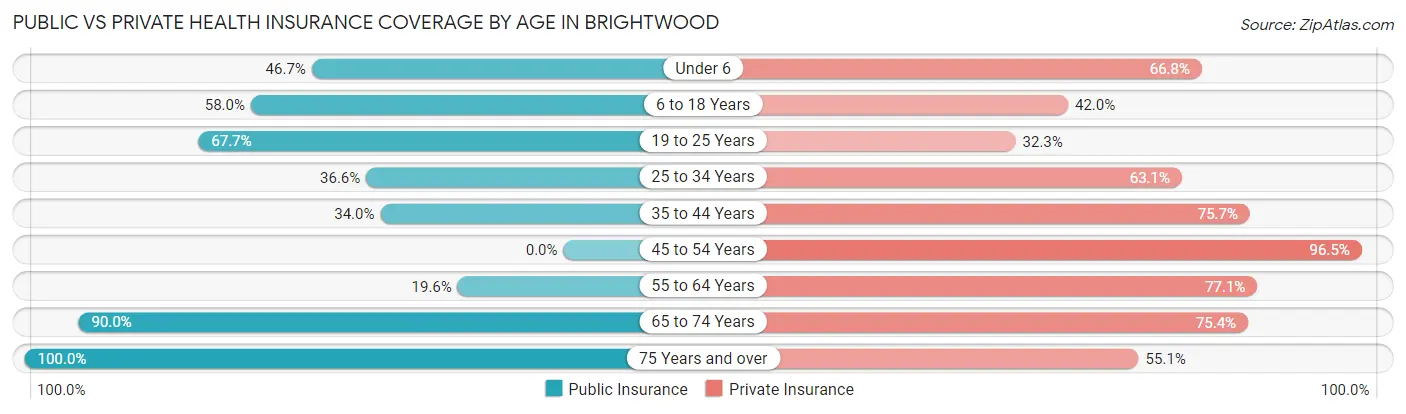
| Age Bracket | Public Insurance | Private Insurance |
| Under 6 | 107 (46.7%) | 153 (66.8%) |
| 6 to 18 Years | 134 (58.0%) | 97 (42.0%) |
| 19 to 25 Years | 42 (67.7%) | 20 (32.3%) |
| 25 to 34 Years | 123 (36.6%) | 212 (63.1%) |
| 35 to 44 Years | 70 (34.0%) | 156 (75.7%) |
| 45 to 54 Years | 0 (0.0%) | 165 (96.5%) |
| 55 to 64 Years | 42 (19.6%) | 165 (77.1%) |
| 65 to 74 Years | 117 (90.0%) | 98 (75.4%) |
| 75 Years and over | 196 (100.0%) | 108 (55.1%) |
| Total | 831 (46.8%) | 1,174 (66.1%) |
Disability Status by Sex by Age in Brightwood
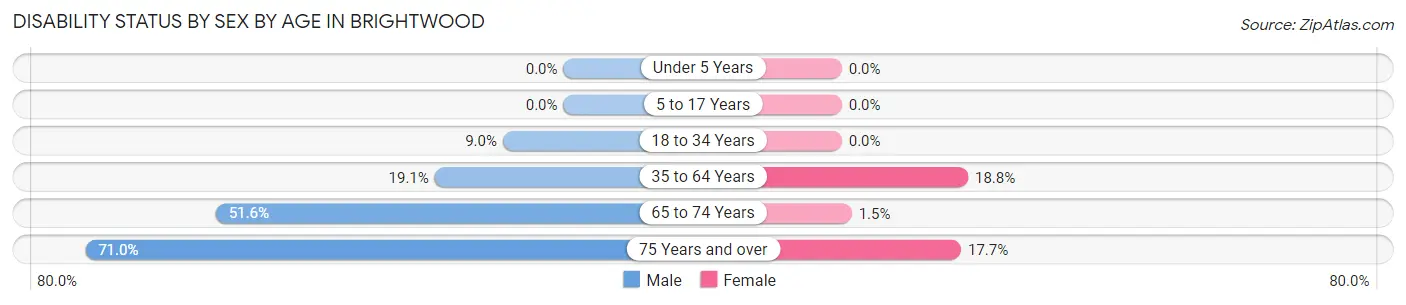
| Age Bracket | Male | Female |
| Under 5 Years | 0 (0.0%) | 0 (0.0%) |
| 5 to 17 Years | 0 (0.0%) | 0 (0.0%) |
| 18 to 34 Years | 16 (9.0%) | 0 (0.0%) |
| 35 to 64 Years | 61 (19.1%) | 51 (18.8%) |
| 65 to 74 Years | 32 (51.6%) | 1 (1.5%) |
| 75 Years and over | 71 (71.0%) | 17 (17.7%) |
Disability Class by Sex by Age in Brightwood
Disability Class: Hearing Difficulty
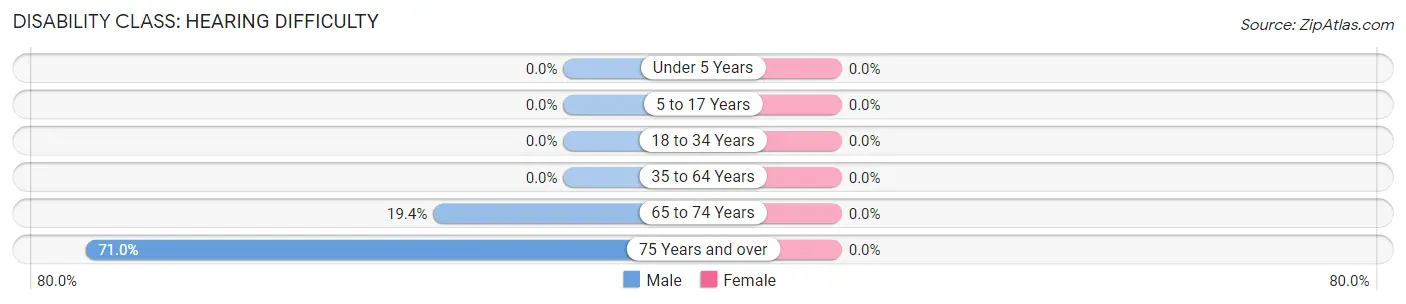
| Age Bracket | Male | Female |
| Under 5 Years | 0 (0.0%) | 0 (0.0%) |
| 5 to 17 Years | 0 (0.0%) | 0 (0.0%) |
| 18 to 34 Years | 0 (0.0%) | 0 (0.0%) |
| 35 to 64 Years | 0 (0.0%) | 0 (0.0%) |
| 65 to 74 Years | 12 (19.4%) | 0 (0.0%) |
| 75 Years and over | 71 (71.0%) | 0 (0.0%) |
Disability Class: Vision Difficulty
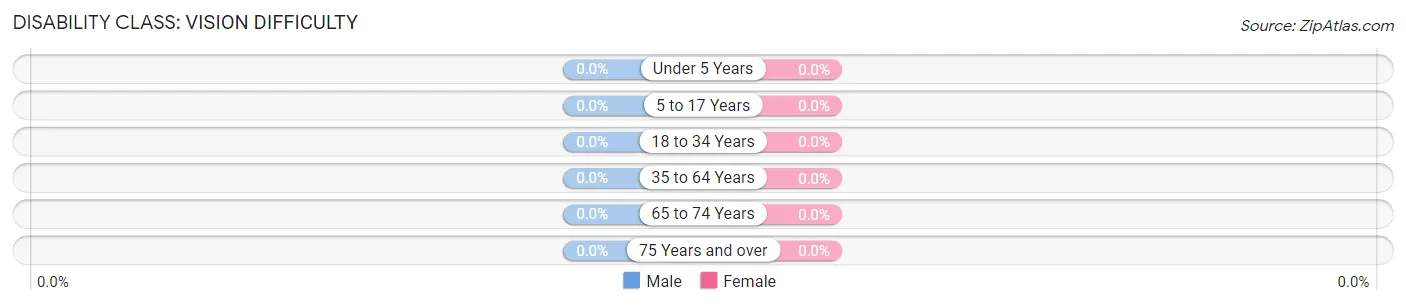
| Age Bracket | Male | Female |
| Under 5 Years | 0 (0.0%) | 0 (0.0%) |
| 5 to 17 Years | 0 (0.0%) | 0 (0.0%) |
| 18 to 34 Years | 0 (0.0%) | 0 (0.0%) |
| 35 to 64 Years | 0 (0.0%) | 0 (0.0%) |
| 65 to 74 Years | 0 (0.0%) | 0 (0.0%) |
| 75 Years and over | 0 (0.0%) | 0 (0.0%) |
Disability Class: Cognitive Difficulty
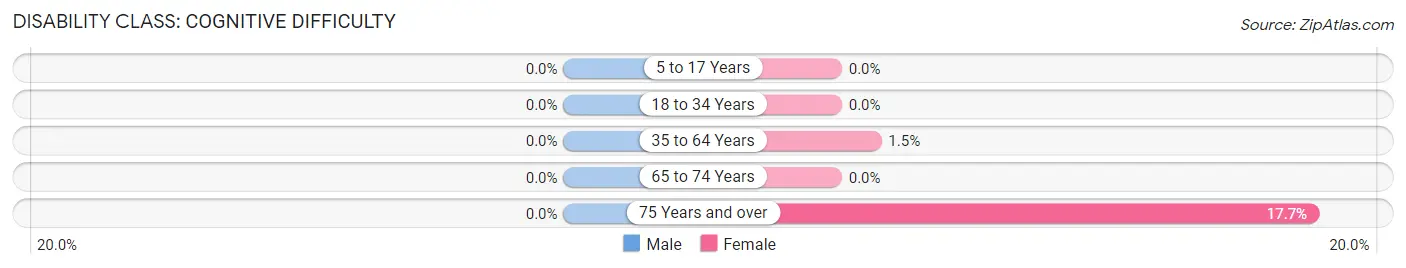
| Age Bracket | Male | Female |
| 5 to 17 Years | 0 (0.0%) | 0 (0.0%) |
| 18 to 34 Years | 0 (0.0%) | 0 (0.0%) |
| 35 to 64 Years | 0 (0.0%) | 4 (1.5%) |
| 65 to 74 Years | 0 (0.0%) | 0 (0.0%) |
| 75 Years and over | 0 (0.0%) | 17 (17.7%) |
Disability Class: Ambulatory Difficulty
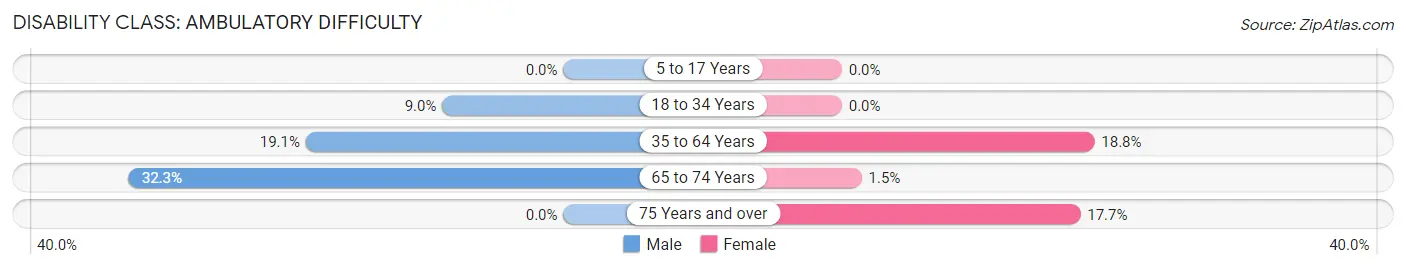
| Age Bracket | Male | Female |
| 5 to 17 Years | 0 (0.0%) | 0 (0.0%) |
| 18 to 34 Years | 16 (9.0%) | 0 (0.0%) |
| 35 to 64 Years | 61 (19.1%) | 51 (18.8%) |
| 65 to 74 Years | 20 (32.3%) | 1 (1.5%) |
| 75 Years and over | 0 (0.0%) | 17 (17.7%) |
Disability Class: Self-Care Difficulty
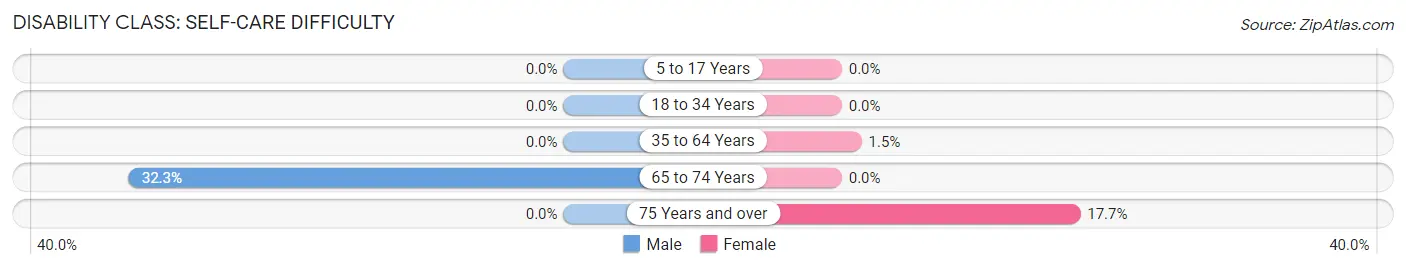
| Age Bracket | Male | Female |
| 5 to 17 Years | 0 (0.0%) | 0 (0.0%) |
| 18 to 34 Years | 0 (0.0%) | 0 (0.0%) |
| 35 to 64 Years | 0 (0.0%) | 4 (1.5%) |
| 65 to 74 Years | 20 (32.3%) | 0 (0.0%) |
| 75 Years and over | 0 (0.0%) | 17 (17.7%) |
Technology Access in Brightwood
Computing Device Access in Brightwood
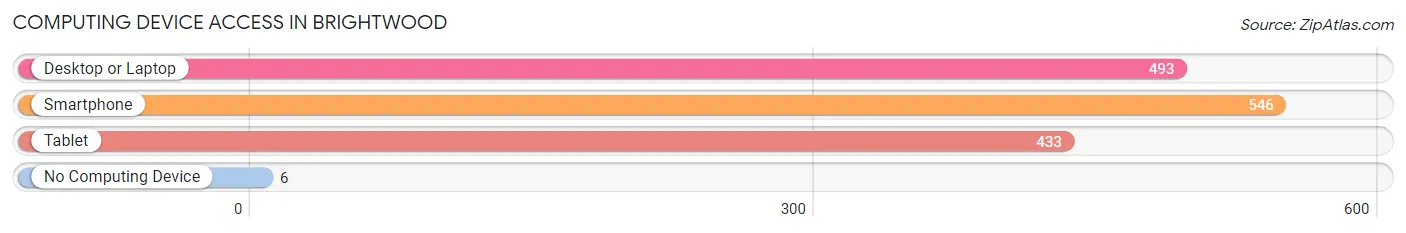
| Device Type | # Households | % Households |
| Desktop or Laptop | 493 | 84.7% |
| Smartphone | 546 | 93.8% |
| Tablet | 433 | 74.4% |
| No Computing Device | 6 | 1.0% |
| Total | 582 | 100.0% |
Internet Access in Brightwood
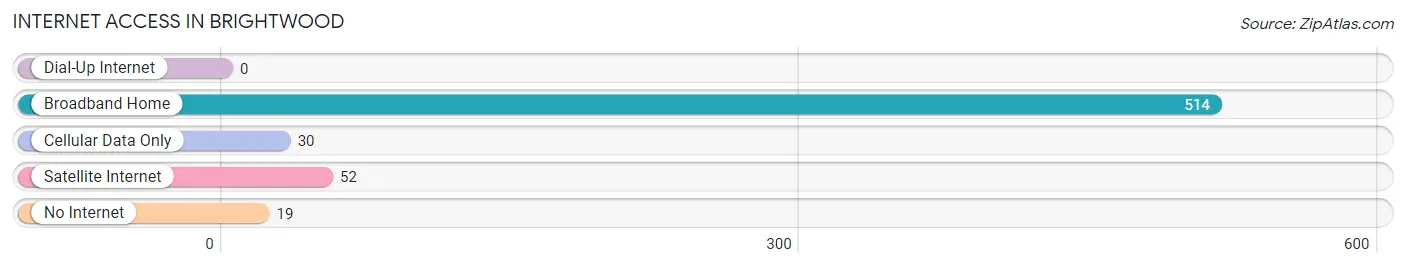
| Internet Type | # Households | % Households |
| Dial-Up Internet | 0 | 0.0% |
| Broadband Home | 514 | 88.3% |
| Cellular Data Only | 30 | 5.1% |
| Satellite Internet | 52 | 8.9% |
| No Internet | 19 | 3.3% |
| Total | 582 | 100.0% |
Brightwood Summary
Brightwood is a small unincorporated community located in the northern part of Fairfax County, Virginia. It is situated between the towns of Vienna and Fairfax, and is bordered by the Potomac River to the north and the Occoquan River to the south. The community is part of the Washington Metropolitan Area and is located approximately 20 miles from downtown Washington, D.C.
History
Brightwood was first settled in the late 1700s by a group of German immigrants. The area was originally known as “Brightwood” due to the bright sunlight that shone through the trees in the area. The community was largely agricultural, with many of the settlers growing wheat, corn, and other crops.
In the early 1900s, the area began to experience rapid growth as the Washington, D.C. metropolitan area expanded. The population of Brightwood increased significantly, and the area began to develop into a residential community. In the 1950s, the area was annexed by Fairfax County and became part of the county’s urban growth boundary.
Geography
Brightwood is located in the northern part of Fairfax County, Virginia. It is situated between the towns of Vienna and Fairfax, and is bordered by the Potomac River to the north and the Occoquan River to the south. The community is part of the Washington Metropolitan Area and is located approximately 20 miles from downtown Washington, D.C.
The area is characterized by rolling hills and wooded areas, with the highest point in the area being the summit of Brightwood Mountain, which rises to an elevation of 845 feet. The area is also home to several small streams, including the Little Rocky Run, which flows through the community.
Economy
Brightwood is primarily a residential community, with most of the area’s residents employed in the nearby cities of Vienna and Fairfax. The area is also home to several small businesses, including restaurants, retail stores, and professional services.
The area is also home to several government agencies, including the National Geospatial-Intelligence Agency, the National Reconnaissance Office, and the National Counterterrorism Center. These agencies employ a significant number of people in the area, providing a boost to the local economy.
Demographics
As of the 2010 census, the population of Brightwood was 8,945. The racial makeup of the area was 79.3% White, 11.2% African American, 4.2% Asian, and 5.3% from other races. The median household income was $90,945, and the median home value was $521,000.
The area is home to a diverse population, with a variety of religious and cultural backgrounds. The area is also home to a large number of immigrants, with the largest groups being from India, China, and El Salvador.
Conclusion
Brightwood is a small unincorporated community located in the northern part of Fairfax County, Virginia. It is situated between the towns of Vienna and Fairfax, and is bordered by the Potomac River to the north and the Occoquan River to the south. The community is part of the Washington Metropolitan Area and is located approximately 20 miles from downtown Washington, D.C. The area is primarily residential, with most of the area’s residents employed in the nearby cities of Vienna and Fairfax. The area is also home to several government agencies, providing a boost to the local economy. The population of Brightwood is diverse, with a variety of religious and cultural backgrounds.
Common Questions
What is Per Capita Income in Brightwood?
Per Capita income in Brightwood is $31,180.
What is the Median Family Income in Brightwood?
Median Family Income in Brightwood is $85,404.
What is the Median Household income in Brightwood?
Median Household Income in Brightwood is $85,735.
What is Income or Wage Gap in Brightwood?
Income or Wage Gap in Brightwood is 18.3%.
Women in Brightwood earn 81.7 cents for every dollar earned by a man.
What is Inequality or Gini Index in Brightwood?
Inequality or Gini Index in Brightwood is 0.29.
What is the Total Population of Brightwood?
Total Population of Brightwood is 1,775.
What is the Total Male Population of Brightwood?
Total Male Population of Brightwood is 855.
What is the Total Female Population of Brightwood?
Total Female Population of Brightwood is 920.
What is the Ratio of Males per 100 Females in Brightwood?
There are 92.93 Males per 100 Females in Brightwood.
What is the Ratio of Females per 100 Males in Brightwood?
There are 107.60 Females per 100 Males in Brightwood.
What is the Median Population Age in Brightwood?
Median Population Age in Brightwood is 36.9 Years.
What is the Average Family Size in Brightwood
Average Family Size in Brightwood is 3.7 People.
What is the Average Household Size in Brightwood
Average Household Size in Brightwood is 3.0 People.
How Large is the Labor Force in Brightwood?
There are 983 People in the Labor Forcein in Brightwood.
What is the Percentage of People in the Labor Force in Brightwood?
71.9% of People are in the Labor Force in Brightwood.
What is the Unemployment Rate in Brightwood?
Unemployment Rate in Brightwood is 3.0%.