Deadwood, SD Map & Demographics
Deadwood Map
Deadwood Overview
$33,089
PER CAPITA INCOME
$78,125
AVG FAMILY INCOME
$50,478
AVG HOUSEHOLD INCOME
3.4%
WAGE / INCOME GAP [ % ]
96.6¢/ $1
WAGE / INCOME GAP [ $ ]
0.43
INEQUALITY / GINI INDEX
1,423
TOTAL POPULATION
795
MALE POPULATION
628
FEMALE POPULATION
126.59
MALES / 100 FEMALES
78.99
FEMALES / 100 MALES
50.3
MEDIAN AGE
2.9
AVG FAMILY SIZE
1.9
AVG HOUSEHOLD SIZE
769
LABOR FORCE [ PEOPLE ]
60.0%
PERCENT IN LABOR FORCE
4.6%
UNEMPLOYMENT RATE
Deadwood Zip Codes
Deadwood Area Codes
Income in Deadwood
Income Overview in Deadwood
Per Capita Income in Deadwood is $33,089, while median incomes of families and households are $78,125 and $50,478 respectively.
| Characteristic | Number | Measure |
| Per Capita Income | 1,423 | $33,089 |
| Median Family Income | 308 | $78,125 |
| Mean Family Income | 308 | $87,727 |
| Median Household Income | 709 | $50,478 |
| Mean Household Income | 709 | $62,355 |
| Income Deficit | 308 | $0 |
| Wage / Income Gap (%) | 1,423 | 3.39% |
| Wage / Income Gap ($) | 1,423 | 96.61¢ per $1 |
| Gini / Inequality Index | 1,423 | 0.43 |
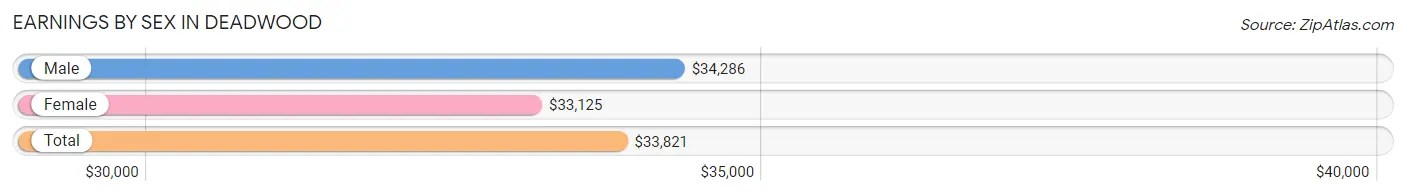
Earnings by Sex in Deadwood
Average Earnings in Deadwood are $33,821, $34,286 for men and $33,125 for women, a difference of 3.4%.
| Sex | Number | Average Earnings |
| Male | 550 (64.5%) | $34,286 |
| Female | 303 (35.5%) | $33,125 |
| Total | 853 (100.0%) | $33,821 |
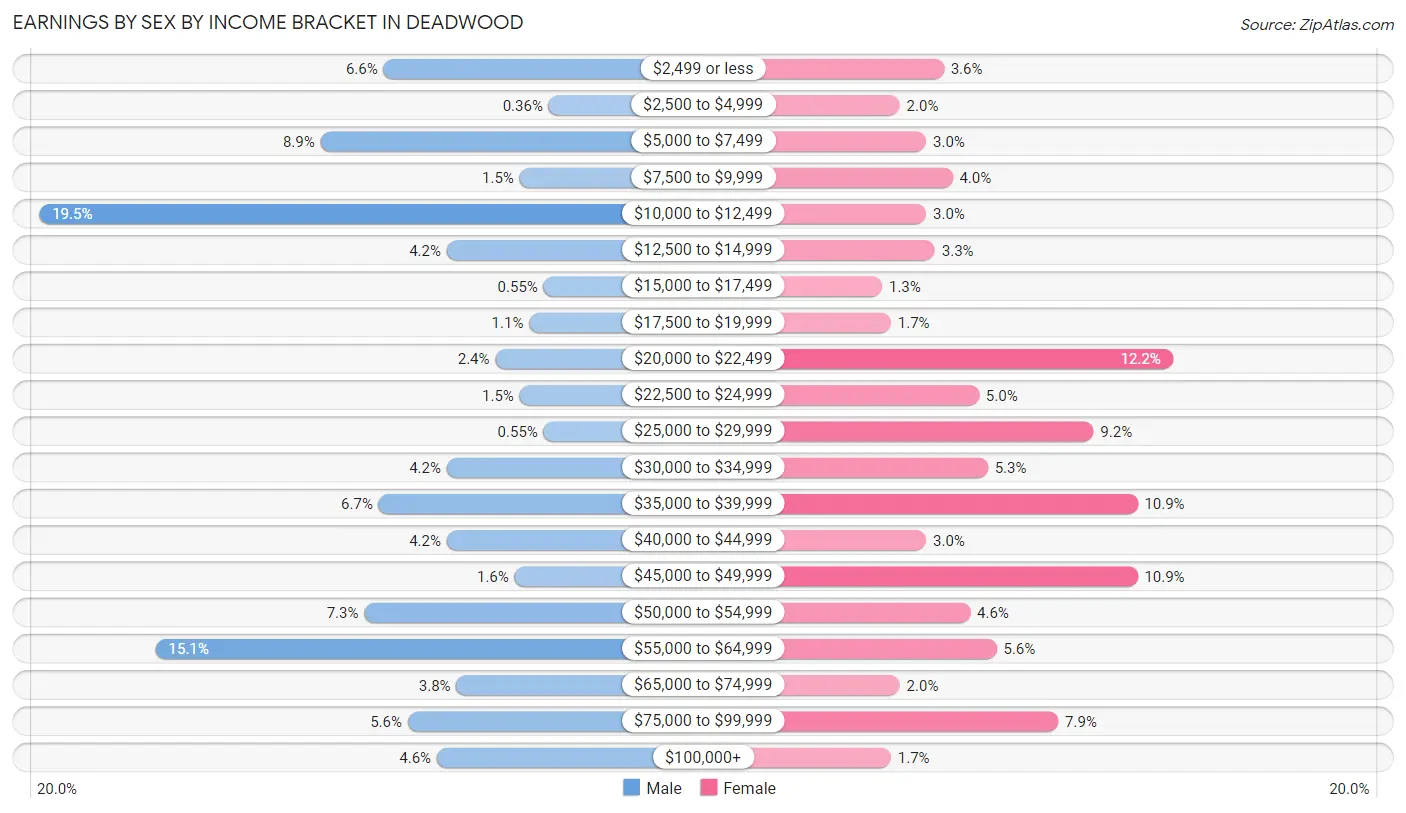
Earnings by Sex by Income Bracket in Deadwood
The most common earnings brackets in Deadwood are $10,000 to $12,499 for men (107 | 19.5%) and $20,000 to $22,499 for women (37 | 12.2%).
| Income | Male | Female |
| $2,499 or less | 36 (6.6%) | 11 (3.6%) |
| $2,500 to $4,999 | 2 (0.4%) | 6 (2.0%) |
| $5,000 to $7,499 | 49 (8.9%) | 9 (3.0%) |
| $7,500 to $9,999 | 8 (1.5%) | 12 (4.0%) |
| $10,000 to $12,499 | 107 (19.5%) | 9 (3.0%) |
| $12,500 to $14,999 | 23 (4.2%) | 10 (3.3%) |
| $15,000 to $17,499 | 3 (0.5%) | 4 (1.3%) |
| $17,500 to $19,999 | 6 (1.1%) | 5 (1.7%) |
| $20,000 to $22,499 | 13 (2.4%) | 37 (12.2%) |
| $22,500 to $24,999 | 8 (1.5%) | 15 (5.0%) |
| $25,000 to $29,999 | 3 (0.5%) | 28 (9.2%) |
| $30,000 to $34,999 | 23 (4.2%) | 16 (5.3%) |
| $35,000 to $39,999 | 37 (6.7%) | 33 (10.9%) |
| $40,000 to $44,999 | 23 (4.2%) | 9 (3.0%) |
| $45,000 to $49,999 | 9 (1.6%) | 33 (10.9%) |
| $50,000 to $54,999 | 40 (7.3%) | 14 (4.6%) |
| $55,000 to $64,999 | 83 (15.1%) | 17 (5.6%) |
| $65,000 to $74,999 | 21 (3.8%) | 6 (2.0%) |
| $75,000 to $99,999 | 31 (5.6%) | 24 (7.9%) |
| $100,000+ | 25 (4.5%) | 5 (1.7%) |
| Total | 550 (100.0%) | 303 (100.0%) |
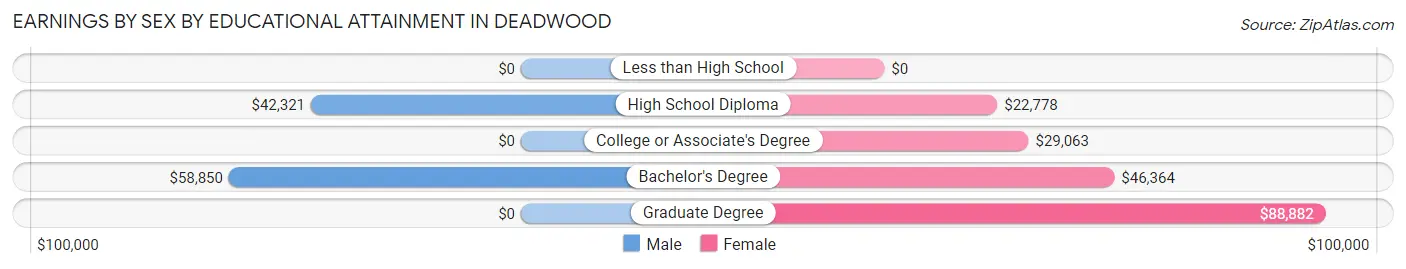
Earnings by Sex by Educational Attainment in Deadwood
Average earnings in Deadwood are $39,097 for men and $34,732 for women, a difference of 11.2%. Men with an educational attainment of bachelor's degree enjoy the highest average annual earnings of $58,850, while those with high school diploma education earn the least with $42,321. Women with an educational attainment of graduate degree earn the most with the average annual earnings of $88,882, while those with high school diploma education have the smallest earnings of $22,778.
| Educational Attainment | Male Income | Female Income |
| Less than High School | - | - |
| High School Diploma | $42,321 | $22,778 |
| College or Associate's Degree | - | - |
| Bachelor's Degree | $58,850 | $46,364 |
| Graduate Degree | - | - |
| Total | $39,097 | $34,732 |
Family Income in Deadwood
Family Income Brackets in Deadwood
According to the Deadwood family income data, there are 109 families falling into the $50,000 to $74,999 income range, which is the most common income bracket and makes up 35.4% of all families.
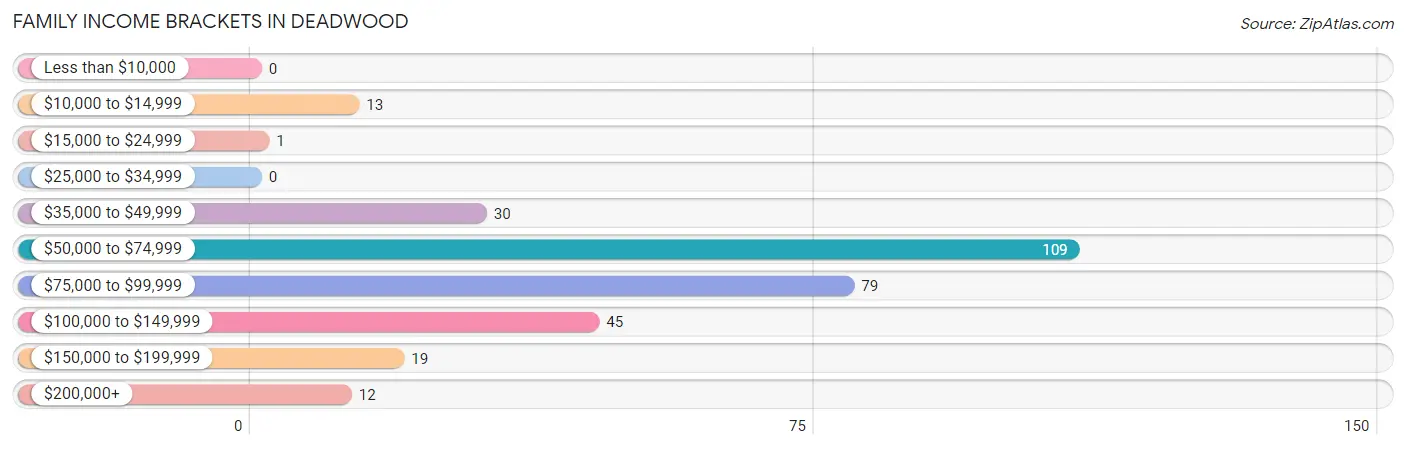
| Income Bracket | # Families | % Families |
| Less than $10,000 | 0 | 0.0% |
| $10,000 to $14,999 | 13 | 4.2% |
| $15,000 to $24,999 | 1 | 0.3% |
| $25,000 to $34,999 | 0 | 0.0% |
| $35,000 to $49,999 | 30 | 9.7% |
| $50,000 to $74,999 | 109 | 35.4% |
| $75,000 to $99,999 | 79 | 25.6% |
| $100,000 to $149,999 | 45 | 14.6% |
| $150,000 to $199,999 | 19 | 6.2% |
| $200,000+ | 12 | 3.9% |
Family Income by Famaliy Size in Deadwood
4-person families (54 | 17.5%) account for the highest median family income in Deadwood with $91,458 per family, while 3-person families (53 | 17.2%) have the highest median income of $29,968 per family member.
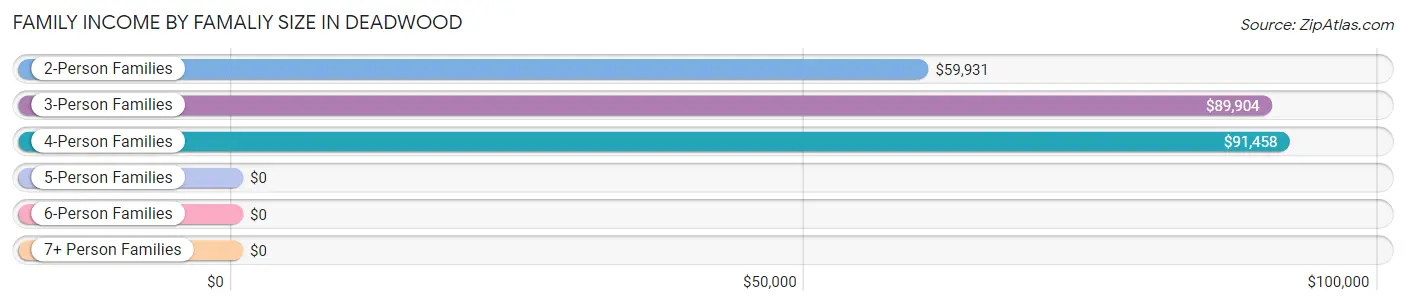
| Income Bracket | # Families | Median Income |
| 2-Person Families | 196 (63.6%) | $59,931 |
| 3-Person Families | 53 (17.2%) | $89,904 |
| 4-Person Families | 54 (17.5%) | $91,458 |
| 5-Person Families | 0 (0.0%) | $0 |
| 6-Person Families | 5 (1.6%) | $0 |
| 7+ Person Families | 0 (0.0%) | $0 |
| Total | 308 (100.0%) | $78,125 |
Family Income by Number of Earners in Deadwood
The median family income in Deadwood is $78,125, with families comprising 3+ earners (38) having the highest median family income of $185,500, while families with no earners (57) have the lowest median family income of $48,594, accounting for 12.3% and 18.5% of families, respectively.
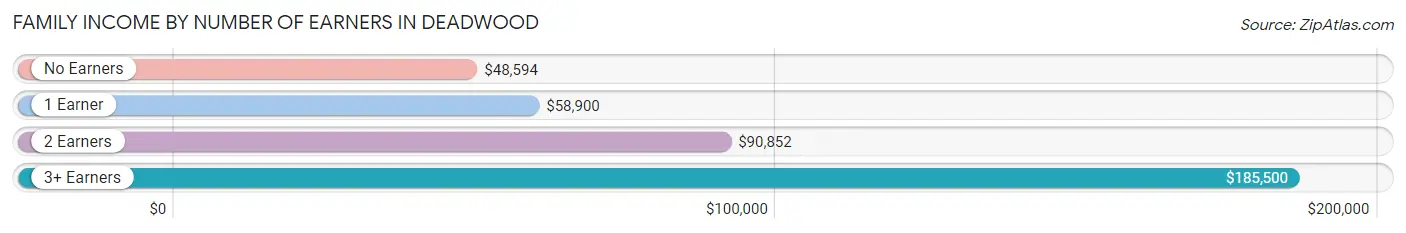
| Number of Earners | # Families | Median Income |
| No Earners | 57 (18.5%) | $48,594 |
| 1 Earner | 80 (26.0%) | $58,900 |
| 2 Earners | 133 (43.2%) | $90,852 |
| 3+ Earners | 38 (12.3%) | $185,500 |
| Total | 308 (100.0%) | $78,125 |
Household Income in Deadwood
Household Income Brackets in Deadwood
With 197 households falling in the category, the $15,000 to $24,999 income range is the most frequent in Deadwood, accounting for 27.8% of all households. In contrast, only 17 households (2.4%) fall into the less than $10,000 income bracket, making it the least populous group.
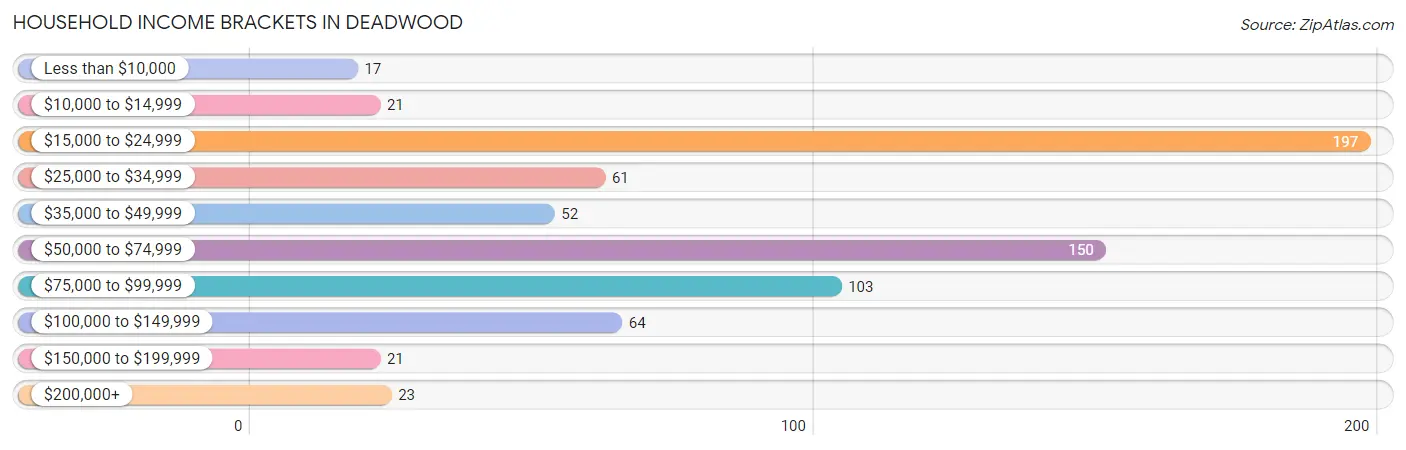
| Income Bracket | # Households | % Households |
| Less than $10,000 | 17 | 2.4% |
| $10,000 to $14,999 | 21 | 3.0% |
| $15,000 to $24,999 | 197 | 27.8% |
| $25,000 to $34,999 | 61 | 8.6% |
| $35,000 to $49,999 | 52 | 7.3% |
| $50,000 to $74,999 | 150 | 21.2% |
| $75,000 to $99,999 | 103 | 14.5% |
| $100,000 to $149,999 | 64 | 9.0% |
| $150,000 to $199,999 | 21 | 3.0% |
| $200,000+ | 23 | 3.2% |
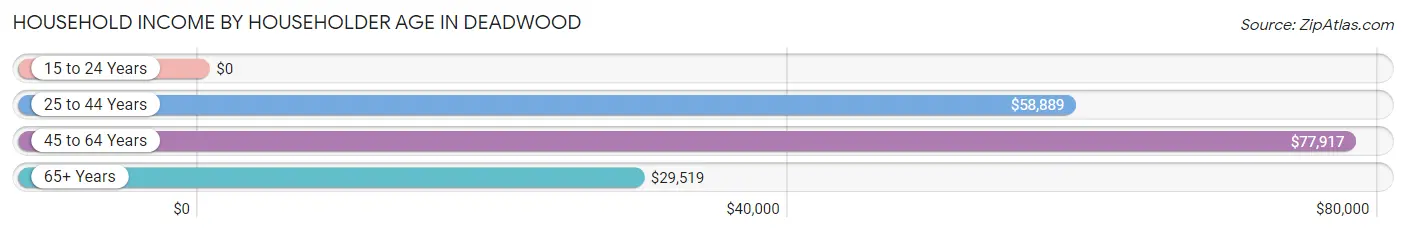
Household Income by Householder Age in Deadwood
The median household income in Deadwood is $50,478, with the highest median household income of $77,917 found in the 45 to 64 years age bracket for the primary householder. A total of 231 households (32.6%) fall into this category. Meanwhile, the 15 to 24 years age bracket for the primary householder has the lowest median household income of $0, with 21 households (3.0%) in this group.
| Income Bracket | # Households | Median Income |
| 15 to 24 Years | 21 (3.0%) | $0 |
| 25 to 44 Years | 130 (18.3%) | $58,889 |
| 45 to 64 Years | 231 (32.6%) | $77,917 |
| 65+ Years | 327 (46.1%) | $29,519 |
| Total | 709 (100.0%) | $50,478 |
Poverty in Deadwood
Income Below Poverty by Sex and Age in Deadwood
With 9.7% poverty level for males and 9.7% for females among the residents of Deadwood, 16 and 17 year old males and 25 to 34 year old females are the most vulnerable to poverty, with 13 males (44.8%) and 25 females (35.7%) in their respective age groups living below the poverty level.
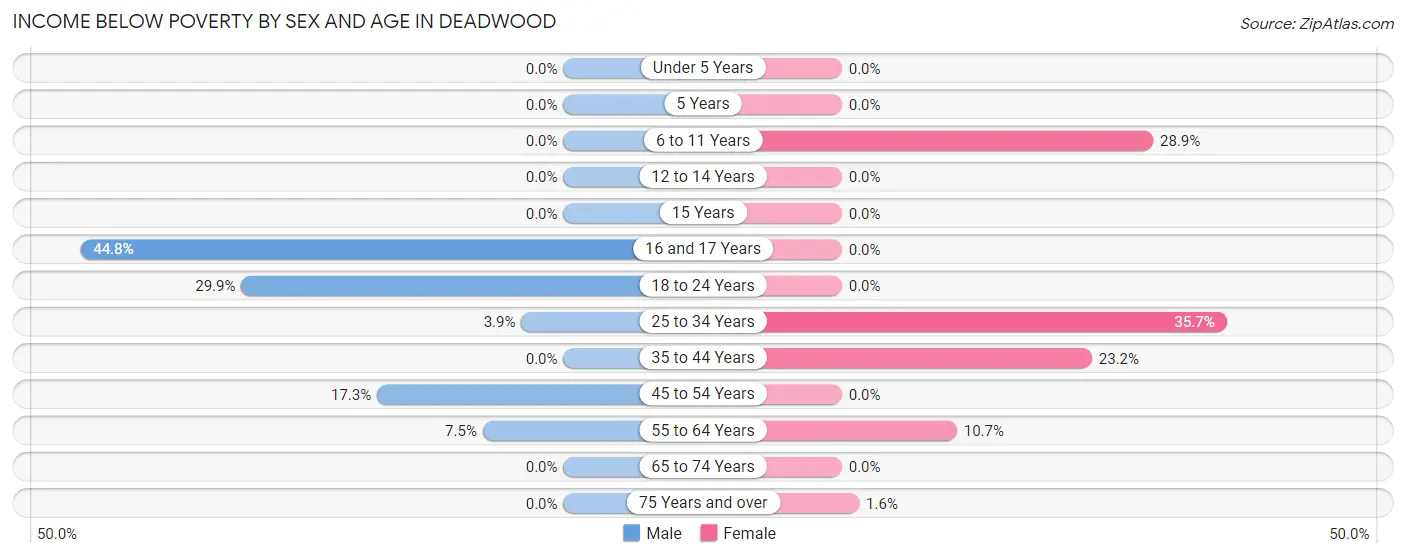
| Age Bracket | Male | Female |
| Under 5 Years | 0 (0.0%) | 0 (0.0%) |
| 5 Years | 0 (0.0%) | 0 (0.0%) |
| 6 to 11 Years | 0 (0.0%) | 13 (28.9%) |
| 12 to 14 Years | 0 (0.0%) | 0 (0.0%) |
| 15 Years | 0 (0.0%) | 0 (0.0%) |
| 16 and 17 Years | 13 (44.8%) | 0 (0.0%) |
| 18 to 24 Years | 26 (29.9%) | 0 (0.0%) |
| 25 to 34 Years | 3 (3.9%) | 25 (35.7%) |
| 35 to 44 Years | 0 (0.0%) | 13 (23.2%) |
| 45 to 54 Years | 23 (17.3%) | 0 (0.0%) |
| 55 to 64 Years | 8 (7.5%) | 8 (10.7%) |
| 65 to 74 Years | 0 (0.0%) | 0 (0.0%) |
| 75 Years and over | 0 (0.0%) | 1 (1.6%) |
| Total | 73 (9.7%) | 60 (9.7%) |
Income Above Poverty by Sex and Age in Deadwood
According to the poverty statistics in Deadwood, males aged under 5 years and females aged under 5 years are the age groups that are most secure financially, with 100.0% of males and 100.0% of females in these age groups living above the poverty line.
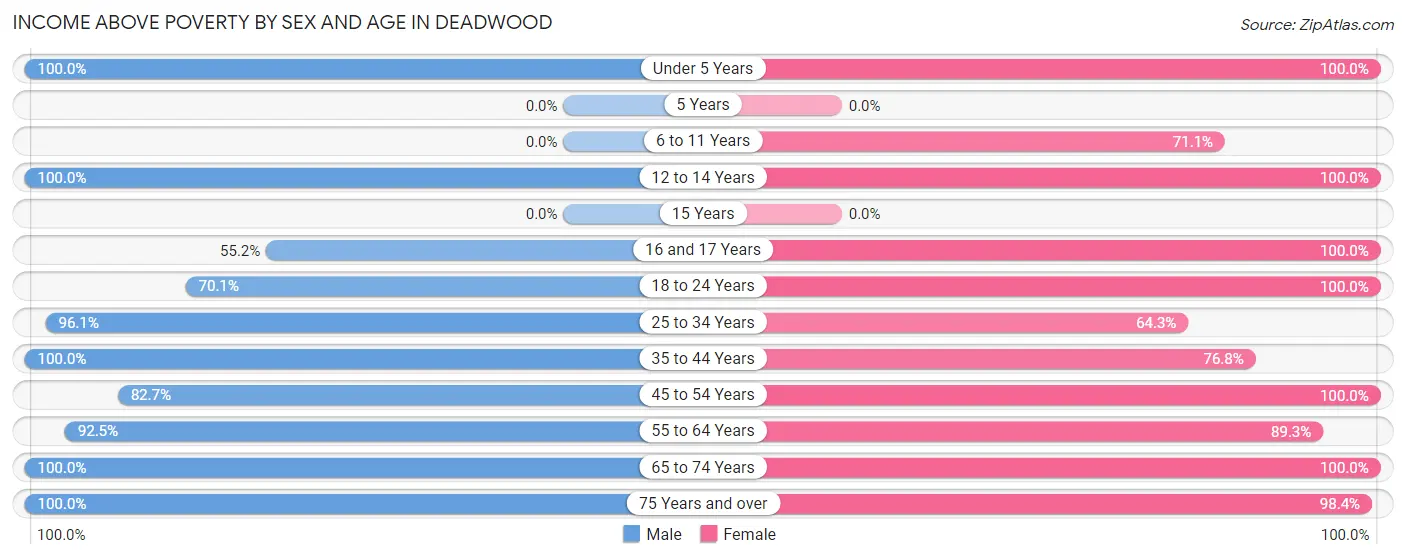
| Age Bracket | Male | Female |
| Under 5 Years | 4 (100.0%) | 34 (100.0%) |
| 5 Years | 0 (0.0%) | 0 (0.0%) |
| 6 to 11 Years | 0 (0.0%) | 32 (71.1%) |
| 12 to 14 Years | 3 (100.0%) | 47 (100.0%) |
| 15 Years | 0 (0.0%) | 0 (0.0%) |
| 16 and 17 Years | 16 (55.2%) | 3 (100.0%) |
| 18 to 24 Years | 61 (70.1%) | 42 (100.0%) |
| 25 to 34 Years | 74 (96.1%) | 45 (64.3%) |
| 35 to 44 Years | 43 (100.0%) | 43 (76.8%) |
| 45 to 54 Years | 110 (82.7%) | 108 (100.0%) |
| 55 to 64 Years | 99 (92.5%) | 67 (89.3%) |
| 65 to 74 Years | 219 (100.0%) | 78 (100.0%) |
| 75 Years and over | 52 (100.0%) | 61 (98.4%) |
| Total | 681 (90.3%) | 560 (90.3%) |
Income Below Poverty Among Married-Couple Families in Deadwood
The poverty statistics for married-couple families in Deadwood show that 5.5% or 13 of the total 237 families live below the poverty line. Families with 1 or 2 children have the highest poverty rate of 22.8%, comprising of 13 families. On the other hand, families with no children have the lowest poverty rate of 0.0%, which includes 0 families.
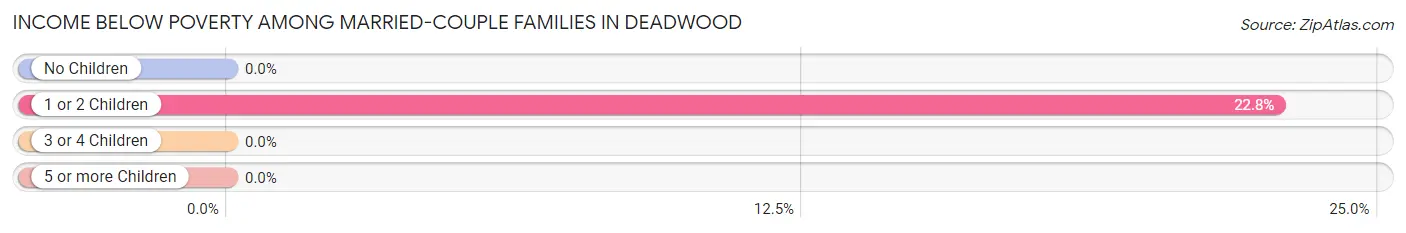
| Children | Above Poverty | Below Poverty |
| No Children | 180 (100.0%) | 0 (0.0%) |
| 1 or 2 Children | 44 (77.2%) | 13 (22.8%) |
| 3 or 4 Children | 0 (0.0%) | 0 (0.0%) |
| 5 or more Children | 0 (0.0%) | 0 (0.0%) |
| Total | 224 (94.5%) | 13 (5.5%) |
Income Below Poverty Among Single-Parent Households in Deadwood
| Children | Single Father | Single Mother |
| No Children | 0 (0.0%) | 0 (0.0%) |
| 1 or 2 Children | 0 (0.0%) | 0 (0.0%) |
| 3 or 4 Children | 0 (0.0%) | 0 (0.0%) |
| 5 or more Children | 0 (0.0%) | 0 (0.0%) |
| Total | 0 (0.0%) | 0 (0.0%) |
Income Below Poverty Among Married-Couple vs Single-Parent Households in Deadwood
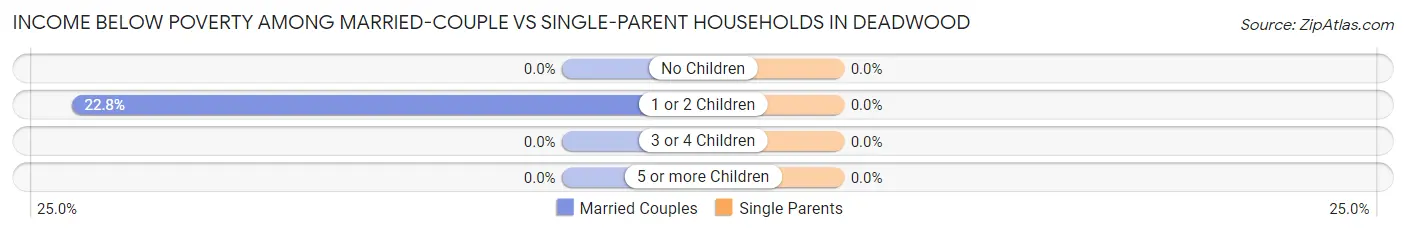
| Children | Married-Couple Families | Single-Parent Households |
| No Children | 0 (0.0%) | 0 (0.0%) |
| 1 or 2 Children | 13 (22.8%) | 0 (0.0%) |
| 3 or 4 Children | 0 (0.0%) | 0 (0.0%) |
| 5 or more Children | 0 (0.0%) | 0 (0.0%) |
| Total | 13 (5.5%) | 0 (0.0%) |
Race in Deadwood
The most populous races in Deadwood are White / Caucasian (1,315 | 92.4%), Hispanic or Latino (77 | 5.4%), and Two or more Races (73 | 5.1%).
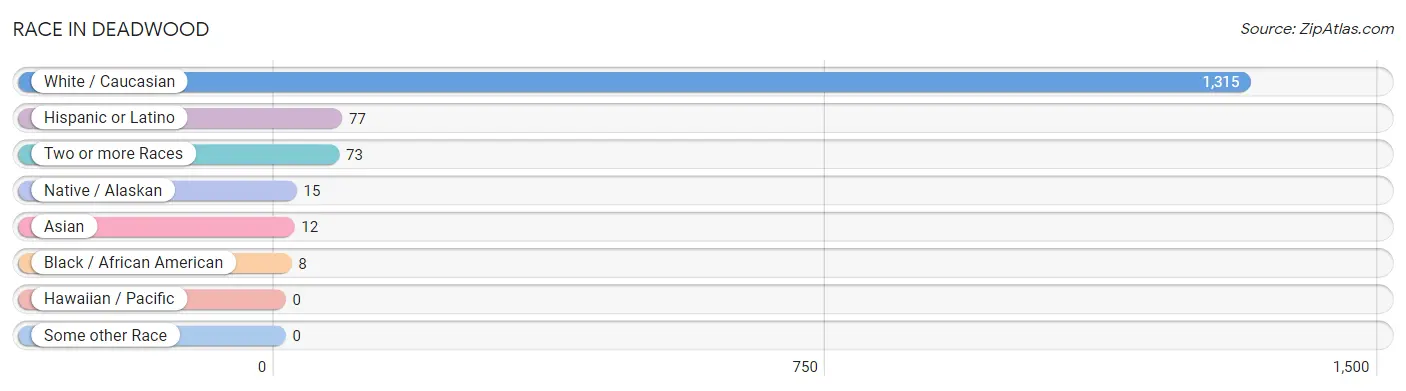
| Race | # Population | % Population |
| Asian | 12 | 0.8% |
| Black / African American | 8 | 0.6% |
| Hawaiian / Pacific | 0 | 0.0% |
| Hispanic or Latino | 77 | 5.4% |
| Native / Alaskan | 15 | 1.1% |
| White / Caucasian | 1,315 | 92.4% |
| Two or more Races | 73 | 5.1% |
| Some other Race | 0 | 0.0% |
| Total | 1,423 | 100.0% |
Ancestry in Deadwood
The most populous ancestries reported in Deadwood are German (455 | 32.0%), Irish (177 | 12.4%), Norwegian (175 | 12.3%), English (115 | 8.1%), and American (112 | 7.9%), together accounting for 72.7% of all Deadwood residents.
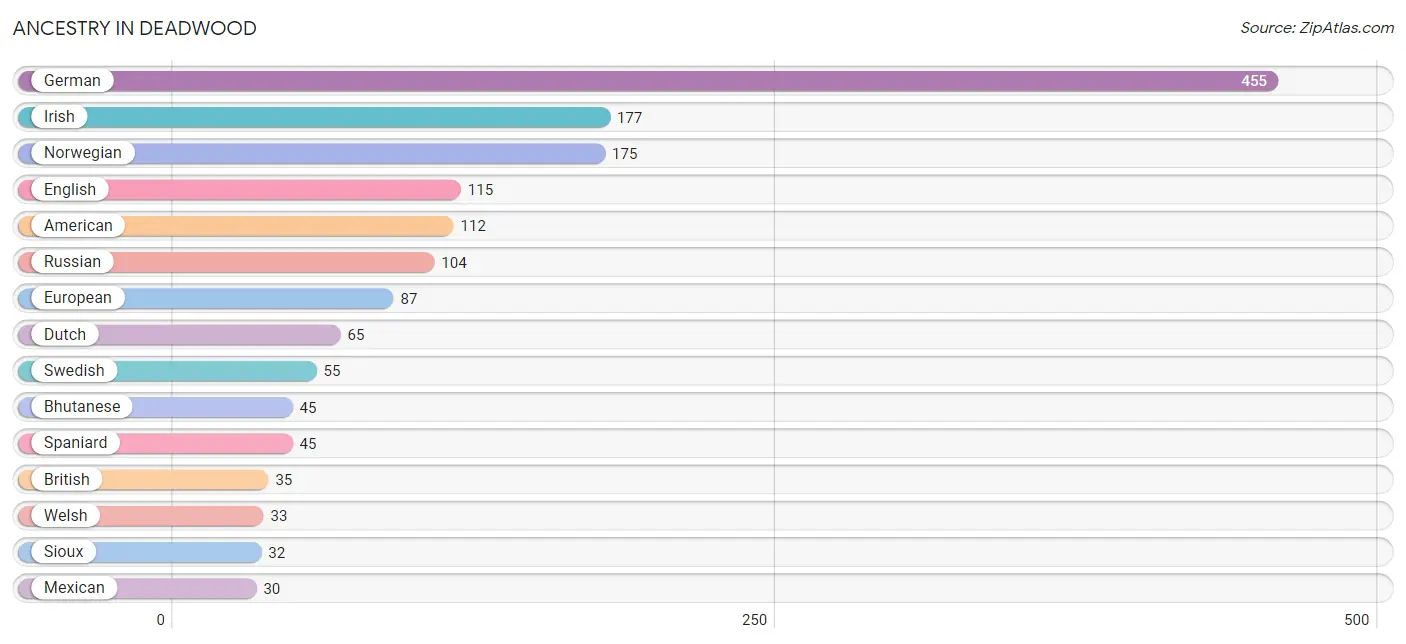
| Ancestry | # Population | % Population |
| American | 112 | 7.9% |
| Arab | 1 | 0.1% |
| Belgian | 8 | 0.6% |
| Bhutanese | 45 | 3.2% |
| British | 35 | 2.5% |
| Central American | 2 | 0.1% |
| Cherokee | 11 | 0.8% |
| Costa Rican | 2 | 0.1% |
| Croatian | 15 | 1.1% |
| Czech | 23 | 1.6% |
| Danish | 21 | 1.5% |
| Dutch | 65 | 4.6% |
| English | 115 | 8.1% |
| European | 87 | 6.1% |
| Finnish | 5 | 0.4% |
| French | 22 | 1.5% |
| French Canadian | 13 | 0.9% |
| German | 455 | 32.0% |
| Hungarian | 2 | 0.1% |
| Irish | 177 | 12.4% |
| Italian | 19 | 1.3% |
| Jamaican | 6 | 0.4% |
| Lebanese | 1 | 0.1% |
| Mexican | 30 | 2.1% |
| Northern European | 2 | 0.1% |
| Norwegian | 175 | 12.3% |
| Pakistani | 6 | 0.4% |
| Polish | 20 | 1.4% |
| Potawatomi | 3 | 0.2% |
| Russian | 104 | 7.3% |
| Scandinavian | 13 | 0.9% |
| Scottish | 21 | 1.5% |
| Sioux | 32 | 2.2% |
| Spaniard | 45 | 3.2% |
| Swedish | 55 | 3.9% |
| Welsh | 33 | 2.3% | View All 36 Rows |
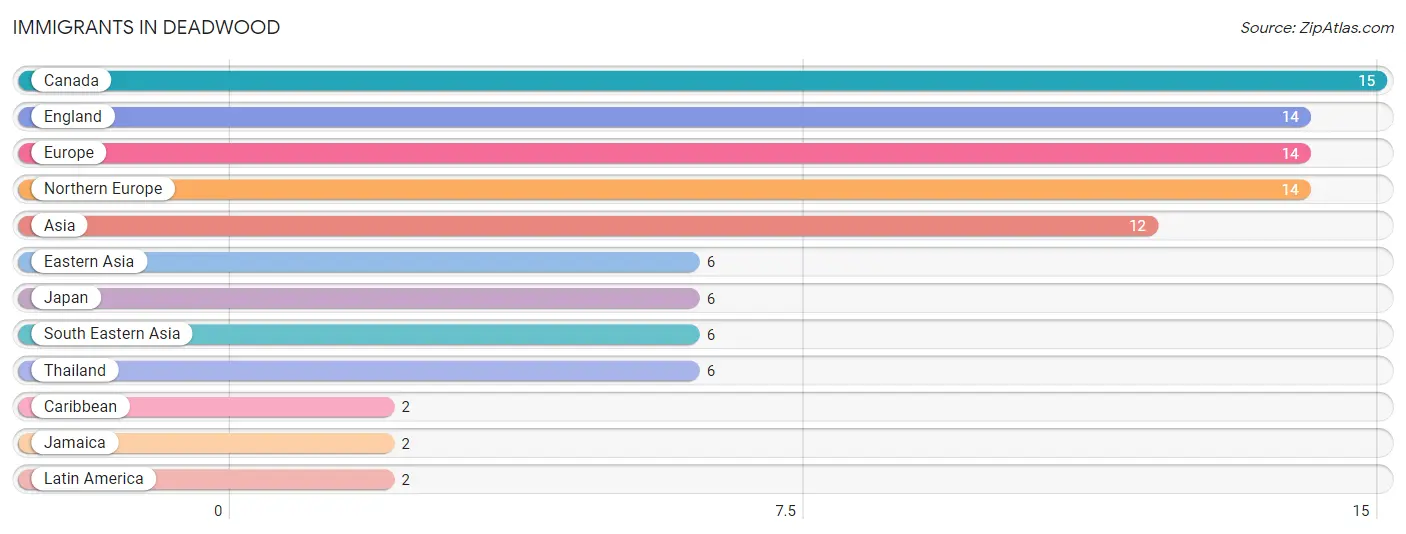
Immigrants in Deadwood
The most numerous immigrant groups reported in Deadwood came from Canada (15 | 1.1%), England (14 | 1.0%), Europe (14 | 1.0%), Northern Europe (14 | 1.0%), and Asia (12 | 0.8%), together accounting for 4.8% of all Deadwood residents.
| Immigration Origin | # Population | % Population |
| Asia | 12 | 0.8% |
| Canada | 15 | 1.1% |
| Caribbean | 2 | 0.1% |
| Eastern Asia | 6 | 0.4% |
| England | 14 | 1.0% |
| Europe | 14 | 1.0% |
| Jamaica | 2 | 0.1% |
| Japan | 6 | 0.4% |
| Latin America | 2 | 0.1% |
| Northern Europe | 14 | 1.0% |
| South Eastern Asia | 6 | 0.4% |
| Thailand | 6 | 0.4% | View All 12 Rows |
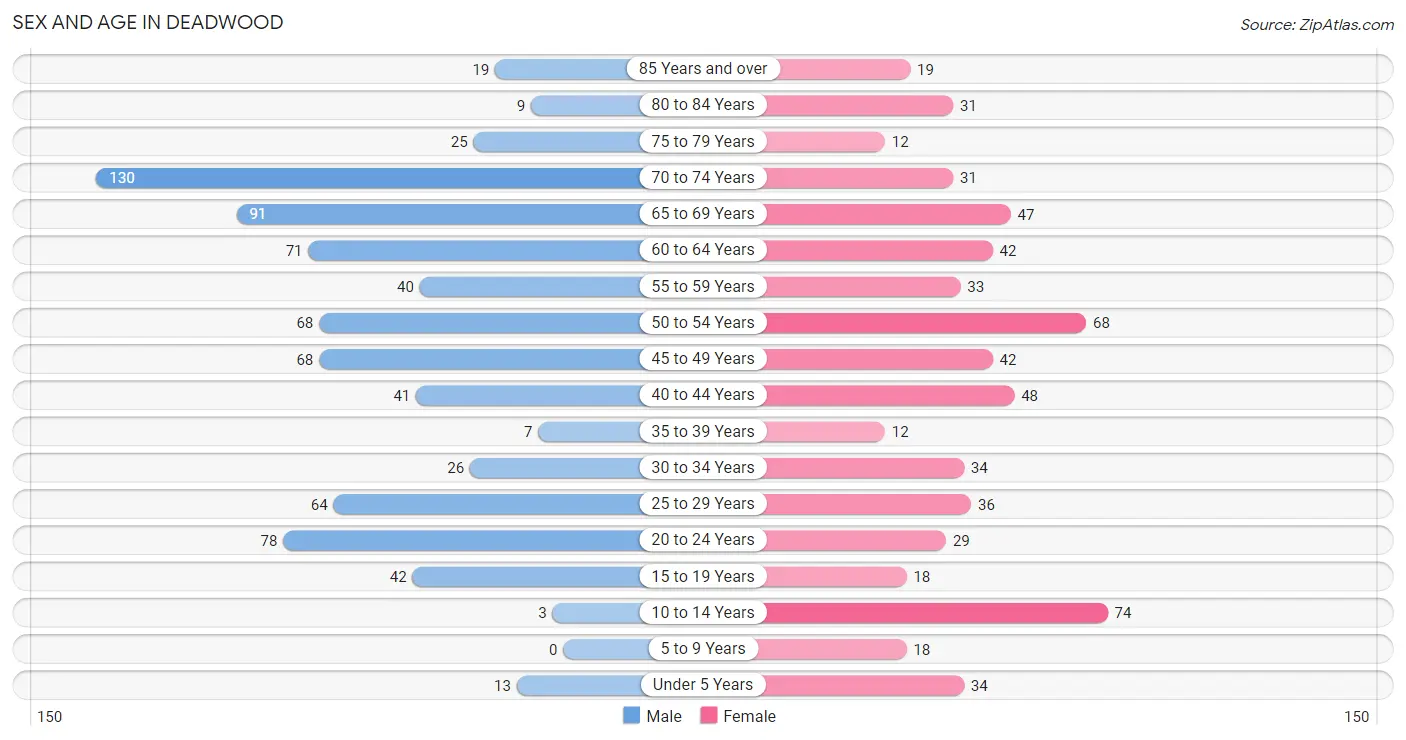
Sex and Age in Deadwood
Sex and Age in Deadwood
The most populous age groups in Deadwood are 70 to 74 Years (130 | 16.4%) for men and 10 to 14 Years (74 | 11.8%) for women.
| Age Bracket | Male | Female |
| Under 5 Years | 13 (1.6%) | 34 (5.4%) |
| 5 to 9 Years | 0 (0.0%) | 18 (2.9%) |
| 10 to 14 Years | 3 (0.4%) | 74 (11.8%) |
| 15 to 19 Years | 42 (5.3%) | 18 (2.9%) |
| 20 to 24 Years | 78 (9.8%) | 29 (4.6%) |
| 25 to 29 Years | 64 (8.1%) | 36 (5.7%) |
| 30 to 34 Years | 26 (3.3%) | 34 (5.4%) |
| 35 to 39 Years | 7 (0.9%) | 12 (1.9%) |
| 40 to 44 Years | 41 (5.2%) | 48 (7.6%) |
| 45 to 49 Years | 68 (8.6%) | 42 (6.7%) |
| 50 to 54 Years | 68 (8.6%) | 68 (10.8%) |
| 55 to 59 Years | 40 (5.0%) | 33 (5.2%) |
| 60 to 64 Years | 71 (8.9%) | 42 (6.7%) |
| 65 to 69 Years | 91 (11.5%) | 47 (7.5%) |
| 70 to 74 Years | 130 (16.4%) | 31 (4.9%) |
| 75 to 79 Years | 25 (3.1%) | 12 (1.9%) |
| 80 to 84 Years | 9 (1.1%) | 31 (4.9%) |
| 85 Years and over | 19 (2.4%) | 19 (3.0%) |
| Total | 795 (100.0%) | 628 (100.0%) |
Families and Households in Deadwood
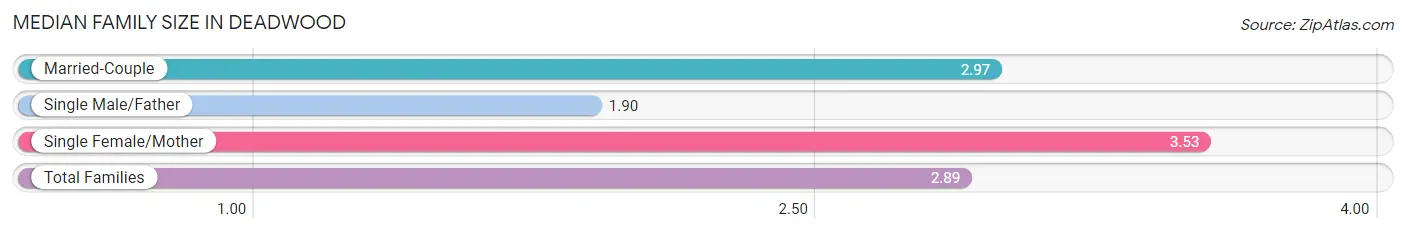
Median Family Size in Deadwood
The median family size in Deadwood is 2.89 persons per family, with single female/mother families (30 | 9.7%) accounting for the largest median family size of 3.53 persons per family. On the other hand, single male/father families (41 | 13.3%) represent the smallest median family size with 1.90 persons per family.
| Family Type | # Families | Family Size |
| Married-Couple | 237 (76.9%) | 2.97 |
| Single Male/Father | 41 (13.3%) | 1.90 |
| Single Female/Mother | 30 (9.7%) | 3.53 |
| Total Families | 308 (100.0%) | 2.89 |
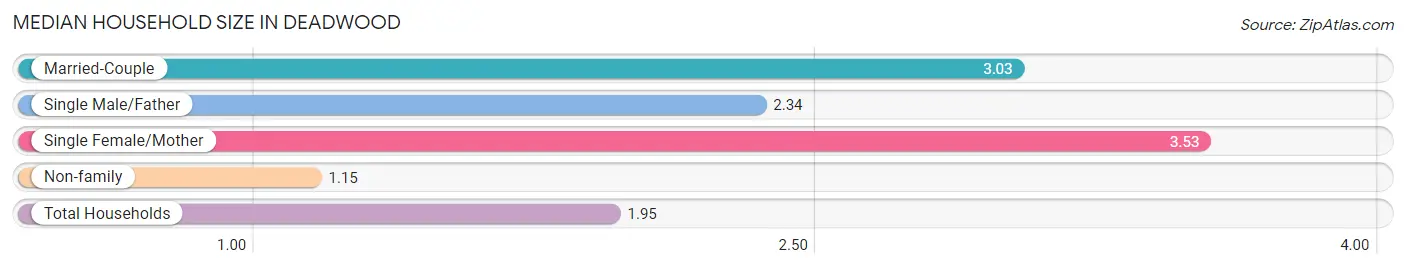
Median Household Size in Deadwood
The median household size in Deadwood is 1.95 persons per household, with single female/mother households (30 | 4.2%) accounting for the largest median household size of 3.53 persons per household. non-family households (401 | 56.6%) represent the smallest median household size with 1.15 persons per household.
| Household Type | # Households | Household Size |
| Married-Couple | 237 (33.4%) | 3.03 |
| Single Male/Father | 41 (5.8%) | 2.34 |
| Single Female/Mother | 30 (4.2%) | 3.53 |
| Non-family | 401 (56.6%) | 1.15 |
| Total Households | 709 (100.0%) | 1.95 |
Household Size by Marriage Status in Deadwood
Out of a total of 709 households in Deadwood, 308 (43.4%) are family households, while 401 (56.6%) are nonfamily households. The most numerous type of family households are 2-person households, comprising 159, and the most common type of nonfamily households are 1-person households, comprising 362.
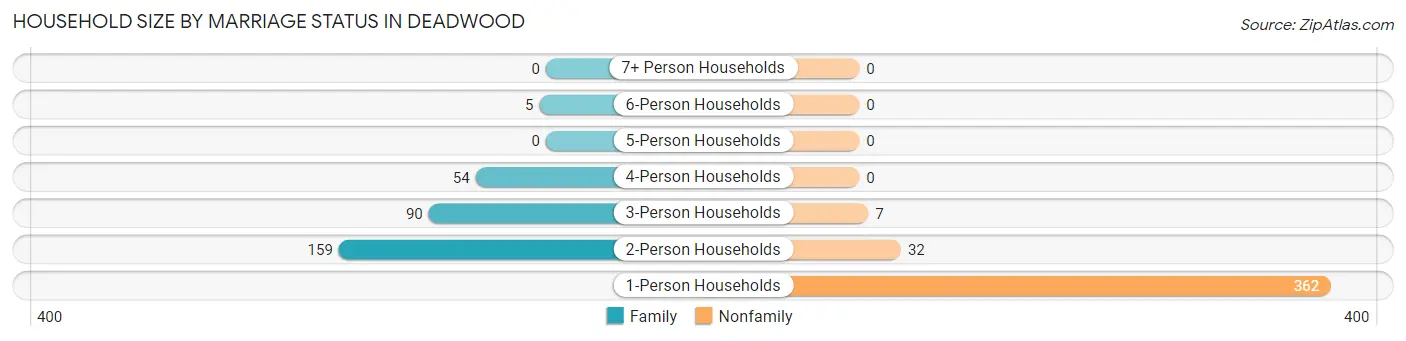
| Household Size | Family Households | Nonfamily Households |
| 1-Person Households | - | 362 (51.1%) |
| 2-Person Households | 159 (22.4%) | 32 (4.5%) |
| 3-Person Households | 90 (12.7%) | 7 (1.0%) |
| 4-Person Households | 54 (7.6%) | 0 (0.0%) |
| 5-Person Households | 0 (0.0%) | 0 (0.0%) |
| 6-Person Households | 5 (0.7%) | 0 (0.0%) |
| 7+ Person Households | 0 (0.0%) | 0 (0.0%) |
| Total | 308 (43.4%) | 401 (56.6%) |
Female Fertility in Deadwood
Fertility by Age in Deadwood
Average fertility rate in Deadwood is 4.0 births per 1,000 women. Women in the age bracket of 20 to 34 years have the highest fertility rate with 10.0 births per 1,000 women. Women in the age bracket of 20 to 34 years acount for 100.0% of all women with births.
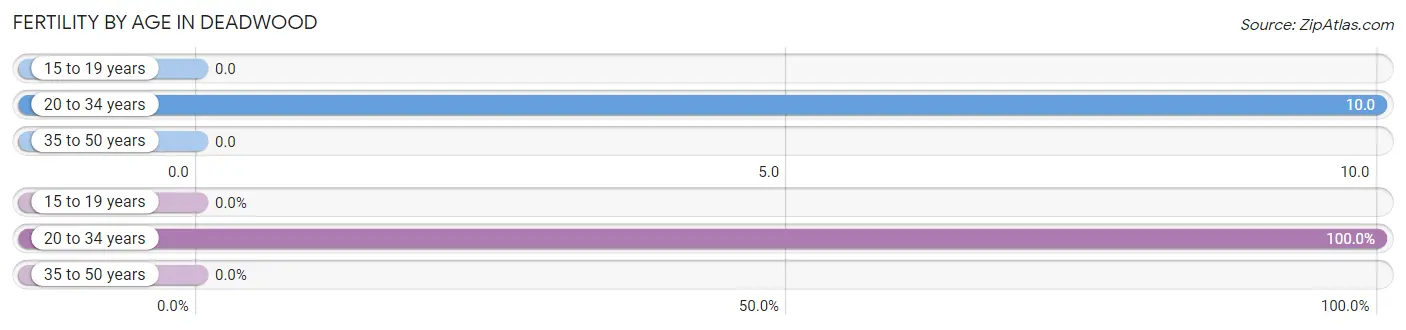
| Age Bracket | Women with Births | Births / 1,000 Women |
| 15 to 19 years | 0 (0.0%) | 0.0 |
| 20 to 34 years | 1 (100.0%) | 10.0 |
| 35 to 50 years | 0 (0.0%) | 0.0 |
| Total | 1 (100.0%) | 4.0 |
Fertility by Age by Marriage Status in Deadwood
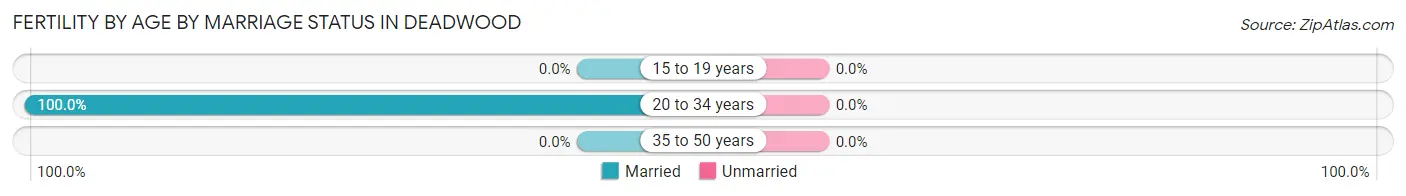
| Age Bracket | Married | Unmarried |
| 15 to 19 years | 0 (0.0%) | 0 (0.0%) |
| 20 to 34 years | 1 (100.0%) | 0 (0.0%) |
| 35 to 50 years | 0 (0.0%) | 0 (0.0%) |
| Total | 1 (100.0%) | 0 (0.0%) |
Fertility by Education in Deadwood
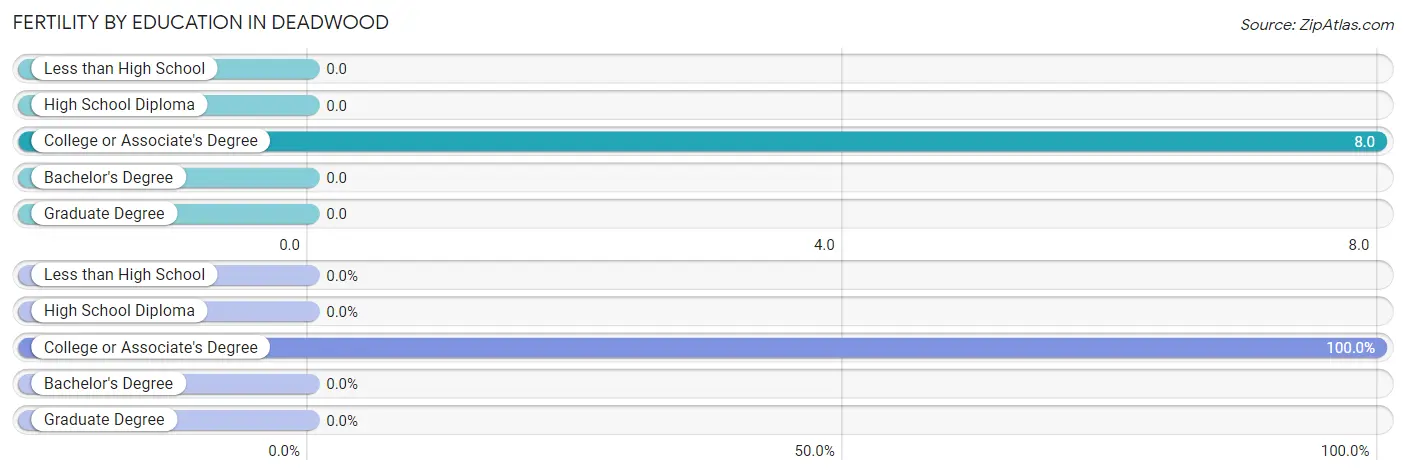
| Educational Attainment | Women with Births | Births / 1,000 Women |
| Less than High School | 0 (0.0%) | 0.0 |
| High School Diploma | 0 (0.0%) | 0.0 |
| College or Associate's Degree | 1 (100.0%) | 8.0 |
| Bachelor's Degree | 0 (0.0%) | 0.0 |
| Graduate Degree | 0 (0.0%) | 0.0 |
| Total | 1 (100.0%) | 4.0 |
Fertility by Education by Marriage Status in Deadwood
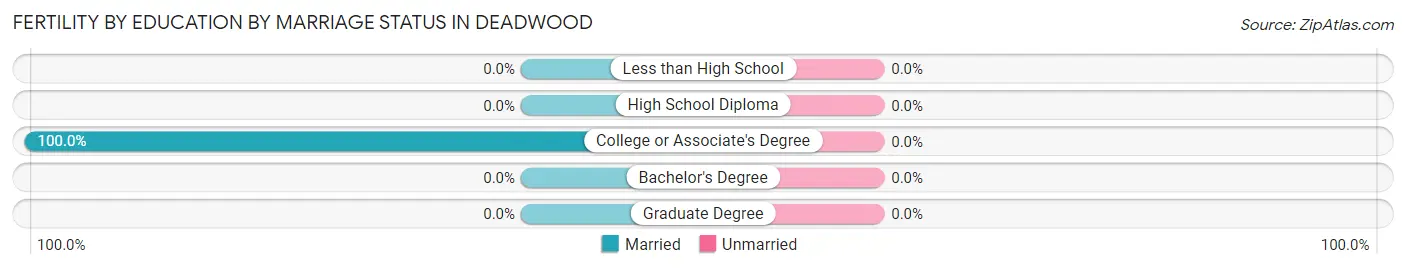
| Educational Attainment | Married | Unmarried |
| Less than High School | 0 (0.0%) | 0 (0.0%) |
| High School Diploma | 0 (0.0%) | 0 (0.0%) |
| College or Associate's Degree | 1 (100.0%) | 0 (0.0%) |
| Bachelor's Degree | 0 (0.0%) | 0 (0.0%) |
| Graduate Degree | 0 (0.0%) | 0 (0.0%) |
| Total | 1 (100.0%) | 0 (0.0%) |
Employment Characteristics in Deadwood
Employment by Class of Employer in Deadwood
Among the 648 employed individuals in Deadwood, private company employees (415 | 64.0%), local government employees (54 | 8.3%), and self-employed (incorporated) (50 | 7.7%) make up the most common classes of employment.
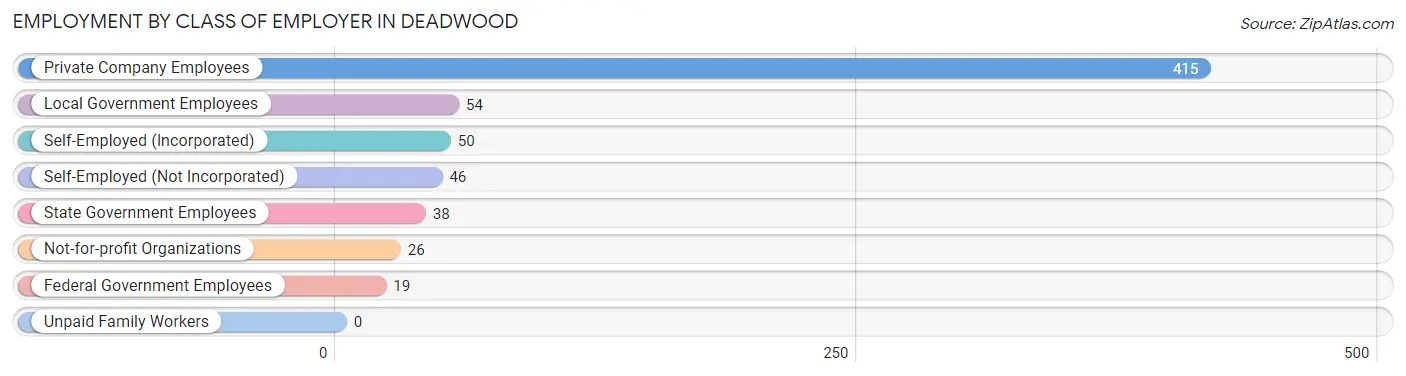
| Employer Class | # Employees | % Employees |
| Private Company Employees | 415 | 64.0% |
| Self-Employed (Incorporated) | 50 | 7.7% |
| Self-Employed (Not Incorporated) | 46 | 7.1% |
| Not-for-profit Organizations | 26 | 4.0% |
| Local Government Employees | 54 | 8.3% |
| State Government Employees | 38 | 5.9% |
| Federal Government Employees | 19 | 2.9% |
| Unpaid Family Workers | 0 | 0.0% |
| Total | 648 | 100.0% |
Employment Status by Age in Deadwood
According to the labor force statistics for Deadwood, out of the total population over 16 years of age (1,281), 60.0% or 769 individuals are in the labor force, with 4.6% or 35 of them unemployed. The age group with the highest labor force participation rate is 45 to 54 years, with 87.4% or 215 individuals in the labor force. Within the labor force, the 20 to 24 years age range has the highest percentage of unemployed individuals, with 38.2% or 26 of them being unemployed.
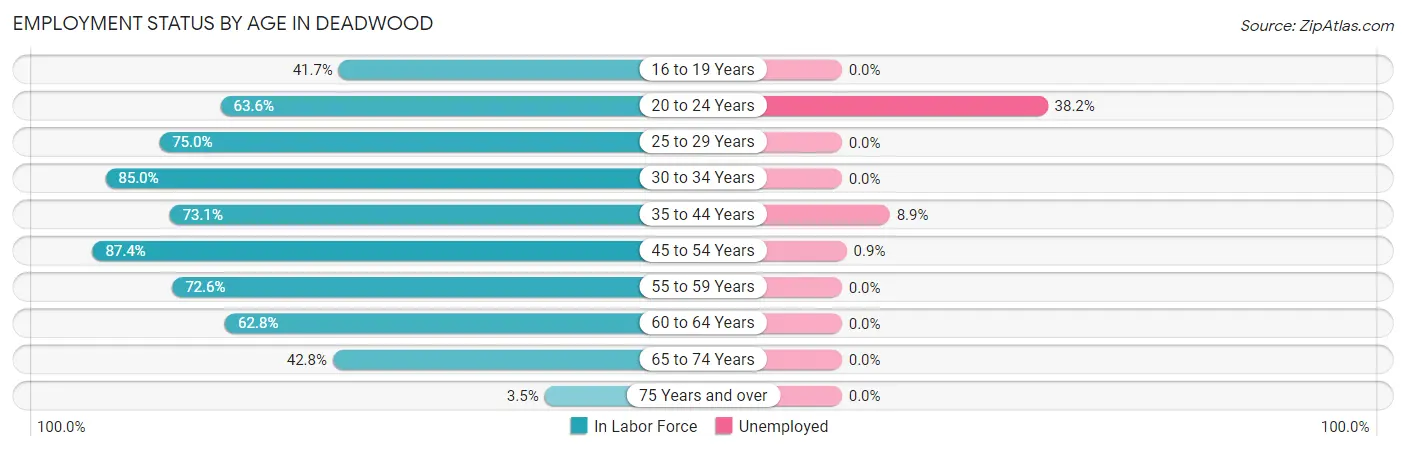
| Age Bracket | In Labor Force | Unemployed |
| 16 to 19 Years | 25 (41.7%) | 0 (0.0%) |
| 20 to 24 Years | 68 (63.6%) | 26 (38.2%) |
| 25 to 29 Years | 75 (75.0%) | 0 (0.0%) |
| 30 to 34 Years | 51 (85.0%) | 0 (0.0%) |
| 35 to 44 Years | 79 (73.1%) | 7 (8.9%) |
| 45 to 54 Years | 215 (87.4%) | 2 (0.9%) |
| 55 to 59 Years | 53 (72.6%) | 0 (0.0%) |
| 60 to 64 Years | 71 (62.8%) | 0 (0.0%) |
| 65 to 74 Years | 128 (42.8%) | 0 (0.0%) |
| 75 Years and over | 4 (3.5%) | 0 (0.0%) |
| Total | 769 (60.0%) | 35 (4.6%) |
Employment Status by Educational Attainment in Deadwood
According to labor force statistics for Deadwood, 77.7% of individuals (544) out of the total population between 25 and 64 years of age (700) are in the labor force, with 1.7% or 9 of them being unemployed. The group with the highest labor force participation rate are those with the educational attainment of bachelor's degree or higher, with 82.2% or 157 individuals in the labor force. Within the labor force, individuals with bachelor's degree or higher education have the highest percentage of unemployment, with 5.7% or 9 of them being unemployed.
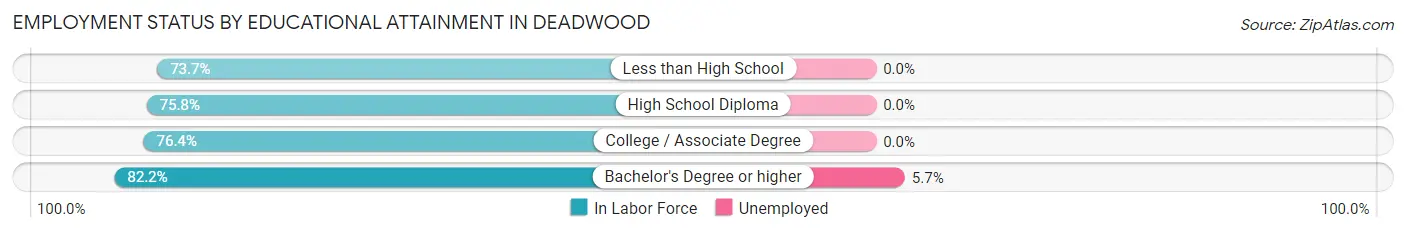
| Educational Attainment | In Labor Force | Unemployed |
| Less than High School | 14 (73.7%) | 0 (0.0%) |
| High School Diploma | 166 (75.8%) | 0 (0.0%) |
| College / Associate Degree | 207 (76.4%) | 0 (0.0%) |
| Bachelor's Degree or higher | 157 (82.2%) | 11 (5.7%) |
| Total | 544 (77.7%) | 12 (1.7%) |
Employment Occupations by Sex in Deadwood
Management, Business, Science and Arts Occupations
The most common Management, Business, Science and Arts occupations in Deadwood are Management (71 | 9.7%), Community & Social Service (49 | 6.7%), Business & Financial (48 | 6.5%), Education Instruction & Library (22 | 3.0%), and Computers, Engineering & Science (19 | 2.6%).
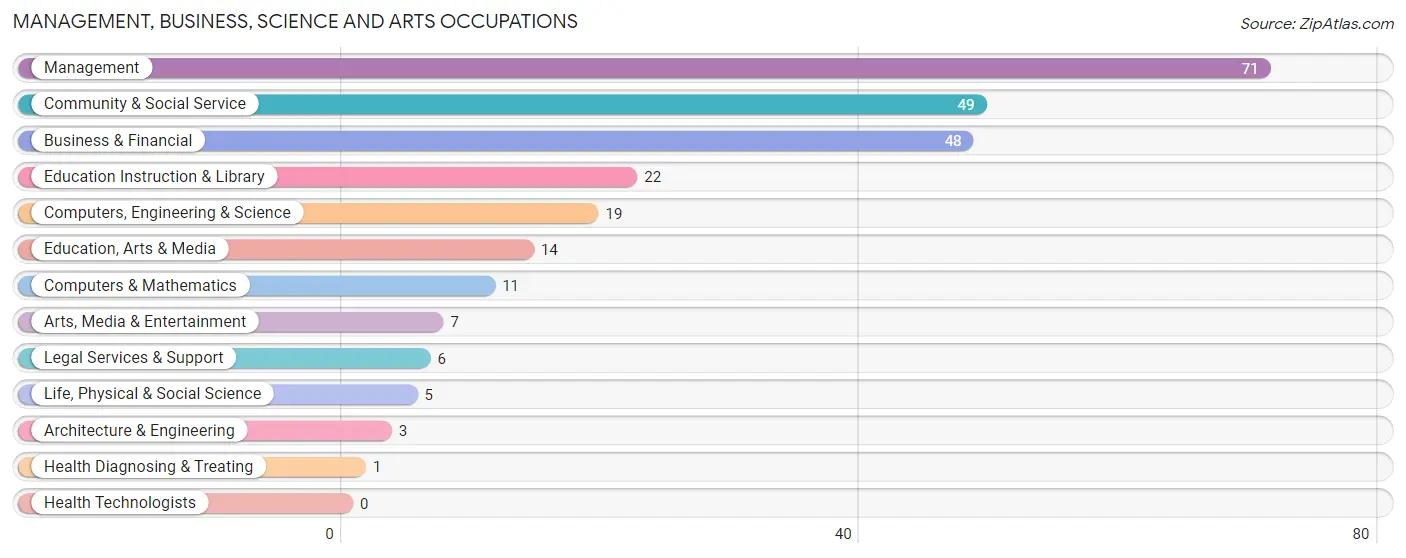
Management, Business, Science and Arts Occupations by Sex
Within the Management, Business, Science and Arts occupations in Deadwood, the most male-oriented occupations are Computers & Mathematics (100.0%), Architecture & Engineering (100.0%), and Arts, Media & Entertainment (100.0%), while the most female-oriented occupations are Life, Physical & Social Science (100.0%), Education, Arts & Media (100.0%), and Legal Services & Support (100.0%).
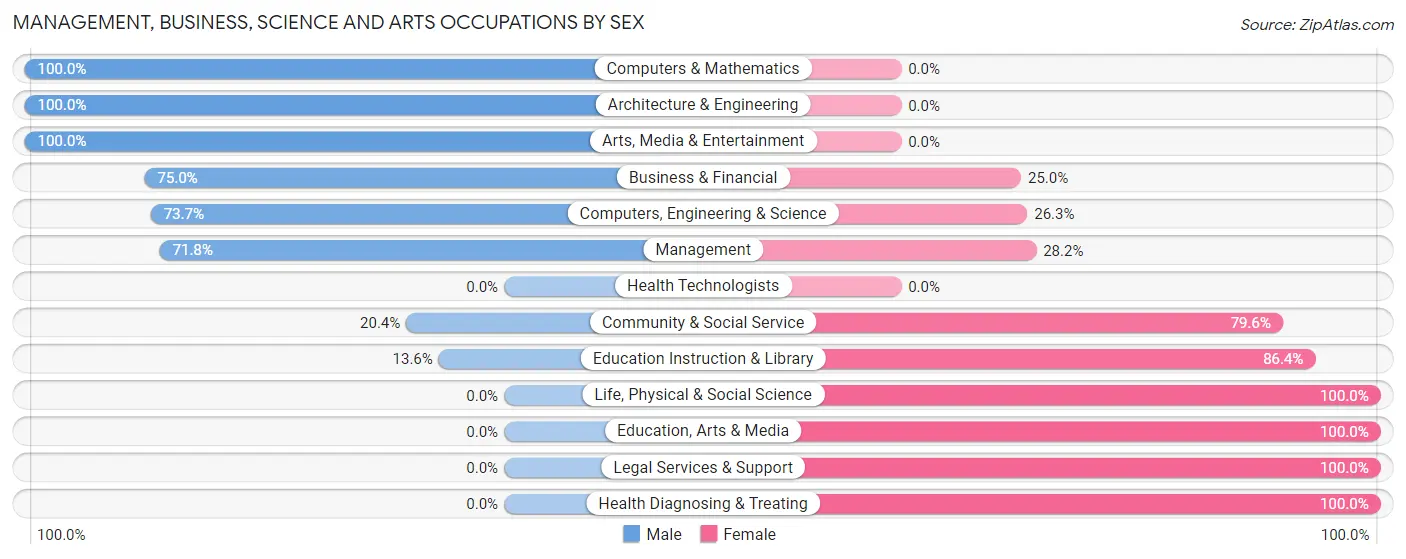
| Occupation | Male | Female |
| Management | 51 (71.8%) | 20 (28.2%) |
| Business & Financial | 36 (75.0%) | 12 (25.0%) |
| Computers, Engineering & Science | 14 (73.7%) | 5 (26.3%) |
| Computers & Mathematics | 11 (100.0%) | 0 (0.0%) |
| Architecture & Engineering | 3 (100.0%) | 0 (0.0%) |
| Life, Physical & Social Science | 0 (0.0%) | 5 (100.0%) |
| Community & Social Service | 10 (20.4%) | 39 (79.6%) |
| Education, Arts & Media | 0 (0.0%) | 14 (100.0%) |
| Legal Services & Support | 0 (0.0%) | 6 (100.0%) |
| Education Instruction & Library | 3 (13.6%) | 19 (86.4%) |
| Arts, Media & Entertainment | 7 (100.0%) | 0 (0.0%) |
| Health Diagnosing & Treating | 0 (0.0%) | 1 (100.0%) |
| Health Technologists | 0 (0.0%) | 0 (0.0%) |
| Total (Category) | 111 (59.0%) | 77 (41.0%) |
| Total (Overall) | 459 (62.5%) | 275 (37.5%) |
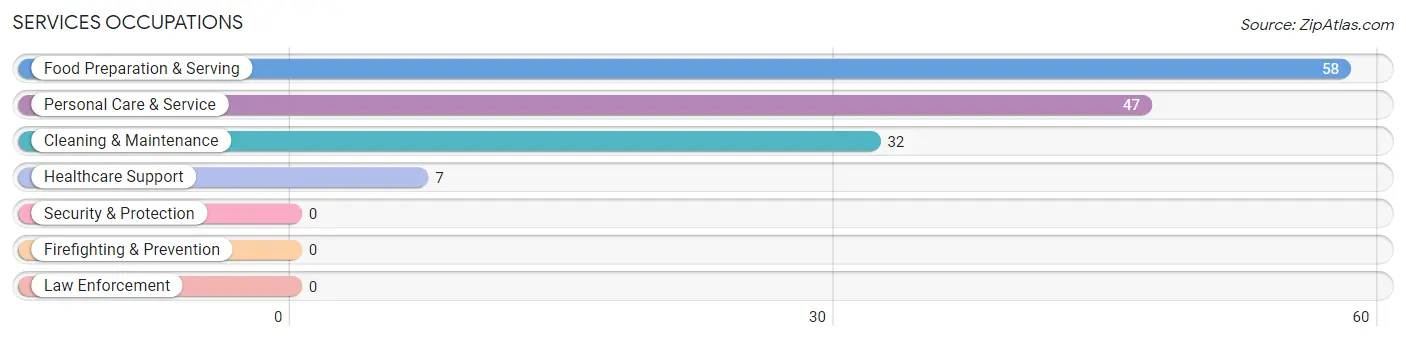
Services Occupations
The most common Services occupations in Deadwood are Food Preparation & Serving (58 | 7.9%), Personal Care & Service (47 | 6.4%), Cleaning & Maintenance (32 | 4.4%), and Healthcare Support (7 | 0.9%).
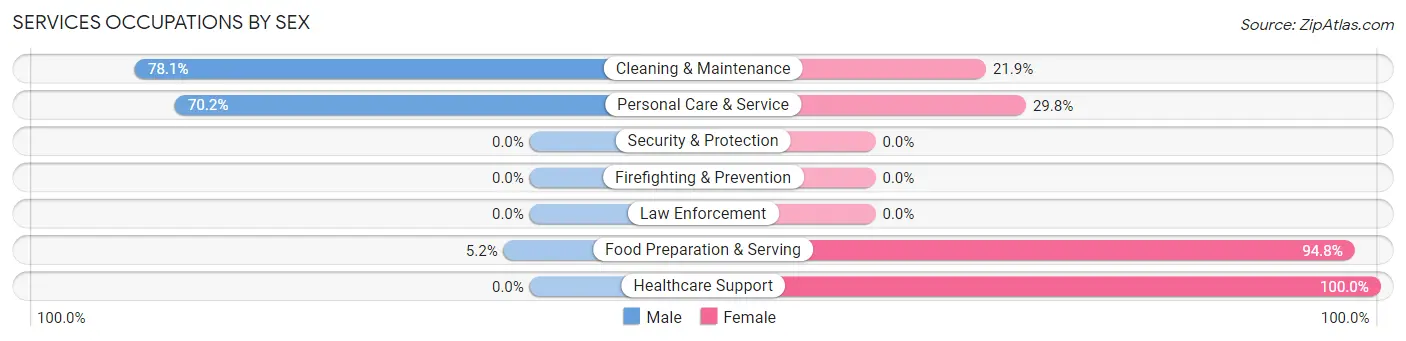
Services Occupations by Sex
Within the Services occupations in Deadwood, the most male-oriented occupations are Cleaning & Maintenance (78.1%), Personal Care & Service (70.2%), and Food Preparation & Serving (5.2%), while the most female-oriented occupations are Healthcare Support (100.0%), Food Preparation & Serving (94.8%), and Personal Care & Service (29.8%).
| Occupation | Male | Female |
| Healthcare Support | 0 (0.0%) | 7 (100.0%) |
| Security & Protection | 0 (0.0%) | 0 (0.0%) |
| Firefighting & Prevention | 0 (0.0%) | 0 (0.0%) |
| Law Enforcement | 0 (0.0%) | 0 (0.0%) |
| Food Preparation & Serving | 3 (5.2%) | 55 (94.8%) |
| Cleaning & Maintenance | 25 (78.1%) | 7 (21.9%) |
| Personal Care & Service | 33 (70.2%) | 14 (29.8%) |
| Total (Category) | 61 (42.4%) | 83 (57.6%) |
| Total (Overall) | 459 (62.5%) | 275 (37.5%) |
Sales and Office Occupations
The most common Sales and Office occupations in Deadwood are Office & Administration (88 | 12.0%), and Sales & Related (62 | 8.5%).
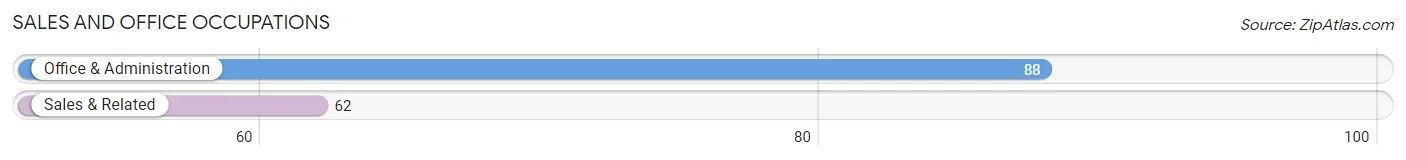
Sales and Office Occupations by Sex
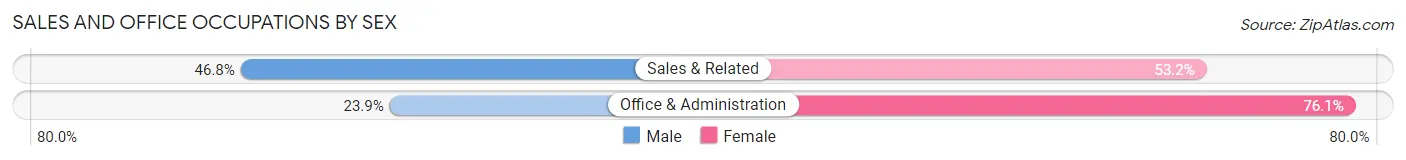
| Occupation | Male | Female |
| Sales & Related | 29 (46.8%) | 33 (53.2%) |
| Office & Administration | 21 (23.9%) | 67 (76.1%) |
| Total (Category) | 50 (33.3%) | 100 (66.7%) |
| Total (Overall) | 459 (62.5%) | 275 (37.5%) |
Natural Resources, Construction and Maintenance Occupations
The most common Natural Resources, Construction and Maintenance occupations in Deadwood are Construction & Extraction (125 | 17.0%), Installation, Maintenance & Repair (46 | 6.3%), and Farming, Fishing & Forestry (24 | 3.3%).
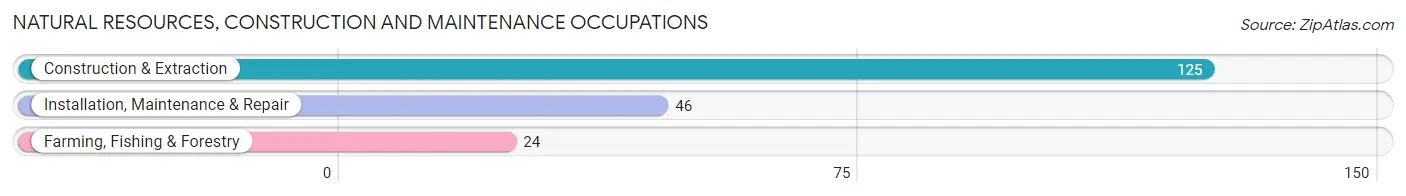
Natural Resources, Construction and Maintenance Occupations by Sex
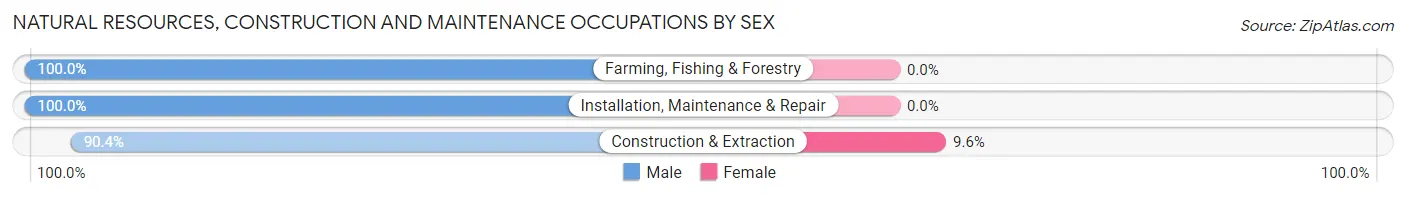
| Occupation | Male | Female |
| Farming, Fishing & Forestry | 24 (100.0%) | 0 (0.0%) |
| Construction & Extraction | 113 (90.4%) | 12 (9.6%) |
| Installation, Maintenance & Repair | 46 (100.0%) | 0 (0.0%) |
| Total (Category) | 183 (93.9%) | 12 (6.1%) |
| Total (Overall) | 459 (62.5%) | 275 (37.5%) |
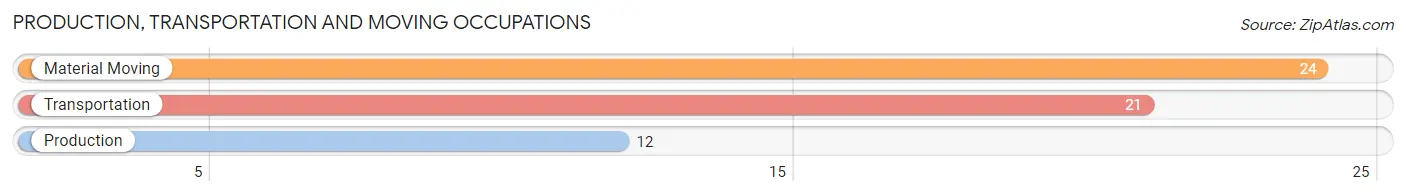
Production, Transportation and Moving Occupations
The most common Production, Transportation and Moving occupations in Deadwood are Material Moving (24 | 3.3%), Transportation (21 | 2.9%), and Production (12 | 1.6%).
Production, Transportation and Moving Occupations by Sex
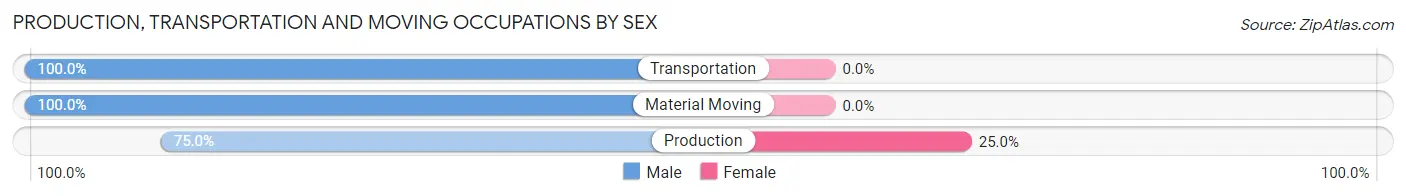
| Occupation | Male | Female |
| Production | 9 (75.0%) | 3 (25.0%) |
| Transportation | 21 (100.0%) | 0 (0.0%) |
| Material Moving | 24 (100.0%) | 0 (0.0%) |
| Total (Category) | 54 (94.7%) | 3 (5.3%) |
| Total (Overall) | 459 (62.5%) | 275 (37.5%) |
Employment Industries by Sex in Deadwood
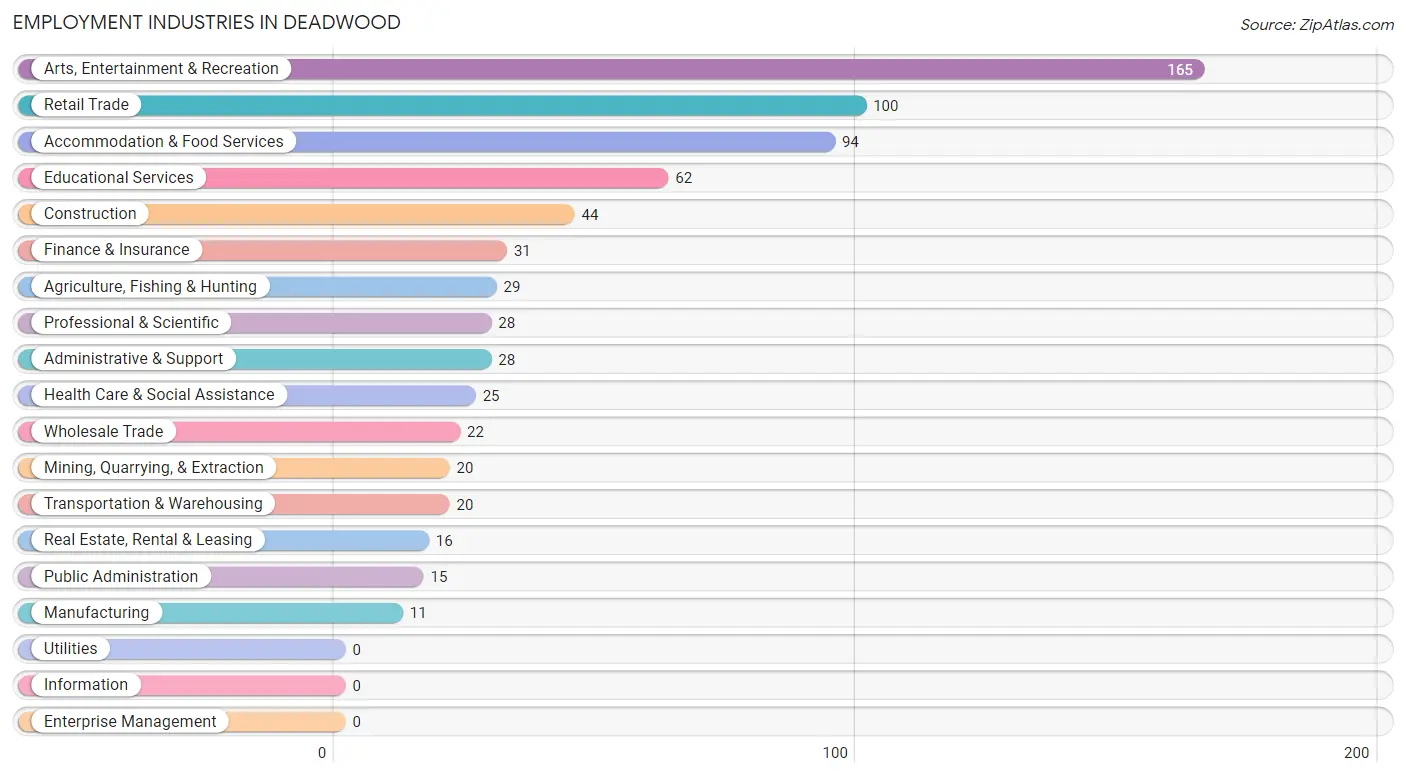
Employment Industries in Deadwood
The major employment industries in Deadwood include Arts, Entertainment & Recreation (165 | 22.5%), Retail Trade (100 | 13.6%), Accommodation & Food Services (94 | 12.8%), Educational Services (62 | 8.5%), and Construction (44 | 6.0%).
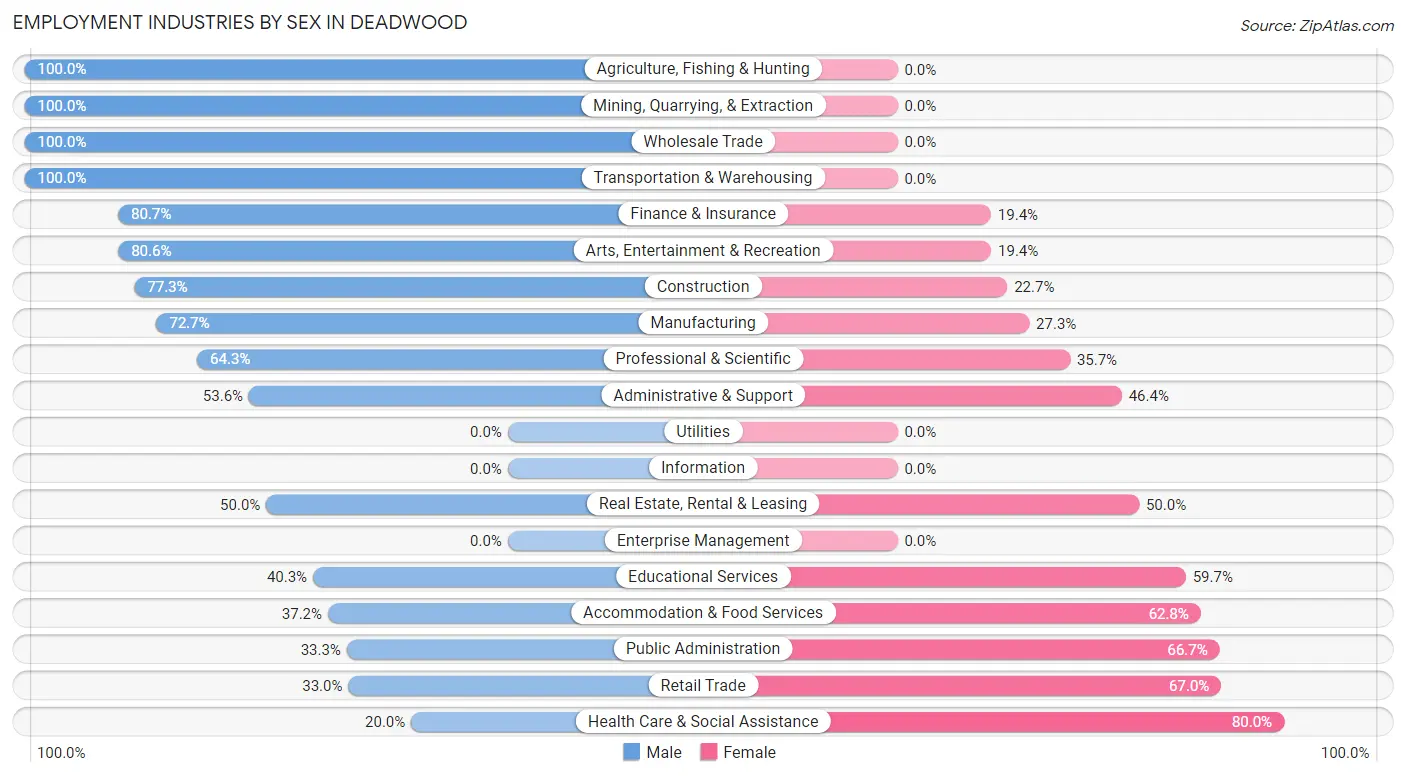
Employment Industries by Sex in Deadwood
The Deadwood industries that see more men than women are Agriculture, Fishing & Hunting (100.0%), Mining, Quarrying, & Extraction (100.0%), and Wholesale Trade (100.0%), whereas the industries that tend to have a higher number of women are Health Care & Social Assistance (80.0%), Retail Trade (67.0%), and Public Administration (66.7%).
| Industry | Male | Female |
| Agriculture, Fishing & Hunting | 29 (100.0%) | 0 (0.0%) |
| Mining, Quarrying, & Extraction | 20 (100.0%) | 0 (0.0%) |
| Construction | 34 (77.3%) | 10 (22.7%) |
| Manufacturing | 8 (72.7%) | 3 (27.3%) |
| Wholesale Trade | 22 (100.0%) | 0 (0.0%) |
| Retail Trade | 33 (33.0%) | 67 (67.0%) |
| Transportation & Warehousing | 20 (100.0%) | 0 (0.0%) |
| Utilities | 0 (0.0%) | 0 (0.0%) |
| Information | 0 (0.0%) | 0 (0.0%) |
| Finance & Insurance | 25 (80.6%) | 6 (19.4%) |
| Real Estate, Rental & Leasing | 8 (50.0%) | 8 (50.0%) |
| Professional & Scientific | 18 (64.3%) | 10 (35.7%) |
| Enterprise Management | 0 (0.0%) | 0 (0.0%) |
| Administrative & Support | 15 (53.6%) | 13 (46.4%) |
| Educational Services | 25 (40.3%) | 37 (59.7%) |
| Health Care & Social Assistance | 5 (20.0%) | 20 (80.0%) |
| Arts, Entertainment & Recreation | 133 (80.6%) | 32 (19.4%) |
| Accommodation & Food Services | 35 (37.2%) | 59 (62.8%) |
| Public Administration | 5 (33.3%) | 10 (66.7%) |
| Total | 459 (62.5%) | 275 (37.5%) |
Education in Deadwood
School Enrollment in Deadwood
The most common levels of schooling among the 236 students in Deadwood are college / undergraduate (97 | 41.1%), middle school (77 | 32.6%), and high school (37 | 15.7%).
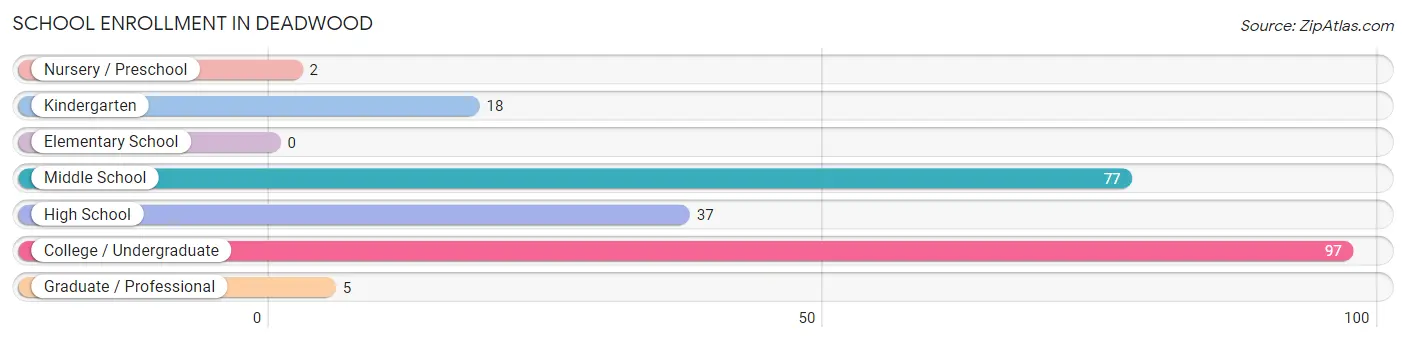
| School Level | # Students | % Students |
| Nursery / Preschool | 2 | 0.9% |
| Kindergarten | 18 | 7.6% |
| Elementary School | 0 | 0.0% |
| Middle School | 77 | 32.6% |
| High School | 37 | 15.7% |
| College / Undergraduate | 97 | 41.1% |
| Graduate / Professional | 5 | 2.1% |
| Total | 236 | 100.0% |
School Enrollment by Age by Funding Source in Deadwood
Out of a total of 236 students who are enrolled in schools in Deadwood, 45 (19.1%) attend a private institution, while the remaining 191 (80.9%) are enrolled in public schools. The age group of 15 to 17 year olds has the highest likelihood of being enrolled in private schools, with 16 (50.0% in the age bracket) enrolled. Conversely, the age group of 3 to 4 year olds has the lowest likelihood of being enrolled in a private school, with 2 (100.0% in the age bracket) attending a public institution.
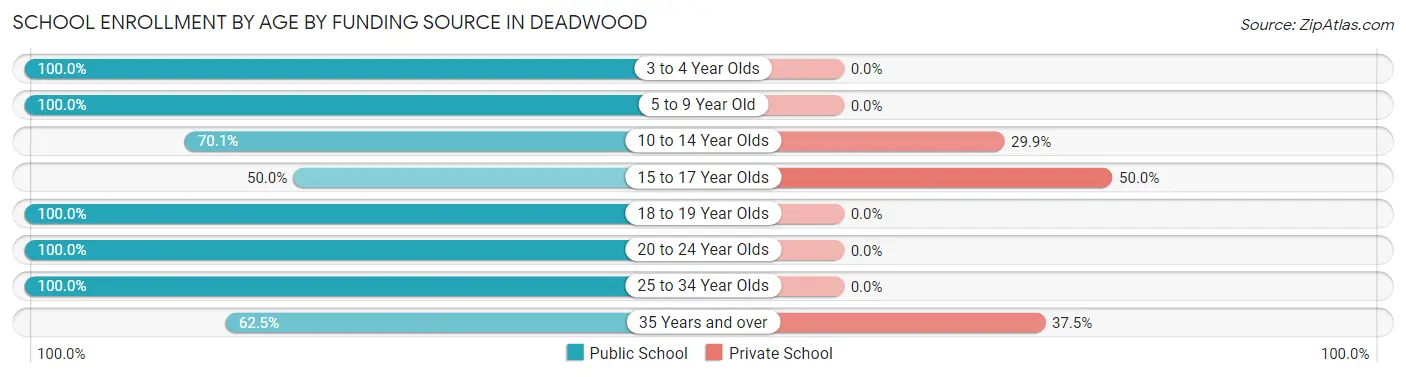
| Age Bracket | Public School | Private School |
| 3 to 4 Year Olds | 2 (100.0%) | 0 (0.0%) |
| 5 to 9 Year Old | 18 (100.0%) | 0 (0.0%) |
| 10 to 14 Year Olds | 54 (70.1%) | 23 (29.9%) |
| 15 to 17 Year Olds | 16 (50.0%) | 16 (50.0%) |
| 18 to 19 Year Olds | 22 (100.0%) | 0 (0.0%) |
| 20 to 24 Year Olds | 53 (100.0%) | 0 (0.0%) |
| 25 to 34 Year Olds | 16 (100.0%) | 0 (0.0%) |
| 35 Years and over | 10 (62.5%) | 6 (37.5%) |
| Total | 191 (80.9%) | 45 (19.1%) |
Educational Attainment by Field of Study in Deadwood
Education (80 | 22.5%), business (68 | 19.1%), arts & humanities (42 | 11.8%), social sciences (28 | 7.9%), and psychology (25 | 7.0%) are the most common fields of study among 356 individuals in Deadwood who have obtained a bachelor's degree or higher.
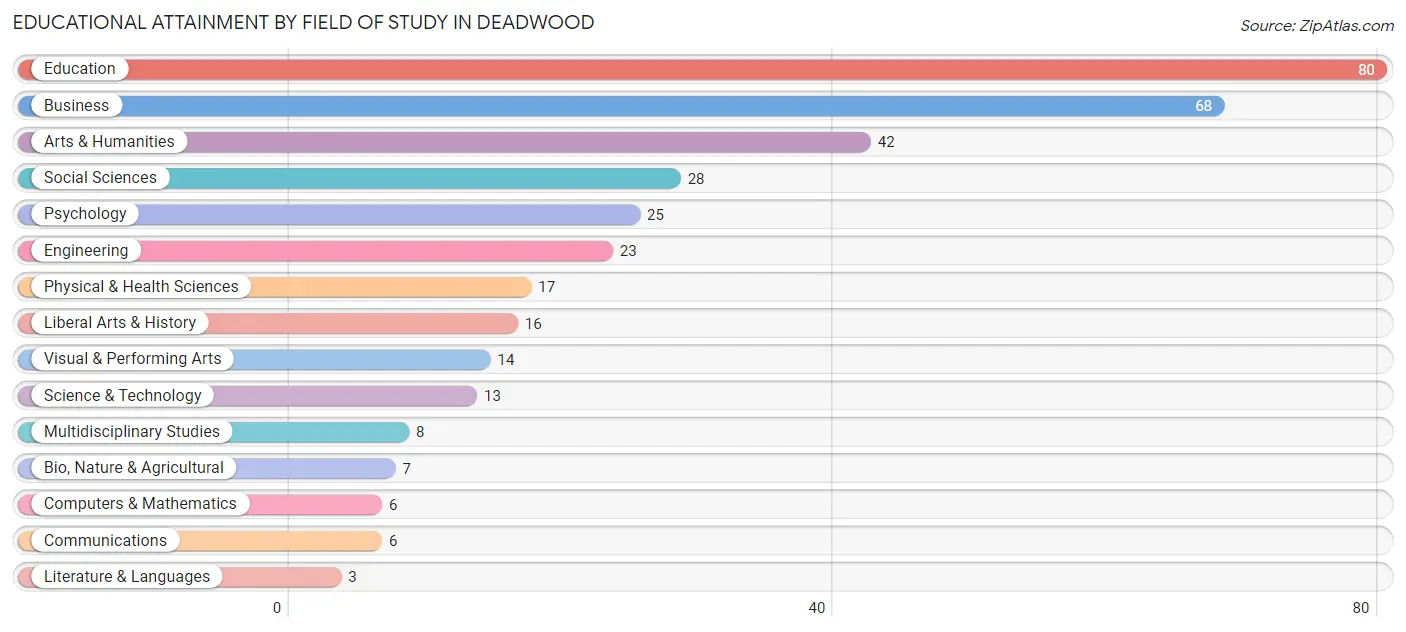
| Field of Study | # Graduates | % Graduates |
| Computers & Mathematics | 6 | 1.7% |
| Bio, Nature & Agricultural | 7 | 2.0% |
| Physical & Health Sciences | 17 | 4.8% |
| Psychology | 25 | 7.0% |
| Social Sciences | 28 | 7.9% |
| Engineering | 23 | 6.5% |
| Multidisciplinary Studies | 8 | 2.2% |
| Science & Technology | 13 | 3.6% |
| Business | 68 | 19.1% |
| Education | 80 | 22.5% |
| Literature & Languages | 3 | 0.8% |
| Liberal Arts & History | 16 | 4.5% |
| Visual & Performing Arts | 14 | 3.9% |
| Communications | 6 | 1.7% |
| Arts & Humanities | 42 | 11.8% |
| Total | 356 | 100.0% |
Transportation & Commute in Deadwood
Vehicle Availability by Sex in Deadwood
The most prevalent vehicle ownership categories in Deadwood are males with 2 vehicles (137, accounting for 36.3%) and females with 2 vehicles (82, making up 50.5%).
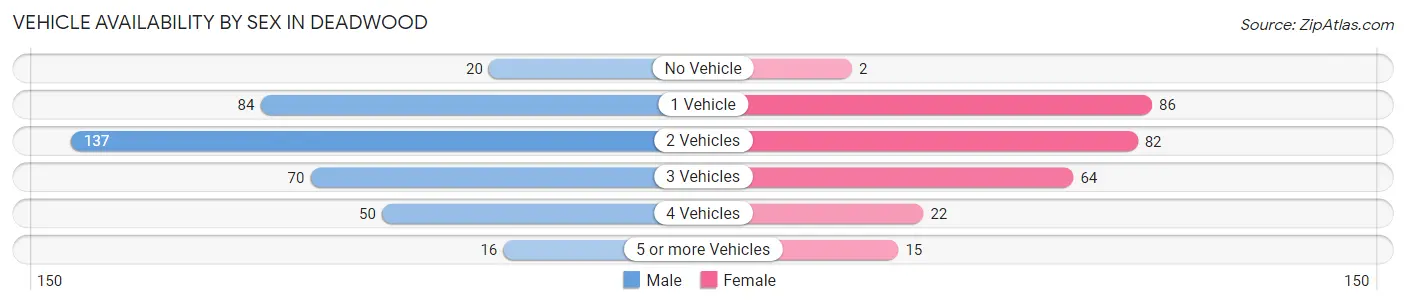
| Vehicles Available | Male | Female |
| No Vehicle | 20 (5.3%) | 2 (0.7%) |
| 1 Vehicle | 84 (22.3%) | 86 (31.7%) |
| 2 Vehicles | 137 (36.3%) | 82 (30.3%) |
| 3 Vehicles | 70 (18.6%) | 64 (23.6%) |
| 4 Vehicles | 50 (13.3%) | 22 (8.1%) |
| 5 or more Vehicles | 16 (4.2%) | 15 (5.5%) |
| Total | 377 (100.0%) | 271 (100.0%) |
Commute Time in Deadwood
The most frequently occuring commute durations in Deadwood are 5 to 9 minutes (224 commuters, 36.6%), 10 to 14 minutes (90 commuters, 14.7%), and 15 to 19 minutes (66 commuters, 10.8%).
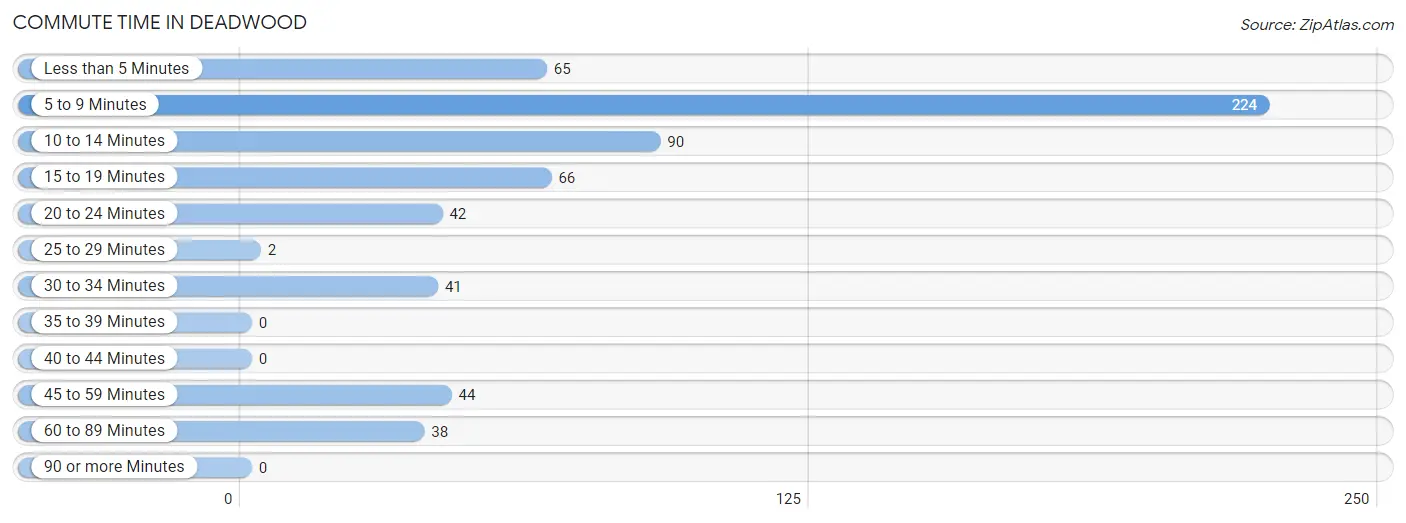
| Commute Time | # Commuters | % Commuters |
| Less than 5 Minutes | 65 | 10.6% |
| 5 to 9 Minutes | 224 | 36.6% |
| 10 to 14 Minutes | 90 | 14.7% |
| 15 to 19 Minutes | 66 | 10.8% |
| 20 to 24 Minutes | 42 | 6.9% |
| 25 to 29 Minutes | 2 | 0.3% |
| 30 to 34 Minutes | 41 | 6.7% |
| 35 to 39 Minutes | 0 | 0.0% |
| 40 to 44 Minutes | 0 | 0.0% |
| 45 to 59 Minutes | 44 | 7.2% |
| 60 to 89 Minutes | 38 | 6.2% |
| 90 or more Minutes | 0 | 0.0% |
Commute Time by Sex in Deadwood
The most common commute times in Deadwood are 5 to 9 minutes (129 commuters, 35.5%) for males and 5 to 9 minutes (95 commuters, 38.2%) for females.
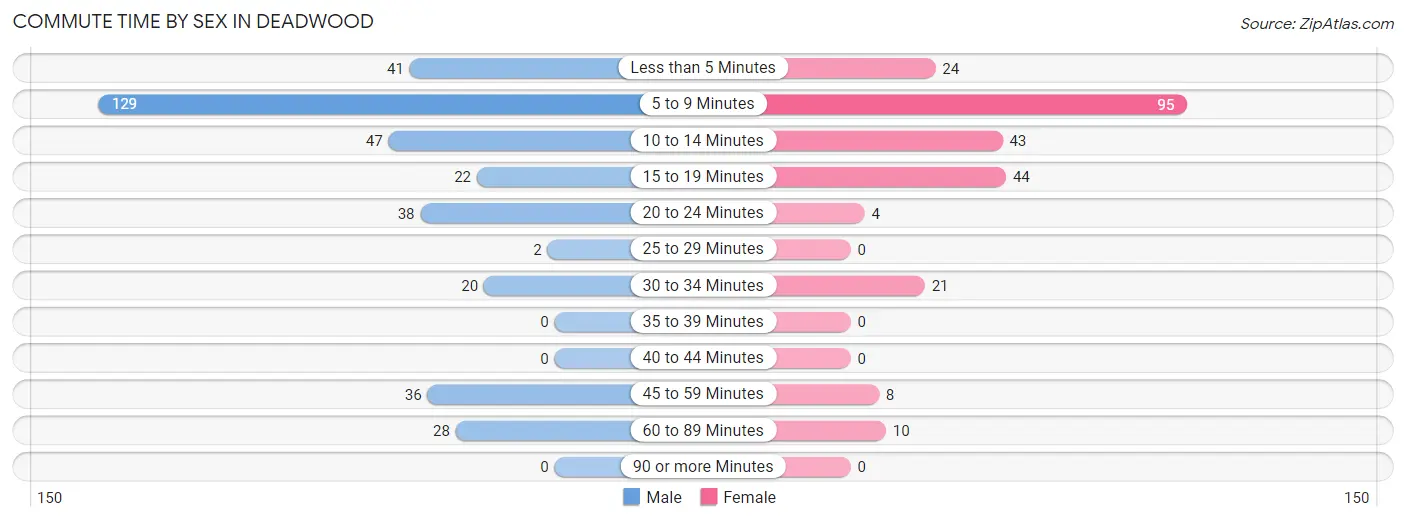
| Commute Time | Male | Female |
| Less than 5 Minutes | 41 (11.3%) | 24 (9.6%) |
| 5 to 9 Minutes | 129 (35.5%) | 95 (38.2%) |
| 10 to 14 Minutes | 47 (13.0%) | 43 (17.3%) |
| 15 to 19 Minutes | 22 (6.1%) | 44 (17.7%) |
| 20 to 24 Minutes | 38 (10.5%) | 4 (1.6%) |
| 25 to 29 Minutes | 2 (0.5%) | 0 (0.0%) |
| 30 to 34 Minutes | 20 (5.5%) | 21 (8.4%) |
| 35 to 39 Minutes | 0 (0.0%) | 0 (0.0%) |
| 40 to 44 Minutes | 0 (0.0%) | 0 (0.0%) |
| 45 to 59 Minutes | 36 (9.9%) | 8 (3.2%) |
| 60 to 89 Minutes | 28 (7.7%) | 10 (4.0%) |
| 90 or more Minutes | 0 (0.0%) | 0 (0.0%) |
Time of Departure to Work by Sex in Deadwood
The most frequent times of departure to work in Deadwood are 6:30 AM to 6:59 AM (53, 14.6%) for males and 12:00 PM to 3:59 PM (60, 24.1%) for females.
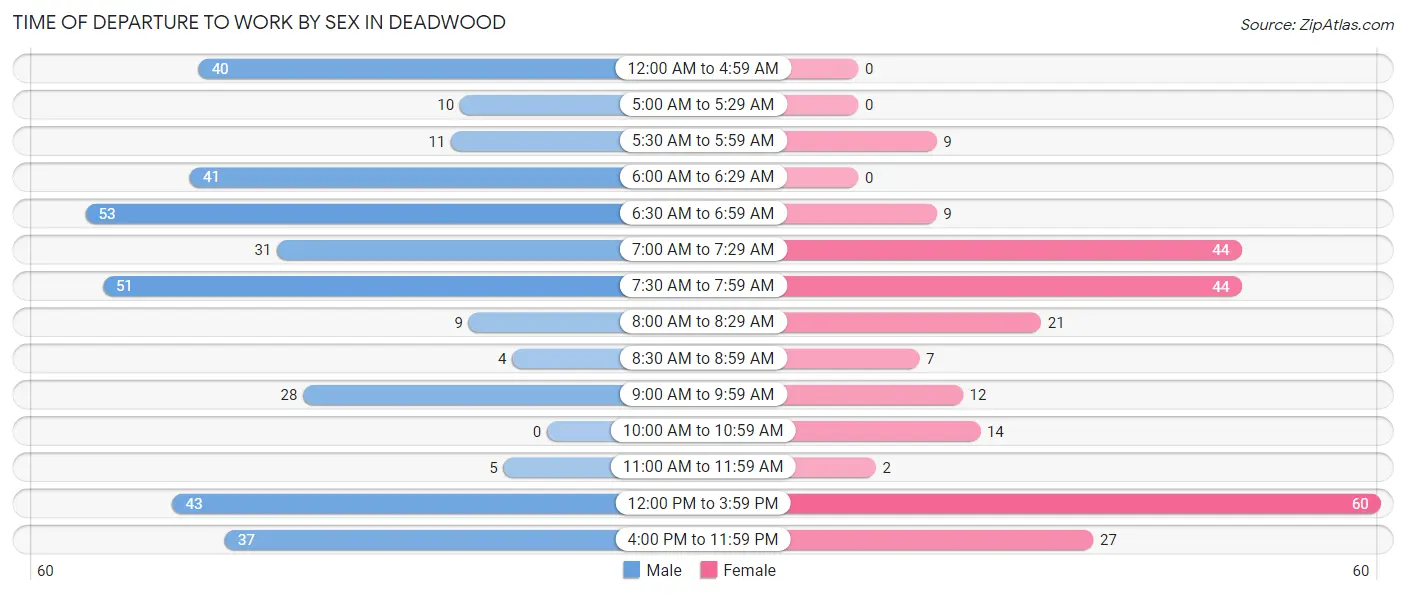
| Time of Departure | Male | Female |
| 12:00 AM to 4:59 AM | 40 (11.0%) | 0 (0.0%) |
| 5:00 AM to 5:29 AM | 10 (2.8%) | 0 (0.0%) |
| 5:30 AM to 5:59 AM | 11 (3.0%) | 9 (3.6%) |
| 6:00 AM to 6:29 AM | 41 (11.3%) | 0 (0.0%) |
| 6:30 AM to 6:59 AM | 53 (14.6%) | 9 (3.6%) |
| 7:00 AM to 7:29 AM | 31 (8.5%) | 44 (17.7%) |
| 7:30 AM to 7:59 AM | 51 (14.1%) | 44 (17.7%) |
| 8:00 AM to 8:29 AM | 9 (2.5%) | 21 (8.4%) |
| 8:30 AM to 8:59 AM | 4 (1.1%) | 7 (2.8%) |
| 9:00 AM to 9:59 AM | 28 (7.7%) | 12 (4.8%) |
| 10:00 AM to 10:59 AM | 0 (0.0%) | 14 (5.6%) |
| 11:00 AM to 11:59 AM | 5 (1.4%) | 2 (0.8%) |
| 12:00 PM to 3:59 PM | 43 (11.8%) | 60 (24.1%) |
| 4:00 PM to 11:59 PM | 37 (10.2%) | 27 (10.8%) |
| Total | 363 (100.0%) | 249 (100.0%) |
Housing Occupancy in Deadwood
Occupancy by Ownership in Deadwood
Of the total 709 dwellings in Deadwood, owner-occupied units account for 357 (50.3%), while renter-occupied units make up 352 (49.6%).
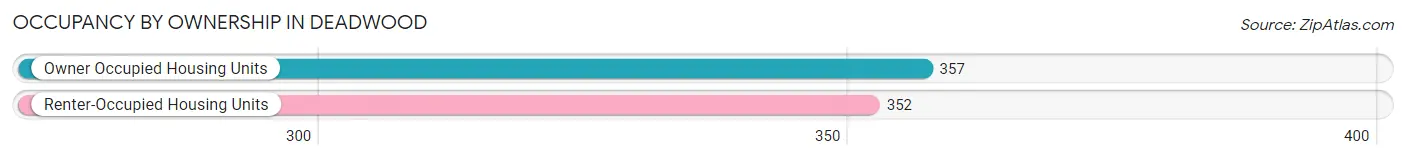
| Occupancy | # Housing Units | % Housing Units |
| Owner Occupied Housing Units | 357 | 50.3% |
| Renter-Occupied Housing Units | 352 | 49.6% |
| Total Occupied Housing Units | 709 | 100.0% |
Occupancy by Household Size in Deadwood
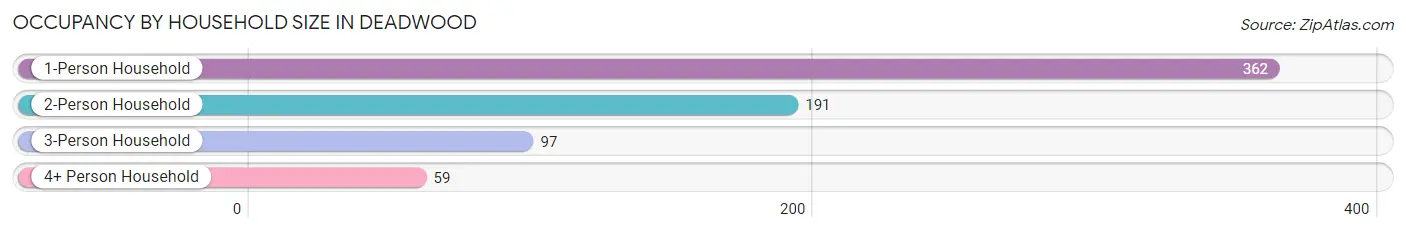
| Household Size | # Housing Units | % Housing Units |
| 1-Person Household | 362 | 51.1% |
| 2-Person Household | 191 | 26.9% |
| 3-Person Household | 97 | 13.7% |
| 4+ Person Household | 59 | 8.3% |
| Total Housing Units | 709 | 100.0% |
Occupancy by Ownership by Household Size in Deadwood
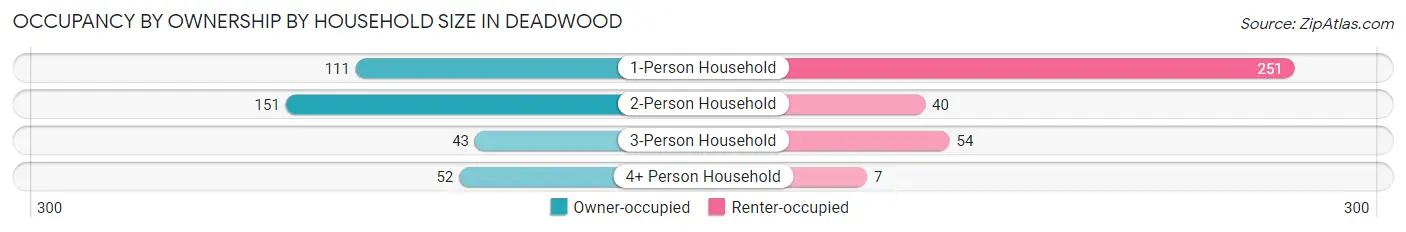
| Household Size | Owner-occupied | Renter-occupied |
| 1-Person Household | 111 (30.7%) | 251 (69.3%) |
| 2-Person Household | 151 (79.1%) | 40 (20.9%) |
| 3-Person Household | 43 (44.3%) | 54 (55.7%) |
| 4+ Person Household | 52 (88.1%) | 7 (11.9%) |
| Total Housing Units | 357 (50.3%) | 352 (49.6%) |
Occupancy by Educational Attainment in Deadwood
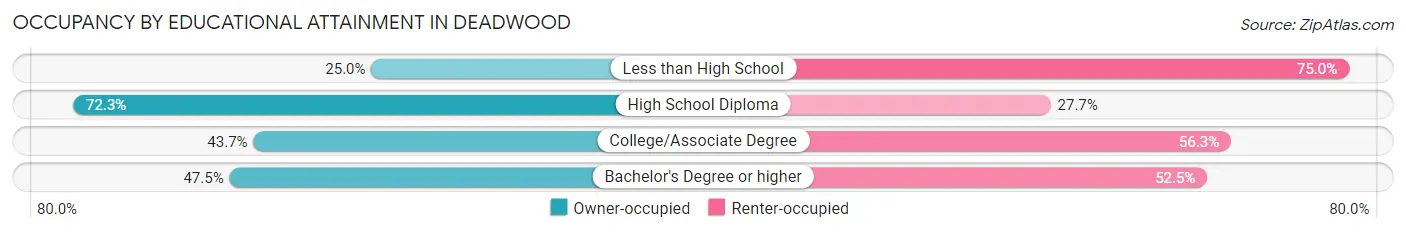
| Household Size | Owner-occupied | Renter-occupied |
| Less than High School | 8 (25.0%) | 24 (75.0%) |
| High School Diploma | 115 (72.3%) | 44 (27.7%) |
| College/Associate Degree | 139 (43.7%) | 179 (56.3%) |
| Bachelor's Degree or higher | 95 (47.5%) | 105 (52.5%) |
Occupancy by Age of Householder in Deadwood
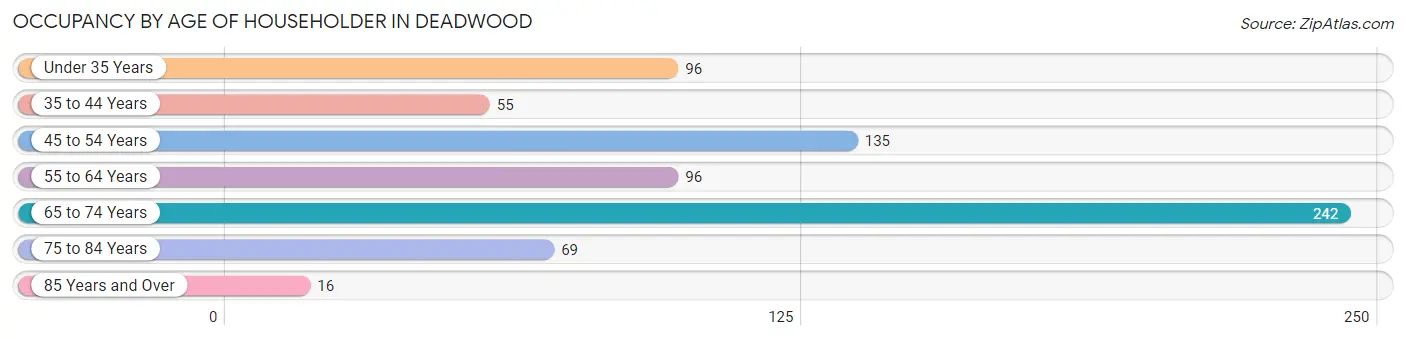
| Age Bracket | # Households | % Households |
| Under 35 Years | 96 | 13.5% |
| 35 to 44 Years | 55 | 7.8% |
| 45 to 54 Years | 135 | 19.0% |
| 55 to 64 Years | 96 | 13.5% |
| 65 to 74 Years | 242 | 34.1% |
| 75 to 84 Years | 69 | 9.7% |
| 85 Years and Over | 16 | 2.3% |
| Total | 709 | 100.0% |
Housing Finances in Deadwood
Median Income by Occupancy in Deadwood
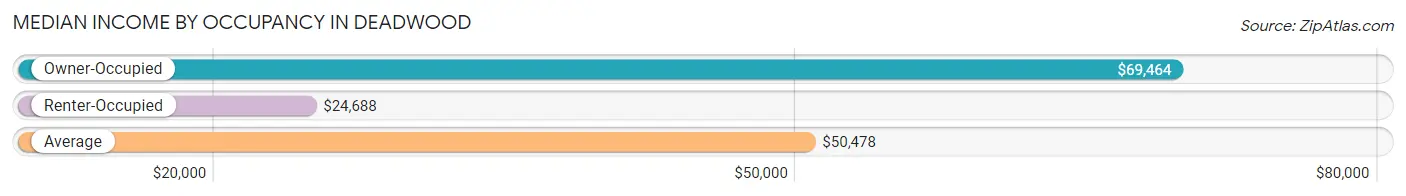
| Occupancy Type | # Households | Median Income |
| Owner-Occupied | 357 (50.3%) | $69,464 |
| Renter-Occupied | 352 (49.6%) | $24,688 |
| Average | 709 (100.0%) | $50,478 |
Occupancy by Householder Income Bracket in Deadwood
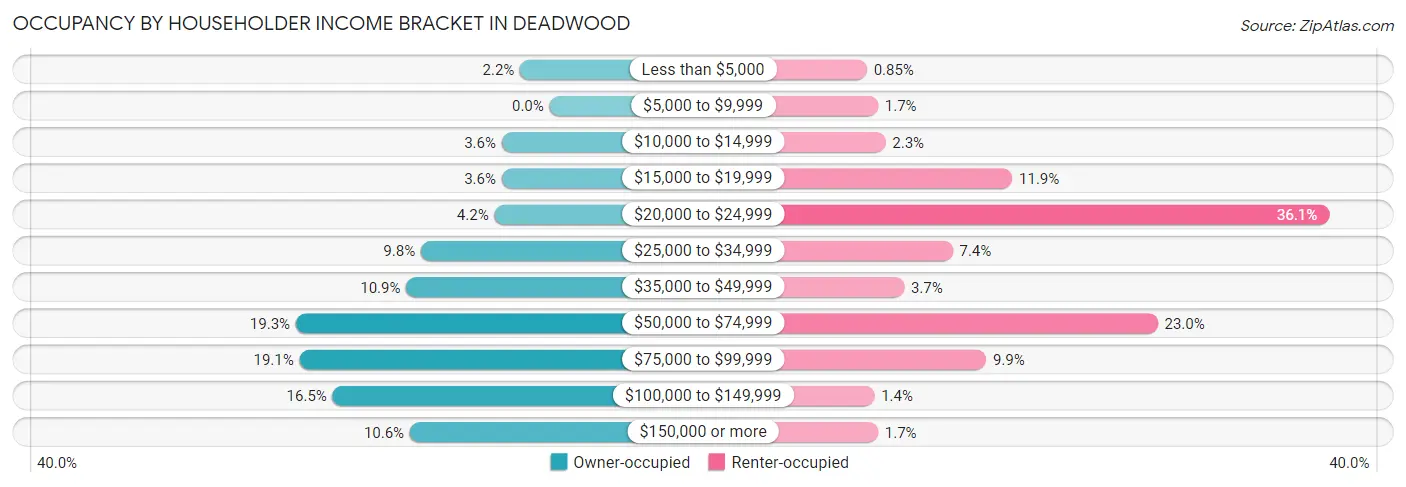
| Income Bracket | Owner-occupied | Renter-occupied |
| Less than $5,000 | 8 (2.2%) | 3 (0.9%) |
| $5,000 to $9,999 | 0 (0.0%) | 6 (1.7%) |
| $10,000 to $14,999 | 13 (3.6%) | 8 (2.3%) |
| $15,000 to $19,999 | 13 (3.6%) | 42 (11.9%) |
| $20,000 to $24,999 | 15 (4.2%) | 127 (36.1%) |
| $25,000 to $34,999 | 35 (9.8%) | 26 (7.4%) |
| $35,000 to $49,999 | 39 (10.9%) | 13 (3.7%) |
| $50,000 to $74,999 | 69 (19.3%) | 81 (23.0%) |
| $75,000 to $99,999 | 68 (19.1%) | 35 (9.9%) |
| $100,000 to $149,999 | 59 (16.5%) | 5 (1.4%) |
| $150,000 or more | 38 (10.6%) | 6 (1.7%) |
| Total | 357 (100.0%) | 352 (100.0%) |
Monthly Housing Cost Tiers in Deadwood
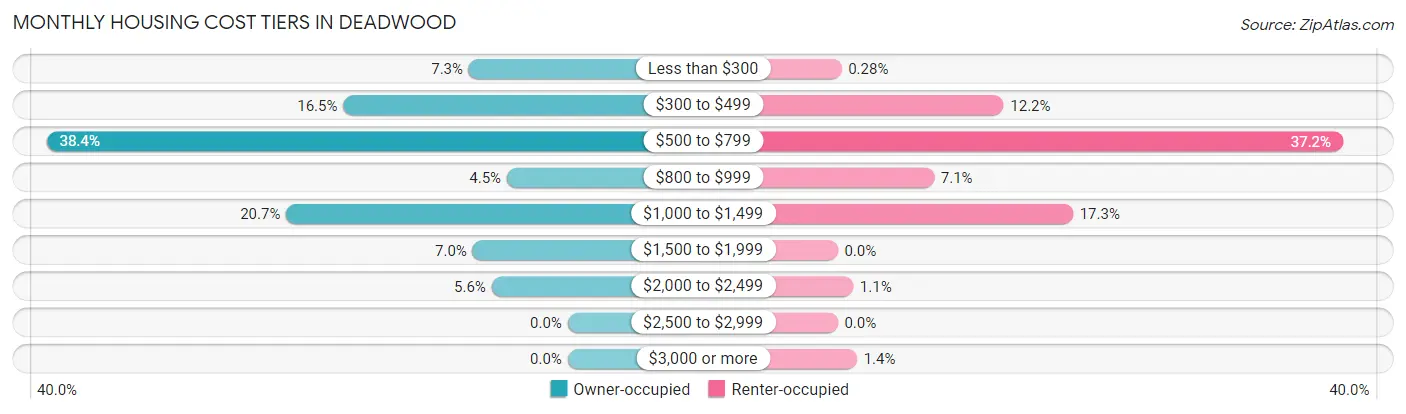
| Monthly Cost | Owner-occupied | Renter-occupied |
| Less than $300 | 26 (7.3%) | 1 (0.3%) |
| $300 to $499 | 59 (16.5%) | 43 (12.2%) |
| $500 to $799 | 137 (38.4%) | 131 (37.2%) |
| $800 to $999 | 16 (4.5%) | 25 (7.1%) |
| $1,000 to $1,499 | 74 (20.7%) | 61 (17.3%) |
| $1,500 to $1,999 | 25 (7.0%) | 0 (0.0%) |
| $2,000 to $2,499 | 20 (5.6%) | 4 (1.1%) |
| $2,500 to $2,999 | 0 (0.0%) | 0 (0.0%) |
| $3,000 or more | 0 (0.0%) | 5 (1.4%) |
| Total | 357 (100.0%) | 352 (100.0%) |
Physical Housing Characteristics in Deadwood
Housing Structures in Deadwood
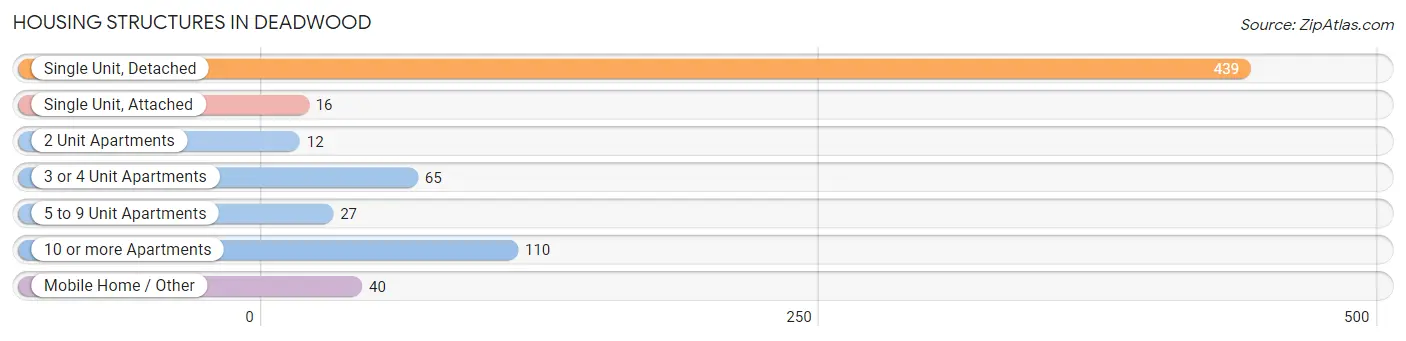
| Structure Type | # Housing Units | % Housing Units |
| Single Unit, Detached | 439 | 61.9% |
| Single Unit, Attached | 16 | 2.3% |
| 2 Unit Apartments | 12 | 1.7% |
| 3 or 4 Unit Apartments | 65 | 9.2% |
| 5 to 9 Unit Apartments | 27 | 3.8% |
| 10 or more Apartments | 110 | 15.5% |
| Mobile Home / Other | 40 | 5.6% |
| Total | 709 | 100.0% |
Housing Structures by Occupancy in Deadwood
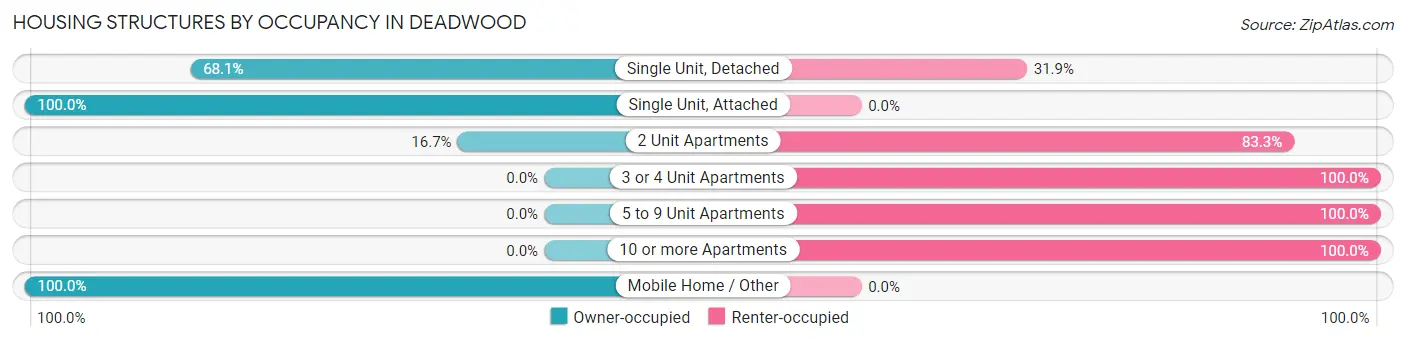
| Structure Type | Owner-occupied | Renter-occupied |
| Single Unit, Detached | 299 (68.1%) | 140 (31.9%) |
| Single Unit, Attached | 16 (100.0%) | 0 (0.0%) |
| 2 Unit Apartments | 2 (16.7%) | 10 (83.3%) |
| 3 or 4 Unit Apartments | 0 (0.0%) | 65 (100.0%) |
| 5 to 9 Unit Apartments | 0 (0.0%) | 27 (100.0%) |
| 10 or more Apartments | 0 (0.0%) | 110 (100.0%) |
| Mobile Home / Other | 40 (100.0%) | 0 (0.0%) |
| Total | 357 (50.3%) | 352 (49.6%) |
Housing Structures by Number of Rooms in Deadwood
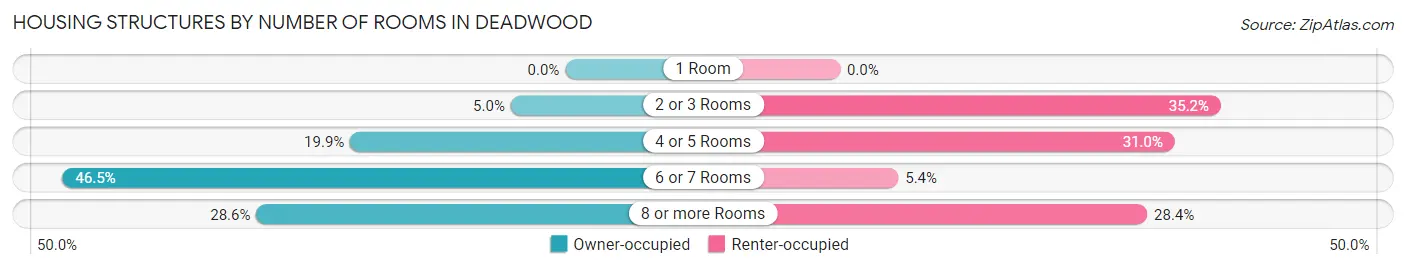
| Number of Rooms | Owner-occupied | Renter-occupied |
| 1 Room | 0 (0.0%) | 0 (0.0%) |
| 2 or 3 Rooms | 18 (5.0%) | 124 (35.2%) |
| 4 or 5 Rooms | 71 (19.9%) | 109 (31.0%) |
| 6 or 7 Rooms | 166 (46.5%) | 19 (5.4%) |
| 8 or more Rooms | 102 (28.6%) | 100 (28.4%) |
| Total | 357 (100.0%) | 352 (100.0%) |
Housing Structure by Heating Type in Deadwood
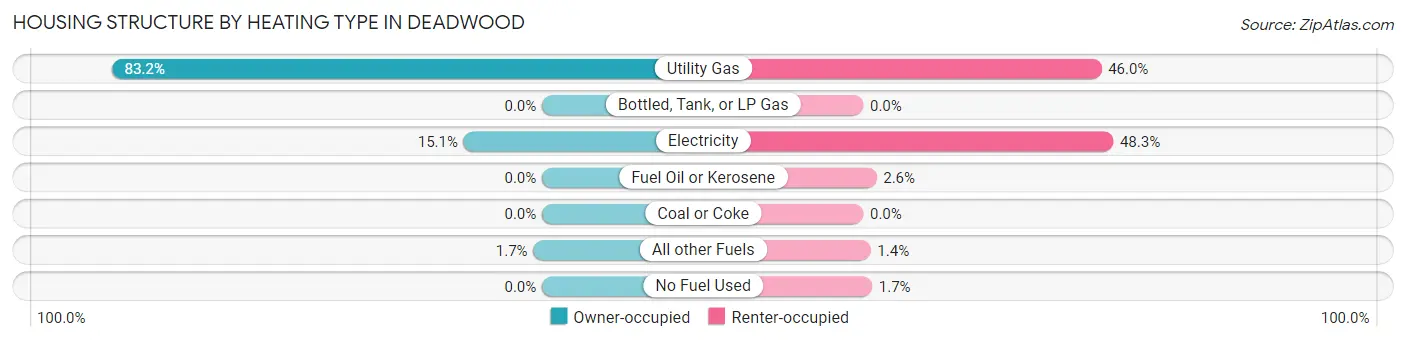
| Heating Type | Owner-occupied | Renter-occupied |
| Utility Gas | 297 (83.2%) | 162 (46.0%) |
| Bottled, Tank, or LP Gas | 0 (0.0%) | 0 (0.0%) |
| Electricity | 54 (15.1%) | 170 (48.3%) |
| Fuel Oil or Kerosene | 0 (0.0%) | 9 (2.6%) |
| Coal or Coke | 0 (0.0%) | 0 (0.0%) |
| All other Fuels | 6 (1.7%) | 5 (1.4%) |
| No Fuel Used | 0 (0.0%) | 6 (1.7%) |
| Total | 357 (100.0%) | 352 (100.0%) |
Household Vehicle Usage in Deadwood
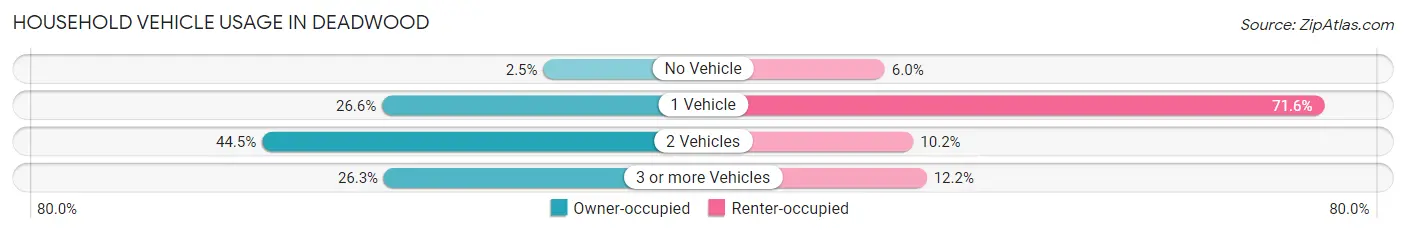
| Vehicles per Household | Owner-occupied | Renter-occupied |
| No Vehicle | 9 (2.5%) | 21 (6.0%) |
| 1 Vehicle | 95 (26.6%) | 252 (71.6%) |
| 2 Vehicles | 159 (44.5%) | 36 (10.2%) |
| 3 or more Vehicles | 94 (26.3%) | 43 (12.2%) |
| Total | 357 (100.0%) | 352 (100.0%) |
Real Estate & Mortgages in Deadwood
Real Estate and Mortgage Overview in Deadwood
| Characteristic | Without Mortgage | With Mortgage |
| Housing Units | 224 | 133 |
| Median Property Value | $217,400 | $207,500 |
| Median Household Income | $60,909 | $27 |
| Monthly Housing Costs | $578 | $0 |
| Real Estate Taxes | $2,333 | $9 |
Property Value by Mortgage Status in Deadwood
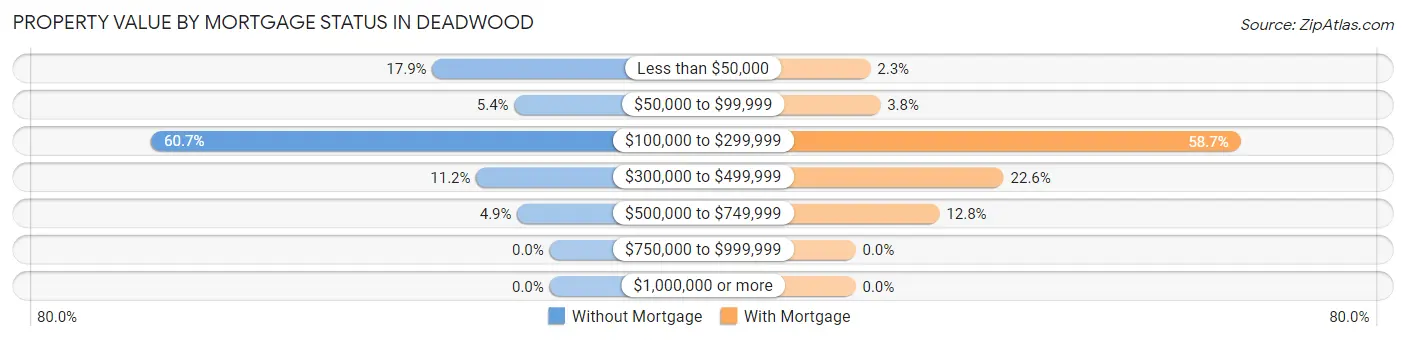
| Property Value | Without Mortgage | With Mortgage |
| Less than $50,000 | 40 (17.9%) | 3 (2.3%) |
| $50,000 to $99,999 | 12 (5.4%) | 5 (3.8%) |
| $100,000 to $299,999 | 136 (60.7%) | 78 (58.7%) |
| $300,000 to $499,999 | 25 (11.2%) | 30 (22.6%) |
| $500,000 to $749,999 | 11 (4.9%) | 17 (12.8%) |
| $750,000 to $999,999 | 0 (0.0%) | 0 (0.0%) |
| $1,000,000 or more | 0 (0.0%) | 0 (0.0%) |
| Total | 224 (100.0%) | 133 (100.0%) |
Household Income by Mortgage Status in Deadwood
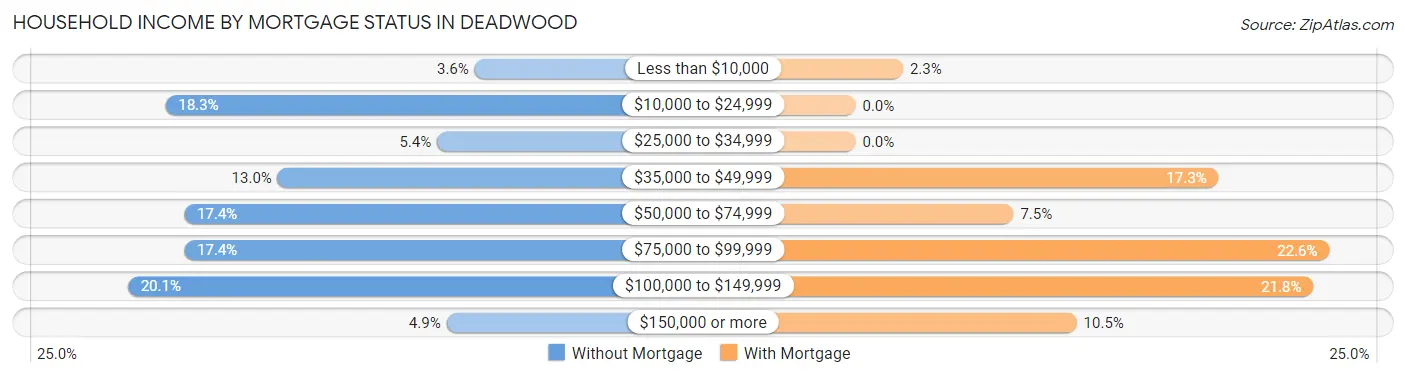
| Household Income | Without Mortgage | With Mortgage |
| Less than $10,000 | 8 (3.6%) | 3 (2.3%) |
| $10,000 to $24,999 | 41 (18.3%) | 0 (0.0%) |
| $25,000 to $34,999 | 12 (5.4%) | 0 (0.0%) |
| $35,000 to $49,999 | 29 (13.0%) | 23 (17.3%) |
| $50,000 to $74,999 | 39 (17.4%) | 10 (7.5%) |
| $75,000 to $99,999 | 39 (17.4%) | 30 (22.6%) |
| $100,000 to $149,999 | 45 (20.1%) | 29 (21.8%) |
| $150,000 or more | 11 (4.9%) | 14 (10.5%) |
| Total | 224 (100.0%) | 133 (100.0%) |
Property Value to Household Income Ratio in Deadwood
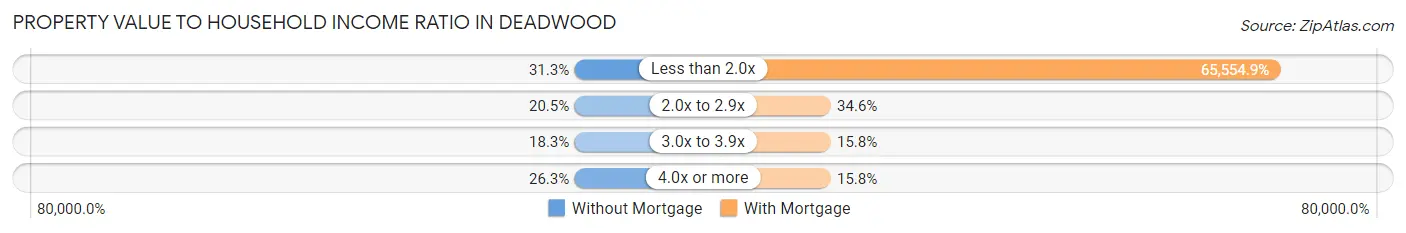
| Value-to-Income Ratio | Without Mortgage | With Mortgage |
| Less than 2.0x | 70 (31.2%) | 87,188 (65,554.9%) |
| 2.0x to 2.9x | 46 (20.5%) | 46 (34.6%) |
| 3.0x to 3.9x | 41 (18.3%) | 21 (15.8%) |
| 4.0x or more | 59 (26.3%) | 21 (15.8%) |
| Total | 224 (100.0%) | 133 (100.0%) |
Real Estate Taxes by Mortgage Status in Deadwood
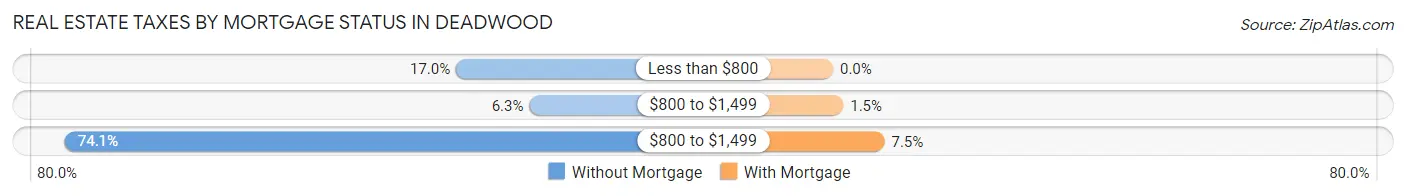
| Property Taxes | Without Mortgage | With Mortgage |
| Less than $800 | 38 (17.0%) | 0 (0.0%) |
| $800 to $1,499 | 14 (6.2%) | 2 (1.5%) |
| $800 to $1,499 | 166 (74.1%) | 10 (7.5%) |
| Total | 224 (100.0%) | 133 (100.0%) |
Health & Disability in Deadwood
Health Insurance Coverage by Age in Deadwood
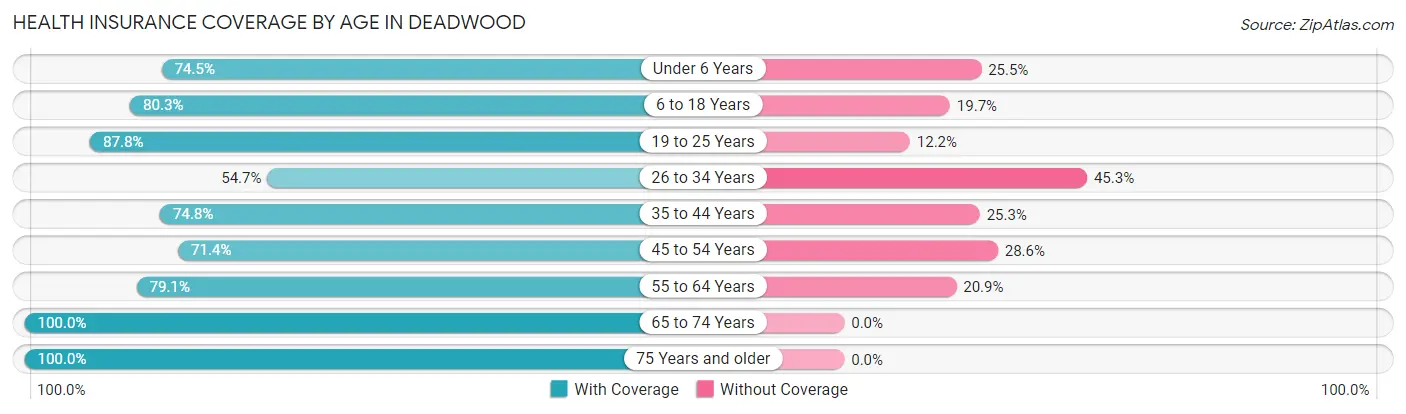
| Age Bracket | With Coverage | Without Coverage |
| Under 6 Years | 35 (74.5%) | 12 (25.5%) |
| 6 to 18 Years | 102 (80.3%) | 25 (19.7%) |
| 19 to 25 Years | 122 (87.8%) | 17 (12.2%) |
| 26 to 34 Years | 75 (54.7%) | 62 (45.3%) |
| 35 to 44 Years | 74 (74.8%) | 25 (25.3%) |
| 45 to 54 Years | 172 (71.4%) | 69 (28.6%) |
| 55 to 64 Years | 144 (79.1%) | 38 (20.9%) |
| 65 to 74 Years | 297 (100.0%) | 0 (0.0%) |
| 75 Years and older | 114 (100.0%) | 0 (0.0%) |
| Total | 1,135 (82.1%) | 248 (17.9%) |
Health Insurance Coverage by Citizenship Status in Deadwood
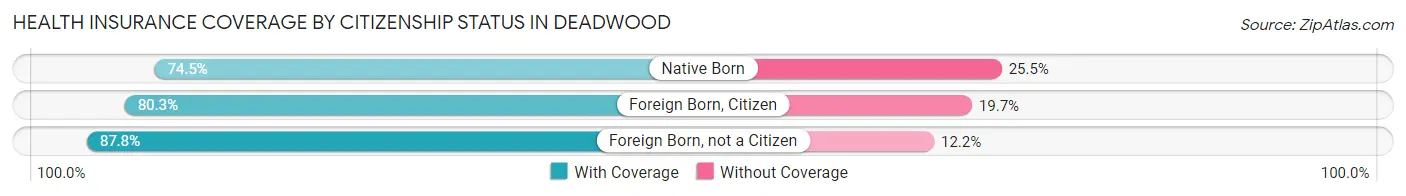
| Citizenship Status | With Coverage | Without Coverage |
| Native Born | 35 (74.5%) | 12 (25.5%) |
| Foreign Born, Citizen | 102 (80.3%) | 25 (19.7%) |
| Foreign Born, not a Citizen | 122 (87.8%) | 17 (12.2%) |
Health Insurance Coverage by Household Income in Deadwood
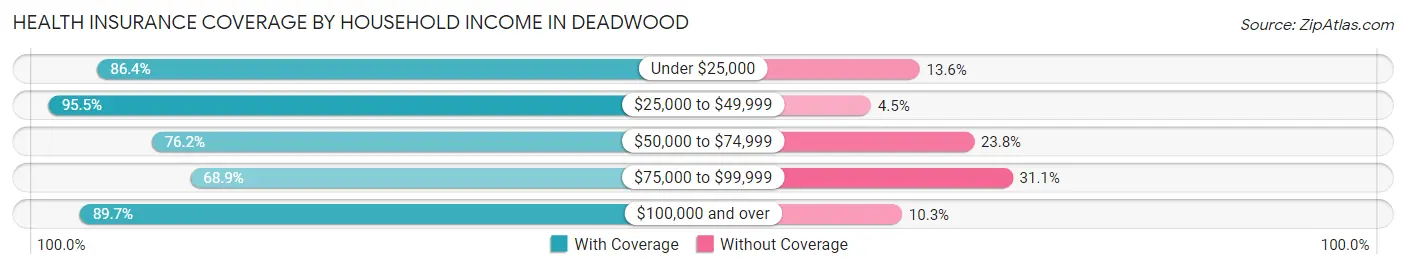
| Household Income | With Coverage | Without Coverage |
| Under $25,000 | 266 (86.4%) | 42 (13.6%) |
| $25,000 to $49,999 | 148 (95.5%) | 7 (4.5%) |
| $50,000 to $74,999 | 259 (76.2%) | 81 (23.8%) |
| $75,000 to $99,999 | 193 (68.9%) | 87 (31.1%) |
| $100,000 and over | 269 (89.7%) | 31 (10.3%) |
Public vs Private Health Insurance Coverage by Age in Deadwood
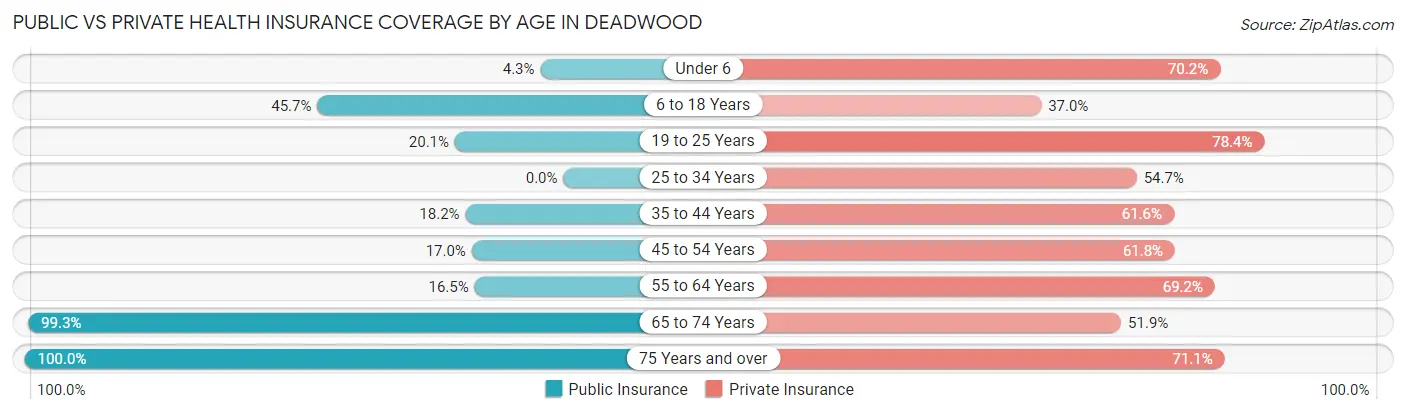
| Age Bracket | Public Insurance | Private Insurance |
| Under 6 | 2 (4.3%) | 33 (70.2%) |
| 6 to 18 Years | 58 (45.7%) | 47 (37.0%) |
| 19 to 25 Years | 28 (20.1%) | 109 (78.4%) |
| 25 to 34 Years | 0 (0.0%) | 75 (54.7%) |
| 35 to 44 Years | 18 (18.2%) | 61 (61.6%) |
| 45 to 54 Years | 41 (17.0%) | 149 (61.8%) |
| 55 to 64 Years | 30 (16.5%) | 126 (69.2%) |
| 65 to 74 Years | 295 (99.3%) | 154 (51.8%) |
| 75 Years and over | 114 (100.0%) | 81 (71.1%) |
| Total | 586 (42.4%) | 835 (60.4%) |
Disability Status by Sex by Age in Deadwood
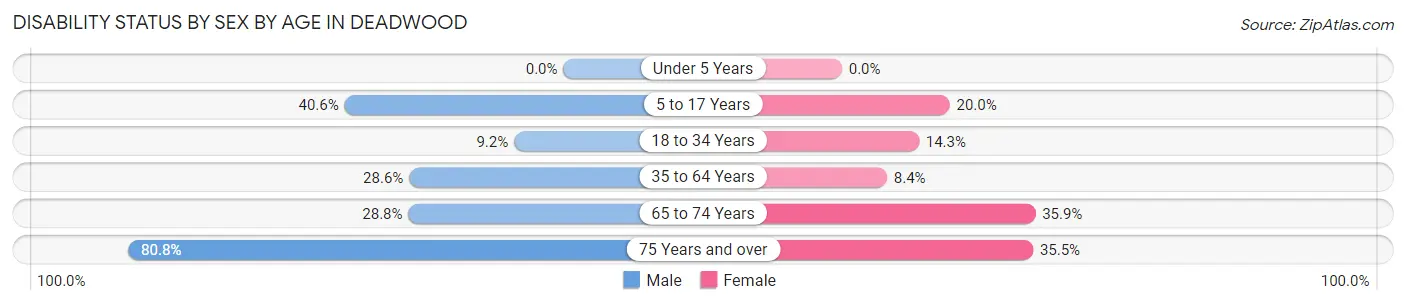
| Age Bracket | Male | Female |
| Under 5 Years | 0 (0.0%) | 0 (0.0%) |
| 5 to 17 Years | 13 (40.6%) | 19 (20.0%) |
| 18 to 34 Years | 15 (9.1%) | 16 (14.3%) |
| 35 to 64 Years | 81 (28.6%) | 20 (8.4%) |
| 65 to 74 Years | 63 (28.8%) | 28 (35.9%) |
| 75 Years and over | 42 (80.8%) | 22 (35.5%) |
Disability Class by Sex by Age in Deadwood
Disability Class: Hearing Difficulty
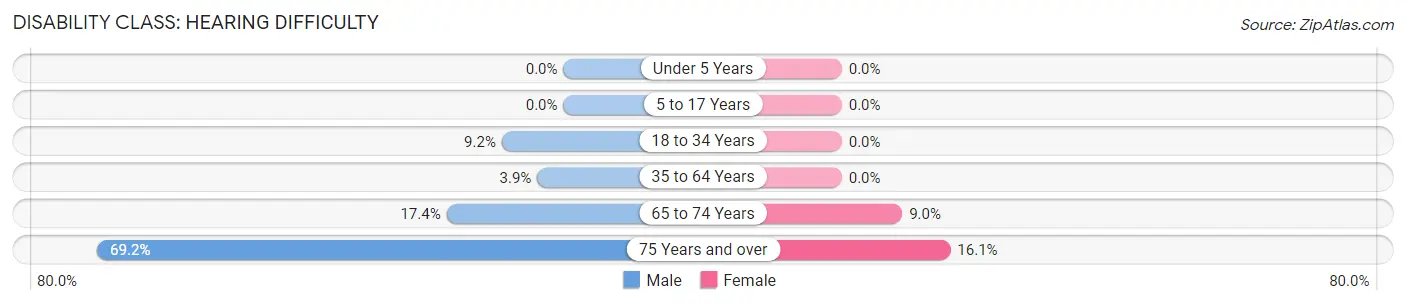
| Age Bracket | Male | Female |
| Under 5 Years | 0 (0.0%) | 0 (0.0%) |
| 5 to 17 Years | 0 (0.0%) | 0 (0.0%) |
| 18 to 34 Years | 15 (9.1%) | 0 (0.0%) |
| 35 to 64 Years | 11 (3.9%) | 0 (0.0%) |
| 65 to 74 Years | 38 (17.3%) | 7 (9.0%) |
| 75 Years and over | 36 (69.2%) | 10 (16.1%) |
Disability Class: Vision Difficulty
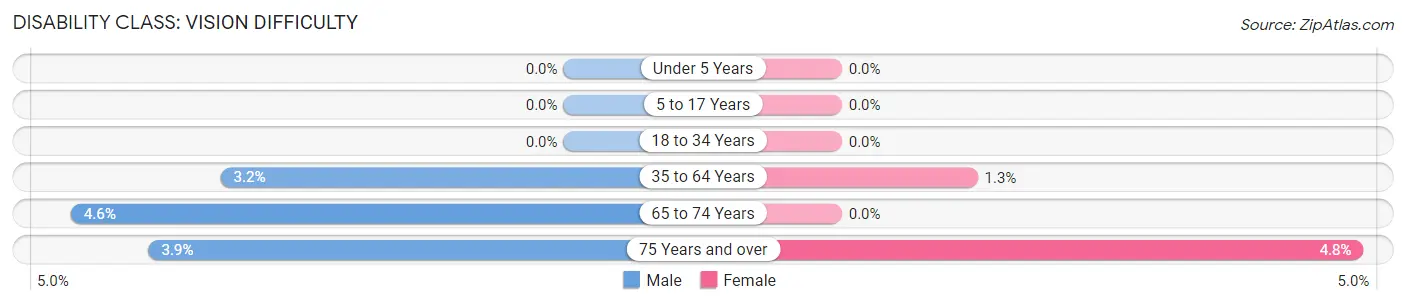
| Age Bracket | Male | Female |
| Under 5 Years | 0 (0.0%) | 0 (0.0%) |
| 5 to 17 Years | 0 (0.0%) | 0 (0.0%) |
| 18 to 34 Years | 0 (0.0%) | 0 (0.0%) |
| 35 to 64 Years | 9 (3.2%) | 3 (1.3%) |
| 65 to 74 Years | 10 (4.6%) | 0 (0.0%) |
| 75 Years and over | 2 (3.8%) | 3 (4.8%) |
Disability Class: Cognitive Difficulty
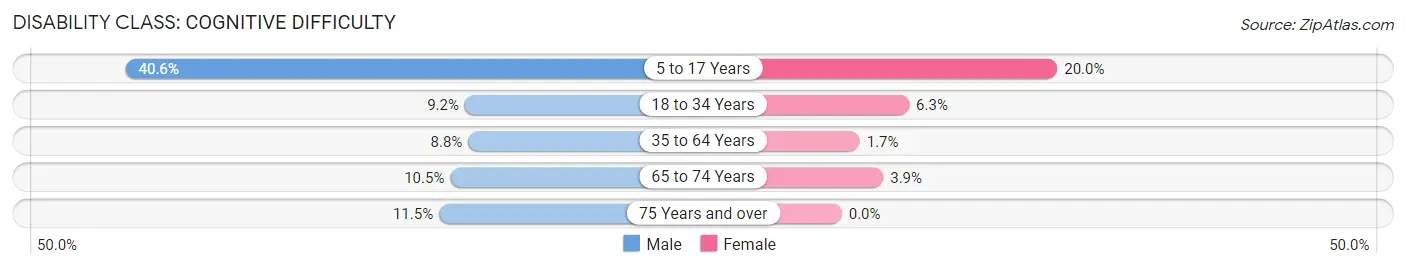
| Age Bracket | Male | Female |
| 5 to 17 Years | 13 (40.6%) | 19 (20.0%) |
| 18 to 34 Years | 15 (9.1%) | 7 (6.2%) |
| 35 to 64 Years | 25 (8.8%) | 4 (1.7%) |
| 65 to 74 Years | 23 (10.5%) | 3 (3.8%) |
| 75 Years and over | 6 (11.5%) | 0 (0.0%) |
Disability Class: Ambulatory Difficulty
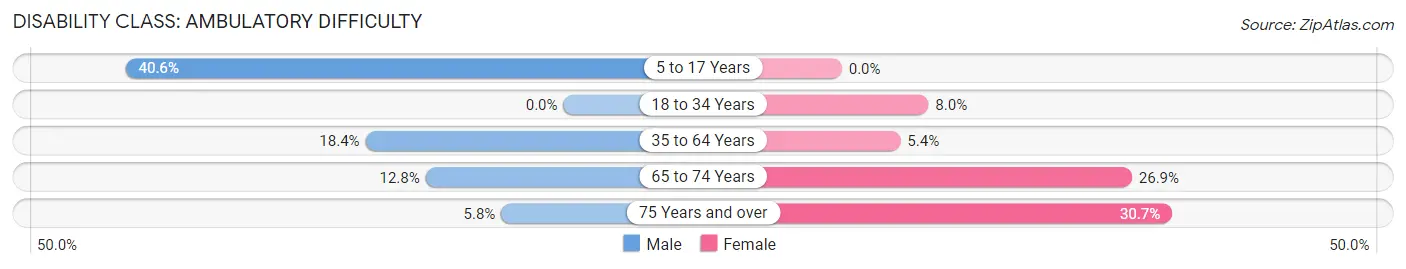
| Age Bracket | Male | Female |
| 5 to 17 Years | 13 (40.6%) | 0 (0.0%) |
| 18 to 34 Years | 0 (0.0%) | 9 (8.0%) |
| 35 to 64 Years | 52 (18.4%) | 13 (5.4%) |
| 65 to 74 Years | 28 (12.8%) | 21 (26.9%) |
| 75 Years and over | 3 (5.8%) | 19 (30.6%) |
Disability Class: Self-Care Difficulty
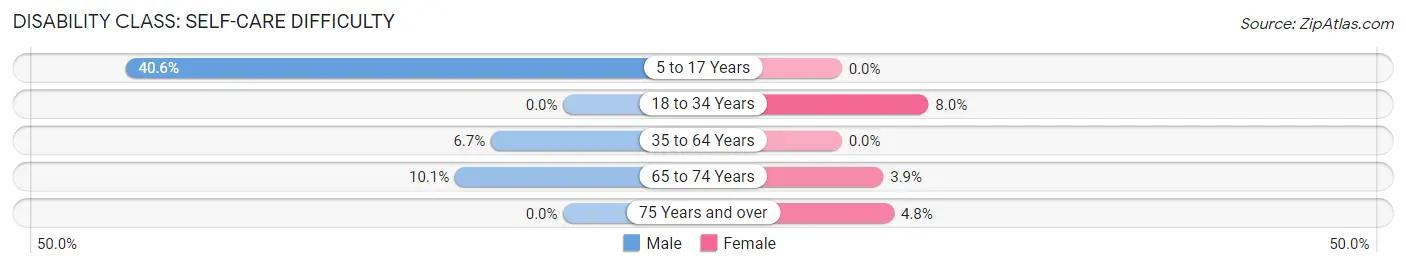
| Age Bracket | Male | Female |
| 5 to 17 Years | 13 (40.6%) | 0 (0.0%) |
| 18 to 34 Years | 0 (0.0%) | 9 (8.0%) |
| 35 to 64 Years | 19 (6.7%) | 0 (0.0%) |
| 65 to 74 Years | 22 (10.1%) | 3 (3.8%) |
| 75 Years and over | 0 (0.0%) | 3 (4.8%) |
Technology Access in Deadwood
Computing Device Access in Deadwood
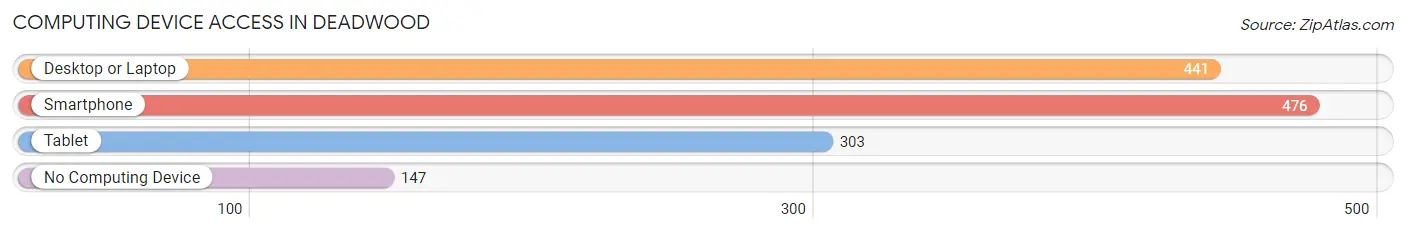
| Device Type | # Households | % Households |
| Desktop or Laptop | 441 | 62.2% |
| Smartphone | 476 | 67.1% |
| Tablet | 303 | 42.7% |
| No Computing Device | 147 | 20.7% |
| Total | 709 | 100.0% |
Internet Access in Deadwood
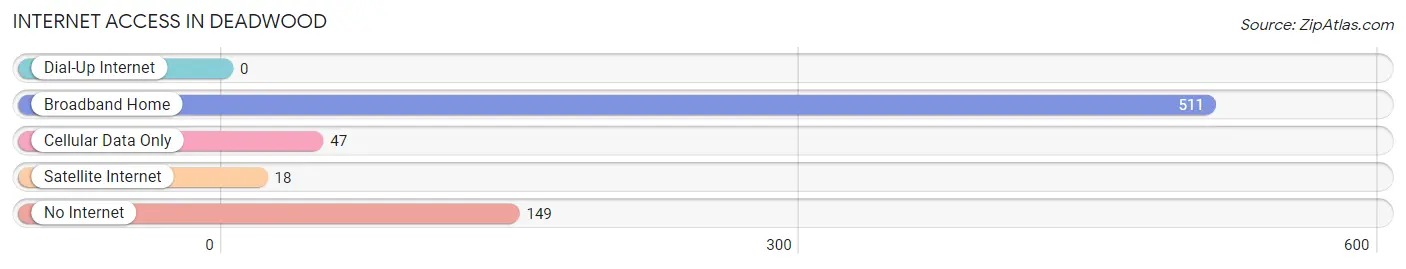
| Internet Type | # Households | % Households |
| Dial-Up Internet | 0 | 0.0% |
| Broadband Home | 511 | 72.1% |
| Cellular Data Only | 47 | 6.6% |
| Satellite Internet | 18 | 2.5% |
| No Internet | 149 | 21.0% |
| Total | 709 | 100.0% |
Deadwood Summary
History
The history of Deadwood, South Dakota dates back to the mid-1800s when gold was discovered in the area. The discovery of gold in the Black Hills of South Dakota brought thousands of prospectors to the area in search of their fortunes. The town of Deadwood was founded in 1876 and quickly became a bustling mining town. The town was named after the dead trees that lined the gulch where the gold was discovered.
The town of Deadwood quickly grew to become a major hub for the gold mining industry in the region. The town was home to many saloons, gambling halls, and brothels. It was also home to some of the most famous figures of the Wild West, including Wild Bill Hickok and Calamity Jane.
The town of Deadwood was also the site of some of the most famous gunfights in the Wild West. In 1876, Wild Bill Hickok was shot and killed in a saloon in Deadwood. This event was later immortalized in the movie "Deadwood".
The town of Deadwood was also the site of the infamous "Deadwood Stagecoach Robbery" in 1877. This robbery was the largest robbery in the history of the American West and resulted in the death of two lawmen.
The town of Deadwood continued to grow and prosper until the early 1900s when the gold mining industry began to decline. The town was eventually abandoned in the 1930s and remained a ghost town until the late 1980s when it was revitalized as a tourist destination.
Geography
Deadwood is located in the Black Hills of South Dakota, approximately 60 miles south of Rapid City. The town is situated in a narrow valley surrounded by the Black Hills National Forest. The town is located at an elevation of 4,500 feet and has a total area of 1.2 square miles.
The climate in Deadwood is semi-arid with hot summers and cold winters. The average annual temperature is 45 degrees Fahrenheit and the average annual precipitation is 16 inches.
Economy
The economy of Deadwood is largely based on tourism. The town is home to several casinos, hotels, restaurants, and other tourist attractions. The town also has a vibrant arts and culture scene, with several galleries, museums, and theaters.
The town is also home to several manufacturing companies, including a furniture factory and a brewery. The town also has a vibrant retail sector, with several stores and boutiques.
Demographics
As of the 2010 census, the population of Deadwood was 1,270. The racial makeup of the town was 94.3% White, 0.2% African American, 0.8% Native American, 0.2% Asian, 0.1% Pacific Islander, 0.2% from other races, and 4.2% from two or more races. Hispanic or Latino of any race were 1.2% of the population.
The median income for a household in Deadwood was $37,500 and the median income for a family was $45,000. The per capita income for the town was $20,000. About 10.3% of families and 13.2% of the population were below the poverty line, including 16.7% of those under age 18 and 8.3% of those age 65 or over.
Common Questions
What is Per Capita Income in Deadwood?
Per Capita income in Deadwood is $33,089.
What is the Median Family Income in Deadwood?
Median Family Income in Deadwood is $78,125.
What is the Median Household income in Deadwood?
Median Household Income in Deadwood is $50,478.
What is Income or Wage Gap in Deadwood?
Income or Wage Gap in Deadwood is 3.4%.
Women in Deadwood earn 96.6 cents for every dollar earned by a man.
What is Inequality or Gini Index in Deadwood?
Inequality or Gini Index in Deadwood is 0.43.
What is the Total Population of Deadwood?
Total Population of Deadwood is 1,423.
What is the Total Male Population of Deadwood?
Total Male Population of Deadwood is 795.
What is the Total Female Population of Deadwood?
Total Female Population of Deadwood is 628.
What is the Ratio of Males per 100 Females in Deadwood?
There are 126.59 Males per 100 Females in Deadwood.
What is the Ratio of Females per 100 Males in Deadwood?
There are 78.99 Females per 100 Males in Deadwood.
What is the Median Population Age in Deadwood?
Median Population Age in Deadwood is 50.3 Years.
What is the Average Family Size in Deadwood
Average Family Size in Deadwood is 2.9 People.
What is the Average Household Size in Deadwood
Average Household Size in Deadwood is 1.9 People.
How Large is the Labor Force in Deadwood?
There are 769 People in the Labor Forcein in Deadwood.
What is the Percentage of People in the Labor Force in Deadwood?
60.0% of People are in the Labor Force in Deadwood.
What is the Unemployment Rate in Deadwood?
Unemployment Rate in Deadwood is 4.6%.