Accokeek, MD Map & Demographics
Accokeek Map
Accokeek Overview
$55,761
PER CAPITA INCOME
$176,532
AVG FAMILY INCOME
$150,917
AVG HOUSEHOLD INCOME
10.3%
WAGE / INCOME GAP [ % ]
89.7¢/ $1
WAGE / INCOME GAP [ $ ]
0.33
INEQUALITY / GINI INDEX
12,745
TOTAL POPULATION
6,295
MALE POPULATION
6,450
FEMALE POPULATION
97.60
MALES / 100 FEMALES
102.46
FEMALES / 100 MALES
43.2
MEDIAN AGE
3.5
AVG FAMILY SIZE
3.0
AVG HOUSEHOLD SIZE
7,544
LABOR FORCE [ PEOPLE ]
74.3%
PERCENT IN LABOR FORCE
8.9%
UNEMPLOYMENT RATE
Accokeek Zip Codes
Accokeek Area Codes
Income in Accokeek
Income Overview in Accokeek
Per Capita Income in Accokeek is $55,761, while median incomes of families and households are $176,532 and $150,917 respectively.
| Characteristic | Number | Measure |
| Per Capita Income | 12,745 | $55,761 |
| Median Family Income | 3,048 | $176,532 |
| Mean Family Income | 3,048 | $177,312 |
| Median Household Income | 4,290 | $150,917 |
| Mean Household Income | 4,290 | $163,829 |
| Income Deficit | 3,048 | $0 |
| Wage / Income Gap (%) | 12,745 | 10.29% |
| Wage / Income Gap ($) | 12,745 | 89.71¢ per $1 |
| Gini / Inequality Index | 12,745 | 0.33 |
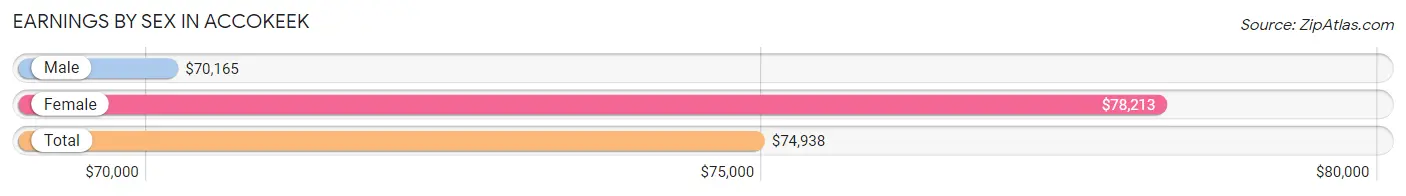
Earnings by Sex in Accokeek
Average Earnings in Accokeek are $74,938, $70,165 for men and $78,213 for women, a difference of 10.3%.
| Sex | Number | Average Earnings |
| Male | 3,586 (48.5%) | $70,165 |
| Female | 3,801 (51.5%) | $78,213 |
| Total | 7,387 (100.0%) | $74,938 |
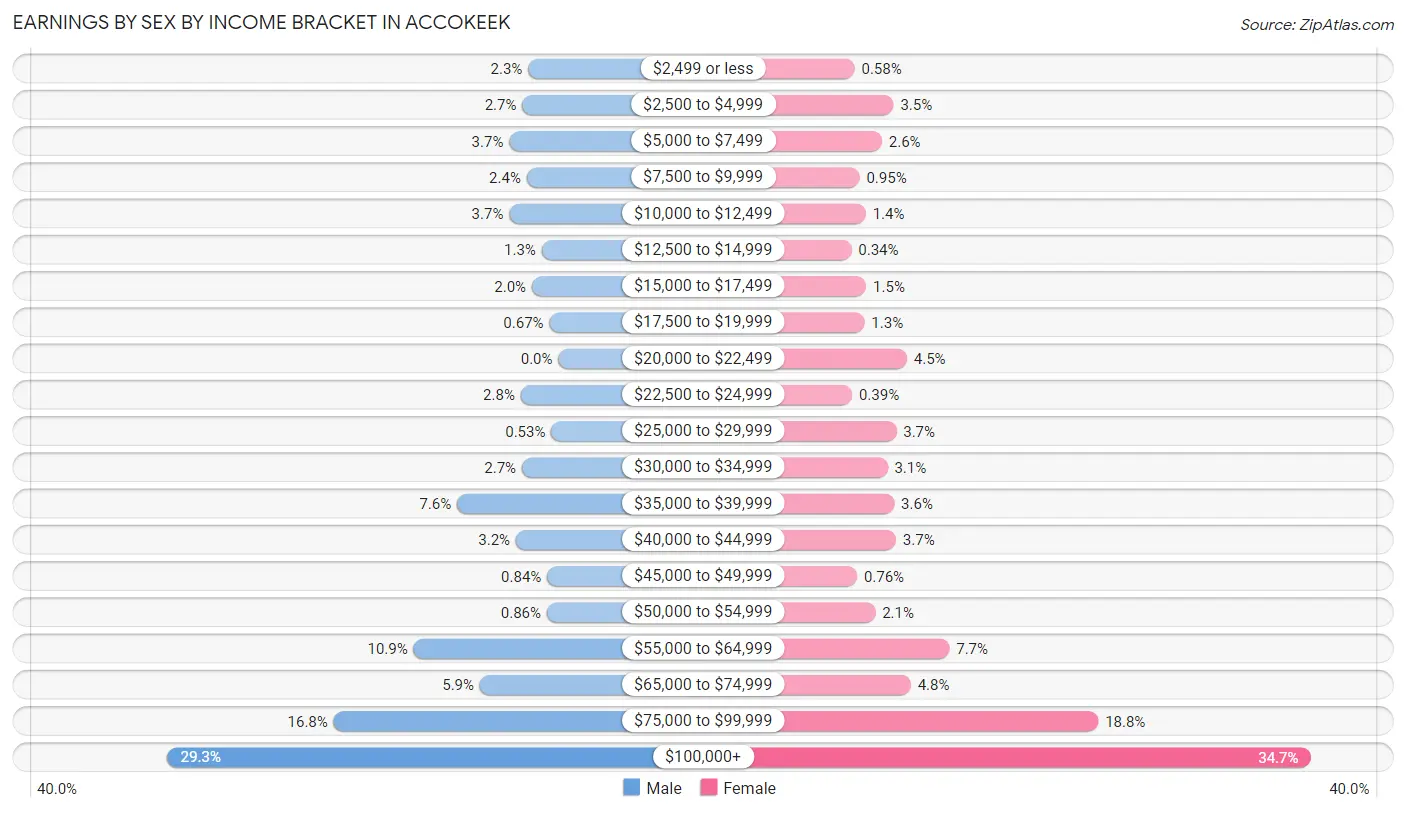
Earnings by Sex by Income Bracket in Accokeek
The most common earnings brackets in Accokeek are $100,000+ for men (1,050 | 29.3%) and $100,000+ for women (1,320 | 34.7%).
| Income | Male | Female |
| $2,499 or less | 81 (2.3%) | 22 (0.6%) |
| $2,500 to $4,999 | 97 (2.7%) | 133 (3.5%) |
| $5,000 to $7,499 | 132 (3.7%) | 100 (2.6%) |
| $7,500 to $9,999 | 85 (2.4%) | 36 (0.9%) |
| $10,000 to $12,499 | 132 (3.7%) | 54 (1.4%) |
| $12,500 to $14,999 | 45 (1.3%) | 13 (0.3%) |
| $15,000 to $17,499 | 71 (2.0%) | 55 (1.5%) |
| $17,500 to $19,999 | 24 (0.7%) | 50 (1.3%) |
| $20,000 to $22,499 | 0 (0.0%) | 171 (4.5%) |
| $22,500 to $24,999 | 101 (2.8%) | 15 (0.4%) |
| $25,000 to $29,999 | 19 (0.5%) | 141 (3.7%) |
| $30,000 to $34,999 | 98 (2.7%) | 116 (3.0%) |
| $35,000 to $39,999 | 272 (7.6%) | 135 (3.5%) |
| $40,000 to $44,999 | 114 (3.2%) | 140 (3.7%) |
| $45,000 to $49,999 | 30 (0.8%) | 29 (0.8%) |
| $50,000 to $54,999 | 31 (0.9%) | 81 (2.1%) |
| $55,000 to $64,999 | 389 (10.8%) | 292 (7.7%) |
| $65,000 to $74,999 | 211 (5.9%) | 182 (4.8%) |
| $75,000 to $99,999 | 604 (16.8%) | 716 (18.8%) |
| $100,000+ | 1,050 (29.3%) | 1,320 (34.7%) |
| Total | 3,586 (100.0%) | 3,801 (100.0%) |
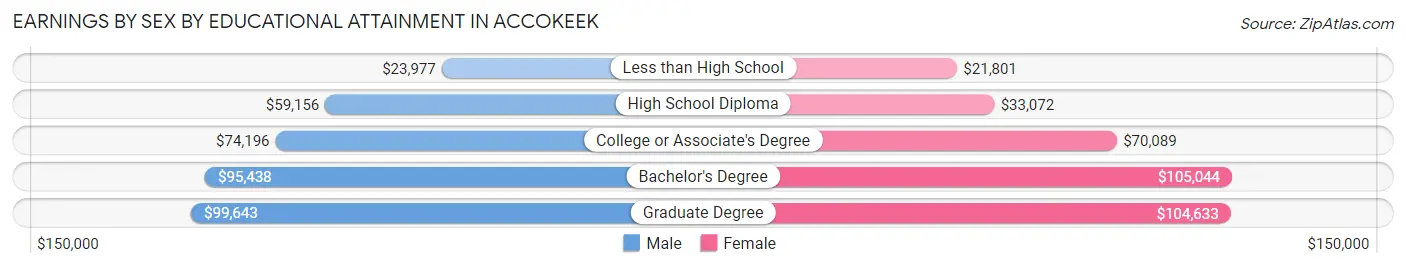
Earnings by Sex by Educational Attainment in Accokeek
Average earnings in Accokeek are $73,218 for men and $79,963 for women, a difference of 8.4%. Men with an educational attainment of graduate degree enjoy the highest average annual earnings of $99,643, while those with less than high school education earn the least with $23,977. Women with an educational attainment of bachelor's degree earn the most with the average annual earnings of $105,044, while those with less than high school education have the smallest earnings of $21,801.
| Educational Attainment | Male Income | Female Income |
| Less than High School | $23,977 | $21,801 |
| High School Diploma | $59,156 | $33,072 |
| College or Associate's Degree | $74,196 | $70,089 |
| Bachelor's Degree | $95,438 | $105,044 |
| Graduate Degree | $99,643 | $104,633 |
| Total | $73,218 | $79,963 |
Family Income in Accokeek
Family Income Brackets in Accokeek
According to the Accokeek family income data, there are 1,231 families falling into the $200,000+ income range, which is the most common income bracket and makes up 40.4% of all families.
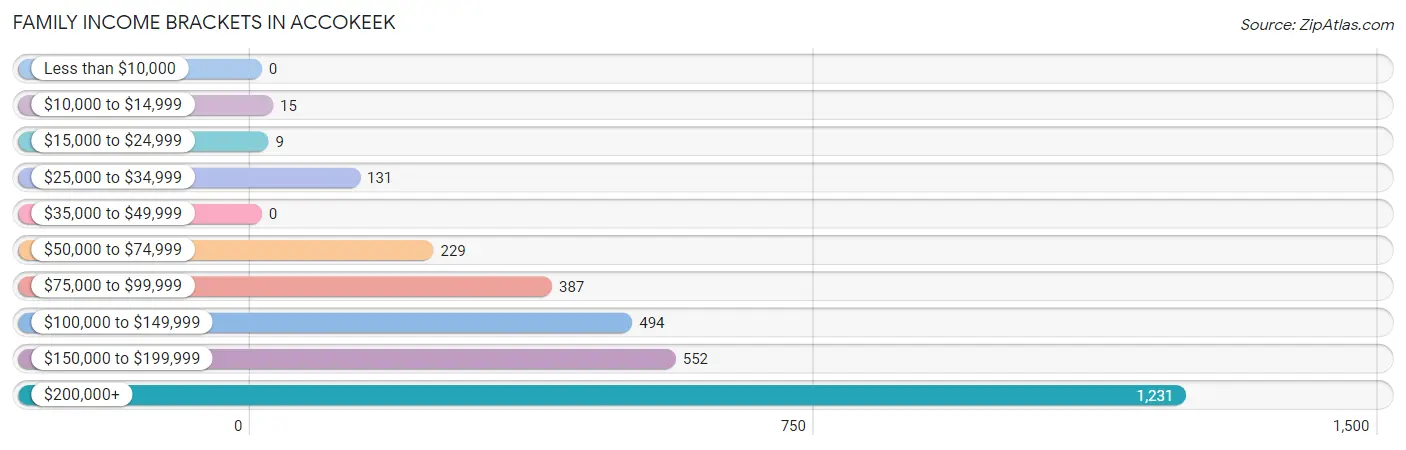
| Income Bracket | # Families | % Families |
| Less than $10,000 | 0 | 0.0% |
| $10,000 to $14,999 | 15 | 0.5% |
| $15,000 to $24,999 | 9 | 0.3% |
| $25,000 to $34,999 | 131 | 4.3% |
| $35,000 to $49,999 | 0 | 0.0% |
| $50,000 to $74,999 | 229 | 7.5% |
| $75,000 to $99,999 | 387 | 12.7% |
| $100,000 to $149,999 | 494 | 16.2% |
| $150,000 to $199,999 | 552 | 18.1% |
| $200,000+ | 1,231 | 40.4% |
Family Income by Famaliy Size in Accokeek
6-person families (86 | 2.8%) account for the highest median family income in Accokeek with $240,238 per family, while 3-person families (732 | 24.0%) have the highest median income of $73,704 per family member.
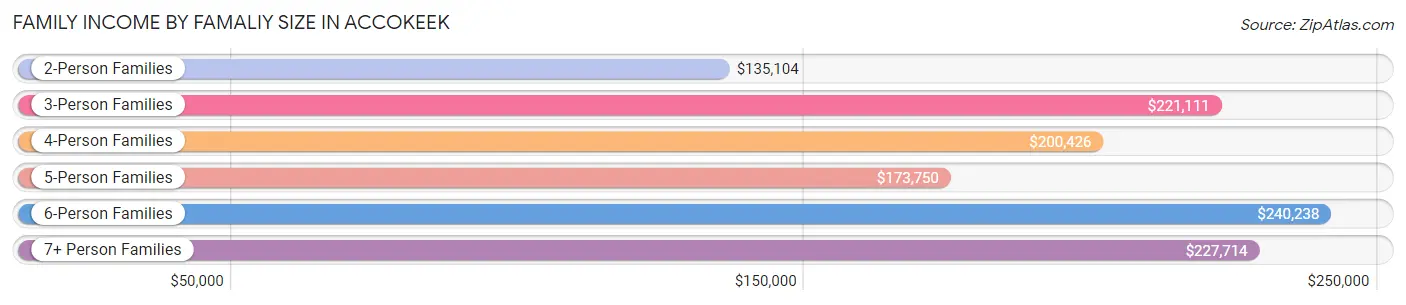
| Income Bracket | # Families | Median Income |
| 2-Person Families | 1,144 (37.5%) | $135,104 |
| 3-Person Families | 732 (24.0%) | $221,111 |
| 4-Person Families | 696 (22.8%) | $200,426 |
| 5-Person Families | 157 (5.1%) | $173,750 |
| 6-Person Families | 86 (2.8%) | $240,238 |
| 7+ Person Families | 233 (7.6%) | $227,714 |
| Total | 3,048 (100.0%) | $176,532 |
Family Income by Number of Earners in Accokeek
The median family income in Accokeek is $176,532, with families comprising 3+ earners (654) having the highest median family income of $229,156, while families with no earners (261) have the lowest median family income of $70,994, accounting for 21.5% and 8.6% of families, respectively.
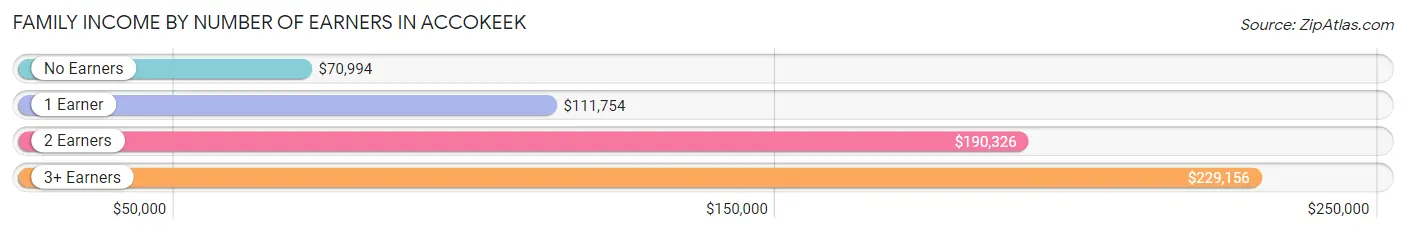
| Number of Earners | # Families | Median Income |
| No Earners | 261 (8.6%) | $70,994 |
| 1 Earner | 770 (25.3%) | $111,754 |
| 2 Earners | 1,363 (44.7%) | $190,326 |
| 3+ Earners | 654 (21.5%) | $229,156 |
| Total | 3,048 (100.0%) | $176,532 |
Household Income in Accokeek
Household Income Brackets in Accokeek
With 1,497 households falling in the category, the $200,000+ income range is the most frequent in Accokeek, accounting for 34.9% of all households. In contrast, only 26 households (0.6%) fall into the $10,000 to $14,999 income bracket, making it the least populous group.
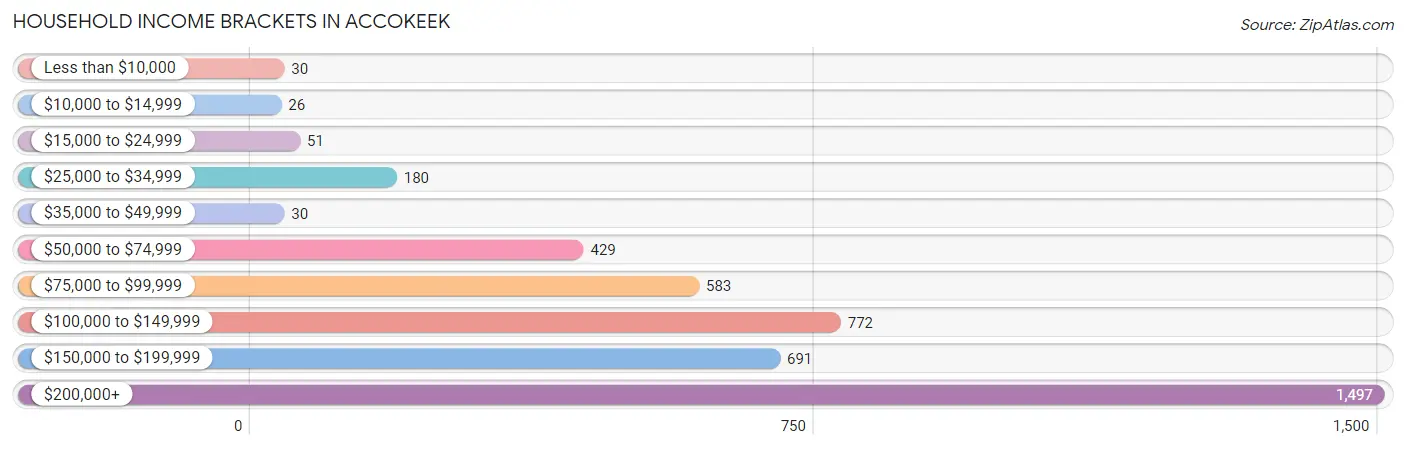
| Income Bracket | # Households | % Households |
| Less than $10,000 | 30 | 0.7% |
| $10,000 to $14,999 | 26 | 0.6% |
| $15,000 to $24,999 | 51 | 1.2% |
| $25,000 to $34,999 | 180 | 4.2% |
| $35,000 to $49,999 | 30 | 0.7% |
| $50,000 to $74,999 | 429 | 10.0% |
| $75,000 to $99,999 | 583 | 13.6% |
| $100,000 to $149,999 | 772 | 18.0% |
| $150,000 to $199,999 | 691 | 16.1% |
| $200,000+ | 1,497 | 34.9% |
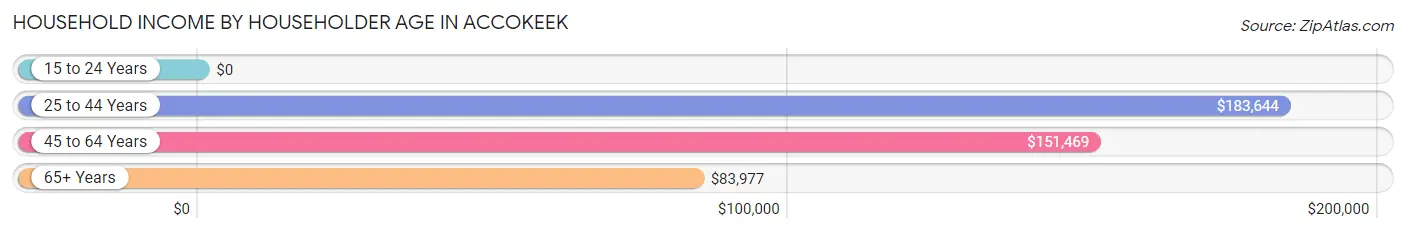
Household Income by Householder Age in Accokeek
The median household income in Accokeek is $150,917, with the highest median household income of $183,644 found in the 25 to 44 years age bracket for the primary householder. A total of 1,019 households (23.7%) fall into this category. Meanwhile, the 15 to 24 years age bracket for the primary householder has the lowest median household income of $0, with 3 households (0.1%) in this group.
| Income Bracket | # Households | Median Income |
| 15 to 24 Years | 3 (0.1%) | $0 |
| 25 to 44 Years | 1,019 (23.7%) | $183,644 |
| 45 to 64 Years | 2,269 (52.9%) | $151,469 |
| 65+ Years | 999 (23.3%) | $83,977 |
| Total | 4,290 (100.0%) | $150,917 |
Poverty in Accokeek
Income Below Poverty by Sex and Age in Accokeek
With 2.5% poverty level for males and 3.5% for females among the residents of Accokeek, 15 year old males and 18 to 24 year old females are the most vulnerable to poverty, with 31 males (27.2%) and 53 females (21.5%) in their respective age groups living below the poverty level.
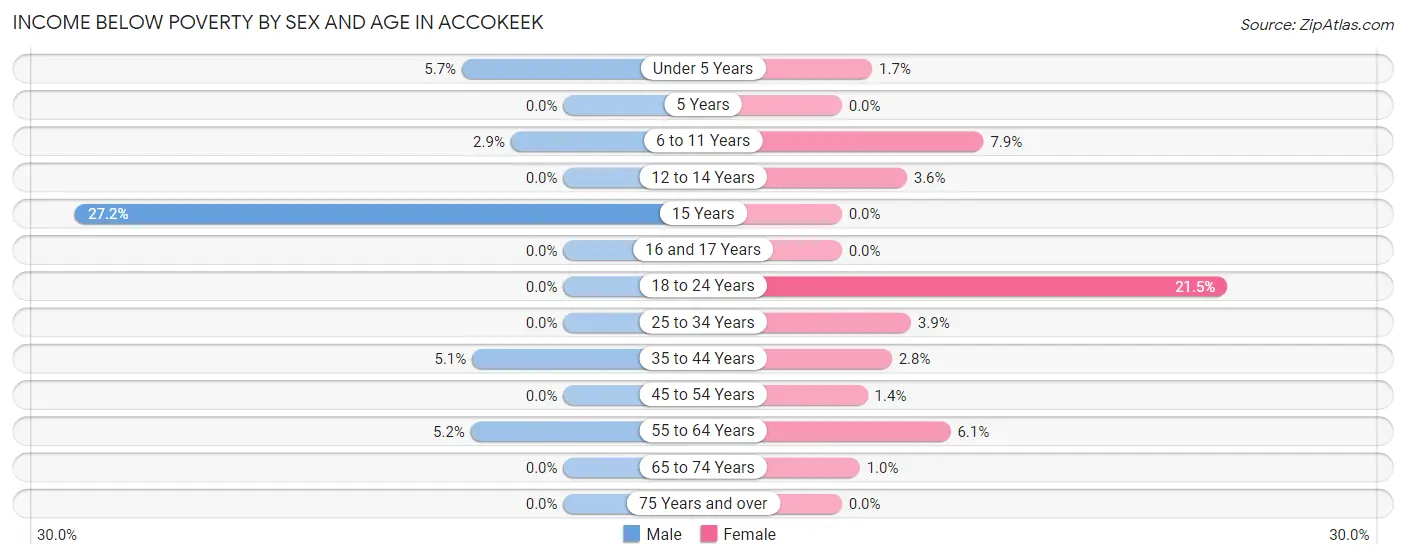
| Age Bracket | Male | Female |
| Under 5 Years | 13 (5.7%) | 11 (1.7%) |
| 5 Years | 0 (0.0%) | 0 (0.0%) |
| 6 to 11 Years | 15 (2.9%) | 25 (7.9%) |
| 12 to 14 Years | 0 (0.0%) | 15 (3.6%) |
| 15 Years | 31 (27.2%) | 0 (0.0%) |
| 16 and 17 Years | 0 (0.0%) | 0 (0.0%) |
| 18 to 24 Years | 0 (0.0%) | 53 (21.5%) |
| 25 to 34 Years | 0 (0.0%) | 22 (3.8%) |
| 35 to 44 Years | 39 (5.1%) | 26 (2.8%) |
| 45 to 54 Years | 0 (0.0%) | 18 (1.4%) |
| 55 to 64 Years | 60 (5.2%) | 52 (6.0%) |
| 65 to 74 Years | 0 (0.0%) | 7 (1.0%) |
| 75 Years and over | 0 (0.0%) | 0 (0.0%) |
| Total | 158 (2.5%) | 229 (3.5%) |
Income Above Poverty by Sex and Age in Accokeek
According to the poverty statistics in Accokeek, males aged 5 years and females aged 5 years are the age groups that are most secure financially, with 100.0% of males and 100.0% of females in these age groups living above the poverty line.
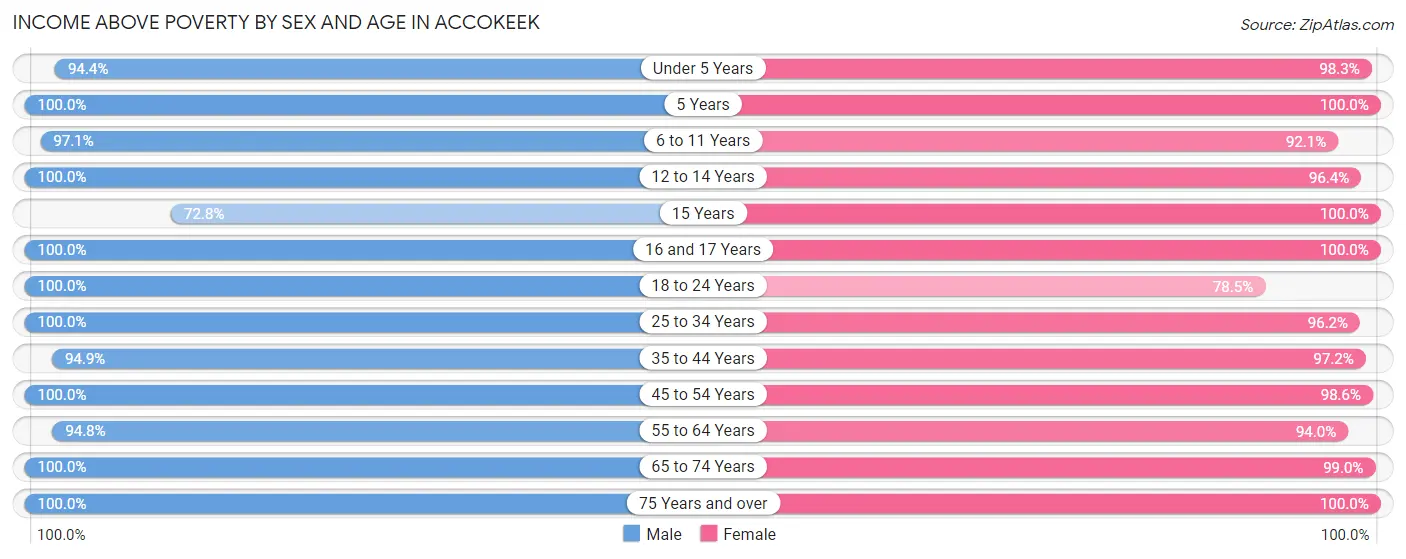
| Age Bracket | Male | Female |
| Under 5 Years | 217 (94.4%) | 640 (98.3%) |
| 5 Years | 78 (100.0%) | 41 (100.0%) |
| 6 to 11 Years | 497 (97.1%) | 292 (92.1%) |
| 12 to 14 Years | 128 (100.0%) | 399 (96.4%) |
| 15 Years | 83 (72.8%) | 60 (100.0%) |
| 16 and 17 Years | 74 (100.0%) | 87 (100.0%) |
| 18 to 24 Years | 707 (100.0%) | 194 (78.5%) |
| 25 to 34 Years | 745 (100.0%) | 550 (96.2%) |
| 35 to 44 Years | 728 (94.9%) | 908 (97.2%) |
| 45 to 54 Years | 940 (100.0%) | 1,234 (98.6%) |
| 55 to 64 Years | 1,102 (94.8%) | 807 (94.0%) |
| 65 to 74 Years | 505 (100.0%) | 696 (99.0%) |
| 75 Years and over | 283 (100.0%) | 311 (100.0%) |
| Total | 6,087 (97.5%) | 6,219 (96.5%) |
Income Below Poverty Among Married-Couple Families in Accokeek
The poverty statistics for married-couple families in Accokeek show that 1.1% or 26 of the total 2,287 families live below the poverty line. Families with 3 or 4 children have the highest poverty rate of 12.2%, comprising of 26 families. On the other hand, families with no children have the lowest poverty rate of 0.0%, which includes 0 families.
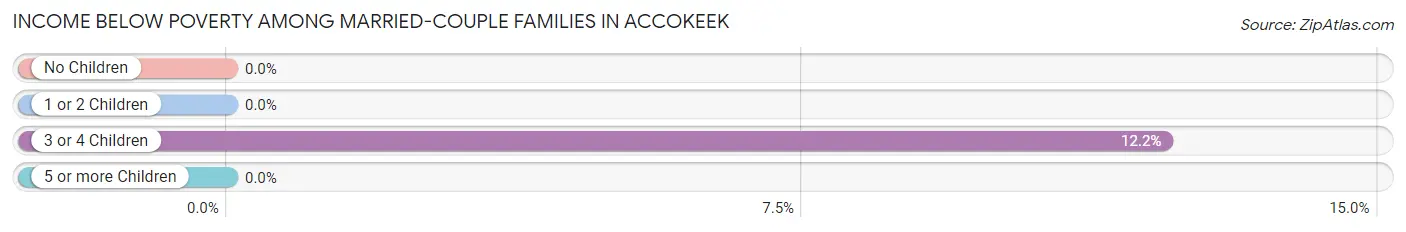
| Children | Above Poverty | Below Poverty |
| No Children | 1,268 (100.0%) | 0 (0.0%) |
| 1 or 2 Children | 806 (100.0%) | 0 (0.0%) |
| 3 or 4 Children | 187 (87.8%) | 26 (12.2%) |
| 5 or more Children | 0 (0.0%) | 0 (0.0%) |
| Total | 2,261 (98.9%) | 26 (1.1%) |
Income Below Poverty Among Single-Parent Households in Accokeek
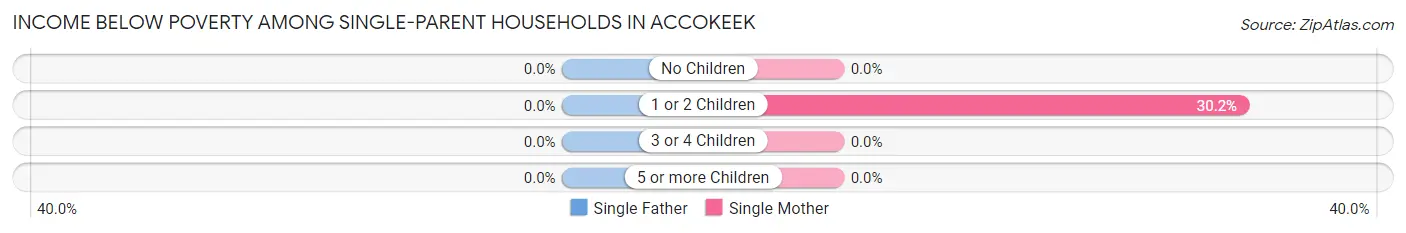
| Children | Single Father | Single Mother |
| No Children | 0 (0.0%) | 0 (0.0%) |
| 1 or 2 Children | 0 (0.0%) | 16 (30.2%) |
| 3 or 4 Children | 0 (0.0%) | 0 (0.0%) |
| 5 or more Children | 0 (0.0%) | 0 (0.0%) |
| Total | 0 (0.0%) | 16 (3.4%) |
Income Below Poverty Among Married-Couple vs Single-Parent Households in Accokeek
The poverty data for Accokeek shows that 26 of the married-couple family households (1.1%) and 16 of the single-parent households (2.1%) are living below the poverty level. Within the married-couple family households, those with 3 or 4 children have the highest poverty rate, with 26 households (12.2%) falling below the poverty line. Among the single-parent households, those with 1 or 2 children have the highest poverty rate, with 16 household (6.2%) living below poverty.
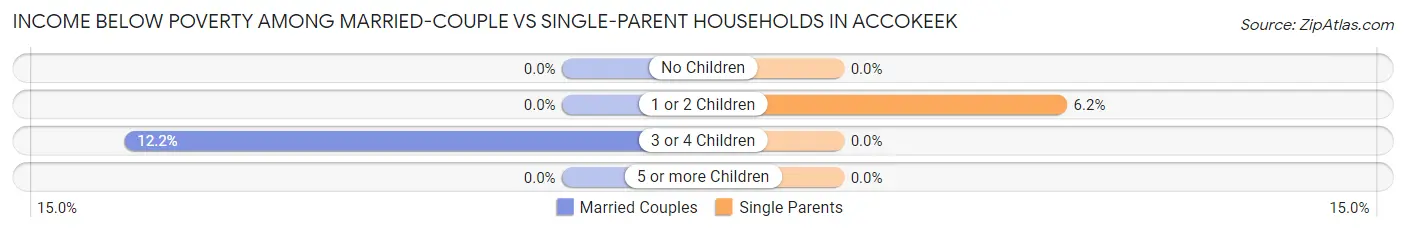
| Children | Married-Couple Families | Single-Parent Households |
| No Children | 0 (0.0%) | 0 (0.0%) |
| 1 or 2 Children | 0 (0.0%) | 16 (6.2%) |
| 3 or 4 Children | 26 (12.2%) | 0 (0.0%) |
| 5 or more Children | 0 (0.0%) | 0 (0.0%) |
| Total | 26 (1.1%) | 16 (2.1%) |
Race in Accokeek
The most populous races in Accokeek are Black / African American (8,324 | 65.3%), White / Caucasian (2,455 | 19.3%), and Two or more Races (1,045 | 8.2%).
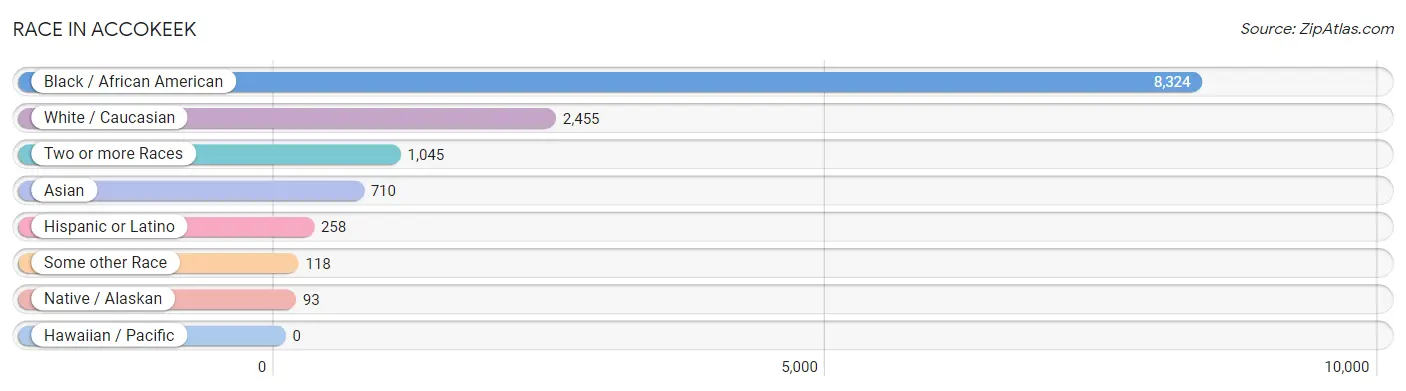
| Race | # Population | % Population |
| Asian | 710 | 5.6% |
| Black / African American | 8,324 | 65.3% |
| Hawaiian / Pacific | 0 | 0.0% |
| Hispanic or Latino | 258 | 2.0% |
| Native / Alaskan | 93 | 0.7% |
| White / Caucasian | 2,455 | 19.3% |
| Two or more Races | 1,045 | 8.2% |
| Some other Race | 118 | 0.9% |
| Total | 12,745 | 100.0% |
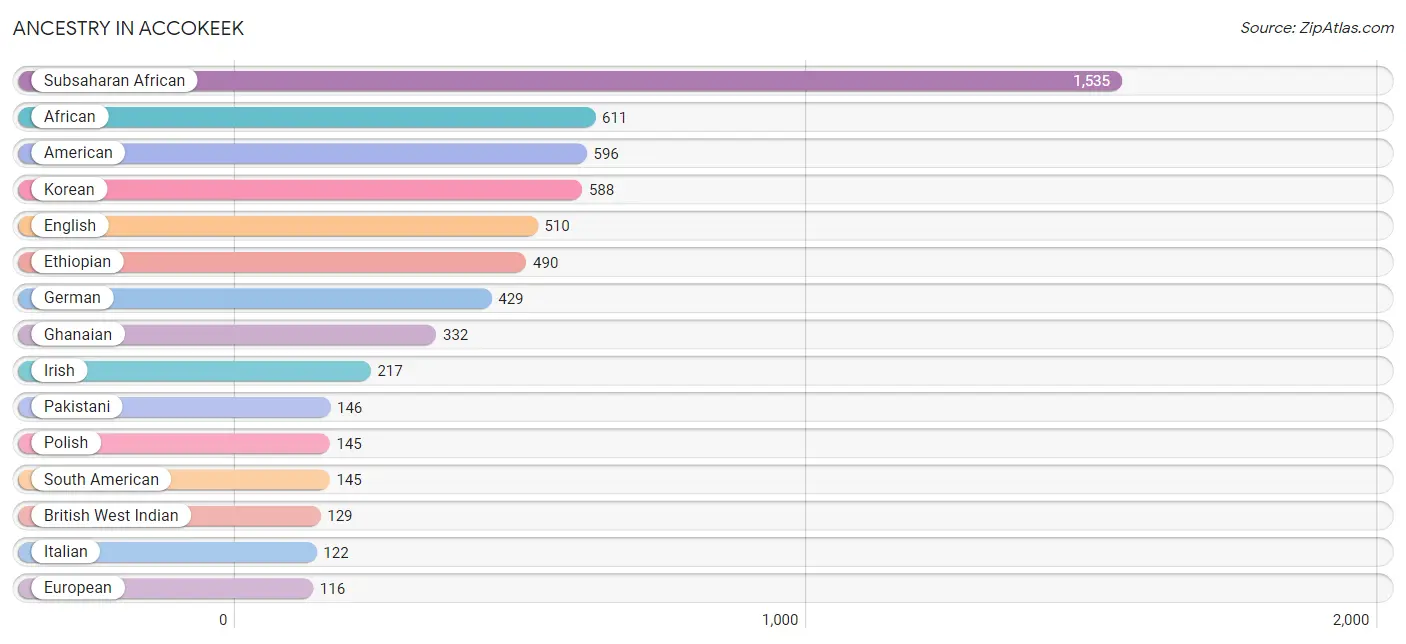
Ancestry in Accokeek
The most populous ancestries reported in Accokeek are Subsaharan African (1,535 | 12.0%), African (611 | 4.8%), American (596 | 4.7%), Korean (588 | 4.6%), and English (510 | 4.0%), together accounting for 30.1% of all Accokeek residents.
| Ancestry | # Population | % Population |
| African | 611 | 4.8% |
| American | 596 | 4.7% |
| Arab | 83 | 0.6% |
| Argentinean | 8 | 0.1% |
| Austrian | 28 | 0.2% |
| Bahamian | 94 | 0.7% |
| Bhutanese | 29 | 0.2% |
| Bolivian | 69 | 0.5% |
| British | 13 | 0.1% |
| British West Indian | 129 | 1.0% |
| Central American | 65 | 0.5% |
| Costa Rican | 47 | 0.4% |
| Danish | 23 | 0.2% |
| Dutch | 79 | 0.6% |
| Eastern European | 24 | 0.2% |
| Ecuadorian | 12 | 0.1% |
| Egyptian | 83 | 0.6% |
| English | 510 | 4.0% |
| Ethiopian | 490 | 3.8% |
| European | 116 | 0.9% |
| French | 45 | 0.4% |
| German | 429 | 3.4% |
| Ghanaian | 332 | 2.6% |
| Guyanese | 28 | 0.2% |
| Hungarian | 1 | 0.0% |
| Indian (Asian) | 43 | 0.3% |
| Iranian | 10 | 0.1% |
| Irish | 217 | 1.7% |
| Italian | 122 | 1.0% |
| Jamaican | 59 | 0.5% |
| Korean | 588 | 4.6% |
| Lithuanian | 18 | 0.1% |
| Lumbee | 18 | 0.1% |
| Mexican | 47 | 0.4% |
| Pakistani | 146 | 1.1% |
| Panamanian | 17 | 0.1% |
| Pennsylvania German | 1 | 0.0% |
| Peruvian | 56 | 0.4% |
| Polish | 145 | 1.1% |
| Russian | 11 | 0.1% |
| Salvadoran | 1 | 0.0% |
| Scotch-Irish | 71 | 0.6% |
| Scottish | 20 | 0.2% |
| Slovak | 15 | 0.1% |
| Slovene | 13 | 0.1% |
| South American | 145 | 1.1% |
| South American Indian | 12 | 0.1% |
| Spaniard | 1 | 0.0% |
| Subsaharan African | 1,535 | 12.0% |
| Swedish | 5 | 0.0% |
| Thai | 41 | 0.3% |
| Trinidadian and Tobagonian | 85 | 0.7% |
| Turkish | 2 | 0.0% |
| Vietnamese | 20 | 0.2% |
| Welsh | 13 | 0.1% |
| West Indian | 30 | 0.2% | View All 56 Rows |
Immigrants in Accokeek
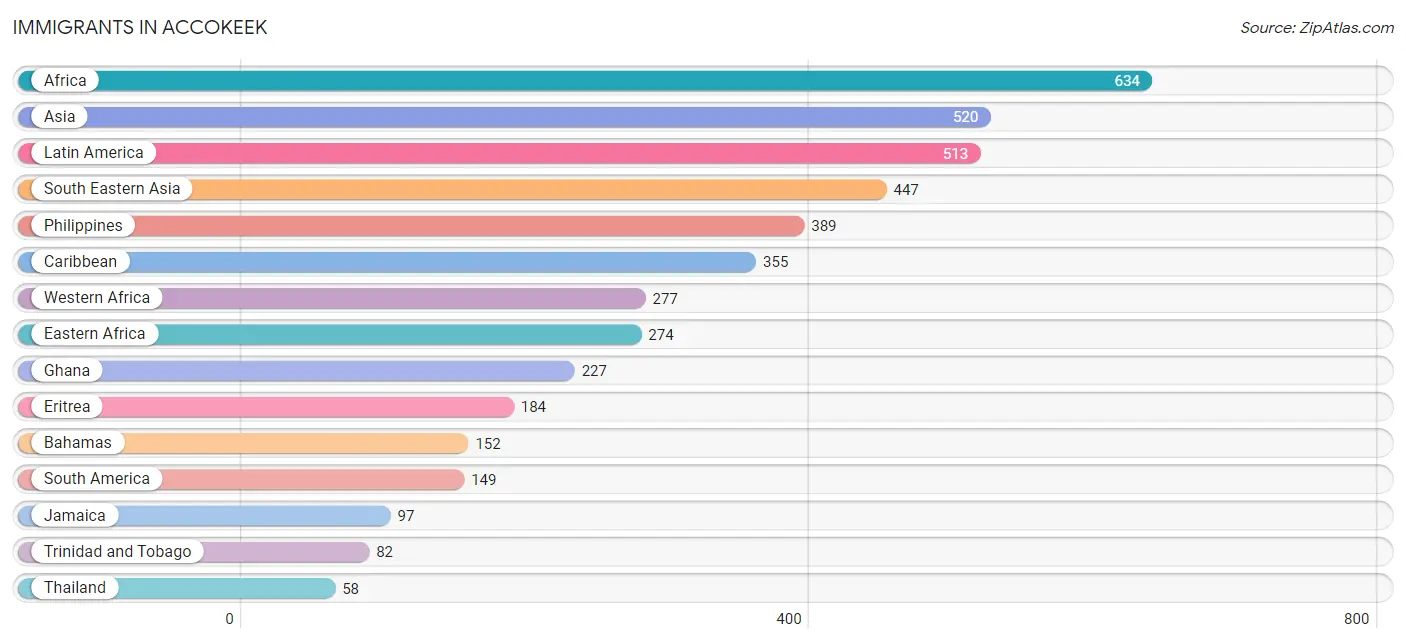
The most numerous immigrant groups reported in Accokeek came from Africa (634 | 5.0%), Asia (520 | 4.1%), Latin America (513 | 4.0%), South Eastern Asia (447 | 3.5%), and Philippines (389 | 3.0%), together accounting for 19.6% of all Accokeek residents.
| Immigration Origin | # Population | % Population |
| Africa | 634 | 5.0% |
| Argentina | 4 | 0.0% |
| Asia | 520 | 4.1% |
| Bahamas | 152 | 1.2% |
| Bangladesh | 20 | 0.2% |
| Bolivia | 51 | 0.4% |
| Cameroon | 31 | 0.2% |
| Caribbean | 355 | 2.8% |
| Central America | 9 | 0.1% |
| China | 32 | 0.3% |
| Eastern Africa | 274 | 2.1% |
| Eastern Asia | 43 | 0.3% |
| Eastern Europe | 18 | 0.1% |
| Ecuador | 2 | 0.0% |
| Egypt | 26 | 0.2% |
| Eritrea | 184 | 1.4% |
| Ethiopia | 38 | 0.3% |
| Europe | 18 | 0.1% |
| Ghana | 227 | 1.8% |
| Guyana | 35 | 0.3% |
| Iran | 10 | 0.1% |
| Jamaica | 97 | 0.8% |
| Japan | 11 | 0.1% |
| Latin America | 513 | 4.0% |
| Liberia | 21 | 0.2% |
| Middle Africa | 31 | 0.2% |
| Nigeria | 29 | 0.2% |
| Northern Africa | 26 | 0.2% |
| Panama | 9 | 0.1% |
| Peru | 56 | 0.4% |
| Philippines | 389 | 3.0% |
| South America | 149 | 1.2% |
| South Central Asia | 30 | 0.2% |
| South Eastern Asia | 447 | 3.5% |
| Thailand | 58 | 0.5% |
| Trinidad and Tobago | 82 | 0.6% |
| Ukraine | 18 | 0.1% |
| Venezuela | 1 | 0.0% |
| Western Africa | 277 | 2.2% | View All 39 Rows |
Sex and Age in Accokeek
Sex and Age in Accokeek
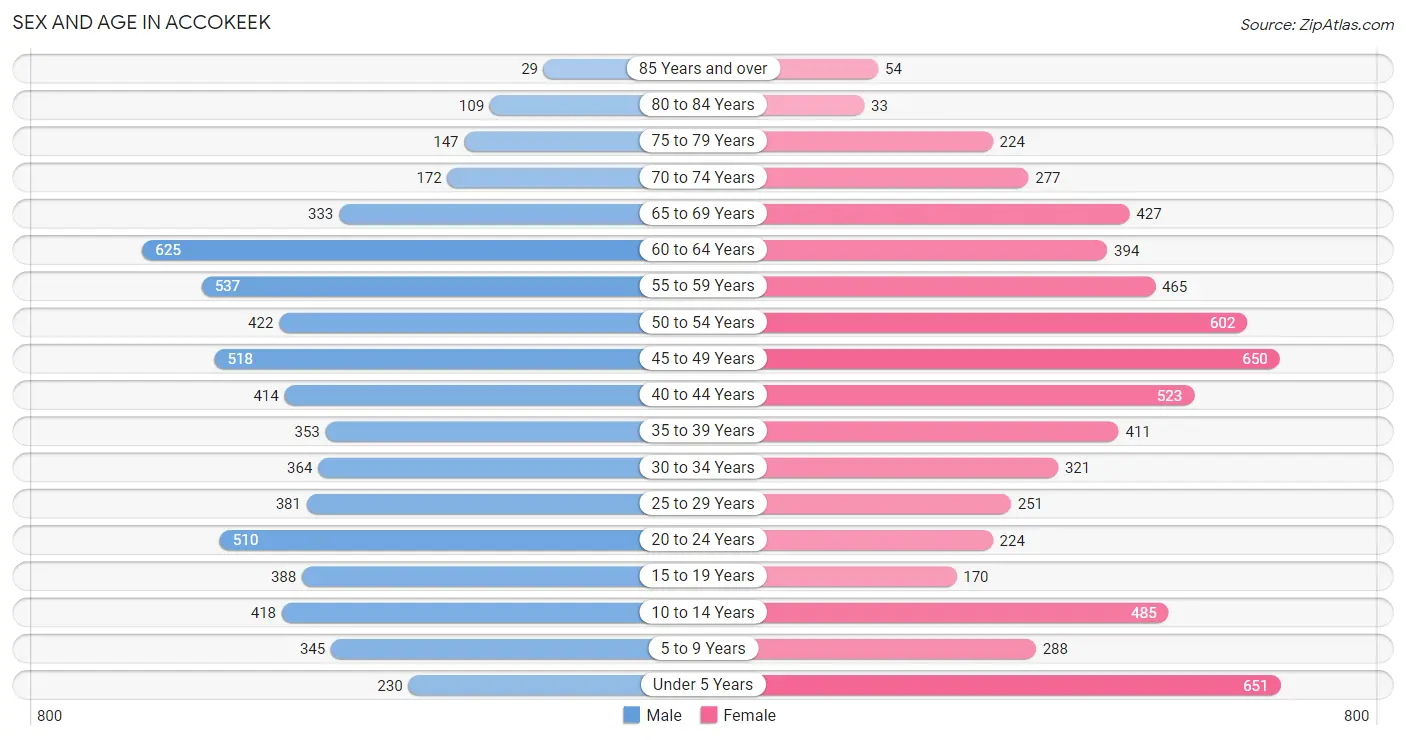
The most populous age groups in Accokeek are 60 to 64 Years (625 | 9.9%) for men and Under 5 Years (651 | 10.1%) for women.
| Age Bracket | Male | Female |
| Under 5 Years | 230 (3.6%) | 651 (10.1%) |
| 5 to 9 Years | 345 (5.5%) | 288 (4.5%) |
| 10 to 14 Years | 418 (6.6%) | 485 (7.5%) |
| 15 to 19 Years | 388 (6.2%) | 170 (2.6%) |
| 20 to 24 Years | 510 (8.1%) | 224 (3.5%) |
| 25 to 29 Years | 381 (6.0%) | 251 (3.9%) |
| 30 to 34 Years | 364 (5.8%) | 321 (5.0%) |
| 35 to 39 Years | 353 (5.6%) | 411 (6.4%) |
| 40 to 44 Years | 414 (6.6%) | 523 (8.1%) |
| 45 to 49 Years | 518 (8.2%) | 650 (10.1%) |
| 50 to 54 Years | 422 (6.7%) | 602 (9.3%) |
| 55 to 59 Years | 537 (8.5%) | 465 (7.2%) |
| 60 to 64 Years | 625 (9.9%) | 394 (6.1%) |
| 65 to 69 Years | 333 (5.3%) | 427 (6.6%) |
| 70 to 74 Years | 172 (2.7%) | 277 (4.3%) |
| 75 to 79 Years | 147 (2.3%) | 224 (3.5%) |
| 80 to 84 Years | 109 (1.7%) | 33 (0.5%) |
| 85 Years and over | 29 (0.5%) | 54 (0.8%) |
| Total | 6,295 (100.0%) | 6,450 (100.0%) |
Families and Households in Accokeek
Median Family Size in Accokeek
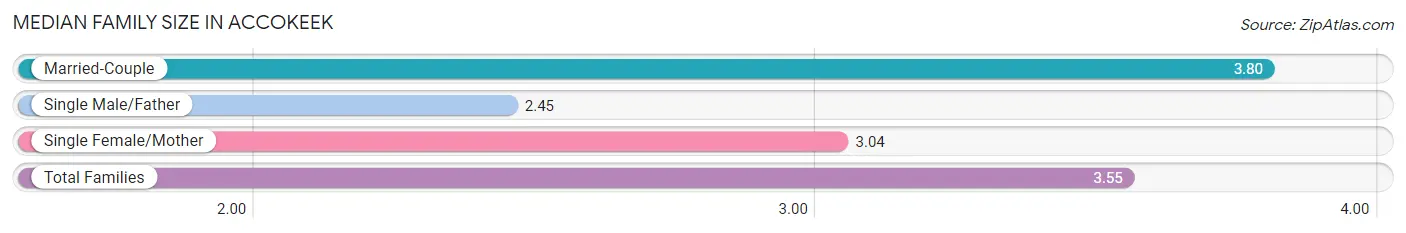
The median family size in Accokeek is 3.55 persons per family, with married-couple families (2,287 | 75.0%) accounting for the largest median family size of 3.8 persons per family. On the other hand, single male/father families (294 | 9.7%) represent the smallest median family size with 2.45 persons per family.
| Family Type | # Families | Family Size |
| Married-Couple | 2,287 (75.0%) | 3.80 |
| Single Male/Father | 294 (9.7%) | 2.45 |
| Single Female/Mother | 467 (15.3%) | 3.04 |
| Total Families | 3,048 (100.0%) | 3.55 |
Median Household Size in Accokeek
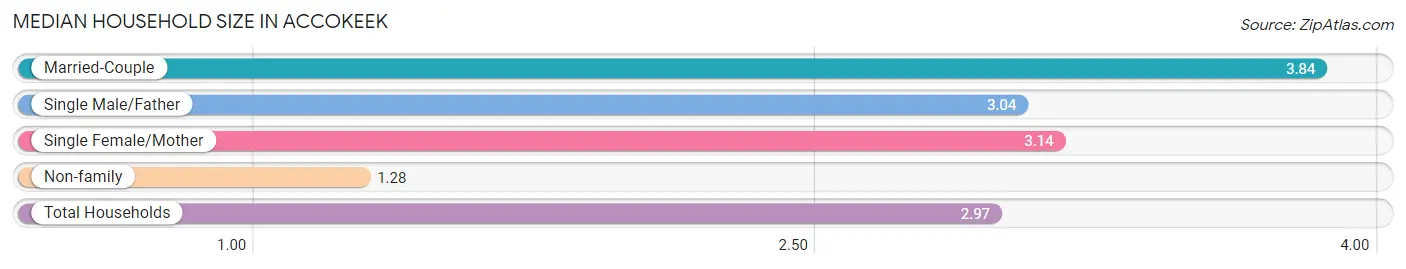
The median household size in Accokeek is 2.97 persons per household, with married-couple households (2,287 | 53.3%) accounting for the largest median household size of 3.84 persons per household. non-family households (1,242 | 28.9%) represent the smallest median household size with 1.28 persons per household.
| Household Type | # Households | Household Size |
| Married-Couple | 2,287 (53.3%) | 3.84 |
| Single Male/Father | 294 (6.9%) | 3.04 |
| Single Female/Mother | 467 (10.9%) | 3.14 |
| Non-family | 1,242 (28.9%) | 1.28 |
| Total Households | 4,290 (100.0%) | 2.97 |
Household Size by Marriage Status in Accokeek
Out of a total of 4,290 households in Accokeek, 3,048 (71.1%) are family households, while 1,242 (28.9%) are nonfamily households. The most numerous type of family households are 2-person households, comprising 1,021, and the most common type of nonfamily households are 1-person households, comprising 915.
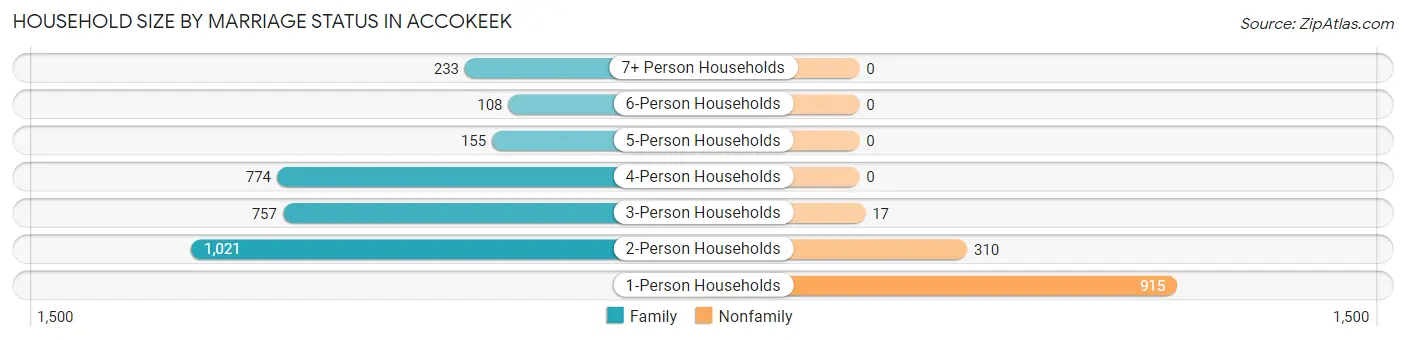
| Household Size | Family Households | Nonfamily Households |
| 1-Person Households | - | 915 (21.3%) |
| 2-Person Households | 1,021 (23.8%) | 310 (7.2%) |
| 3-Person Households | 757 (17.6%) | 17 (0.4%) |
| 4-Person Households | 774 (18.0%) | 0 (0.0%) |
| 5-Person Households | 155 (3.6%) | 0 (0.0%) |
| 6-Person Households | 108 (2.5%) | 0 (0.0%) |
| 7+ Person Households | 233 (5.4%) | 0 (0.0%) |
| Total | 3,048 (71.1%) | 1,242 (28.9%) |
Female Fertility in Accokeek
Fertility by Age in Accokeek
Average fertility rate in Accokeek is 11.0 births per 1,000 women. Women in the age bracket of 35 to 50 years have the highest fertility rate with 14.0 births per 1,000 women. Women in the age bracket of 35 to 50 years acount for 78.1% of all women with births.
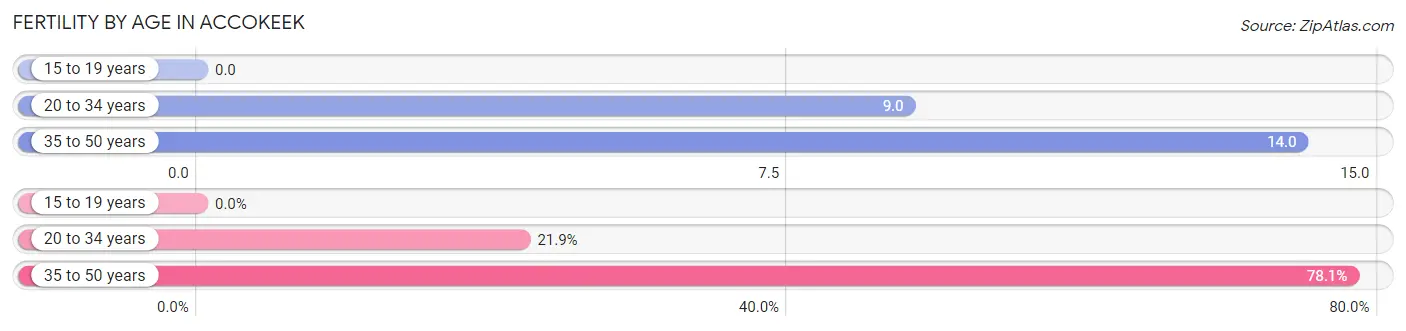
| Age Bracket | Women with Births | Births / 1,000 Women |
| 15 to 19 years | 0 (0.0%) | 0.0 |
| 20 to 34 years | 7 (21.9%) | 9.0 |
| 35 to 50 years | 25 (78.1%) | 14.0 |
| Total | 32 (100.0%) | 11.0 |
Fertility by Age by Marriage Status in Accokeek
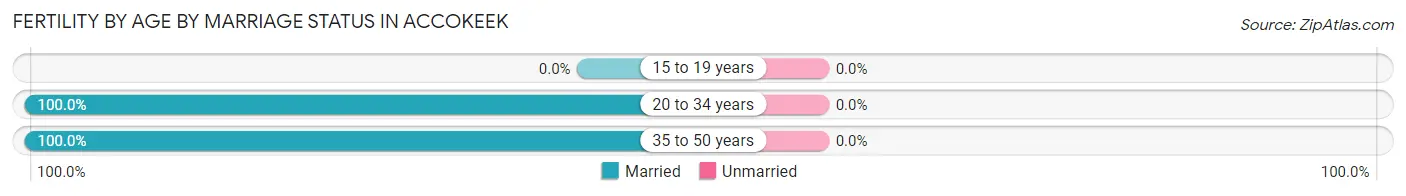
| Age Bracket | Married | Unmarried |
| 15 to 19 years | 0 (0.0%) | 0 (0.0%) |
| 20 to 34 years | 7 (100.0%) | 0 (0.0%) |
| 35 to 50 years | 25 (100.0%) | 0 (0.0%) |
| Total | 32 (100.0%) | 0 (0.0%) |
Fertility by Education in Accokeek
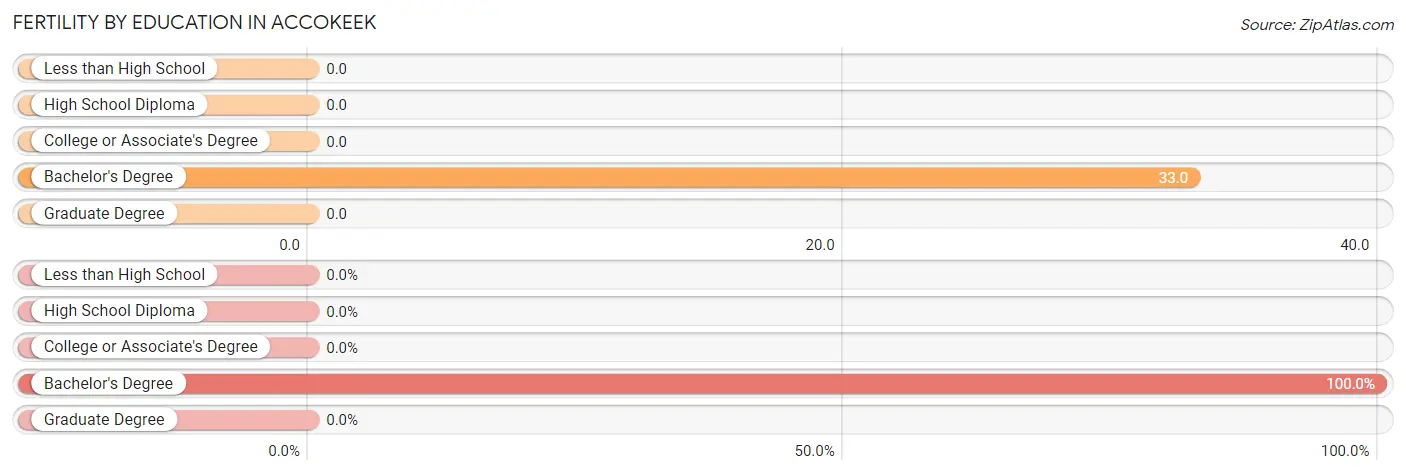
| Educational Attainment | Women with Births | Births / 1,000 Women |
| Less than High School | 0 (0.0%) | 0.0 |
| High School Diploma | 0 (0.0%) | 0.0 |
| College or Associate's Degree | 0 (0.0%) | 0.0 |
| Bachelor's Degree | 32 (100.0%) | 33.0 |
| Graduate Degree | 0 (0.0%) | 0.0 |
| Total | 32 (100.0%) | 11.0 |
Fertility by Education by Marriage Status in Accokeek
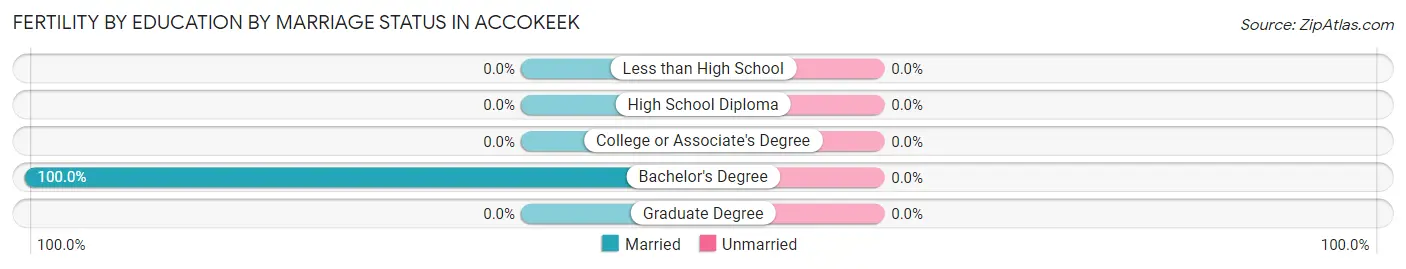
| Educational Attainment | Married | Unmarried |
| Less than High School | 0 (0.0%) | 0 (0.0%) |
| High School Diploma | 0 (0.0%) | 0 (0.0%) |
| College or Associate's Degree | 0 (0.0%) | 0 (0.0%) |
| Bachelor's Degree | 32 (100.0%) | 0 (0.0%) |
| Graduate Degree | 0 (0.0%) | 0 (0.0%) |
| Total | 32 (100.0%) | 0 (0.0%) |
Employment Characteristics in Accokeek
Employment by Class of Employer in Accokeek
Among the 6,714 employed individuals in Accokeek, private company employees (3,333 | 49.6%), federal government employees (1,535 | 22.9%), and not-for-profit organizations (516 | 7.7%) make up the most common classes of employment.
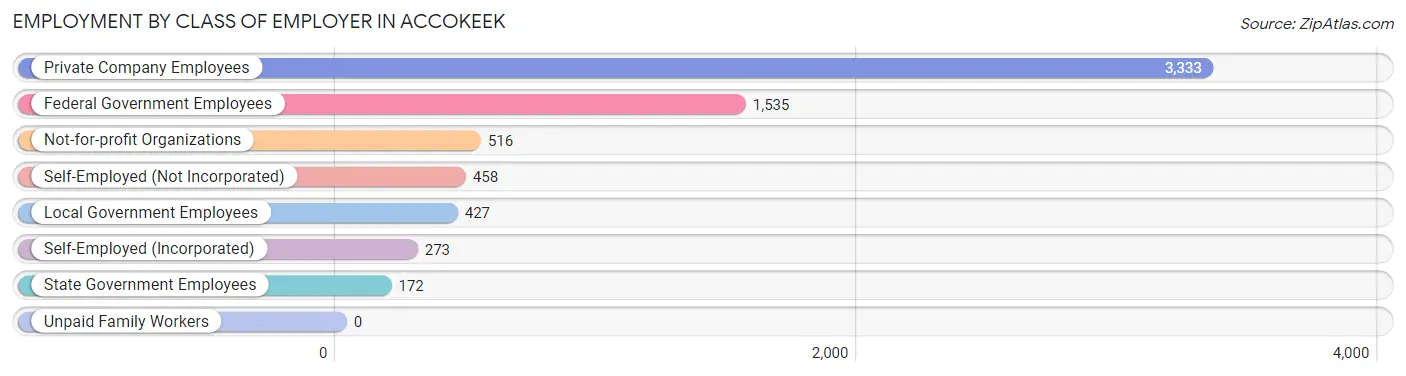
| Employer Class | # Employees | % Employees |
| Private Company Employees | 3,333 | 49.6% |
| Self-Employed (Incorporated) | 273 | 4.1% |
| Self-Employed (Not Incorporated) | 458 | 6.8% |
| Not-for-profit Organizations | 516 | 7.7% |
| Local Government Employees | 427 | 6.4% |
| State Government Employees | 172 | 2.6% |
| Federal Government Employees | 1,535 | 22.9% |
| Unpaid Family Workers | 0 | 0.0% |
| Total | 6,714 | 100.0% |
Employment Status by Age in Accokeek
According to the labor force statistics for Accokeek, out of the total population over 16 years of age (10,154), 74.3% or 7,544 individuals are in the labor force, with 8.9% or 671 of them unemployed. The age group with the highest labor force participation rate is 30 to 34 years, with 91.4% or 626 individuals in the labor force. Within the labor force, the 16 to 19 years age range has the highest percentage of unemployed individuals, with 86.5% or 154 of them being unemployed.
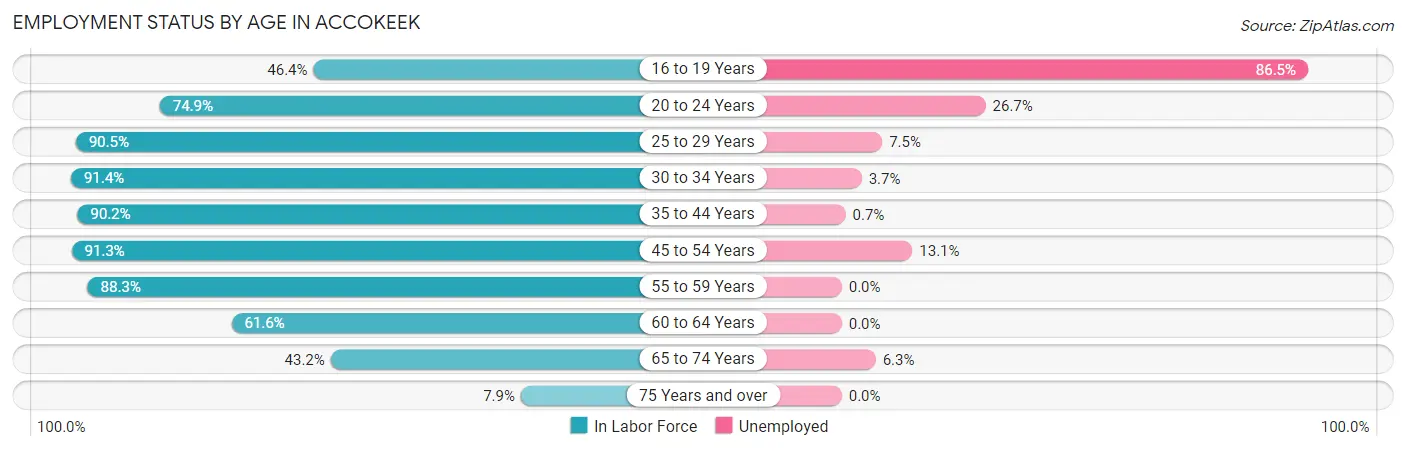
| Age Bracket | In Labor Force | Unemployed |
| 16 to 19 Years | 178 (46.4%) | 154 (86.5%) |
| 20 to 24 Years | 550 (74.9%) | 147 (26.7%) |
| 25 to 29 Years | 572 (90.5%) | 43 (7.5%) |
| 30 to 34 Years | 626 (91.4%) | 23 (3.7%) |
| 35 to 44 Years | 1,534 (90.2%) | 11 (0.7%) |
| 45 to 54 Years | 2,001 (91.3%) | 262 (13.1%) |
| 55 to 59 Years | 885 (88.3%) | 0 (0.0%) |
| 60 to 64 Years | 628 (61.6%) | 0 (0.0%) |
| 65 to 74 Years | 522 (43.2%) | 33 (6.3%) |
| 75 Years and over | 47 (7.9%) | 0 (0.0%) |
| Total | 7,544 (74.3%) | 671 (8.9%) |
Employment Status by Educational Attainment in Accokeek
According to labor force statistics for Accokeek, 86.4% of individuals (6,248) out of the total population between 25 and 64 years of age (7,231) are in the labor force, with 5.4% or 337 of them being unemployed. The group with the highest labor force participation rate are those with the educational attainment of bachelor's degree or higher, with 89.8% or 3,089 individuals in the labor force. Within the labor force, individuals with high school diploma education have the highest percentage of unemployment, with 7.2% or 74 of them being unemployed.
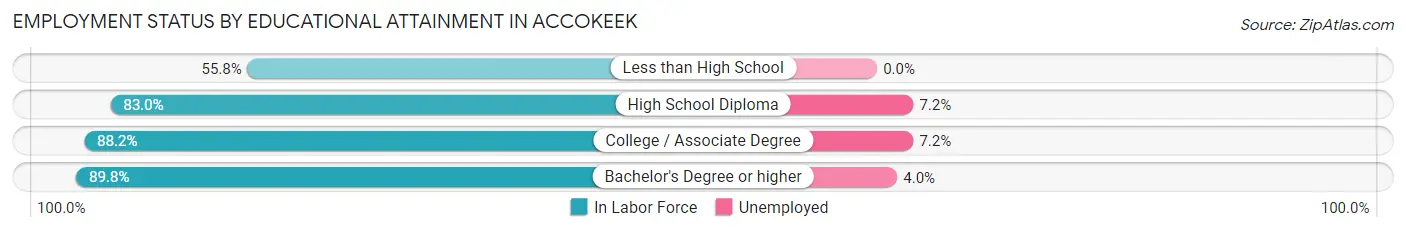
| Educational Attainment | In Labor Force | Unemployed |
| Less than High School | 208 (55.8%) | 0 (0.0%) |
| High School Diploma | 1,023 (83.0%) | 89 (7.2%) |
| College / Associate Degree | 1,928 (88.2%) | 157 (7.2%) |
| Bachelor's Degree or higher | 3,089 (89.8%) | 138 (4.0%) |
| Total | 6,248 (86.4%) | 390 (5.4%) |
Employment Occupations by Sex in Accokeek
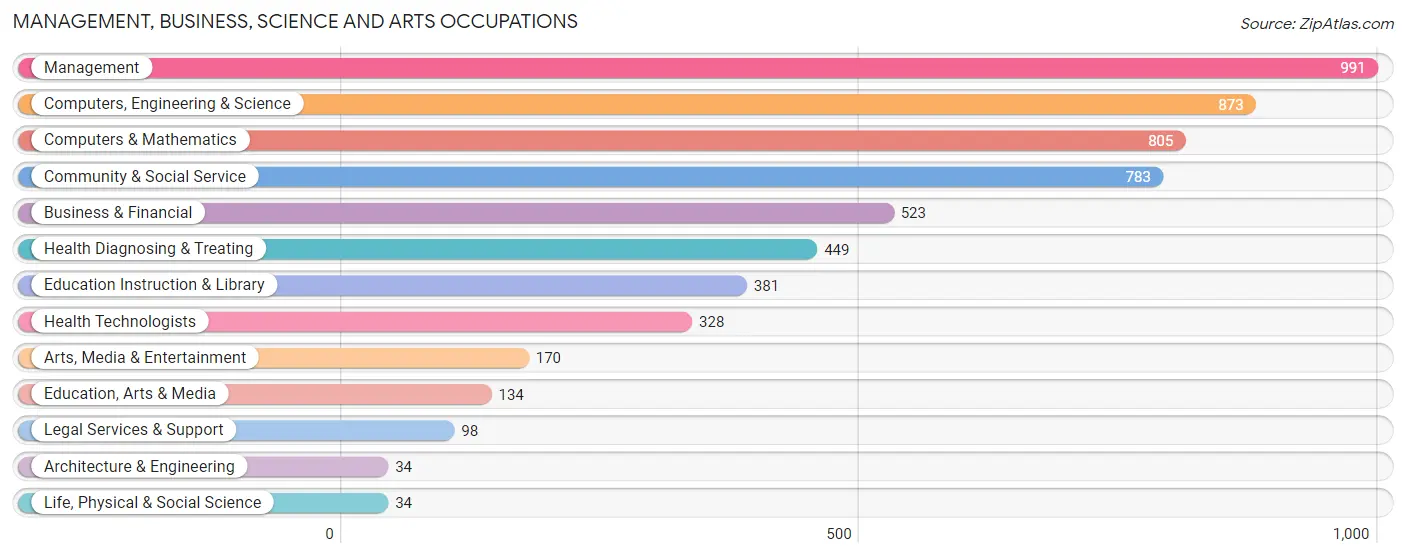
Management, Business, Science and Arts Occupations
The most common Management, Business, Science and Arts occupations in Accokeek are Management (991 | 14.5%), Computers, Engineering & Science (873 | 12.8%), Computers & Mathematics (805 | 11.8%), Community & Social Service (783 | 11.5%), and Business & Financial (523 | 7.7%).
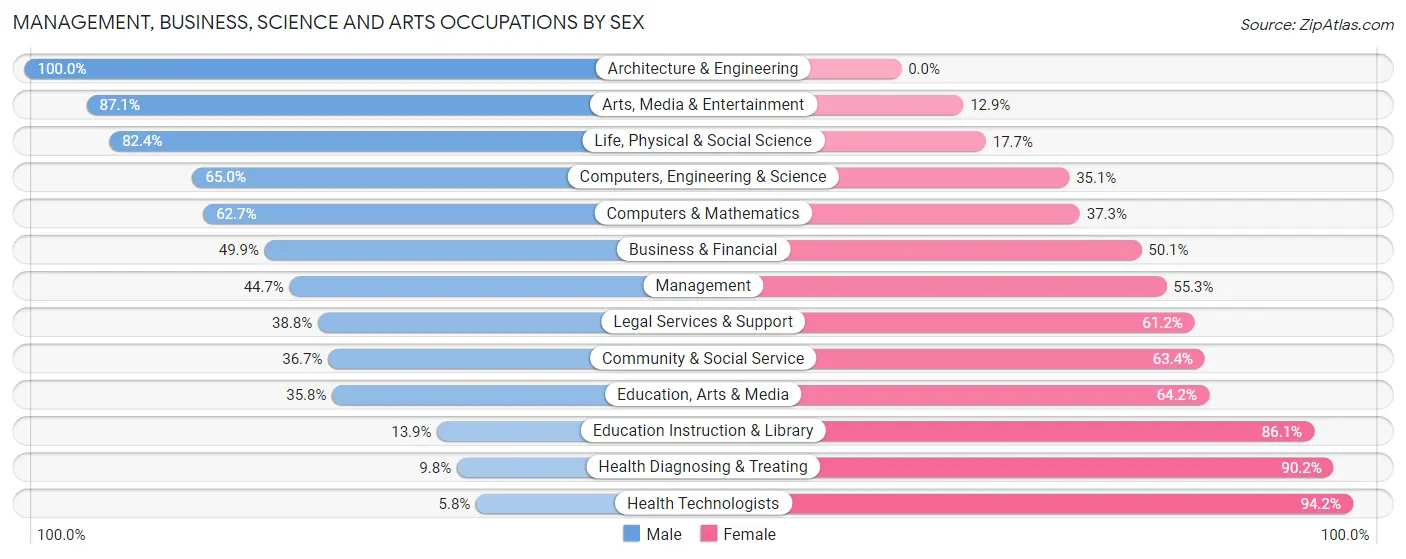
Management, Business, Science and Arts Occupations by Sex
Within the Management, Business, Science and Arts occupations in Accokeek, the most male-oriented occupations are Architecture & Engineering (100.0%), Arts, Media & Entertainment (87.1%), and Life, Physical & Social Science (82.4%), while the most female-oriented occupations are Health Technologists (94.2%), Health Diagnosing & Treating (90.2%), and Education Instruction & Library (86.1%).
| Occupation | Male | Female |
| Management | 443 (44.7%) | 548 (55.3%) |
| Business & Financial | 261 (49.9%) | 262 (50.1%) |
| Computers, Engineering & Science | 567 (64.9%) | 306 (35.0%) |
| Computers & Mathematics | 505 (62.7%) | 300 (37.3%) |
| Architecture & Engineering | 34 (100.0%) | 0 (0.0%) |
| Life, Physical & Social Science | 28 (82.4%) | 6 (17.6%) |
| Community & Social Service | 287 (36.6%) | 496 (63.3%) |
| Education, Arts & Media | 48 (35.8%) | 86 (64.2%) |
| Legal Services & Support | 38 (38.8%) | 60 (61.2%) |
| Education Instruction & Library | 53 (13.9%) | 328 (86.1%) |
| Arts, Media & Entertainment | 148 (87.1%) | 22 (12.9%) |
| Health Diagnosing & Treating | 44 (9.8%) | 405 (90.2%) |
| Health Technologists | 19 (5.8%) | 309 (94.2%) |
| Total (Category) | 1,602 (44.3%) | 2,017 (55.7%) |
| Total (Overall) | 3,264 (47.8%) | 3,558 (52.1%) |
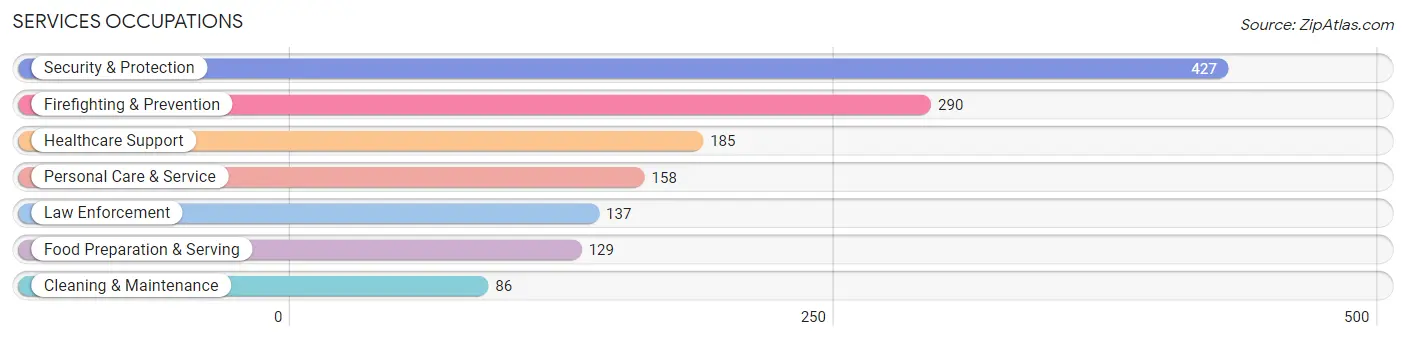
Services Occupations
The most common Services occupations in Accokeek are Security & Protection (427 | 6.3%), Firefighting & Prevention (290 | 4.3%), Healthcare Support (185 | 2.7%), Personal Care & Service (158 | 2.3%), and Law Enforcement (137 | 2.0%).
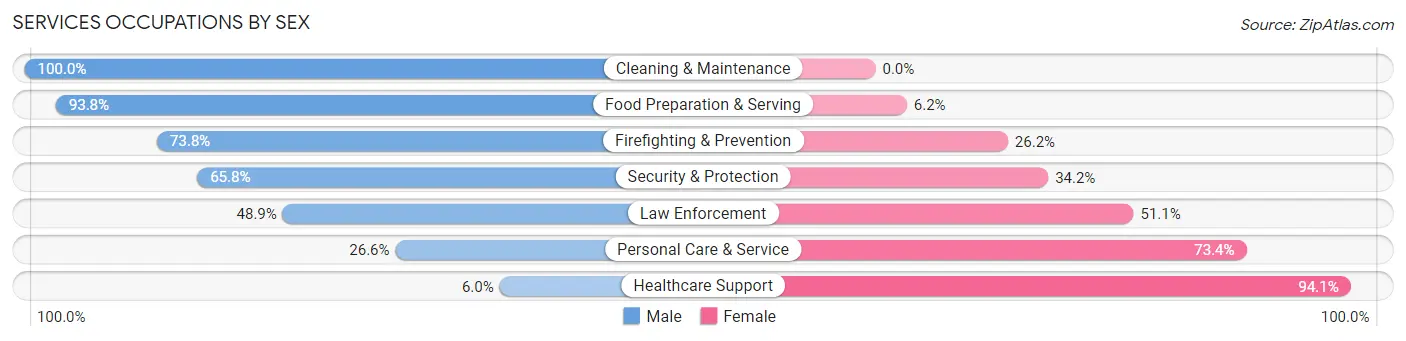
Services Occupations by Sex
Within the Services occupations in Accokeek, the most male-oriented occupations are Cleaning & Maintenance (100.0%), Food Preparation & Serving (93.8%), and Firefighting & Prevention (73.8%), while the most female-oriented occupations are Healthcare Support (94.1%), Personal Care & Service (73.4%), and Law Enforcement (51.1%).
| Occupation | Male | Female |
| Healthcare Support | 11 (5.9%) | 174 (94.1%) |
| Security & Protection | 281 (65.8%) | 146 (34.2%) |
| Firefighting & Prevention | 214 (73.8%) | 76 (26.2%) |
| Law Enforcement | 67 (48.9%) | 70 (51.1%) |
| Food Preparation & Serving | 121 (93.8%) | 8 (6.2%) |
| Cleaning & Maintenance | 86 (100.0%) | 0 (0.0%) |
| Personal Care & Service | 42 (26.6%) | 116 (73.4%) |
| Total (Category) | 541 (54.9%) | 444 (45.1%) |
| Total (Overall) | 3,264 (47.8%) | 3,558 (52.1%) |
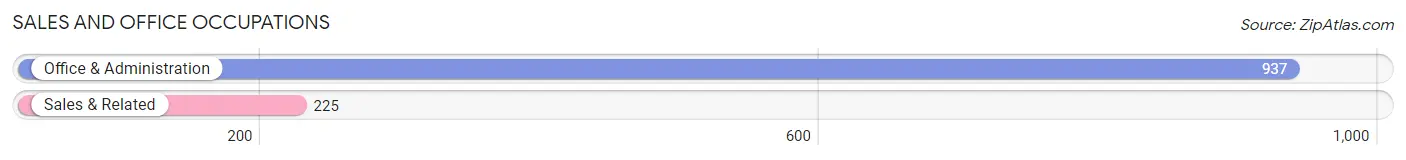
Sales and Office Occupations
The most common Sales and Office occupations in Accokeek are Office & Administration (937 | 13.7%), and Sales & Related (225 | 3.3%).
Sales and Office Occupations by Sex
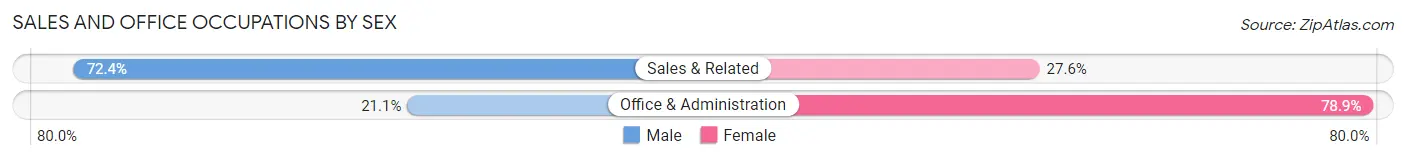
| Occupation | Male | Female |
| Sales & Related | 163 (72.4%) | 62 (27.6%) |
| Office & Administration | 198 (21.1%) | 739 (78.9%) |
| Total (Category) | 361 (31.1%) | 801 (68.9%) |
| Total (Overall) | 3,264 (47.8%) | 3,558 (52.1%) |
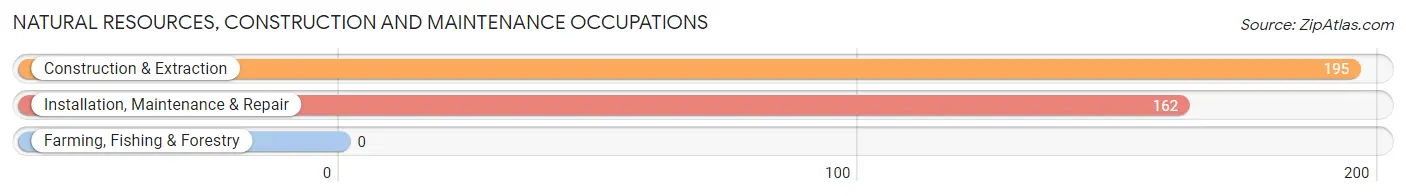
Natural Resources, Construction and Maintenance Occupations
The most common Natural Resources, Construction and Maintenance occupations in Accokeek are Construction & Extraction (195 | 2.9%), and Installation, Maintenance & Repair (162 | 2.4%).
Natural Resources, Construction and Maintenance Occupations by Sex
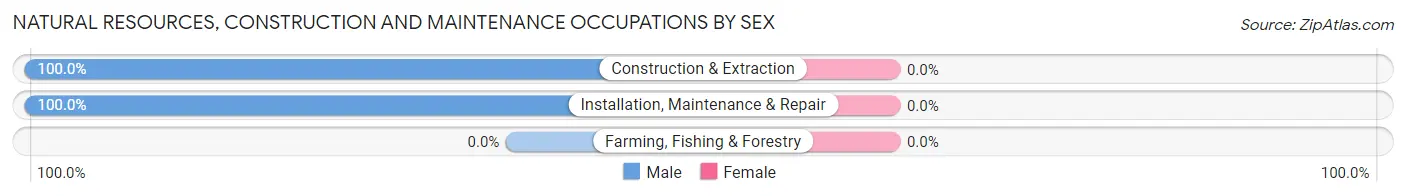
| Occupation | Male | Female |
| Farming, Fishing & Forestry | 0 (0.0%) | 0 (0.0%) |
| Construction & Extraction | 195 (100.0%) | 0 (0.0%) |
| Installation, Maintenance & Repair | 162 (100.0%) | 0 (0.0%) |
| Total (Category) | 357 (100.0%) | 0 (0.0%) |
| Total (Overall) | 3,264 (47.8%) | 3,558 (52.1%) |
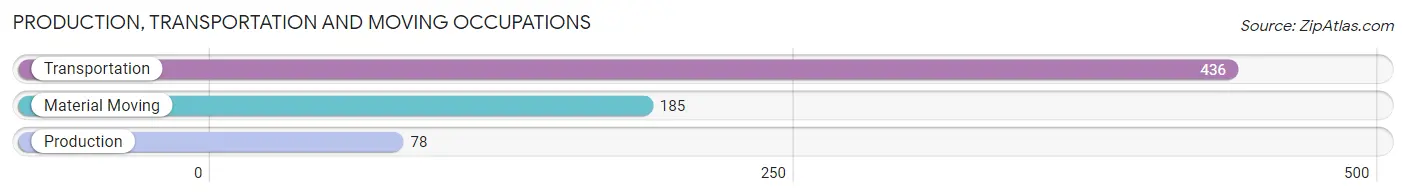
Production, Transportation and Moving Occupations
The most common Production, Transportation and Moving occupations in Accokeek are Transportation (436 | 6.4%), Material Moving (185 | 2.7%), and Production (78 | 1.1%).
Production, Transportation and Moving Occupations by Sex
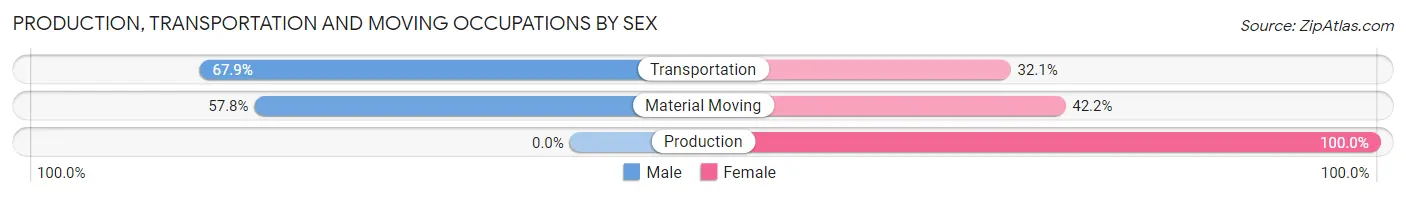
| Occupation | Male | Female |
| Production | 0 (0.0%) | 78 (100.0%) |
| Transportation | 296 (67.9%) | 140 (32.1%) |
| Material Moving | 107 (57.8%) | 78 (42.2%) |
| Total (Category) | 403 (57.7%) | 296 (42.3%) |
| Total (Overall) | 3,264 (47.8%) | 3,558 (52.1%) |
Employment Industries by Sex in Accokeek
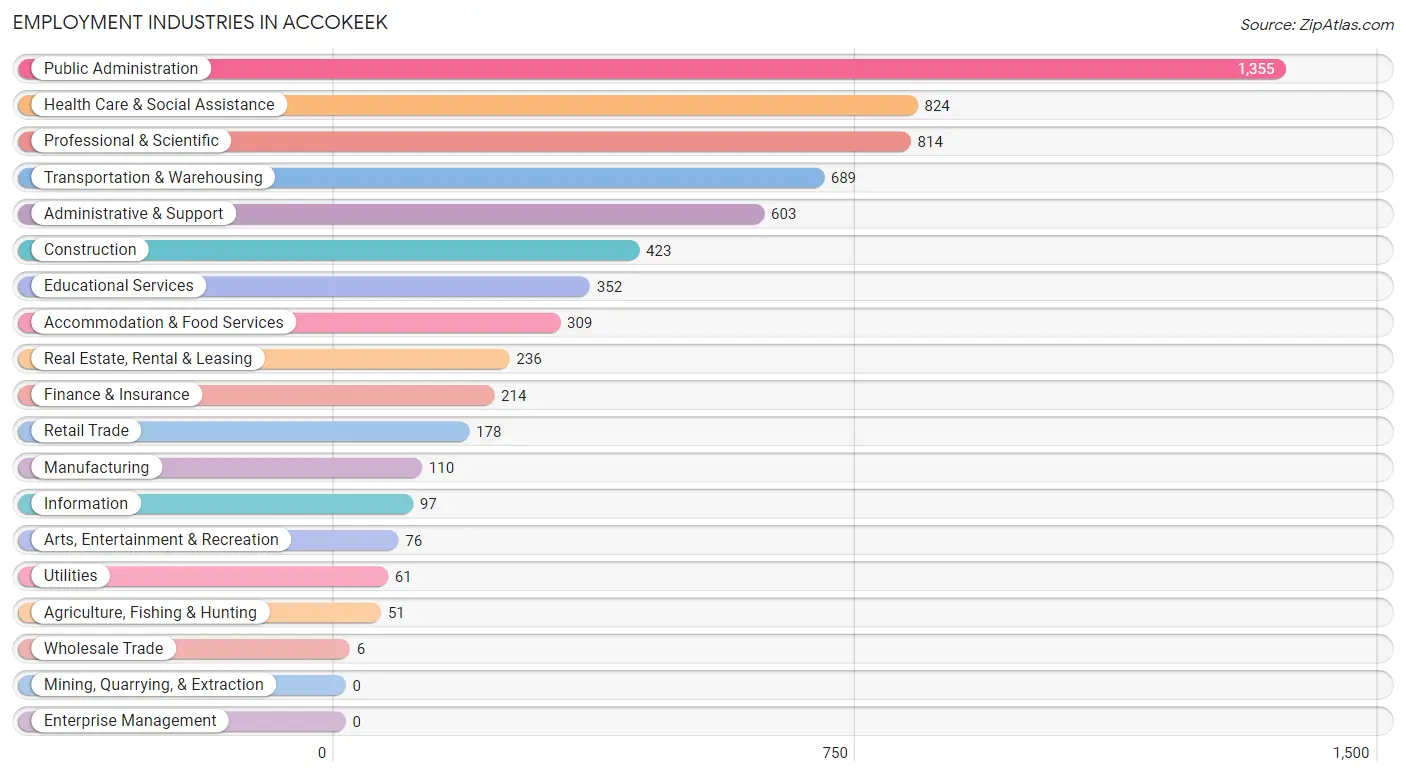
Employment Industries in Accokeek
The major employment industries in Accokeek include Public Administration (1,355 | 19.9%), Health Care & Social Assistance (824 | 12.1%), Professional & Scientific (814 | 11.9%), Transportation & Warehousing (689 | 10.1%), and Administrative & Support (603 | 8.8%).
Employment Industries by Sex in Accokeek
The Accokeek industries that see more men than women are Wholesale Trade (100.0%), Utilities (100.0%), and Agriculture, Fishing & Hunting (86.3%), whereas the industries that tend to have a higher number of women are Health Care & Social Assistance (89.6%), Manufacturing (78.2%), and Educational Services (77.0%).
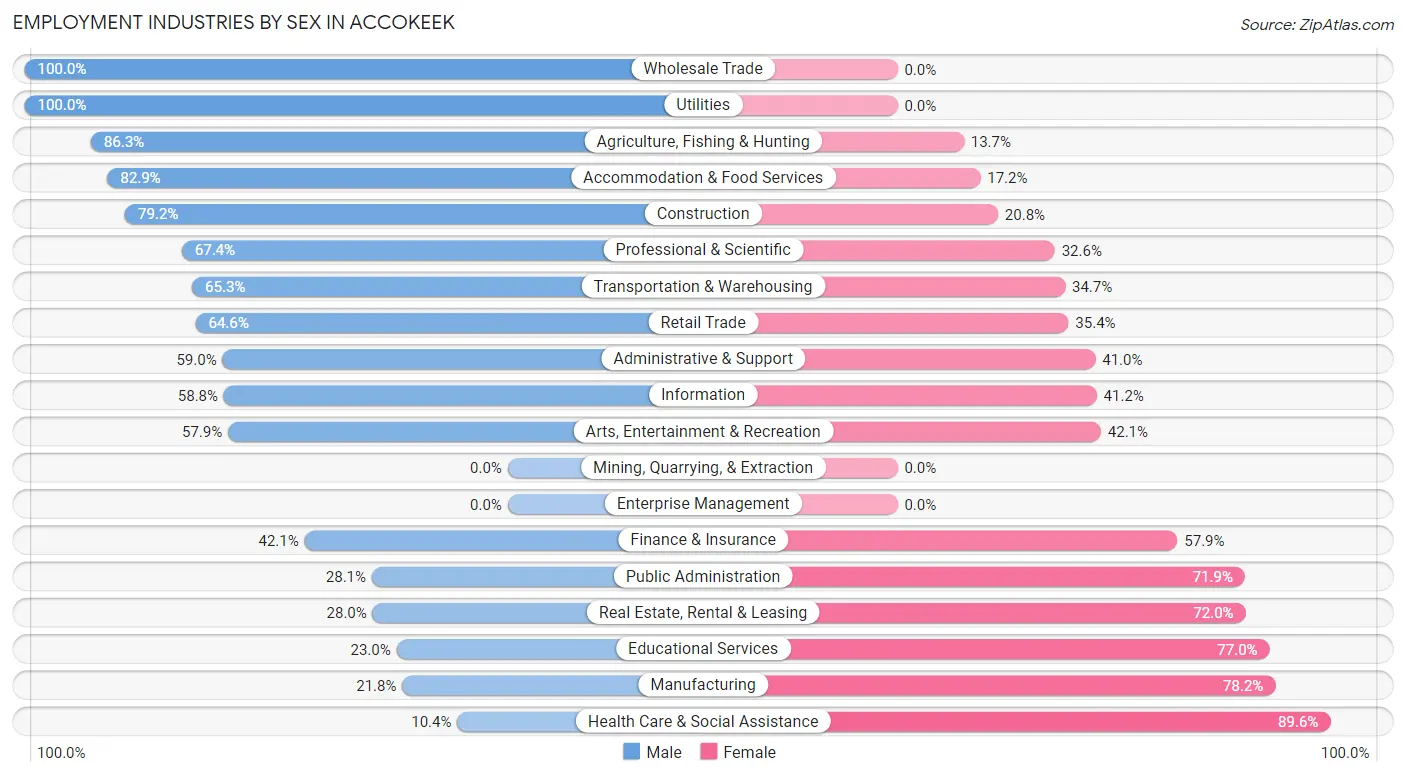
| Industry | Male | Female |
| Agriculture, Fishing & Hunting | 44 (86.3%) | 7 (13.7%) |
| Mining, Quarrying, & Extraction | 0 (0.0%) | 0 (0.0%) |
| Construction | 335 (79.2%) | 88 (20.8%) |
| Manufacturing | 24 (21.8%) | 86 (78.2%) |
| Wholesale Trade | 6 (100.0%) | 0 (0.0%) |
| Retail Trade | 115 (64.6%) | 63 (35.4%) |
| Transportation & Warehousing | 450 (65.3%) | 239 (34.7%) |
| Utilities | 61 (100.0%) | 0 (0.0%) |
| Information | 57 (58.8%) | 40 (41.2%) |
| Finance & Insurance | 90 (42.1%) | 124 (57.9%) |
| Real Estate, Rental & Leasing | 66 (28.0%) | 170 (72.0%) |
| Professional & Scientific | 549 (67.4%) | 265 (32.6%) |
| Enterprise Management | 0 (0.0%) | 0 (0.0%) |
| Administrative & Support | 356 (59.0%) | 247 (41.0%) |
| Educational Services | 81 (23.0%) | 271 (77.0%) |
| Health Care & Social Assistance | 86 (10.4%) | 738 (89.6%) |
| Arts, Entertainment & Recreation | 44 (57.9%) | 32 (42.1%) |
| Accommodation & Food Services | 256 (82.9%) | 53 (17.2%) |
| Public Administration | 381 (28.1%) | 974 (71.9%) |
| Total | 3,264 (47.8%) | 3,558 (52.1%) |
Education in Accokeek
School Enrollment in Accokeek
The most common levels of schooling among the 2,887 students in Accokeek are middle school (675 | 23.4%), college / undergraduate (668 | 23.1%), and elementary school (510 | 17.7%).
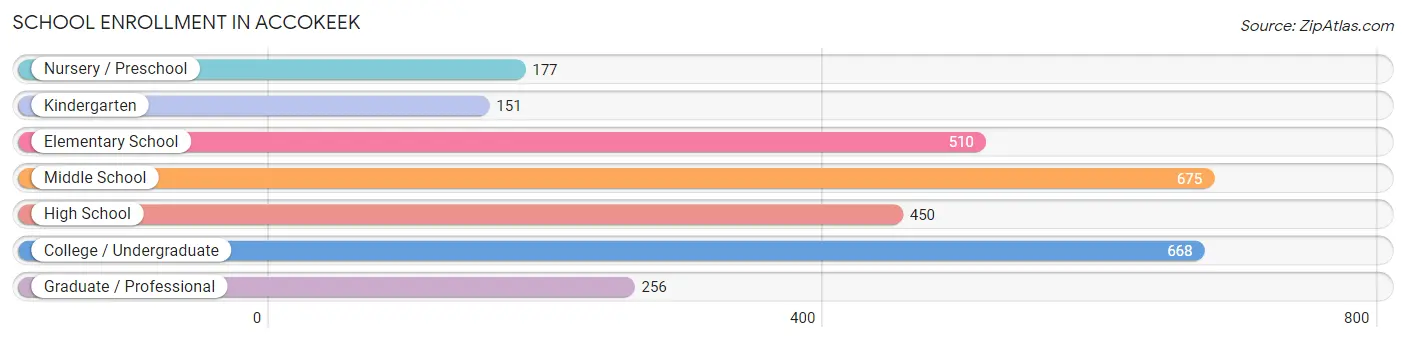
| School Level | # Students | % Students |
| Nursery / Preschool | 177 | 6.1% |
| Kindergarten | 151 | 5.2% |
| Elementary School | 510 | 17.7% |
| Middle School | 675 | 23.4% |
| High School | 450 | 15.6% |
| College / Undergraduate | 668 | 23.1% |
| Graduate / Professional | 256 | 8.9% |
| Total | 2,887 | 100.0% |
School Enrollment by Age by Funding Source in Accokeek
Out of a total of 2,887 students who are enrolled in schools in Accokeek, 921 (31.9%) attend a private institution, while the remaining 1,966 (68.1%) are enrolled in public schools. The age group of 3 to 4 year olds has the highest likelihood of being enrolled in private schools, with 94 (93.1% in the age bracket) enrolled. Conversely, the age group of 10 to 14 year olds has the lowest likelihood of being enrolled in a private school, with 786 (87.2% in the age bracket) attending a public institution.
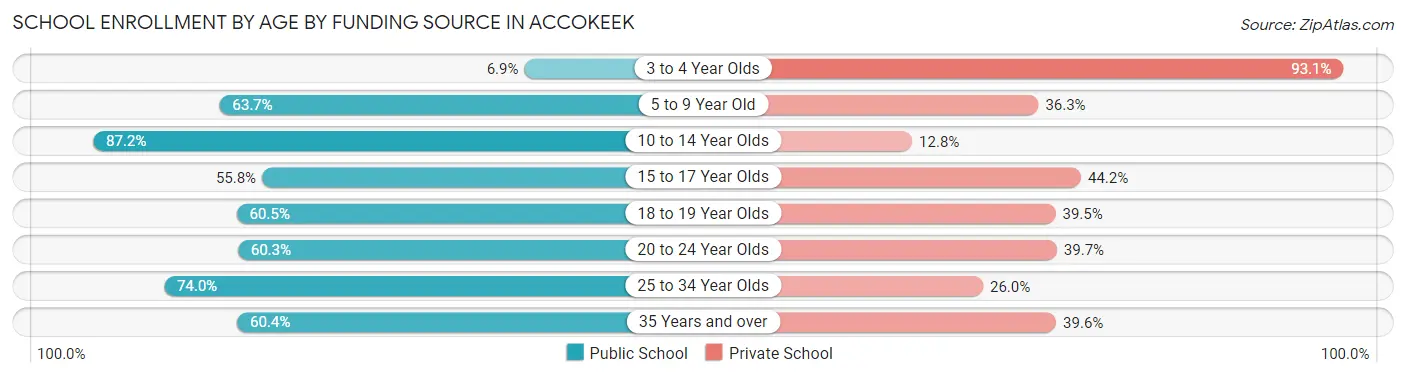
| Age Bracket | Public School | Private School |
| 3 to 4 Year Olds | 7 (6.9%) | 94 (93.1%) |
| 5 to 9 Year Old | 397 (63.7%) | 226 (36.3%) |
| 10 to 14 Year Olds | 786 (87.2%) | 115 (12.8%) |
| 15 to 17 Year Olds | 188 (55.8%) | 149 (44.2%) |
| 18 to 19 Year Olds | 92 (60.5%) | 60 (39.5%) |
| 20 to 24 Year Olds | 170 (60.3%) | 112 (39.7%) |
| 25 to 34 Year Olds | 154 (74.0%) | 54 (26.0%) |
| 35 Years and over | 171 (60.4%) | 112 (39.6%) |
| Total | 1,966 (68.1%) | 921 (31.9%) |
Educational Attainment by Field of Study in Accokeek
Business (1,052 | 23.1%), science & technology (554 | 12.2%), education (542 | 11.9%), computers & mathematics (406 | 8.9%), and arts & humanities (367 | 8.1%) are the most common fields of study among 4,548 individuals in Accokeek who have obtained a bachelor's degree or higher.
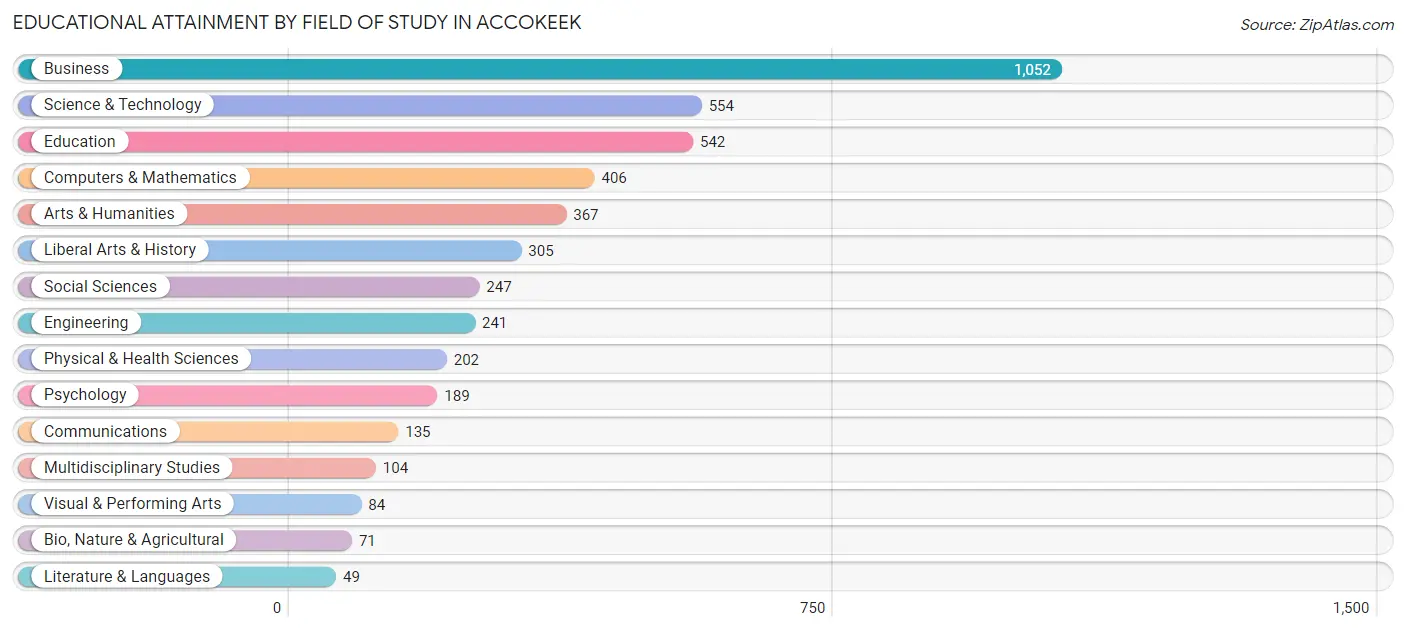
| Field of Study | # Graduates | % Graduates |
| Computers & Mathematics | 406 | 8.9% |
| Bio, Nature & Agricultural | 71 | 1.6% |
| Physical & Health Sciences | 202 | 4.4% |
| Psychology | 189 | 4.2% |
| Social Sciences | 247 | 5.4% |
| Engineering | 241 | 5.3% |
| Multidisciplinary Studies | 104 | 2.3% |
| Science & Technology | 554 | 12.2% |
| Business | 1,052 | 23.1% |
| Education | 542 | 11.9% |
| Literature & Languages | 49 | 1.1% |
| Liberal Arts & History | 305 | 6.7% |
| Visual & Performing Arts | 84 | 1.8% |
| Communications | 135 | 3.0% |
| Arts & Humanities | 367 | 8.1% |
| Total | 4,548 | 100.0% |
Transportation & Commute in Accokeek
Vehicle Availability by Sex in Accokeek
The most prevalent vehicle ownership categories in Accokeek are males with 2 vehicles (1,075, accounting for 32.8%) and females with 2 vehicles (1,108, making up 31.3%).
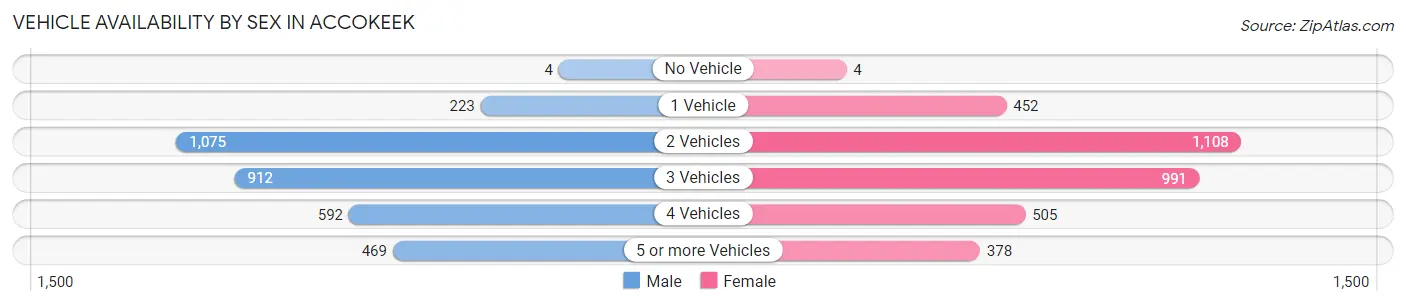
| Vehicles Available | Male | Female |
| No Vehicle | 4 (0.1%) | 4 (0.1%) |
| 1 Vehicle | 223 (6.8%) | 452 (13.2%) |
| 2 Vehicles | 1,075 (32.8%) | 1,108 (32.2%) |
| 3 Vehicles | 912 (27.9%) | 991 (28.8%) |
| 4 Vehicles | 592 (18.1%) | 505 (14.7%) |
| 5 or more Vehicles | 469 (14.3%) | 378 (11.0%) |
| Total | 3,275 (100.0%) | 3,438 (100.0%) |
Commute Time in Accokeek
The most frequently occuring commute durations in Accokeek are 45 to 59 minutes (1,541 commuters, 29.5%), 60 to 89 minutes (1,286 commuters, 24.7%), and 30 to 34 minutes (601 commuters, 11.5%).
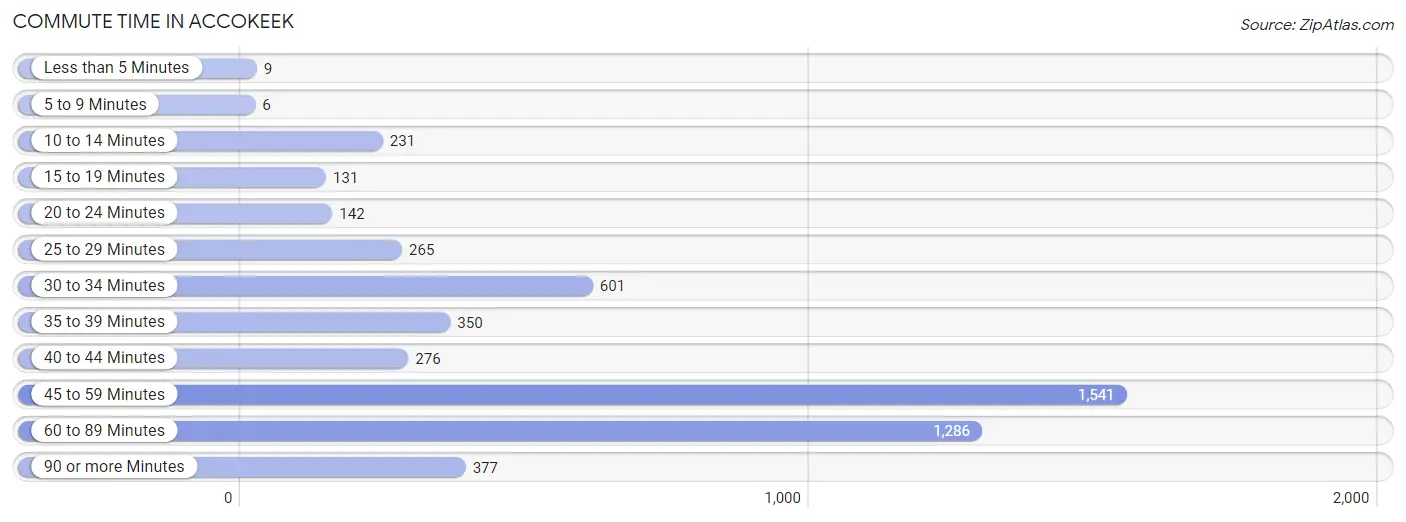
| Commute Time | # Commuters | % Commuters |
| Less than 5 Minutes | 9 | 0.2% |
| 5 to 9 Minutes | 6 | 0.1% |
| 10 to 14 Minutes | 231 | 4.4% |
| 15 to 19 Minutes | 131 | 2.5% |
| 20 to 24 Minutes | 142 | 2.7% |
| 25 to 29 Minutes | 265 | 5.1% |
| 30 to 34 Minutes | 601 | 11.5% |
| 35 to 39 Minutes | 350 | 6.7% |
| 40 to 44 Minutes | 276 | 5.3% |
| 45 to 59 Minutes | 1,541 | 29.5% |
| 60 to 89 Minutes | 1,286 | 24.7% |
| 90 or more Minutes | 377 | 7.2% |
Commute Time by Sex in Accokeek
The most common commute times in Accokeek are 45 to 59 minutes (914 commuters, 33.6%) for males and 60 to 89 minutes (694 commuters, 27.8%) for females.
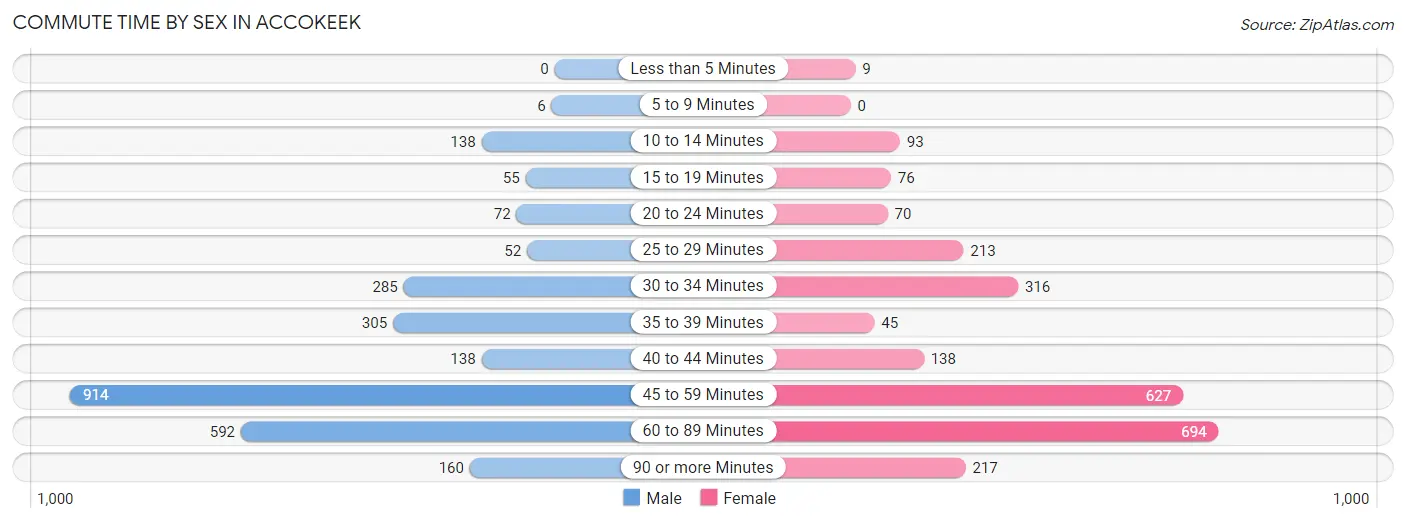
| Commute Time | Male | Female |
| Less than 5 Minutes | 0 (0.0%) | 9 (0.4%) |
| 5 to 9 Minutes | 6 (0.2%) | 0 (0.0%) |
| 10 to 14 Minutes | 138 (5.1%) | 93 (3.7%) |
| 15 to 19 Minutes | 55 (2.0%) | 76 (3.0%) |
| 20 to 24 Minutes | 72 (2.6%) | 70 (2.8%) |
| 25 to 29 Minutes | 52 (1.9%) | 213 (8.5%) |
| 30 to 34 Minutes | 285 (10.5%) | 316 (12.7%) |
| 35 to 39 Minutes | 305 (11.2%) | 45 (1.8%) |
| 40 to 44 Minutes | 138 (5.1%) | 138 (5.5%) |
| 45 to 59 Minutes | 914 (33.6%) | 627 (25.1%) |
| 60 to 89 Minutes | 592 (21.8%) | 694 (27.8%) |
| 90 or more Minutes | 160 (5.9%) | 217 (8.7%) |
Time of Departure to Work by Sex in Accokeek
The most frequent times of departure to work in Accokeek are 8:00 AM to 8:29 AM (358, 13.2%) for males and 6:00 AM to 6:29 AM (392, 15.7%) for females.
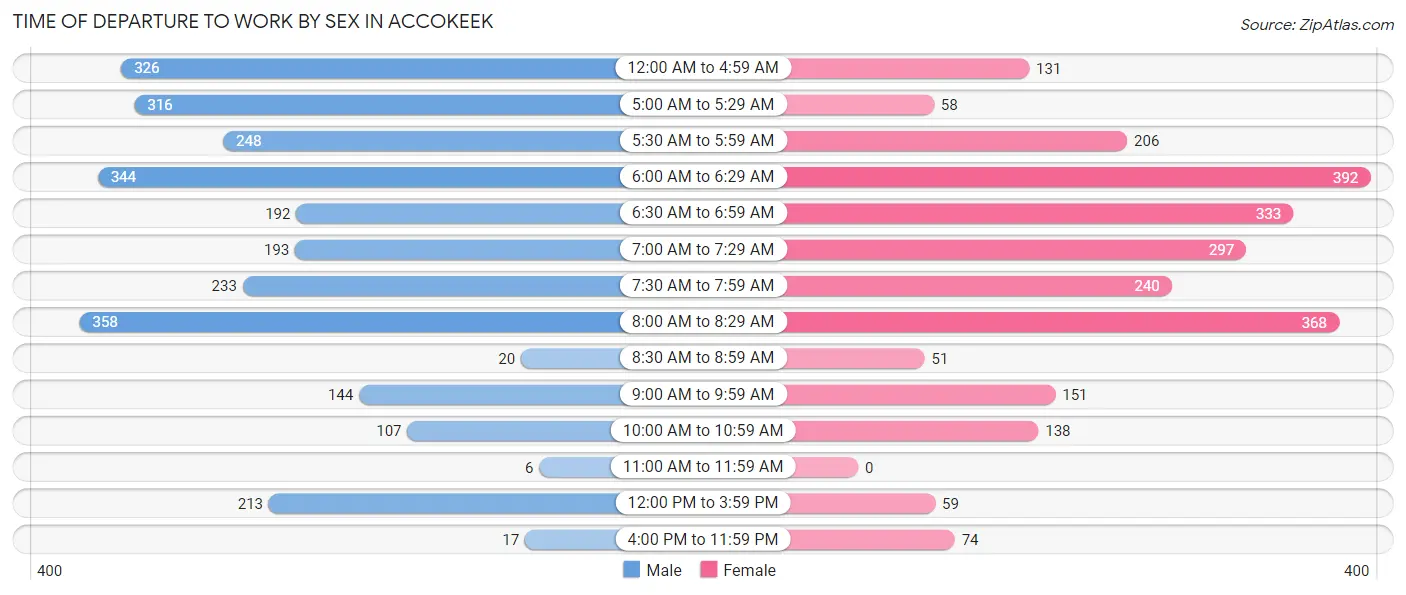
| Time of Departure | Male | Female |
| 12:00 AM to 4:59 AM | 326 (12.0%) | 131 (5.2%) |
| 5:00 AM to 5:29 AM | 316 (11.6%) | 58 (2.3%) |
| 5:30 AM to 5:59 AM | 248 (9.1%) | 206 (8.3%) |
| 6:00 AM to 6:29 AM | 344 (12.7%) | 392 (15.7%) |
| 6:30 AM to 6:59 AM | 192 (7.1%) | 333 (13.3%) |
| 7:00 AM to 7:29 AM | 193 (7.1%) | 297 (11.9%) |
| 7:30 AM to 7:59 AM | 233 (8.6%) | 240 (9.6%) |
| 8:00 AM to 8:29 AM | 358 (13.2%) | 368 (14.7%) |
| 8:30 AM to 8:59 AM | 20 (0.7%) | 51 (2.0%) |
| 9:00 AM to 9:59 AM | 144 (5.3%) | 151 (6.0%) |
| 10:00 AM to 10:59 AM | 107 (3.9%) | 138 (5.5%) |
| 11:00 AM to 11:59 AM | 6 (0.2%) | 0 (0.0%) |
| 12:00 PM to 3:59 PM | 213 (7.8%) | 59 (2.4%) |
| 4:00 PM to 11:59 PM | 17 (0.6%) | 74 (3.0%) |
| Total | 2,717 (100.0%) | 2,498 (100.0%) |
Housing Occupancy in Accokeek
Occupancy by Ownership in Accokeek
Of the total 4,290 dwellings in Accokeek, owner-occupied units account for 4,239 (98.8%), while renter-occupied units make up 51 (1.2%).
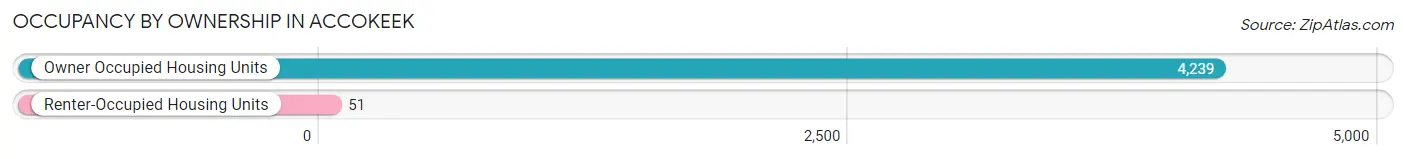
| Occupancy | # Housing Units | % Housing Units |
| Owner Occupied Housing Units | 4,239 | 98.8% |
| Renter-Occupied Housing Units | 51 | 1.2% |
| Total Occupied Housing Units | 4,290 | 100.0% |
Occupancy by Household Size in Accokeek
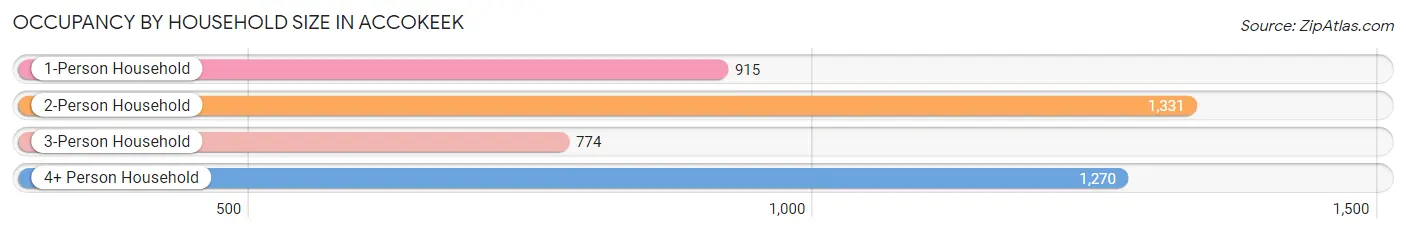
| Household Size | # Housing Units | % Housing Units |
| 1-Person Household | 915 | 21.3% |
| 2-Person Household | 1,331 | 31.0% |
| 3-Person Household | 774 | 18.0% |
| 4+ Person Household | 1,270 | 29.6% |
| Total Housing Units | 4,290 | 100.0% |
Occupancy by Ownership by Household Size in Accokeek
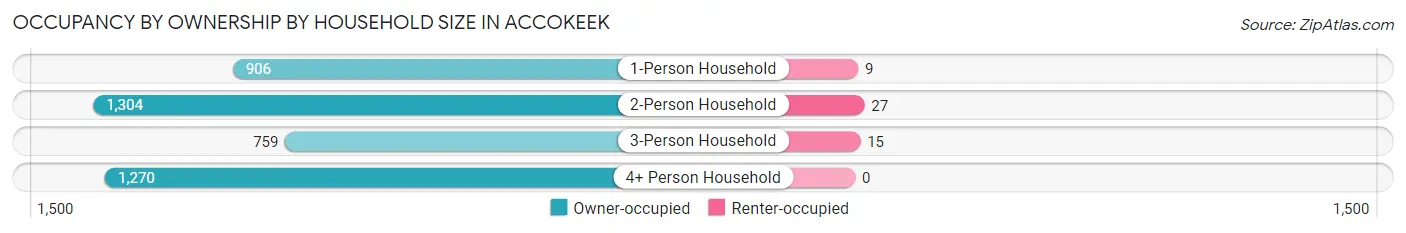
| Household Size | Owner-occupied | Renter-occupied |
| 1-Person Household | 906 (99.0%) | 9 (1.0%) |
| 2-Person Household | 1,304 (98.0%) | 27 (2.0%) |
| 3-Person Household | 759 (98.1%) | 15 (1.9%) |
| 4+ Person Household | 1,270 (100.0%) | 0 (0.0%) |
| Total Housing Units | 4,239 (98.8%) | 51 (1.2%) |
Occupancy by Educational Attainment in Accokeek
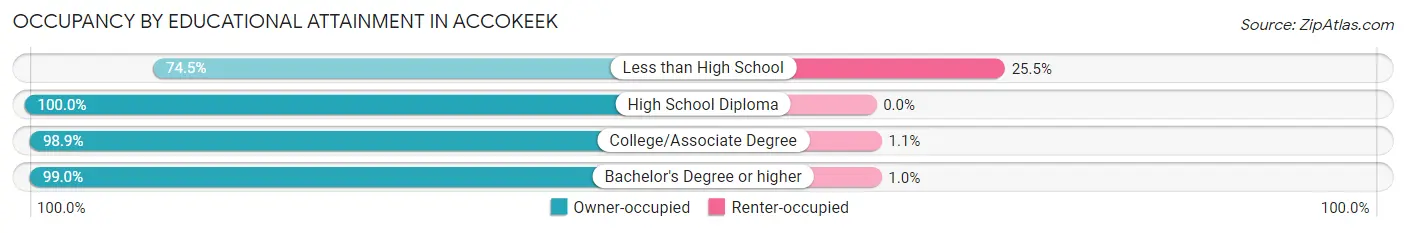
| Household Size | Owner-occupied | Renter-occupied |
| Less than High School | 38 (74.5%) | 13 (25.5%) |
| High School Diploma | 646 (100.0%) | 0 (0.0%) |
| College/Associate Degree | 1,278 (98.9%) | 14 (1.1%) |
| Bachelor's Degree or higher | 2,277 (99.0%) | 24 (1.0%) |
Occupancy by Age of Householder in Accokeek
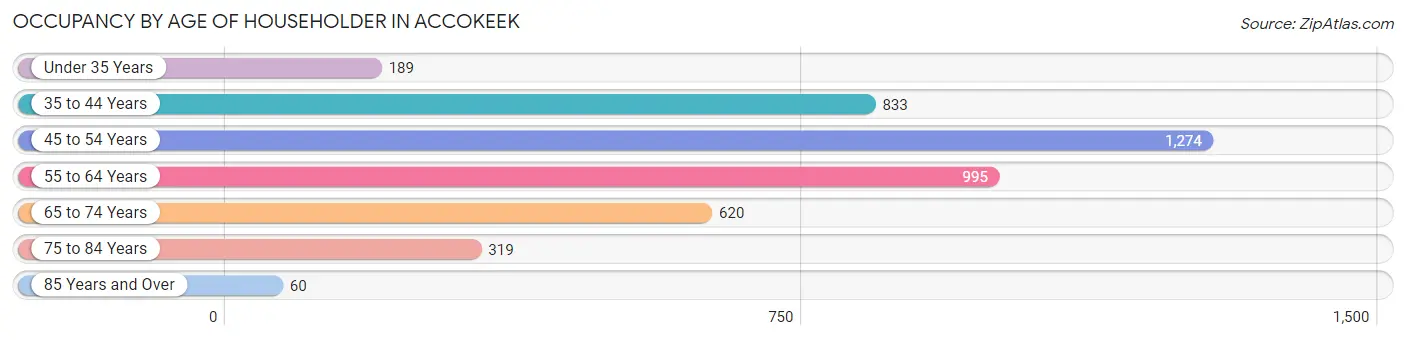
| Age Bracket | # Households | % Households |
| Under 35 Years | 189 | 4.4% |
| 35 to 44 Years | 833 | 19.4% |
| 45 to 54 Years | 1,274 | 29.7% |
| 55 to 64 Years | 995 | 23.2% |
| 65 to 74 Years | 620 | 14.4% |
| 75 to 84 Years | 319 | 7.4% |
| 85 Years and Over | 60 | 1.4% |
| Total | 4,290 | 100.0% |
Housing Finances in Accokeek
Median Income by Occupancy in Accokeek
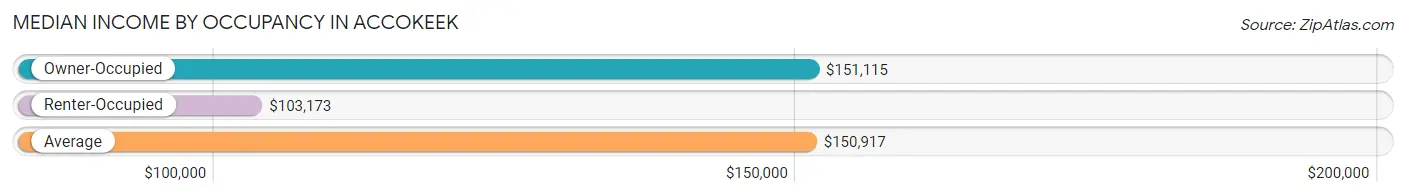
| Occupancy Type | # Households | Median Income |
| Owner-Occupied | 4,239 (98.8%) | $151,115 |
| Renter-Occupied | 51 (1.2%) | $103,173 |
| Average | 4,290 (100.0%) | $150,917 |
Occupancy by Householder Income Bracket in Accokeek
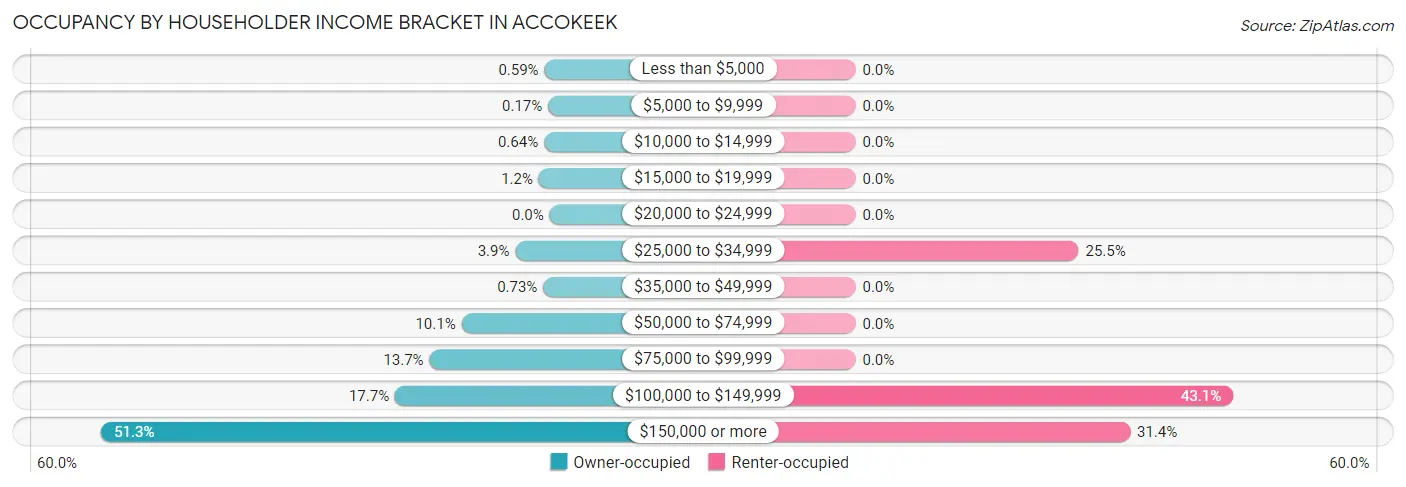
| Income Bracket | Owner-occupied | Renter-occupied |
| Less than $5,000 | 25 (0.6%) | 0 (0.0%) |
| $5,000 to $9,999 | 7 (0.2%) | 0 (0.0%) |
| $10,000 to $14,999 | 27 (0.6%) | 0 (0.0%) |
| $15,000 to $19,999 | 52 (1.2%) | 0 (0.0%) |
| $20,000 to $24,999 | 0 (0.0%) | 0 (0.0%) |
| $25,000 to $34,999 | 166 (3.9%) | 13 (25.5%) |
| $35,000 to $49,999 | 31 (0.7%) | 0 (0.0%) |
| $50,000 to $74,999 | 427 (10.1%) | 0 (0.0%) |
| $75,000 to $99,999 | 582 (13.7%) | 0 (0.0%) |
| $100,000 to $149,999 | 749 (17.7%) | 22 (43.1%) |
| $150,000 or more | 2,173 (51.3%) | 16 (31.4%) |
| Total | 4,239 (100.0%) | 51 (100.0%) |
Monthly Housing Cost Tiers in Accokeek
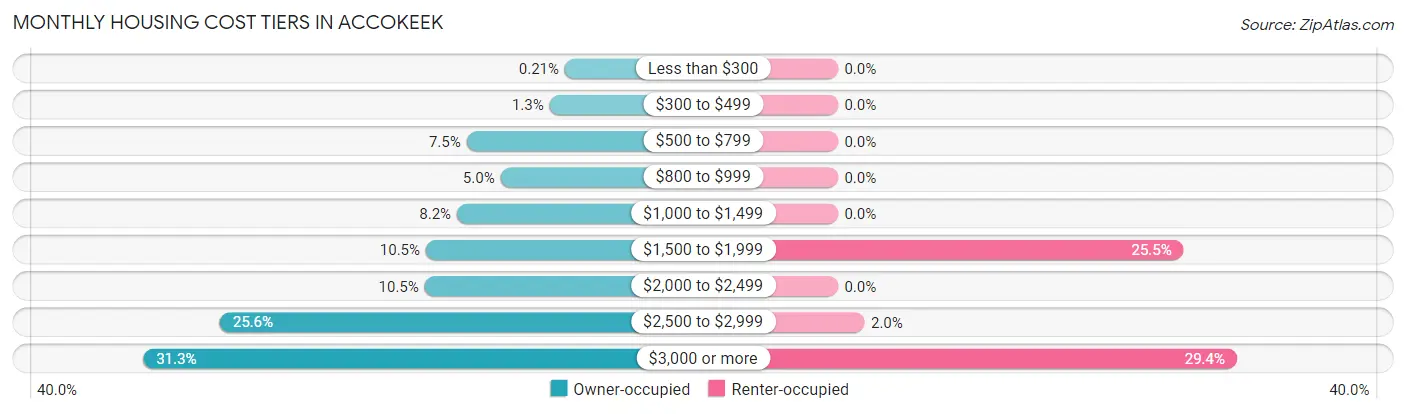
| Monthly Cost | Owner-occupied | Renter-occupied |
| Less than $300 | 9 (0.2%) | 0 (0.0%) |
| $300 to $499 | 57 (1.3%) | 0 (0.0%) |
| $500 to $799 | 316 (7.4%) | 0 (0.0%) |
| $800 to $999 | 210 (5.0%) | 0 (0.0%) |
| $1,000 to $1,499 | 346 (8.2%) | 0 (0.0%) |
| $1,500 to $1,999 | 443 (10.4%) | 13 (25.5%) |
| $2,000 to $2,499 | 447 (10.5%) | 0 (0.0%) |
| $2,500 to $2,999 | 1,086 (25.6%) | 1 (2.0%) |
| $3,000 or more | 1,325 (31.3%) | 15 (29.4%) |
| Total | 4,239 (100.0%) | 51 (100.0%) |
Physical Housing Characteristics in Accokeek
Housing Structures in Accokeek
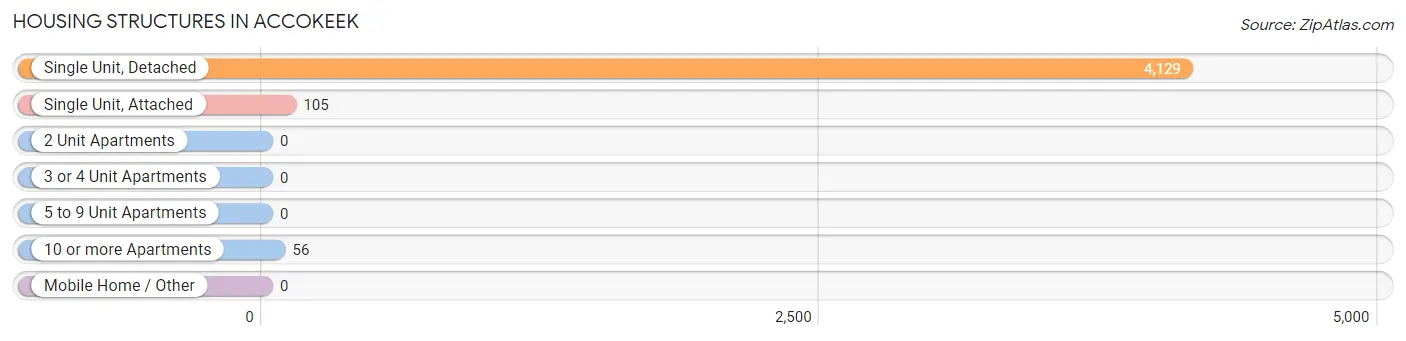
| Structure Type | # Housing Units | % Housing Units |
| Single Unit, Detached | 4,129 | 96.3% |
| Single Unit, Attached | 105 | 2.5% |
| 2 Unit Apartments | 0 | 0.0% |
| 3 or 4 Unit Apartments | 0 | 0.0% |
| 5 to 9 Unit Apartments | 0 | 0.0% |
| 10 or more Apartments | 56 | 1.3% |
| Mobile Home / Other | 0 | 0.0% |
| Total | 4,290 | 100.0% |
Housing Structures by Occupancy in Accokeek
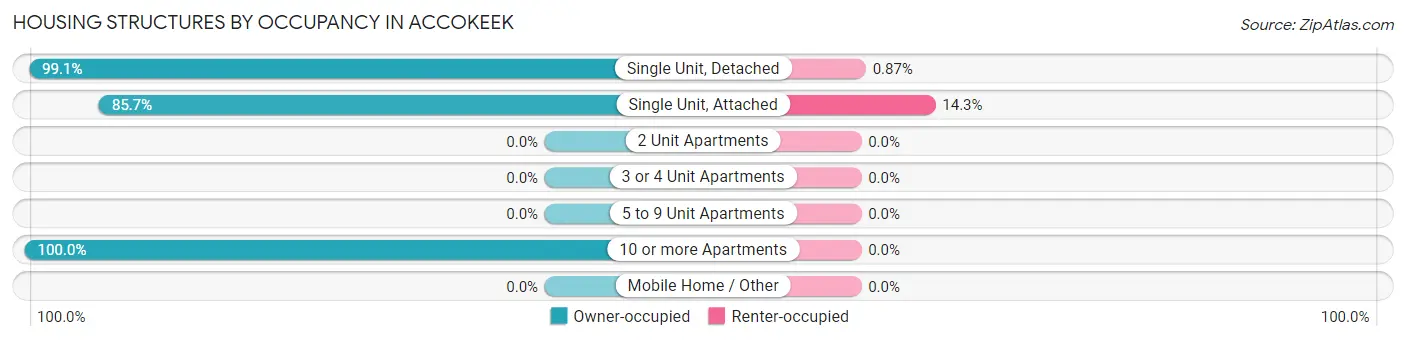
| Structure Type | Owner-occupied | Renter-occupied |
| Single Unit, Detached | 4,093 (99.1%) | 36 (0.9%) |
| Single Unit, Attached | 90 (85.7%) | 15 (14.3%) |
| 2 Unit Apartments | 0 (0.0%) | 0 (0.0%) |
| 3 or 4 Unit Apartments | 0 (0.0%) | 0 (0.0%) |
| 5 to 9 Unit Apartments | 0 (0.0%) | 0 (0.0%) |
| 10 or more Apartments | 56 (100.0%) | 0 (0.0%) |
| Mobile Home / Other | 0 (0.0%) | 0 (0.0%) |
| Total | 4,239 (98.8%) | 51 (1.2%) |
Housing Structures by Number of Rooms in Accokeek
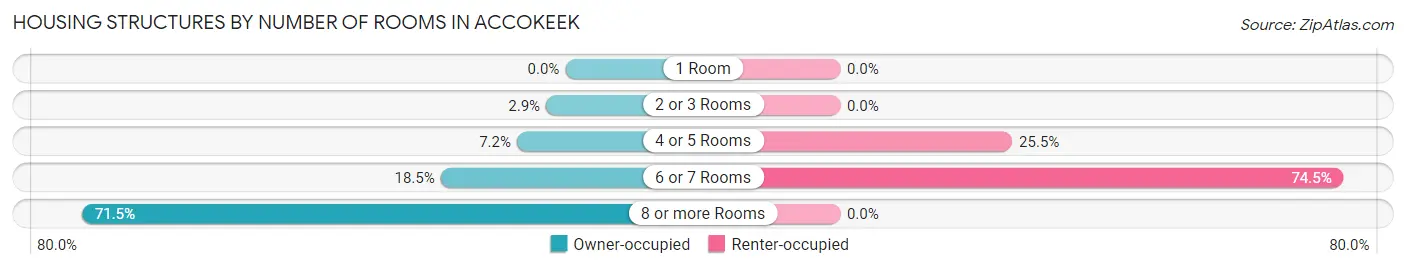
| Number of Rooms | Owner-occupied | Renter-occupied |
| 1 Room | 0 (0.0%) | 0 (0.0%) |
| 2 or 3 Rooms | 121 (2.9%) | 0 (0.0%) |
| 4 or 5 Rooms | 304 (7.2%) | 13 (25.5%) |
| 6 or 7 Rooms | 782 (18.4%) | 38 (74.5%) |
| 8 or more Rooms | 3,032 (71.5%) | 0 (0.0%) |
| Total | 4,239 (100.0%) | 51 (100.0%) |
Housing Structure by Heating Type in Accokeek
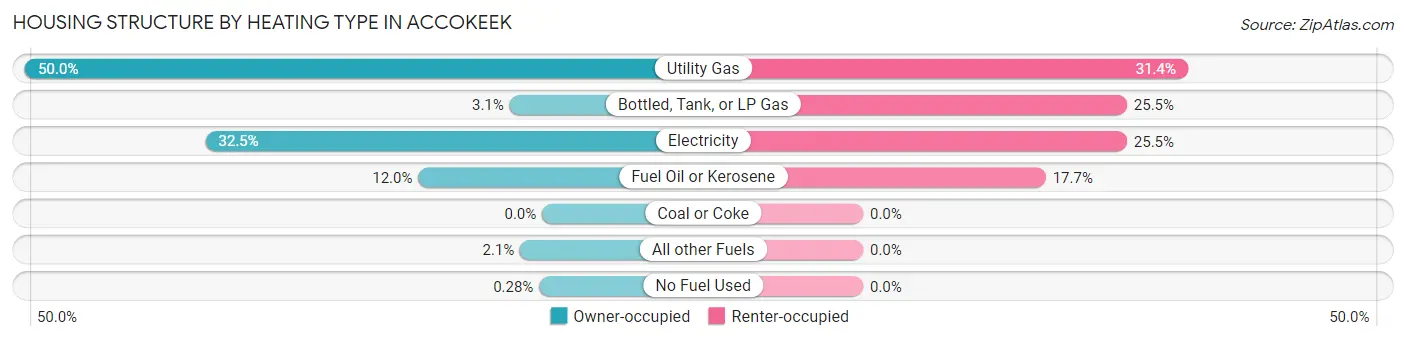
| Heating Type | Owner-occupied | Renter-occupied |
| Utility Gas | 2,118 (50.0%) | 16 (31.4%) |
| Bottled, Tank, or LP Gas | 133 (3.1%) | 13 (25.5%) |
| Electricity | 1,379 (32.5%) | 13 (25.5%) |
| Fuel Oil or Kerosene | 507 (12.0%) | 9 (17.6%) |
| Coal or Coke | 0 (0.0%) | 0 (0.0%) |
| All other Fuels | 90 (2.1%) | 0 (0.0%) |
| No Fuel Used | 12 (0.3%) | 0 (0.0%) |
| Total | 4,239 (100.0%) | 51 (100.0%) |
Household Vehicle Usage in Accokeek
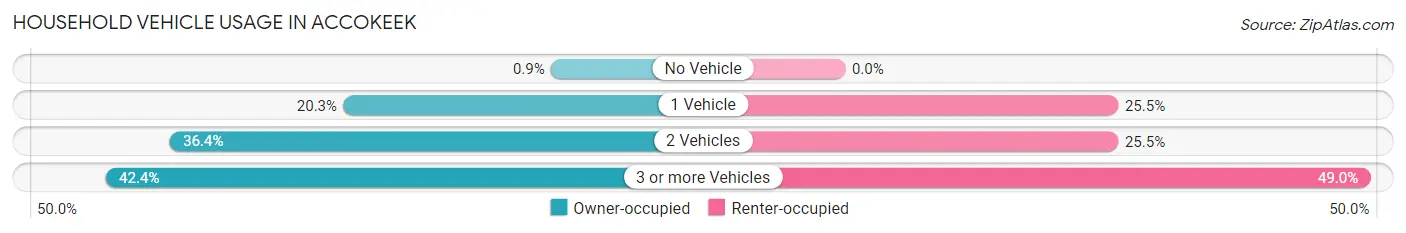
| Vehicles per Household | Owner-occupied | Renter-occupied |
| No Vehicle | 38 (0.9%) | 0 (0.0%) |
| 1 Vehicle | 860 (20.3%) | 13 (25.5%) |
| 2 Vehicles | 1,544 (36.4%) | 13 (25.5%) |
| 3 or more Vehicles | 1,797 (42.4%) | 25 (49.0%) |
| Total | 4,239 (100.0%) | 51 (100.0%) |
Real Estate & Mortgages in Accokeek
Real Estate and Mortgage Overview in Accokeek
| Characteristic | Without Mortgage | With Mortgage |
| Housing Units | 759 | 3,480 |
| Median Property Value | $437,600 | $477,300 |
| Median Household Income | $110,208 | $1,918 |
| Monthly Housing Costs | $861 | $1,325 |
| Real Estate Taxes | $5,229 | $172 |
Property Value by Mortgage Status in Accokeek
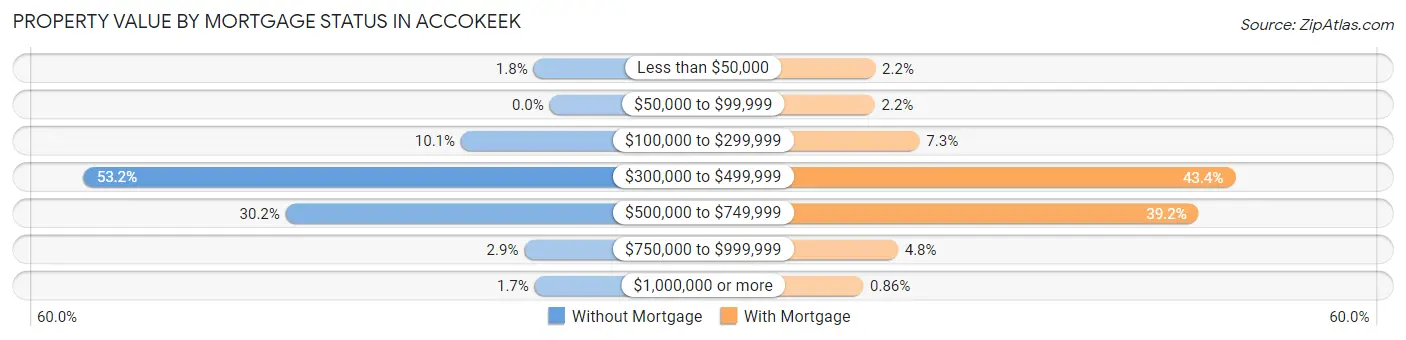
| Property Value | Without Mortgage | With Mortgage |
| Less than $50,000 | 14 (1.8%) | 78 (2.2%) |
| $50,000 to $99,999 | 0 (0.0%) | 76 (2.2%) |
| $100,000 to $299,999 | 77 (10.1%) | 254 (7.3%) |
| $300,000 to $499,999 | 404 (53.2%) | 1,510 (43.4%) |
| $500,000 to $749,999 | 229 (30.2%) | 1,364 (39.2%) |
| $750,000 to $999,999 | 22 (2.9%) | 168 (4.8%) |
| $1,000,000 or more | 13 (1.7%) | 30 (0.9%) |
| Total | 759 (100.0%) | 3,480 (100.0%) |
Household Income by Mortgage Status in Accokeek
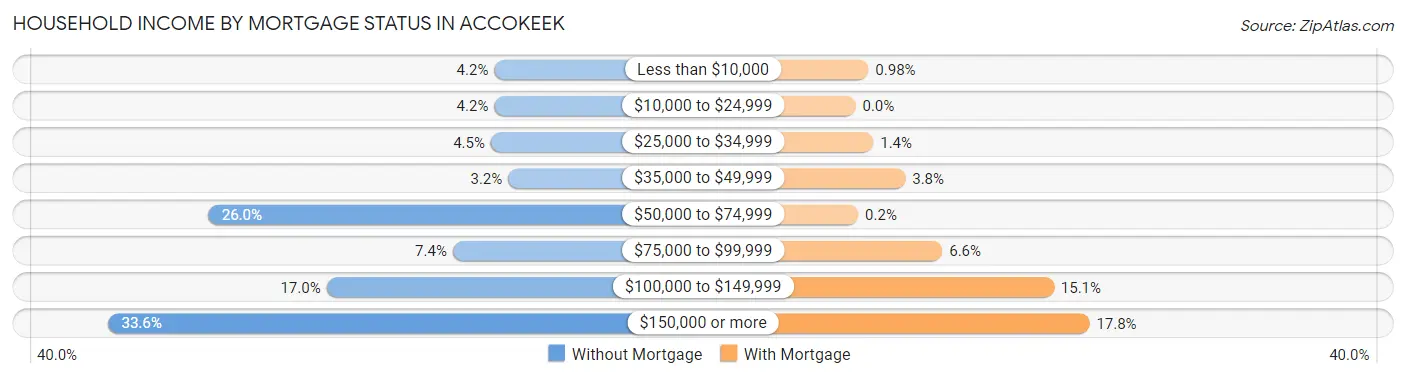
| Household Income | Without Mortgage | With Mortgage |
| Less than $10,000 | 32 (4.2%) | 34 (1.0%) |
| $10,000 to $24,999 | 32 (4.2%) | 0 (0.0%) |
| $25,000 to $34,999 | 34 (4.5%) | 47 (1.3%) |
| $35,000 to $49,999 | 24 (3.2%) | 132 (3.8%) |
| $50,000 to $74,999 | 197 (26.0%) | 7 (0.2%) |
| $75,000 to $99,999 | 56 (7.4%) | 230 (6.6%) |
| $100,000 to $149,999 | 129 (17.0%) | 526 (15.1%) |
| $150,000 or more | 255 (33.6%) | 620 (17.8%) |
| Total | 759 (100.0%) | 3,480 (100.0%) |
Property Value to Household Income Ratio in Accokeek
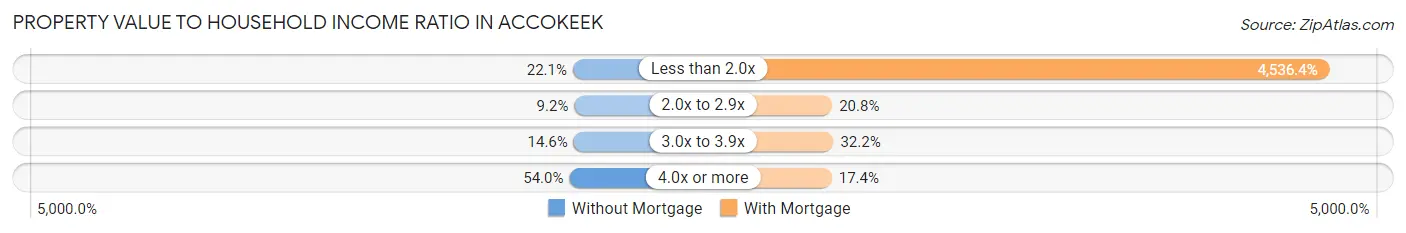
| Value-to-Income Ratio | Without Mortgage | With Mortgage |
| Less than 2.0x | 168 (22.1%) | 157,868 (4,536.4%) |
| 2.0x to 2.9x | 70 (9.2%) | 725 (20.8%) |
| 3.0x to 3.9x | 111 (14.6%) | 1,122 (32.2%) |
| 4.0x or more | 410 (54.0%) | 604 (17.4%) |
| Total | 759 (100.0%) | 3,480 (100.0%) |
Real Estate Taxes by Mortgage Status in Accokeek
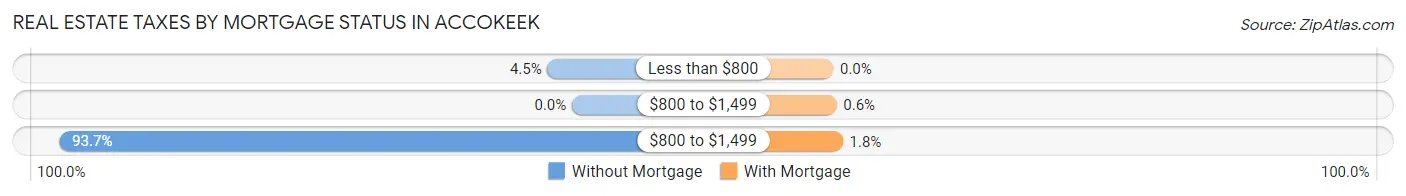
| Property Taxes | Without Mortgage | With Mortgage |
| Less than $800 | 34 (4.5%) | 0 (0.0%) |
| $800 to $1,499 | 0 (0.0%) | 21 (0.6%) |
| $800 to $1,499 | 711 (93.7%) | 61 (1.8%) |
| Total | 759 (100.0%) | 3,480 (100.0%) |
Health & Disability in Accokeek
Health Insurance Coverage by Age in Accokeek
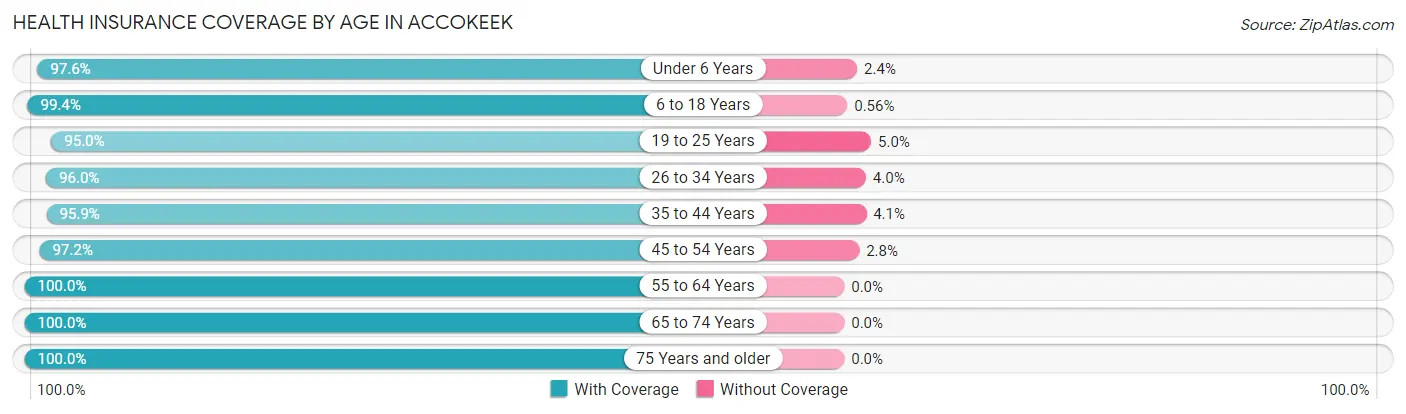
| Age Bracket | With Coverage | Without Coverage |
| Under 6 Years | 976 (97.6%) | 24 (2.4%) |
| 6 to 18 Years | 1,791 (99.4%) | 10 (0.6%) |
| 19 to 25 Years | 1,026 (95.0%) | 54 (5.0%) |
| 26 to 34 Years | 1,095 (96.0%) | 46 (4.0%) |
| 35 to 44 Years | 1,623 (95.9%) | 69 (4.1%) |
| 45 to 54 Years | 2,098 (97.2%) | 60 (2.8%) |
| 55 to 64 Years | 2,010 (100.0%) | 0 (0.0%) |
| 65 to 74 Years | 1,208 (100.0%) | 0 (0.0%) |
| 75 Years and older | 594 (100.0%) | 0 (0.0%) |
| Total | 12,421 (97.9%) | 263 (2.1%) |
Health Insurance Coverage by Citizenship Status in Accokeek
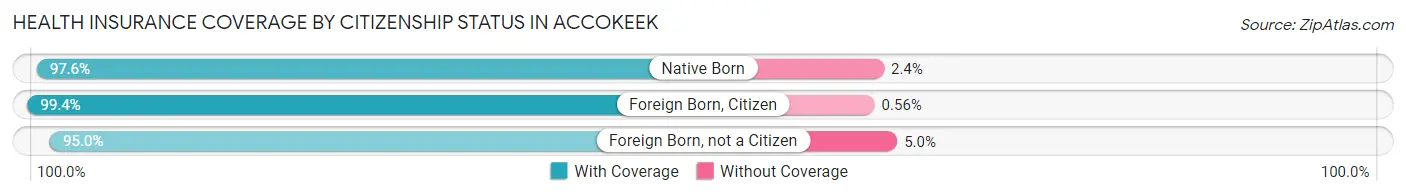
| Citizenship Status | With Coverage | Without Coverage |
| Native Born | 976 (97.6%) | 24 (2.4%) |
| Foreign Born, Citizen | 1,791 (99.4%) | 10 (0.6%) |
| Foreign Born, not a Citizen | 1,026 (95.0%) | 54 (5.0%) |
Health Insurance Coverage by Household Income in Accokeek
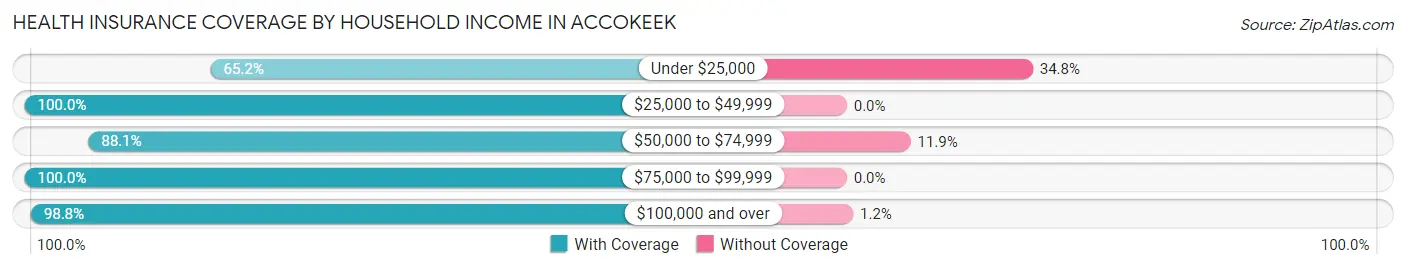
| Household Income | With Coverage | Without Coverage |
| Under $25,000 | 101 (65.2%) | 54 (34.8%) |
| $25,000 to $49,999 | 435 (100.0%) | 0 (0.0%) |
| $50,000 to $74,999 | 671 (88.1%) | 91 (11.9%) |
| $75,000 to $99,999 | 1,527 (100.0%) | 0 (0.0%) |
| $100,000 and over | 9,681 (98.8%) | 116 (1.2%) |
Public vs Private Health Insurance Coverage by Age in Accokeek
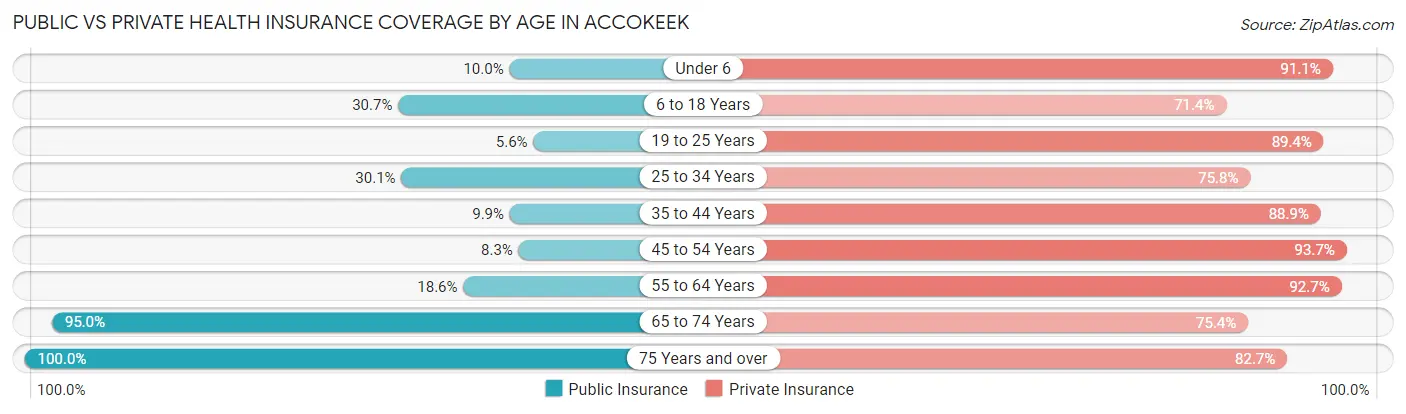
| Age Bracket | Public Insurance | Private Insurance |
| Under 6 | 100 (10.0%) | 911 (91.1%) |
| 6 to 18 Years | 552 (30.6%) | 1,285 (71.4%) |
| 19 to 25 Years | 60 (5.6%) | 966 (89.4%) |
| 25 to 34 Years | 343 (30.1%) | 865 (75.8%) |
| 35 to 44 Years | 168 (9.9%) | 1,504 (88.9%) |
| 45 to 54 Years | 179 (8.3%) | 2,022 (93.7%) |
| 55 to 64 Years | 373 (18.6%) | 1,864 (92.7%) |
| 65 to 74 Years | 1,147 (95.0%) | 911 (75.4%) |
| 75 Years and over | 594 (100.0%) | 491 (82.7%) |
| Total | 3,516 (27.7%) | 10,819 (85.3%) |
Disability Status by Sex by Age in Accokeek
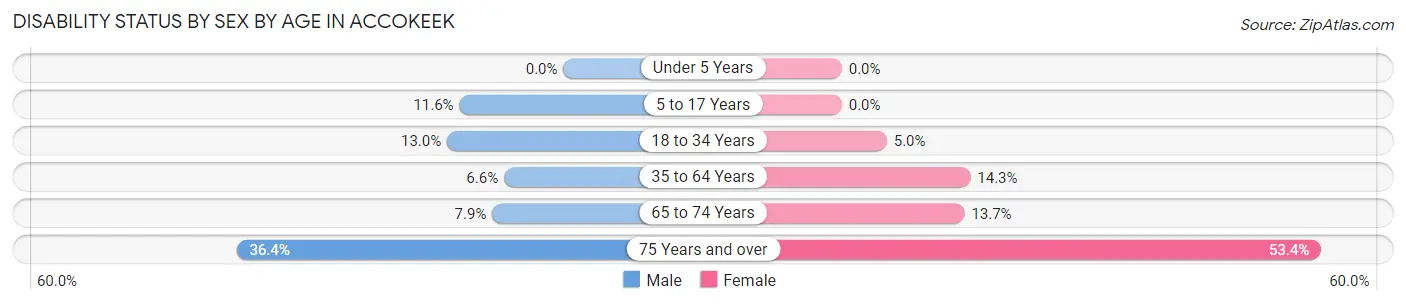
| Age Bracket | Male | Female |
| Under 5 Years | 0 (0.0%) | 0 (0.0%) |
| 5 to 17 Years | 110 (11.6%) | 0 (0.0%) |
| 18 to 34 Years | 188 (13.0%) | 41 (5.0%) |
| 35 to 64 Years | 186 (6.6%) | 436 (14.3%) |
| 65 to 74 Years | 40 (7.9%) | 96 (13.7%) |
| 75 Years and over | 103 (36.4%) | 166 (53.4%) |
Disability Class by Sex by Age in Accokeek
Disability Class: Hearing Difficulty
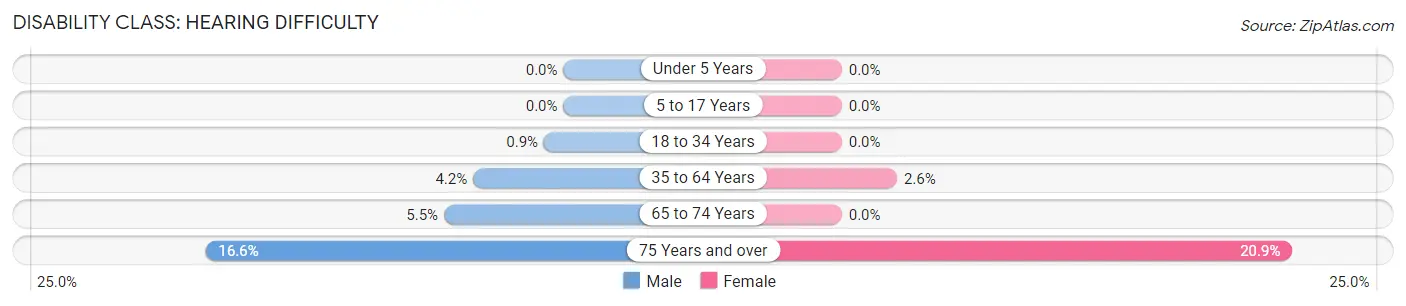
| Age Bracket | Male | Female |
| Under 5 Years | 0 (0.0%) | 0 (0.0%) |
| 5 to 17 Years | 0 (0.0%) | 0 (0.0%) |
| 18 to 34 Years | 13 (0.9%) | 0 (0.0%) |
| 35 to 64 Years | 118 (4.2%) | 78 (2.6%) |
| 65 to 74 Years | 28 (5.5%) | 0 (0.0%) |
| 75 Years and over | 47 (16.6%) | 65 (20.9%) |
Disability Class: Vision Difficulty
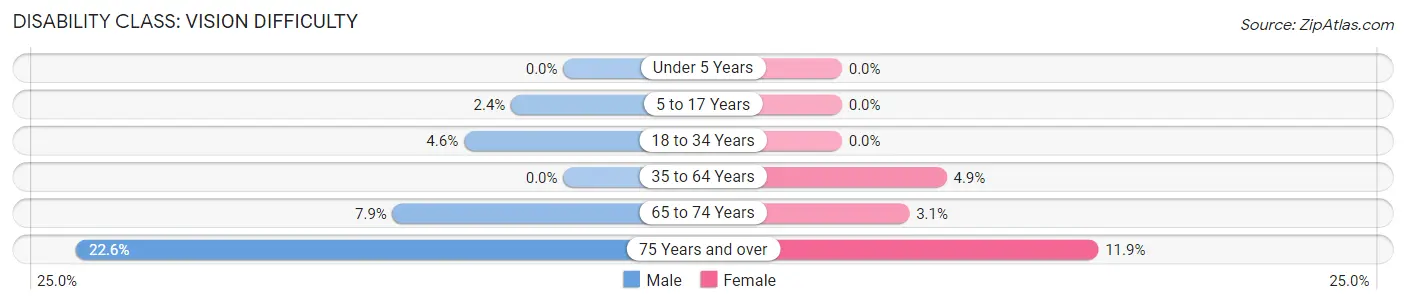
| Age Bracket | Male | Female |
| Under 5 Years | 0 (0.0%) | 0 (0.0%) |
| 5 to 17 Years | 23 (2.4%) | 0 (0.0%) |
| 18 to 34 Years | 67 (4.6%) | 0 (0.0%) |
| 35 to 64 Years | 0 (0.0%) | 148 (4.9%) |
| 65 to 74 Years | 40 (7.9%) | 22 (3.1%) |
| 75 Years and over | 64 (22.6%) | 37 (11.9%) |
Disability Class: Cognitive Difficulty
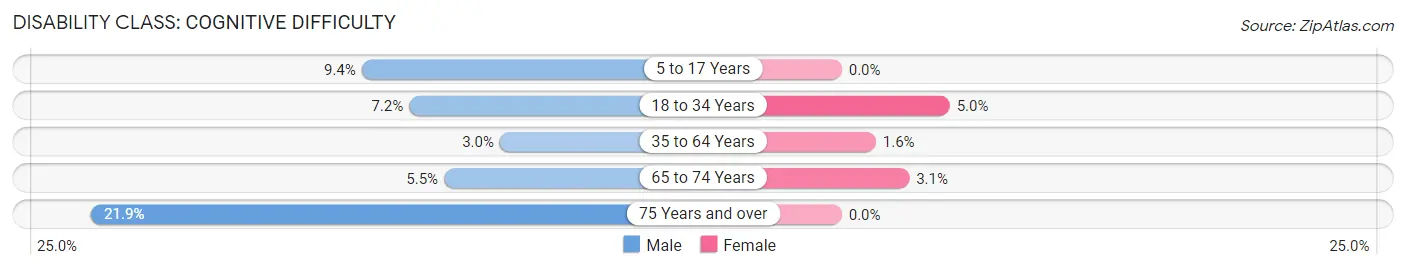
| Age Bracket | Male | Female |
| 5 to 17 Years | 89 (9.4%) | 0 (0.0%) |
| 18 to 34 Years | 104 (7.2%) | 41 (5.0%) |
| 35 to 64 Years | 83 (2.9%) | 48 (1.6%) |
| 65 to 74 Years | 28 (5.5%) | 22 (3.1%) |
| 75 Years and over | 62 (21.9%) | 0 (0.0%) |
Disability Class: Ambulatory Difficulty
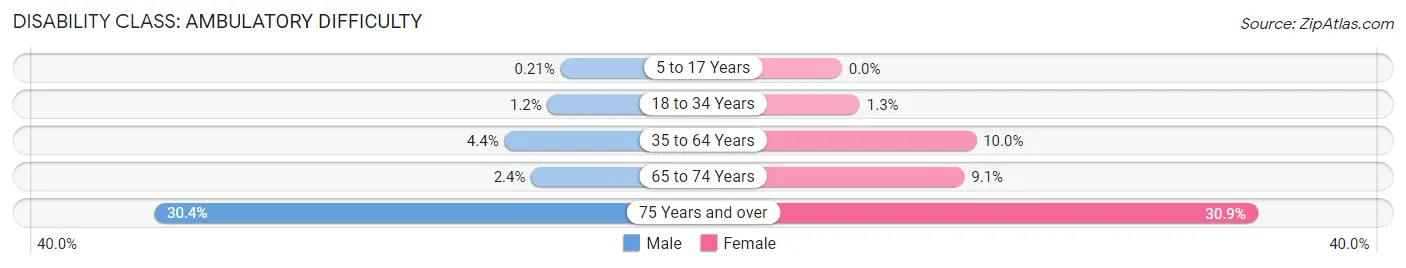
| Age Bracket | Male | Female |
| 5 to 17 Years | 2 (0.2%) | 0 (0.0%) |
| 18 to 34 Years | 17 (1.2%) | 11 (1.3%) |
| 35 to 64 Years | 123 (4.4%) | 304 (10.0%) |
| 65 to 74 Years | 12 (2.4%) | 64 (9.1%) |
| 75 Years and over | 86 (30.4%) | 96 (30.9%) |
Disability Class: Self-Care Difficulty
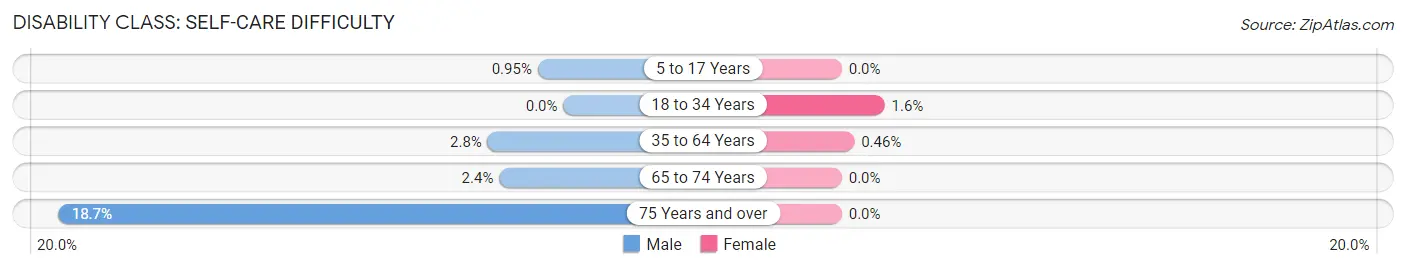
| Age Bracket | Male | Female |
| 5 to 17 Years | 9 (0.9%) | 0 (0.0%) |
| 18 to 34 Years | 0 (0.0%) | 13 (1.6%) |
| 35 to 64 Years | 79 (2.8%) | 14 (0.5%) |
| 65 to 74 Years | 12 (2.4%) | 0 (0.0%) |
| 75 Years and over | 53 (18.7%) | 0 (0.0%) |
Technology Access in Accokeek
Computing Device Access in Accokeek
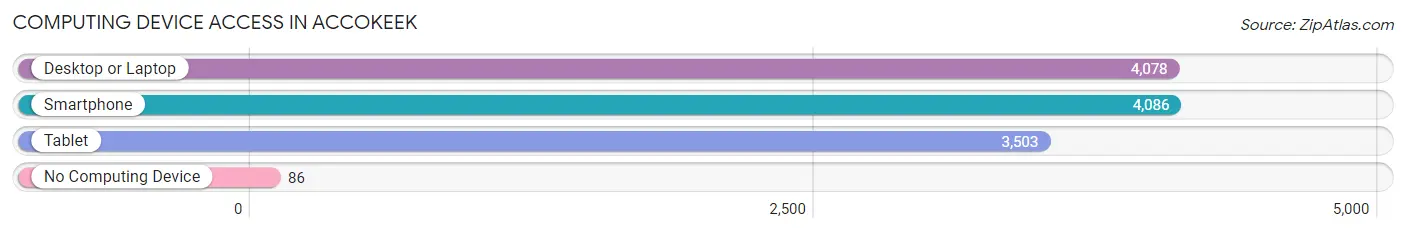
| Device Type | # Households | % Households |
| Desktop or Laptop | 4,078 | 95.1% |
| Smartphone | 4,086 | 95.2% |
| Tablet | 3,503 | 81.7% |
| No Computing Device | 86 | 2.0% |
| Total | 4,290 | 100.0% |
Internet Access in Accokeek
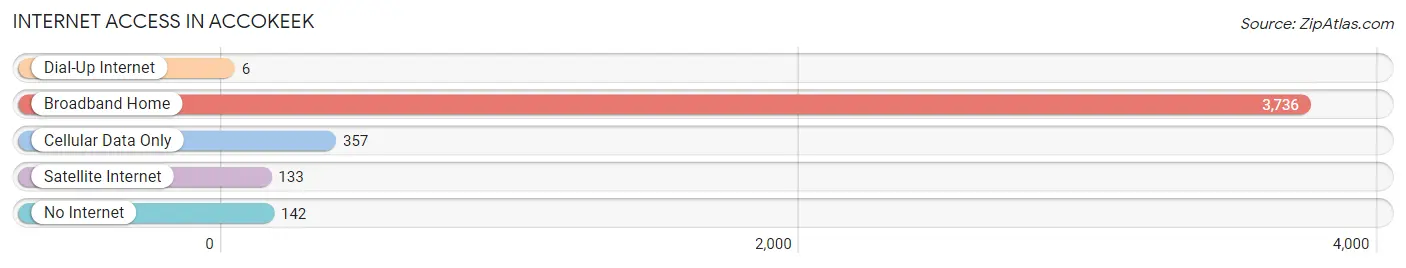
| Internet Type | # Households | % Households |
| Dial-Up Internet | 6 | 0.1% |
| Broadband Home | 3,736 | 87.1% |
| Cellular Data Only | 357 | 8.3% |
| Satellite Internet | 133 | 3.1% |
| No Internet | 142 | 3.3% |
| Total | 4,290 | 100.0% |
Accokeek Summary
Accokeek, Maryland is a small town located in Prince George’s County, Maryland, about 20 miles south of Washington, D.C. It is situated on the banks of the Potomac River and is part of the Washington metropolitan area. The town has a population of approximately 5,000 people and is known for its rural charm and close proximity to the nation’s capital.
History
Accokeek was first settled in the early 1700s by the Piscataway Indians, who were part of the Algonquian-speaking tribe. The town was originally known as “Accokeek Creek” and was part of the larger Piscataway Indian Reservation. In 1745, the town was officially established as “Accokeek” and was incorporated in 1798.
In the early 1800s, Accokeek was a thriving agricultural community, with tobacco, corn, and wheat being the main crops. The town was also home to several mills, including a grist mill, a saw mill, and a paper mill.
In the late 1800s, Accokeek began to experience a period of growth and development. The town was connected to Washington, D.C. by the Washington, Alexandria, and Mount Vernon Railway in 1872, and the town’s population began to grow. In the early 1900s, the town was home to several businesses, including a cannery, a brickyard, and a lumberyard.
Geography
Accokeek is located in Prince George’s County, Maryland, about 20 miles south of Washington, D.C. The town is situated on the banks of the Potomac River and is part of the Washington metropolitan area. The town is bordered by the towns of Fort Washington, Indian Head, and Bryans Road.
The town has a total area of 2.2 square miles, all of which is land. The terrain is mostly flat, with some rolling hills. The climate is humid subtropical, with hot, humid summers and mild winters.
Economy
Accokeek’s economy is largely based on the service industry. The town is home to several businesses, including restaurants, retail stores, and professional services. The town is also home to several government agencies, including the National Park Service and the U.S. Fish and Wildlife Service.
The town is also home to several large employers, including the National Institutes of Health, the U.S. Department of Agriculture, and the U.S. Department of Defense.
Demographics
As of the 2010 census, Accokeek had a population of 5,000 people. The racial makeup of the town was 79.3% White, 14.2% African American, 0.7% Native American, 1.2% Asian, 0.1% Pacific Islander, and 4.5% from other races. Hispanic or Latino of any race were 6.2% of the population.
The median household income in Accokeek was $76,250, and the median family income was $87,500. The per capita income was $32,000. About 8.2% of families and 10.2% of the population were below the poverty line.
Accokeek is a small town with a rich history and a vibrant economy. The town is home to several businesses and government agencies, and is a popular destination for visitors to the Washington metropolitan area. The town has a diverse population and is a great place to live and work.
Common Questions
What is Per Capita Income in Accokeek?
Per Capita income in Accokeek is $55,761.
What is the Median Family Income in Accokeek?
Median Family Income in Accokeek is $176,532.
What is the Median Household income in Accokeek?
Median Household Income in Accokeek is $150,917.
What is Income or Wage Gap in Accokeek?
Income or Wage Gap in Accokeek is 10.3%.
Women in Accokeek earn 89.7 cents for every dollar earned by a man.
What is Inequality or Gini Index in Accokeek?
Inequality or Gini Index in Accokeek is 0.33.
What is the Total Population of Accokeek?
Total Population of Accokeek is 12,745.
What is the Total Male Population of Accokeek?
Total Male Population of Accokeek is 6,295.
What is the Total Female Population of Accokeek?
Total Female Population of Accokeek is 6,450.
What is the Ratio of Males per 100 Females in Accokeek?
There are 97.60 Males per 100 Females in Accokeek.
What is the Ratio of Females per 100 Males in Accokeek?
There are 102.46 Females per 100 Males in Accokeek.
What is the Median Population Age in Accokeek?
Median Population Age in Accokeek is 43.2 Years.
What is the Average Family Size in Accokeek
Average Family Size in Accokeek is 3.5 People.
What is the Average Household Size in Accokeek
Average Household Size in Accokeek is 3.0 People.
How Large is the Labor Force in Accokeek?
There are 7,544 People in the Labor Forcein in Accokeek.
What is the Percentage of People in the Labor Force in Accokeek?
74.3% of People are in the Labor Force in Accokeek.
What is the Unemployment Rate in Accokeek?
Unemployment Rate in Accokeek is 8.9%.