Mountainair, NM Map & Demographics
Mountainair Map
Mountainair Overview
$19,742
PER CAPITA INCOME
$52,917
AVG FAMILY INCOME
$38,482
AVG HOUSEHOLD INCOME
35.1%
WAGE / INCOME GAP [ % ]
64.9¢/ $1
WAGE / INCOME GAP [ $ ]
0.45
INEQUALITY / GINI INDEX
1,071
TOTAL POPULATION
656
MALE POPULATION
415
FEMALE POPULATION
158.07
MALES / 100 FEMALES
63.26
FEMALES / 100 MALES
39.2
MEDIAN AGE
4.4
AVG FAMILY SIZE
3.2
AVG HOUSEHOLD SIZE
355
LABOR FORCE [ PEOPLE ]
44.3%
PERCENT IN LABOR FORCE
11.0%
UNEMPLOYMENT RATE
Mountainair Zip Codes
Mountainair Area Codes
Income in Mountainair
Income Overview in Mountainair
Per Capita Income in Mountainair is $19,742, while median incomes of families and households are $52,917 and $38,482 respectively.
| Characteristic | Number | Measure |
| Per Capita Income | 1,071 | $19,742 |
| Median Family Income | 184 | $52,917 |
| Mean Family Income | 184 | $83,510 |
| Median Household Income | 332 | $38,482 |
| Mean Household Income | 332 | $60,798 |
| Income Deficit | 184 | $0 |
| Wage / Income Gap (%) | 1,071 | 35.09% |
| Wage / Income Gap ($) | 1,071 | 64.91¢ per $1 |
| Gini / Inequality Index | 1,071 | 0.45 |
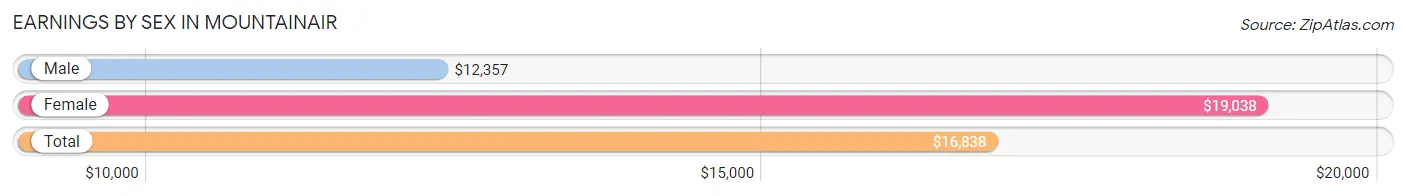
Earnings by Sex in Mountainair
Average Earnings in Mountainair are $16,838, $12,357 for men and $19,038 for women, a difference of 35.1%.
| Sex | Number | Average Earnings |
| Male | 209 (55.7%) | $12,357 |
| Female | 166 (44.3%) | $19,038 |
| Total | 375 (100.0%) | $16,838 |
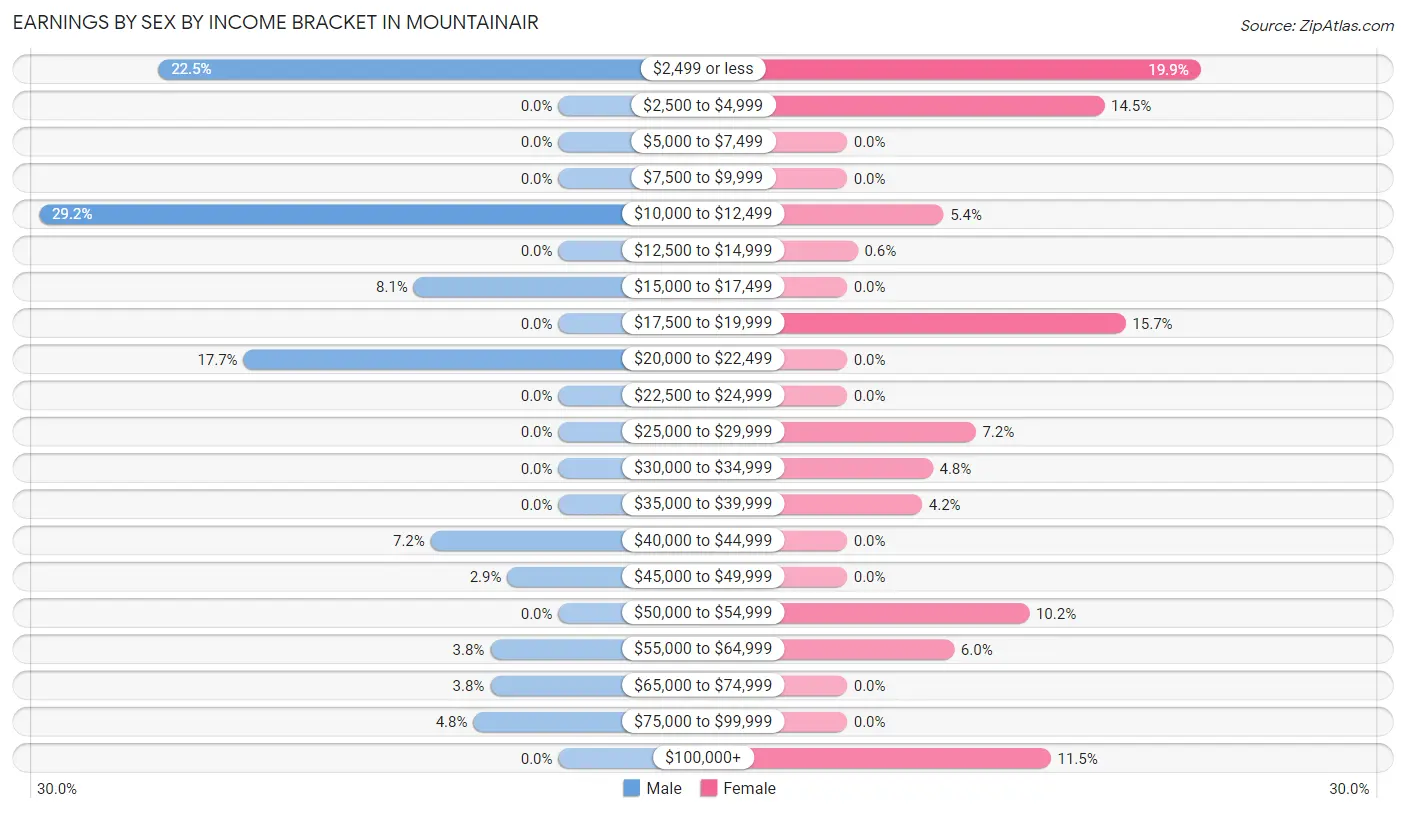
Earnings by Sex by Income Bracket in Mountainair
The most common earnings brackets in Mountainair are $10,000 to $12,499 for men (61 | 29.2%) and $2,499 or less for women (33 | 19.9%).
| Income | Male | Female |
| $2,499 or less | 47 (22.5%) | 33 (19.9%) |
| $2,500 to $4,999 | 0 (0.0%) | 24 (14.5%) |
| $5,000 to $7,499 | 0 (0.0%) | 0 (0.0%) |
| $7,500 to $9,999 | 0 (0.0%) | 0 (0.0%) |
| $10,000 to $12,499 | 61 (29.2%) | 9 (5.4%) |
| $12,500 to $14,999 | 0 (0.0%) | 1 (0.6%) |
| $15,000 to $17,499 | 17 (8.1%) | 0 (0.0%) |
| $17,500 to $19,999 | 0 (0.0%) | 26 (15.7%) |
| $20,000 to $22,499 | 37 (17.7%) | 0 (0.0%) |
| $22,500 to $24,999 | 0 (0.0%) | 0 (0.0%) |
| $25,000 to $29,999 | 0 (0.0%) | 12 (7.2%) |
| $30,000 to $34,999 | 0 (0.0%) | 8 (4.8%) |
| $35,000 to $39,999 | 0 (0.0%) | 7 (4.2%) |
| $40,000 to $44,999 | 15 (7.2%) | 0 (0.0%) |
| $45,000 to $49,999 | 6 (2.9%) | 0 (0.0%) |
| $50,000 to $54,999 | 0 (0.0%) | 17 (10.2%) |
| $55,000 to $64,999 | 8 (3.8%) | 10 (6.0%) |
| $65,000 to $74,999 | 8 (3.8%) | 0 (0.0%) |
| $75,000 to $99,999 | 10 (4.8%) | 0 (0.0%) |
| $100,000+ | 0 (0.0%) | 19 (11.5%) |
| Total | 209 (100.0%) | 166 (100.0%) |
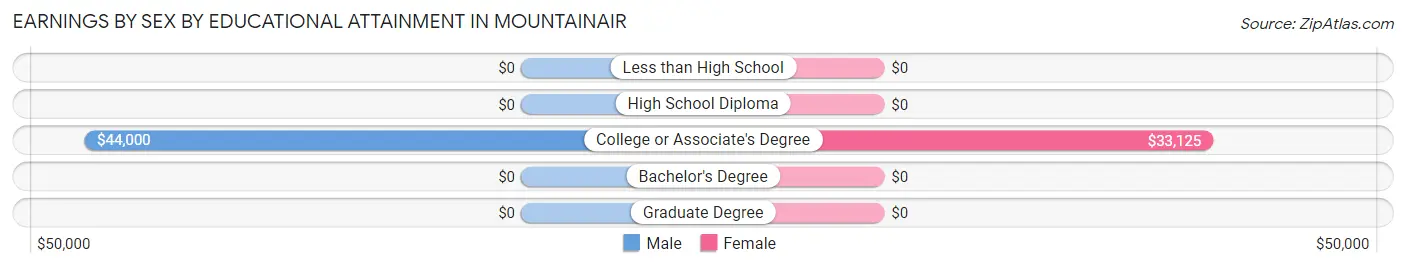
Earnings by Sex by Educational Attainment in Mountainair
| Educational Attainment | Male Income | Female Income |
| Less than High School | - | - |
| High School Diploma | - | - |
| College or Associate's Degree | $44,000 | $33,125 |
| Bachelor's Degree | - | - |
| Graduate Degree | - | - |
| Total | - | - |
Family Income in Mountainair
Family Income Brackets in Mountainair
According to the Mountainair family income data, there are 39 families falling into the $100,000 to $149,999 income range, which is the most common income bracket and makes up 21.2% of all families.
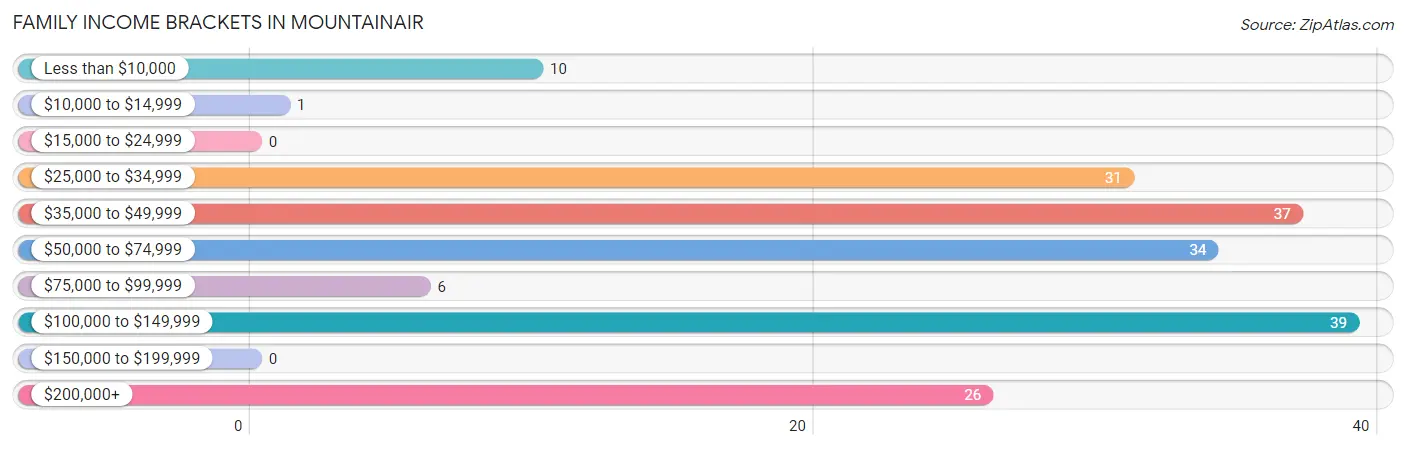
| Income Bracket | # Families | % Families |
| Less than $10,000 | 10 | 5.4% |
| $10,000 to $14,999 | 1 | 0.5% |
| $15,000 to $24,999 | 0 | 0.0% |
| $25,000 to $34,999 | 31 | 16.8% |
| $35,000 to $49,999 | 37 | 20.1% |
| $50,000 to $74,999 | 34 | 18.5% |
| $75,000 to $99,999 | 6 | 3.3% |
| $100,000 to $149,999 | 39 | 21.2% |
| $150,000 to $199,999 | 0 | 0.0% |
| $200,000+ | 26 | 14.1% |
Family Income by Famaliy Size in Mountainair
3-person families (34 | 18.5%) account for the highest median family income in Mountainair with $100,313 per family, while 3-person families (34 | 18.5%) have the highest median income of $33,438 per family member.
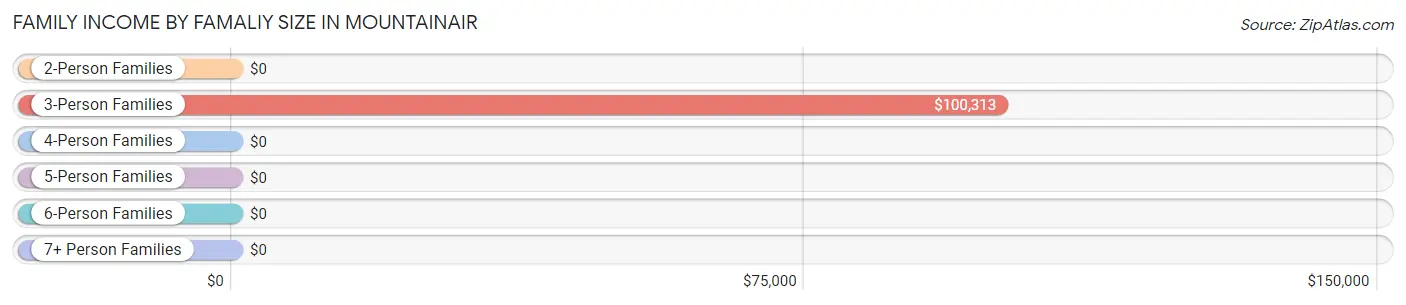
| Income Bracket | # Families | Median Income |
| 2-Person Families | 81 (44.0%) | $0 |
| 3-Person Families | 34 (18.5%) | $100,313 |
| 4-Person Families | 16 (8.7%) | $0 |
| 5-Person Families | 15 (8.2%) | $0 |
| 6-Person Families | 21 (11.4%) | $0 |
| 7+ Person Families | 17 (9.2%) | $0 |
| Total | 184 (100.0%) | $52,917 |
Family Income by Number of Earners in Mountainair
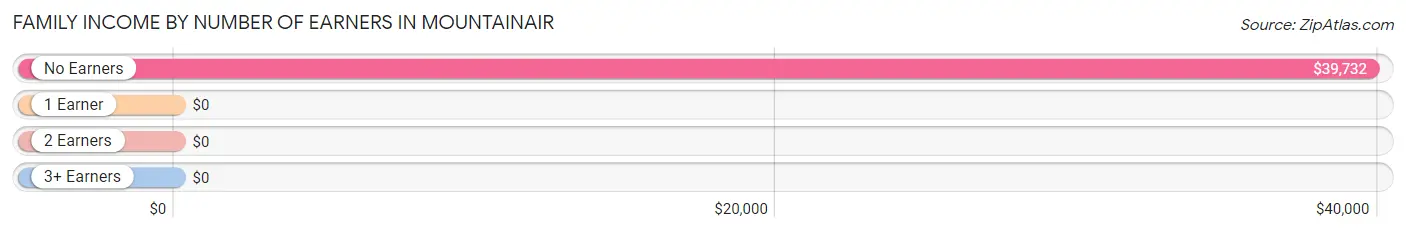
| Number of Earners | # Families | Median Income |
| No Earners | 52 (28.3%) | $39,732 |
| 1 Earner | 10 (5.4%) | $0 |
| 2 Earners | 91 (49.5%) | $0 |
| 3+ Earners | 31 (16.9%) | $0 |
| Total | 184 (100.0%) | $52,917 |
Household Income in Mountainair
Household Income Brackets in Mountainair
With 72 households falling in the category, the $35,000 to $49,999 income range is the most frequent in Mountainair, accounting for 21.7% of all households.
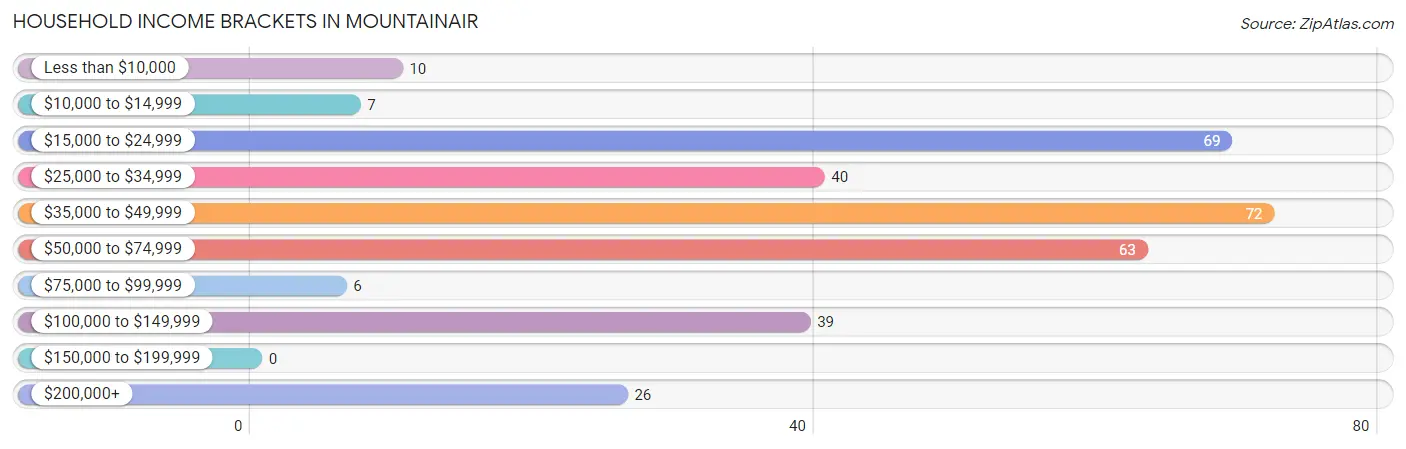
| Income Bracket | # Households | % Households |
| Less than $10,000 | 10 | 3.0% |
| $10,000 to $14,999 | 7 | 2.1% |
| $15,000 to $24,999 | 69 | 20.8% |
| $25,000 to $34,999 | 40 | 12.0% |
| $35,000 to $49,999 | 72 | 21.7% |
| $50,000 to $74,999 | 63 | 19.0% |
| $75,000 to $99,999 | 6 | 1.8% |
| $100,000 to $149,999 | 39 | 11.7% |
| $150,000 to $199,999 | 0 | 0.0% |
| $200,000+ | 26 | 7.8% |
Household Income by Householder Age in Mountainair
The median household income in Mountainair is $38,482, with the highest median household income of $38,795 found in the 65+ years age bracket for the primary householder. A total of 207 households (62.4%) fall into this category.
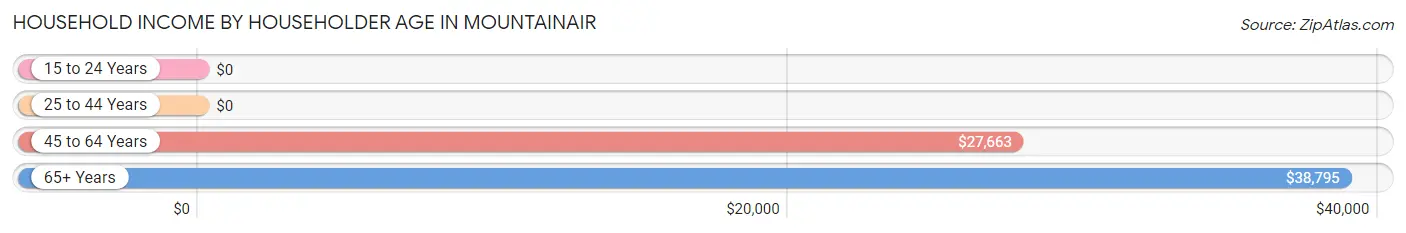
| Income Bracket | # Households | Median Income |
| 15 to 24 Years | 0 (0.0%) | $0 |
| 25 to 44 Years | 70 (21.1%) | $0 |
| 45 to 64 Years | 55 (16.6%) | $27,663 |
| 65+ Years | 207 (62.4%) | $38,795 |
| Total | 332 (100.0%) | $38,482 |
Poverty in Mountainair
Income Below Poverty by Sex and Age in Mountainair
With 15.4% poverty level for males and 20.4% for females among the residents of Mountainair, 35 to 44 year old males and 45 to 54 year old females are the most vulnerable to poverty, with 35 males (62.5%) and 15 females (100.0%) in their respective age groups living below the poverty level.
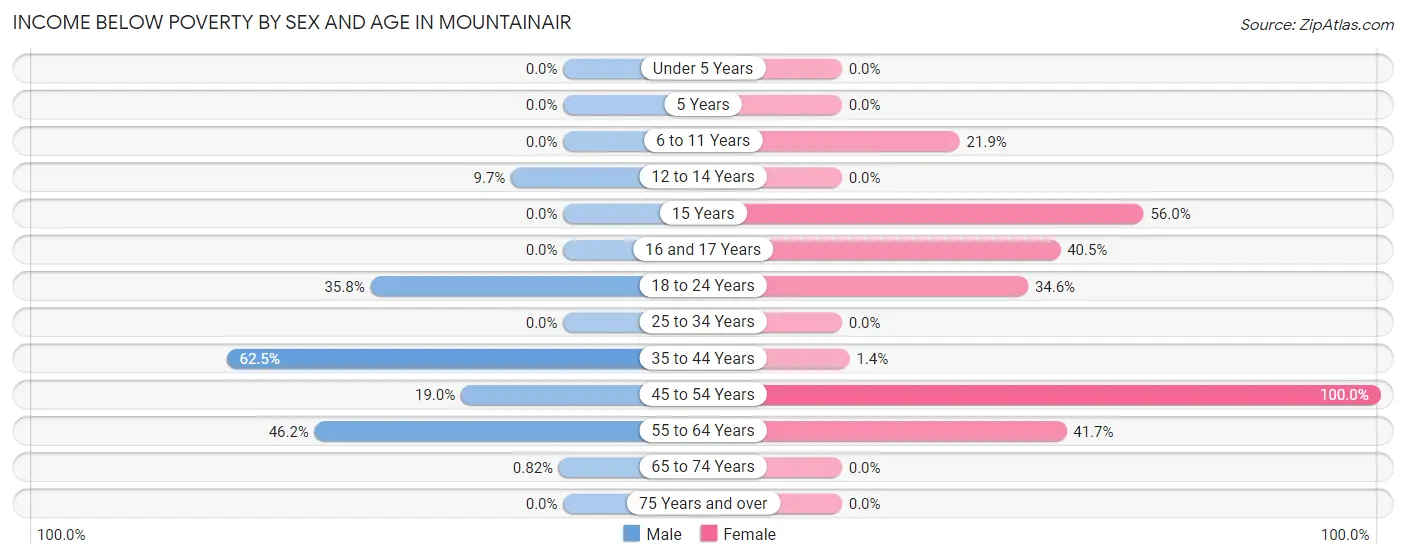
| Age Bracket | Male | Female |
| Under 5 Years | 0 (0.0%) | 0 (0.0%) |
| 5 Years | 0 (0.0%) | 0 (0.0%) |
| 6 to 11 Years | 0 (0.0%) | 7 (21.9%) |
| 12 to 14 Years | 9 (9.7%) | 0 (0.0%) |
| 15 Years | 0 (0.0%) | 14 (56.0%) |
| 16 and 17 Years | 0 (0.0%) | 15 (40.5%) |
| 18 to 24 Years | 29 (35.8%) | 19 (34.5%) |
| 25 to 34 Years | 0 (0.0%) | 0 (0.0%) |
| 35 to 44 Years | 35 (62.5%) | 1 (1.4%) |
| 45 to 54 Years | 15 (19.0%) | 15 (100.0%) |
| 55 to 64 Years | 12 (46.2%) | 10 (41.7%) |
| 65 to 74 Years | 1 (0.8%) | 0 (0.0%) |
| 75 Years and over | 0 (0.0%) | 0 (0.0%) |
| Total | 101 (15.4%) | 81 (20.4%) |
Income Above Poverty by Sex and Age in Mountainair
According to the poverty statistics in Mountainair, males aged under 5 years and females aged 12 to 14 years are the age groups that are most secure financially, with 100.0% of males and 100.0% of females in these age groups living above the poverty line.
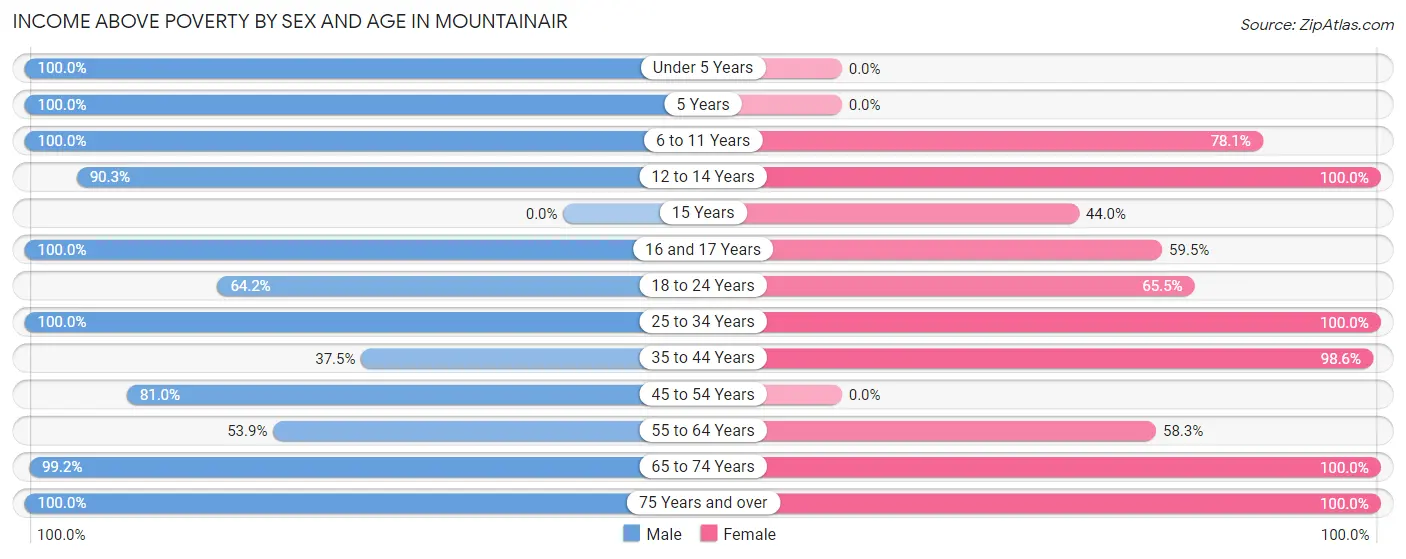
| Age Bracket | Male | Female |
| Under 5 Years | 11 (100.0%) | 0 (0.0%) |
| 5 Years | 35 (100.0%) | 0 (0.0%) |
| 6 to 11 Years | 44 (100.0%) | 25 (78.1%) |
| 12 to 14 Years | 84 (90.3%) | 11 (100.0%) |
| 15 Years | 0 (0.0%) | 11 (44.0%) |
| 16 and 17 Years | 21 (100.0%) | 22 (59.5%) |
| 18 to 24 Years | 52 (64.2%) | 36 (65.4%) |
| 25 to 34 Years | 25 (100.0%) | 22 (100.0%) |
| 35 to 44 Years | 21 (37.5%) | 69 (98.6%) |
| 45 to 54 Years | 64 (81.0%) | 0 (0.0%) |
| 55 to 64 Years | 14 (53.8%) | 14 (58.3%) |
| 65 to 74 Years | 121 (99.2%) | 73 (100.0%) |
| 75 Years and over | 63 (100.0%) | 32 (100.0%) |
| Total | 555 (84.6%) | 315 (79.5%) |
Income Below Poverty Among Married-Couple Families in Mountainair
The poverty statistics for married-couple families in Mountainair show that 16.1% or 25 of the total 155 families live below the poverty line. Families with 1 or 2 children have the highest poverty rate of 28.3%, comprising of 15 families. On the other hand, families with 3 or 4 children have the lowest poverty rate of 0.0%, which includes 0 families.
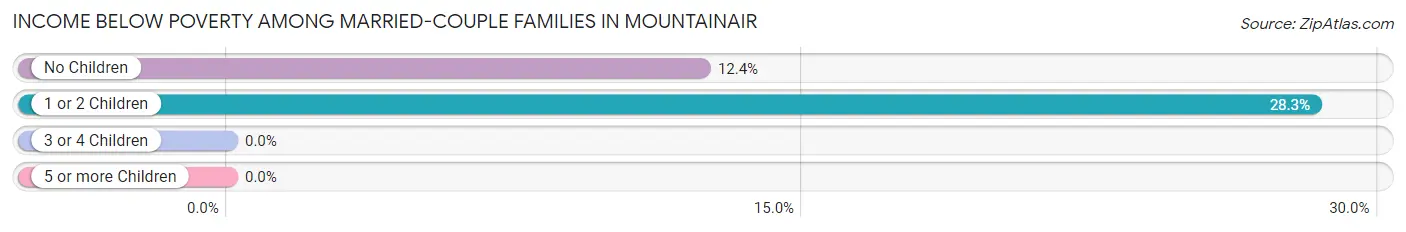
| Children | Above Poverty | Below Poverty |
| No Children | 71 (87.6%) | 10 (12.3%) |
| 1 or 2 Children | 38 (71.7%) | 15 (28.3%) |
| 3 or 4 Children | 21 (100.0%) | 0 (0.0%) |
| 5 or more Children | 0 (0.0%) | 0 (0.0%) |
| Total | 130 (83.9%) | 25 (16.1%) |
Income Below Poverty Among Single-Parent Households in Mountainair
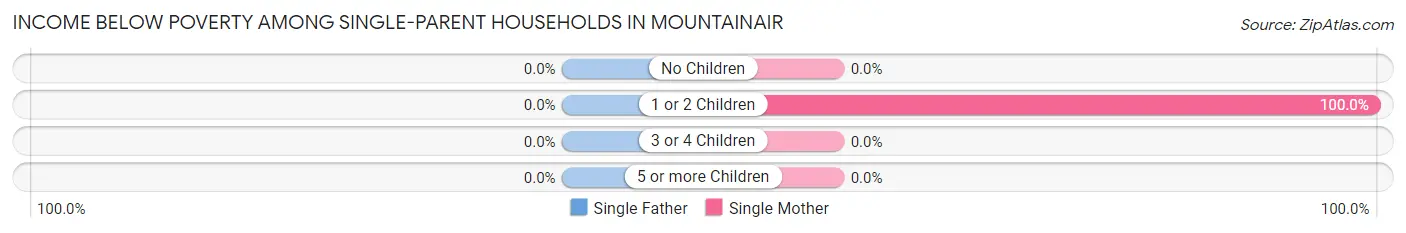
| Children | Single Father | Single Mother |
| No Children | 0 (0.0%) | 0 (0.0%) |
| 1 or 2 Children | 0 (0.0%) | 1 (100.0%) |
| 3 or 4 Children | 0 (0.0%) | 0 (0.0%) |
| 5 or more Children | 0 (0.0%) | 0 (0.0%) |
| Total | 0 (0.0%) | 1 (4.3%) |
Income Below Poverty Among Married-Couple vs Single-Parent Households in Mountainair
The poverty data for Mountainair shows that 25 of the married-couple family households (16.1%) and 1 of the single-parent households (3.5%) are living below the poverty level. Within the married-couple family households, those with 1 or 2 children have the highest poverty rate, with 15 households (28.3%) falling below the poverty line. Among the single-parent households, those with 1 or 2 children have the highest poverty rate, with 1 household (100.0%) living below poverty.
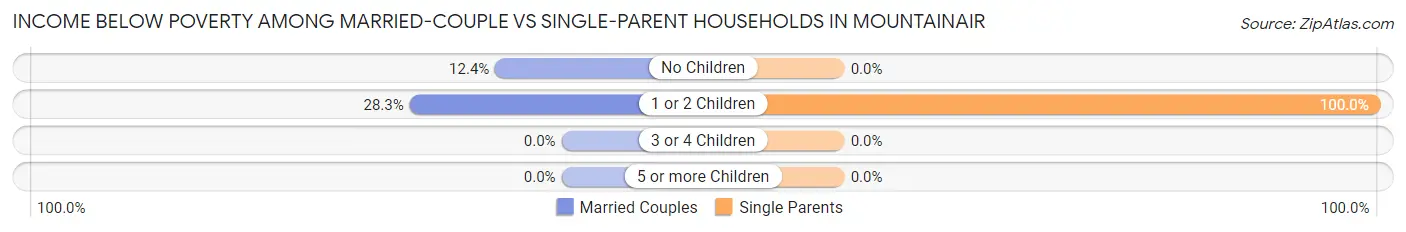
| Children | Married-Couple Families | Single-Parent Households |
| No Children | 10 (12.3%) | 0 (0.0%) |
| 1 or 2 Children | 15 (28.3%) | 1 (100.0%) |
| 3 or 4 Children | 0 (0.0%) | 0 (0.0%) |
| 5 or more Children | 0 (0.0%) | 0 (0.0%) |
| Total | 25 (16.1%) | 1 (3.5%) |
Race in Mountainair
The most populous races in Mountainair are White / Caucasian (532 | 49.7%), Hispanic or Latino (524 | 48.9%), and Two or more Races (222 | 20.7%).
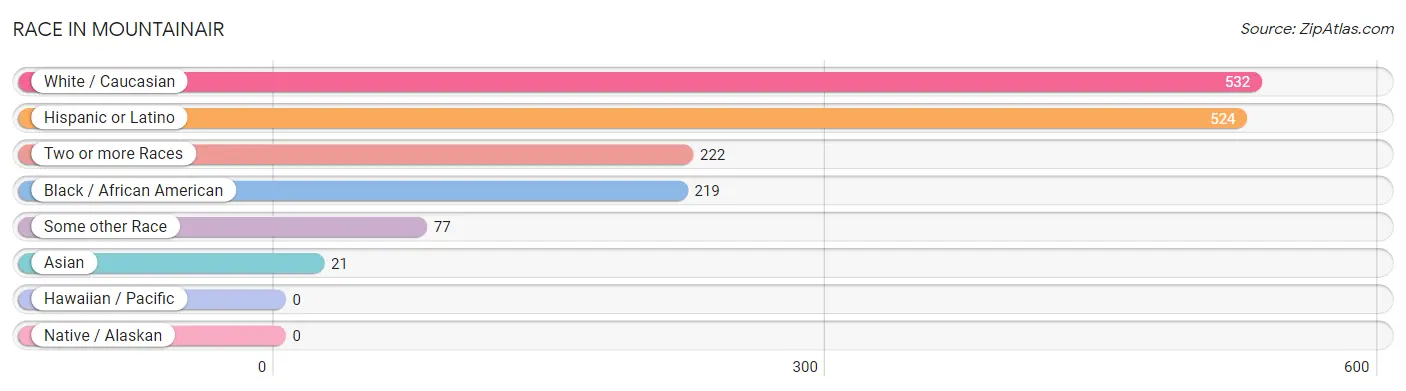
| Race | # Population | % Population |
| Asian | 21 | 2.0% |
| Black / African American | 219 | 20.4% |
| Hawaiian / Pacific | 0 | 0.0% |
| Hispanic or Latino | 524 | 48.9% |
| Native / Alaskan | 0 | 0.0% |
| White / Caucasian | 532 | 49.7% |
| Two or more Races | 222 | 20.7% |
| Some other Race | 77 | 7.2% |
| Total | 1,071 | 100.0% |
Ancestry in Mountainair
The most populous ancestries reported in Mountainair are Mexican (118 | 11.0%), Spanish (107 | 10.0%), German (103 | 9.6%), English (78 | 7.3%), and American (45 | 4.2%), together accounting for 42.1% of all Mountainair residents.
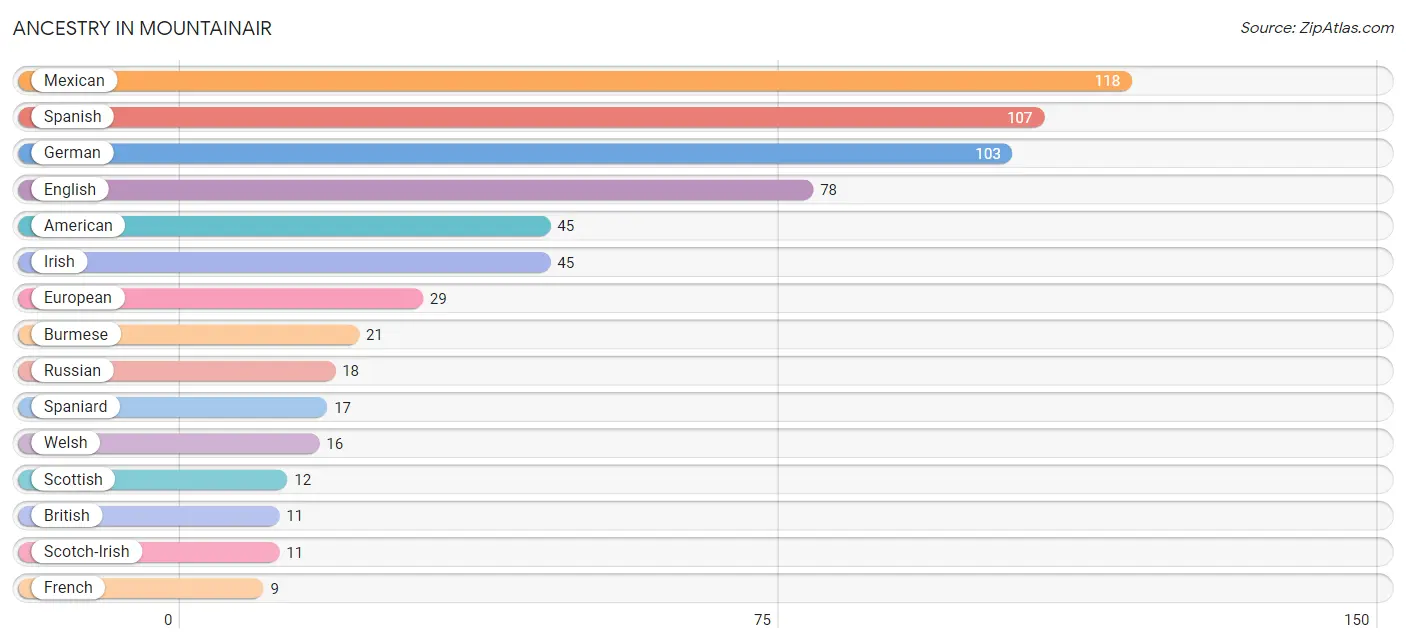
| Ancestry | # Population | % Population |
| American | 45 | 4.2% |
| British | 11 | 1.0% |
| Burmese | 21 | 2.0% |
| English | 78 | 7.3% |
| European | 29 | 2.7% |
| French | 9 | 0.8% |
| German | 103 | 9.6% |
| Irish | 45 | 4.2% |
| Italian | 5 | 0.5% |
| Mexican | 118 | 11.0% |
| Polish | 9 | 0.8% |
| Russian | 18 | 1.7% |
| Scotch-Irish | 11 | 1.0% |
| Scottish | 12 | 1.1% |
| Spaniard | 17 | 1.6% |
| Spanish | 107 | 10.0% |
| Welsh | 16 | 1.5% | View All 17 Rows |
Immigrants in Mountainair
The most numerous immigrant groups reported in Mountainair came from Central America (78 | 7.3%), Latin America (78 | 7.3%), Mexico (78 | 7.3%), Asia (21 | 2.0%), and Eastern Asia (21 | 2.0%), together accounting for 25.8% of all Mountainair residents.
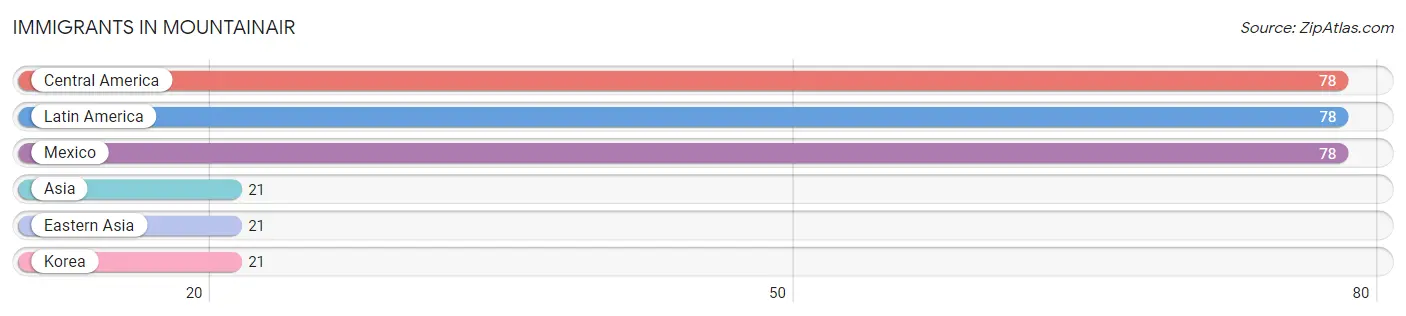
| Immigration Origin | # Population | % Population |
| Asia | 21 | 2.0% |
| Central America | 78 | 7.3% |
| Eastern Asia | 21 | 2.0% |
| Korea | 21 | 2.0% |
| Latin America | 78 | 7.3% |
| Mexico | 78 | 7.3% | View All 6 Rows |
Sex and Age in Mountainair
Sex and Age in Mountainair
The most populous age groups in Mountainair are 10 to 14 Years (101 | 15.4%) for men and 15 to 19 Years (84 | 20.2%) for women.
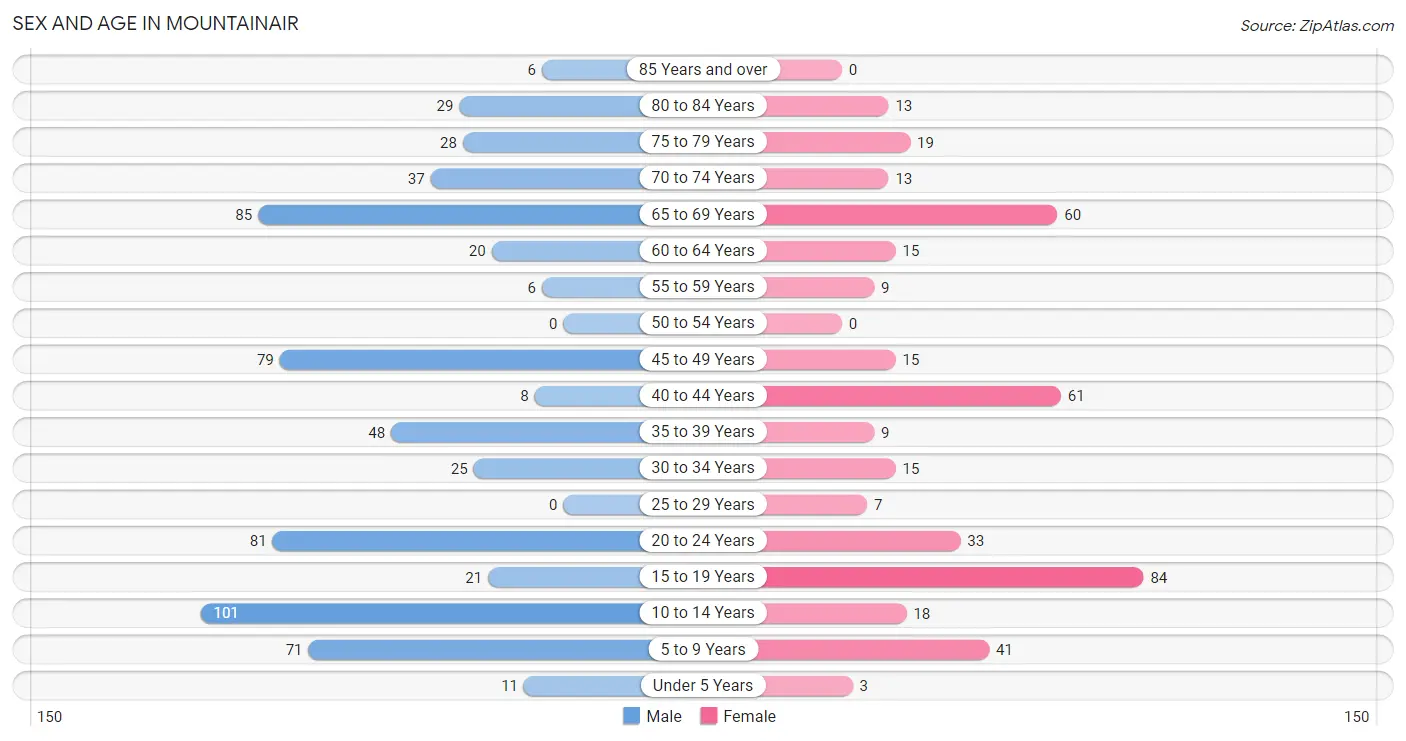
| Age Bracket | Male | Female |
| Under 5 Years | 11 (1.7%) | 3 (0.7%) |
| 5 to 9 Years | 71 (10.8%) | 41 (9.9%) |
| 10 to 14 Years | 101 (15.4%) | 18 (4.3%) |
| 15 to 19 Years | 21 (3.2%) | 84 (20.2%) |
| 20 to 24 Years | 81 (12.3%) | 33 (8.0%) |
| 25 to 29 Years | 0 (0.0%) | 7 (1.7%) |
| 30 to 34 Years | 25 (3.8%) | 15 (3.6%) |
| 35 to 39 Years | 48 (7.3%) | 9 (2.2%) |
| 40 to 44 Years | 8 (1.2%) | 61 (14.7%) |
| 45 to 49 Years | 79 (12.0%) | 15 (3.6%) |
| 50 to 54 Years | 0 (0.0%) | 0 (0.0%) |
| 55 to 59 Years | 6 (0.9%) | 9 (2.2%) |
| 60 to 64 Years | 20 (3.0%) | 15 (3.6%) |
| 65 to 69 Years | 85 (13.0%) | 60 (14.5%) |
| 70 to 74 Years | 37 (5.6%) | 13 (3.1%) |
| 75 to 79 Years | 28 (4.3%) | 19 (4.6%) |
| 80 to 84 Years | 29 (4.4%) | 13 (3.1%) |
| 85 Years and over | 6 (0.9%) | 0 (0.0%) |
| Total | 656 (100.0%) | 415 (100.0%) |
Families and Households in Mountainair
Median Family Size in Mountainair
The median family size in Mountainair is 4.36 persons per family, with single female/mother families (23 | 12.5%) accounting for the largest median family size of 9.52 persons per family. On the other hand, married-couple families (155 | 84.2%) represent the smallest median family size with 3.61 persons per family.
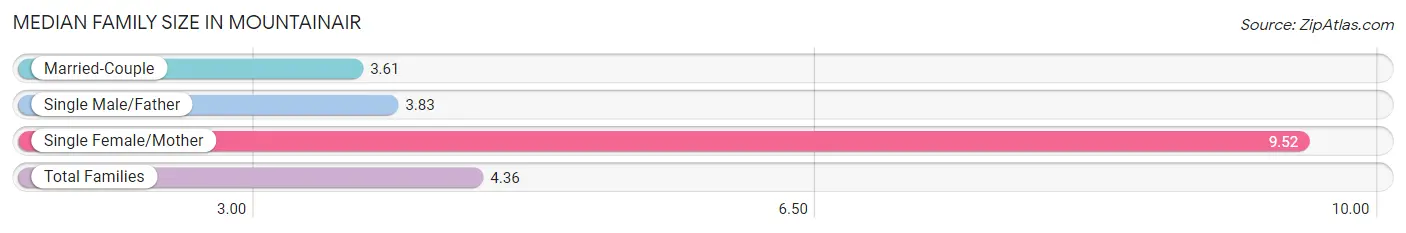
| Family Type | # Families | Family Size |
| Married-Couple | 155 (84.2%) | 3.61 |
| Single Male/Father | 6 (3.3%) | 3.83 |
| Single Female/Mother | 23 (12.5%) | 9.52 |
| Total Families | 184 (100.0%) | 4.36 |
Median Household Size in Mountainair
The median household size in Mountainair is 3.23 persons per household, with single female/mother households (23 | 6.9%) accounting for the largest median household size of 11.87 persons per household. non-family households (148 | 44.6%) represent the smallest median household size with 1.35 persons per household.
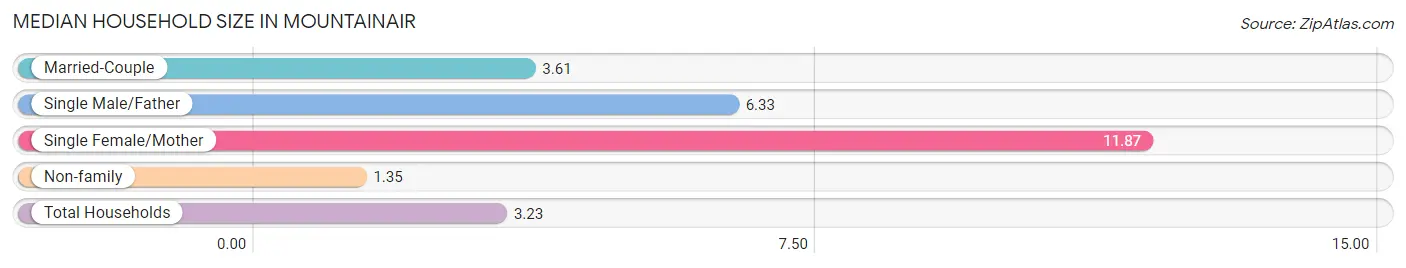
| Household Type | # Households | Household Size |
| Married-Couple | 155 (46.7%) | 3.61 |
| Single Male/Father | 6 (1.8%) | 6.33 |
| Single Female/Mother | 23 (6.9%) | 11.87 |
| Non-family | 148 (44.6%) | 1.35 |
| Total Households | 332 (100.0%) | 3.23 |
Household Size by Marriage Status in Mountainair
Out of a total of 332 households in Mountainair, 184 (55.4%) are family households, while 148 (44.6%) are nonfamily households. The most numerous type of family households are 2-person households, comprising 81, and the most common type of nonfamily households are 1-person households, comprising 119.
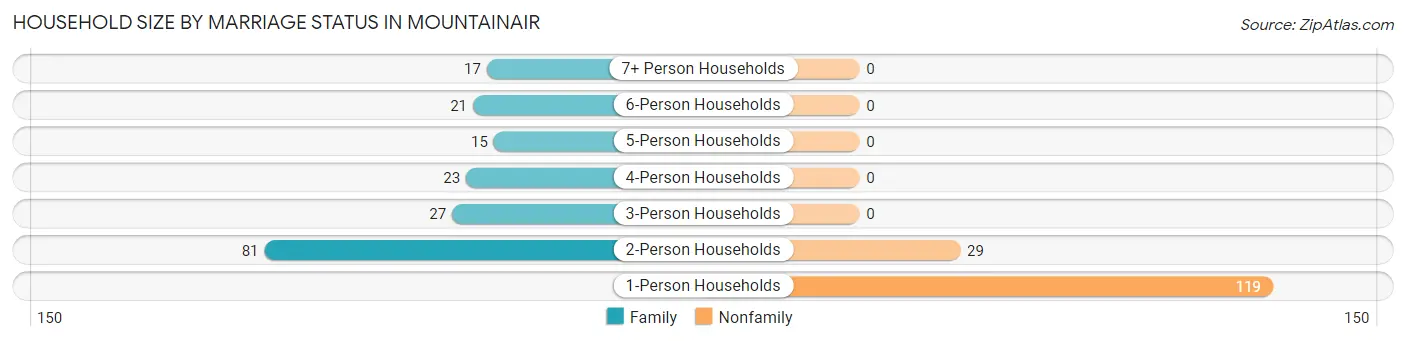
| Household Size | Family Households | Nonfamily Households |
| 1-Person Households | - | 119 (35.8%) |
| 2-Person Households | 81 (24.4%) | 29 (8.7%) |
| 3-Person Households | 27 (8.1%) | 0 (0.0%) |
| 4-Person Households | 23 (6.9%) | 0 (0.0%) |
| 5-Person Households | 15 (4.5%) | 0 (0.0%) |
| 6-Person Households | 21 (6.3%) | 0 (0.0%) |
| 7+ Person Households | 17 (5.1%) | 0 (0.0%) |
| Total | 184 (55.4%) | 148 (44.6%) |
Female Fertility in Mountainair
Fertility by Age in Mountainair
| Age Bracket | Women with Births | Births / 1,000 Women |
| 15 to 19 years | 0 (0.0%) | 0.0 |
| 20 to 34 years | 0 (0.0%) | 0.0 |
| 35 to 50 years | 0 (0.0%) | 0.0 |
| Total | 0 (0.0%) | 0.0 |
Fertility by Age by Marriage Status in Mountainair
| Age Bracket | Married | Unmarried |
| 15 to 19 years | 0 (0.0%) | 0 (0.0%) |
| 20 to 34 years | 0 (0.0%) | 0 (0.0%) |
| 35 to 50 years | 0 (0.0%) | 0 (0.0%) |
| Total | 0 (0.0%) | 0 (0.0%) |
Fertility by Education in Mountainair
| Educational Attainment | Women with Births | Births / 1,000 Women |
| Less than High School | 0 (0.0%) | 0.0 |
| High School Diploma | 0 (0.0%) | 0.0 |
| College or Associate's Degree | 0 (0.0%) | 0.0 |
| Bachelor's Degree | 0 (0.0%) | 0.0 |
| Graduate Degree | 0 (0.0%) | 0.0 |
| Total | 0 (0.0%) | 0.0 |
Fertility by Education by Marriage Status in Mountainair
| Educational Attainment | Married | Unmarried |
| Less than High School | 0 (0.0%) | 0 (0.0%) |
| High School Diploma | 0 (0.0%) | 0 (0.0%) |
| College or Associate's Degree | 0 (0.0%) | 0 (0.0%) |
| Bachelor's Degree | 0 (0.0%) | 0 (0.0%) |
| Graduate Degree | 0 (0.0%) | 0 (0.0%) |
| Total | 0 (0.0%) | 0 (0.0%) |
Employment Characteristics in Mountainair
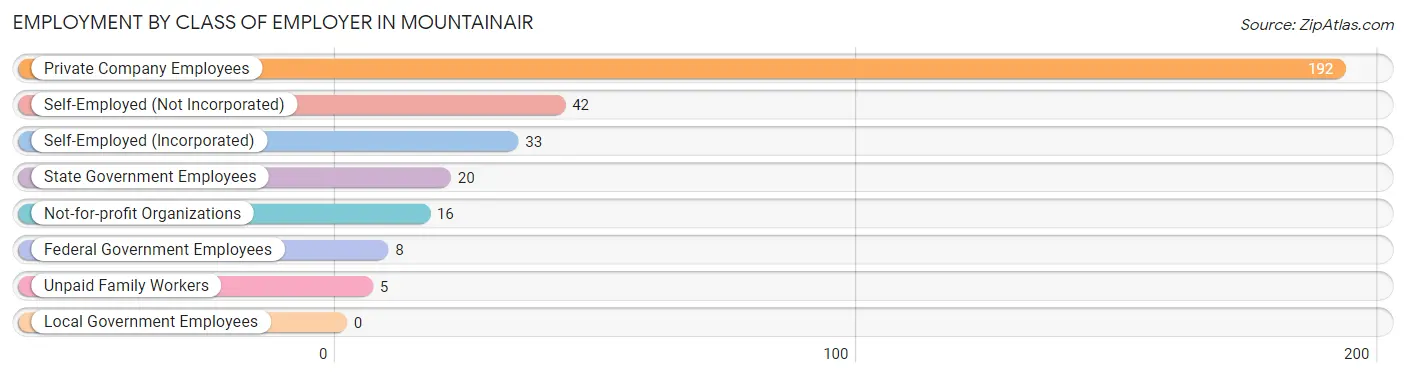
Employment by Class of Employer in Mountainair
Among the 316 employed individuals in Mountainair, private company employees (192 | 60.8%), self-employed (not incorporated) (42 | 13.3%), and self-employed (incorporated) (33 | 10.4%) make up the most common classes of employment.
| Employer Class | # Employees | % Employees |
| Private Company Employees | 192 | 60.8% |
| Self-Employed (Incorporated) | 33 | 10.4% |
| Self-Employed (Not Incorporated) | 42 | 13.3% |
| Not-for-profit Organizations | 16 | 5.1% |
| Local Government Employees | 0 | 0.0% |
| State Government Employees | 20 | 6.3% |
| Federal Government Employees | 8 | 2.5% |
| Unpaid Family Workers | 5 | 1.6% |
| Total | 316 | 100.0% |
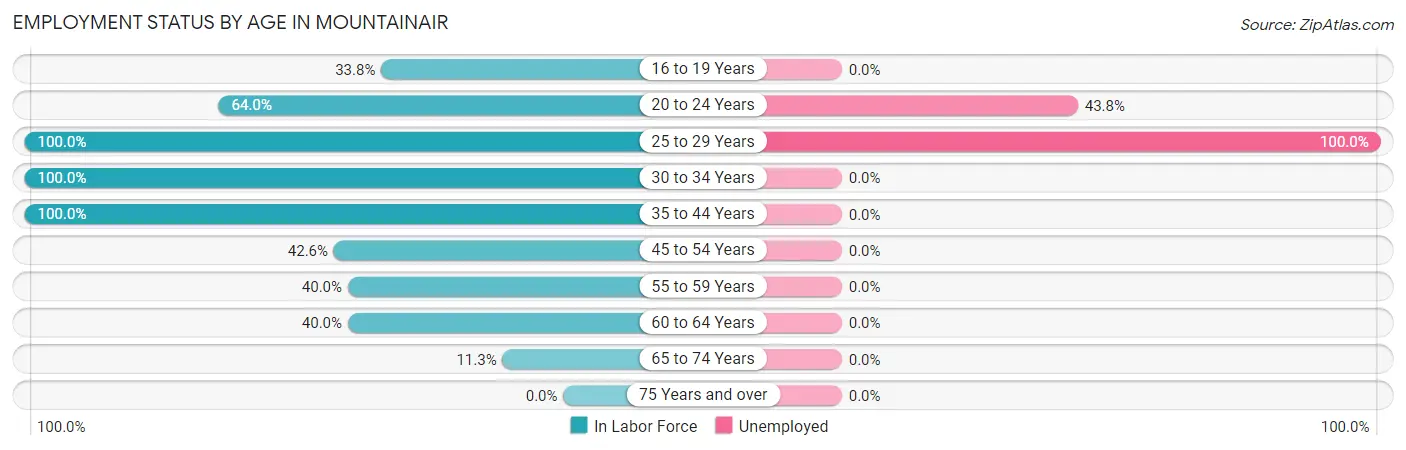
Employment Status by Age in Mountainair
According to the labor force statistics for Mountainair, out of the total population over 16 years of age (801), 44.3% or 355 individuals are in the labor force, with 11.0% or 39 of them unemployed. The age group with the highest labor force participation rate is 25 to 29 years, with 100.0% or 7 individuals in the labor force. Within the labor force, the 25 to 29 years age range has the highest percentage of unemployed individuals, with 100.0% or 7 of them being unemployed.
| Age Bracket | In Labor Force | Unemployed |
| 16 to 19 Years | 27 (33.8%) | 0 (0.0%) |
| 20 to 24 Years | 73 (64.0%) | 32 (43.8%) |
| 25 to 29 Years | 7 (100.0%) | 7 (100.0%) |
| 30 to 34 Years | 40 (100.0%) | 0 (0.0%) |
| 35 to 44 Years | 126 (100.0%) | 0 (0.0%) |
| 45 to 54 Years | 40 (42.6%) | 0 (0.0%) |
| 55 to 59 Years | 6 (40.0%) | 0 (0.0%) |
| 60 to 64 Years | 14 (40.0%) | 0 (0.0%) |
| 65 to 74 Years | 22 (11.3%) | 0 (0.0%) |
| 75 Years and over | 0 (0.0%) | 0 (0.0%) |
| Total | 355 (44.3%) | 39 (11.0%) |
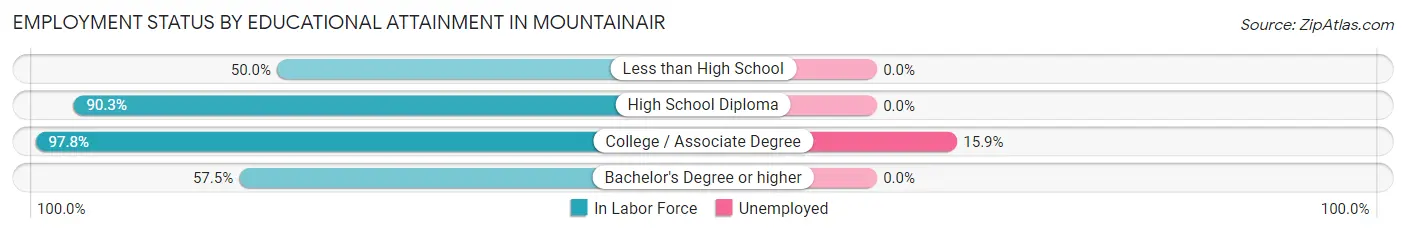
Employment Status by Educational Attainment in Mountainair
According to labor force statistics for Mountainair, 73.5% of individuals (233) out of the total population between 25 and 64 years of age (317) are in the labor force, with 3.0% or 7 of them being unemployed. The group with the highest labor force participation rate are those with the educational attainment of college / associate degree, with 97.8% or 44 individuals in the labor force. Within the labor force, individuals with college / associate degree education have the highest percentage of unemployment, with 15.9% or 7 of them being unemployed.
| Educational Attainment | In Labor Force | Unemployed |
| Less than High School | 54 (50.0%) | 0 (0.0%) |
| High School Diploma | 112 (90.3%) | 0 (0.0%) |
| College / Associate Degree | 44 (97.8%) | 7 (15.9%) |
| Bachelor's Degree or higher | 23 (57.5%) | 0 (0.0%) |
| Total | 233 (73.5%) | 10 (3.0%) |
Employment Occupations by Sex in Mountainair
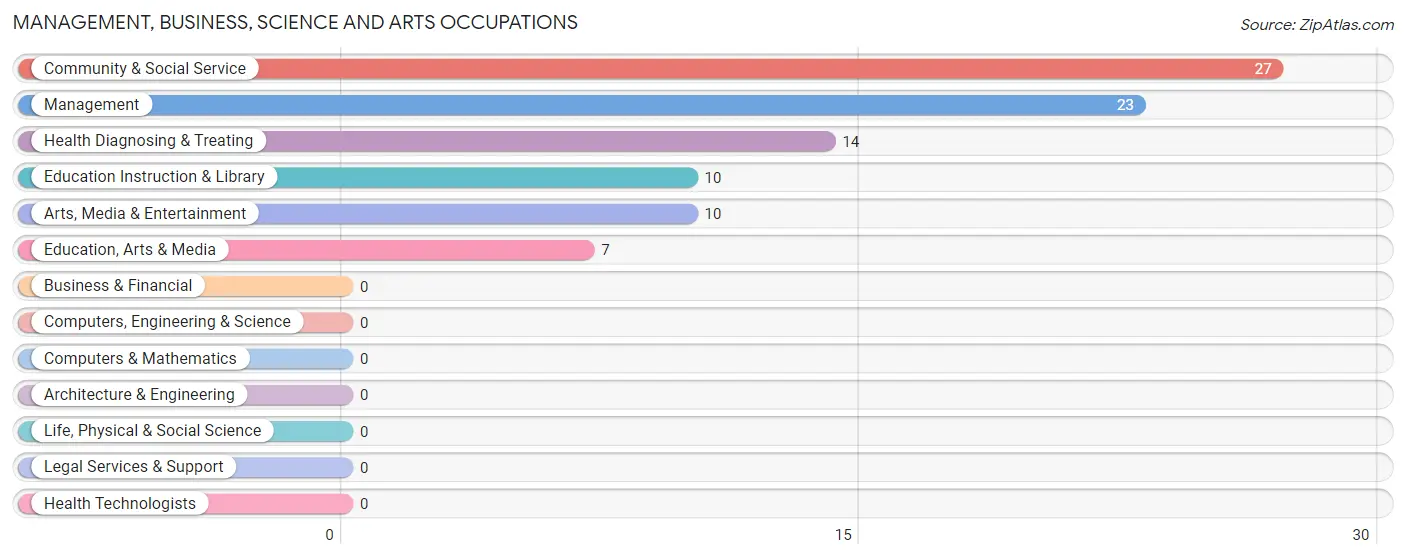
Management, Business, Science and Arts Occupations
The most common Management, Business, Science and Arts occupations in Mountainair are Community & Social Service (27 | 8.5%), Management (23 | 7.3%), Health Diagnosing & Treating (14 | 4.4%), Education Instruction & Library (10 | 3.2%), and Arts, Media & Entertainment (10 | 3.2%).
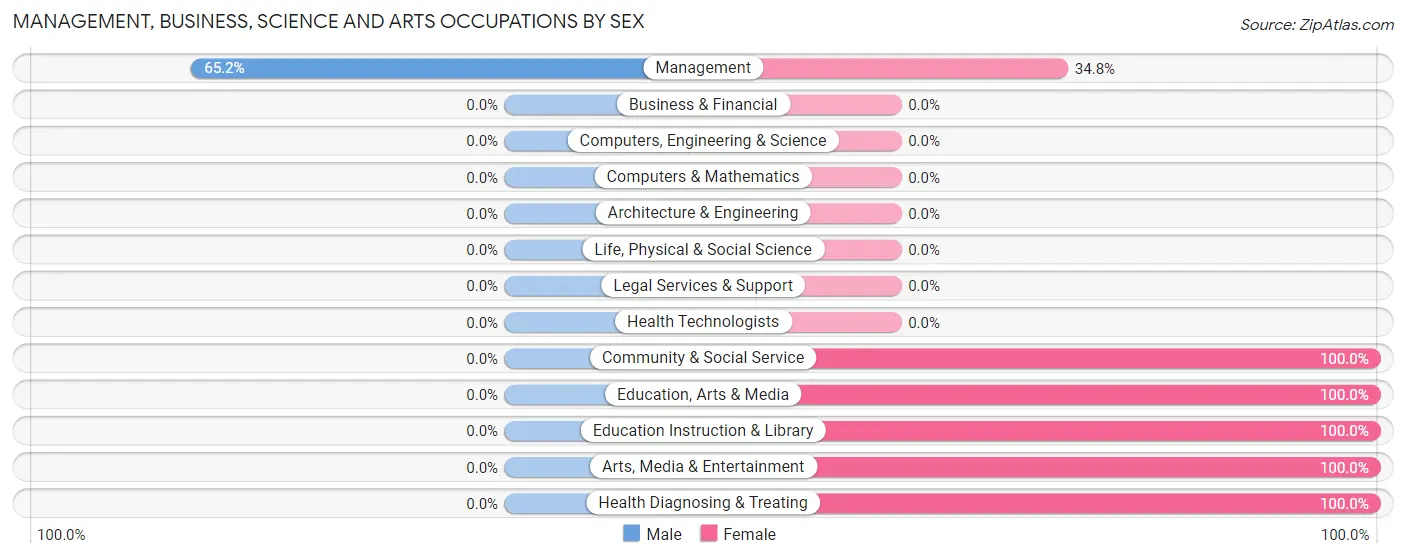
Management, Business, Science and Arts Occupations by Sex
| Occupation | Male | Female |
| Management | 15 (65.2%) | 8 (34.8%) |
| Business & Financial | 0 (0.0%) | 0 (0.0%) |
| Computers, Engineering & Science | 0 (0.0%) | 0 (0.0%) |
| Computers & Mathematics | 0 (0.0%) | 0 (0.0%) |
| Architecture & Engineering | 0 (0.0%) | 0 (0.0%) |
| Life, Physical & Social Science | 0 (0.0%) | 0 (0.0%) |
| Community & Social Service | 0 (0.0%) | 27 (100.0%) |
| Education, Arts & Media | 0 (0.0%) | 7 (100.0%) |
| Legal Services & Support | 0 (0.0%) | 0 (0.0%) |
| Education Instruction & Library | 0 (0.0%) | 10 (100.0%) |
| Arts, Media & Entertainment | 0 (0.0%) | 10 (100.0%) |
| Health Diagnosing & Treating | 0 (0.0%) | 14 (100.0%) |
| Health Technologists | 0 (0.0%) | 0 (0.0%) |
| Total (Category) | 15 (23.4%) | 49 (76.6%) |
| Total (Overall) | 177 (56.0%) | 139 (44.0%) |
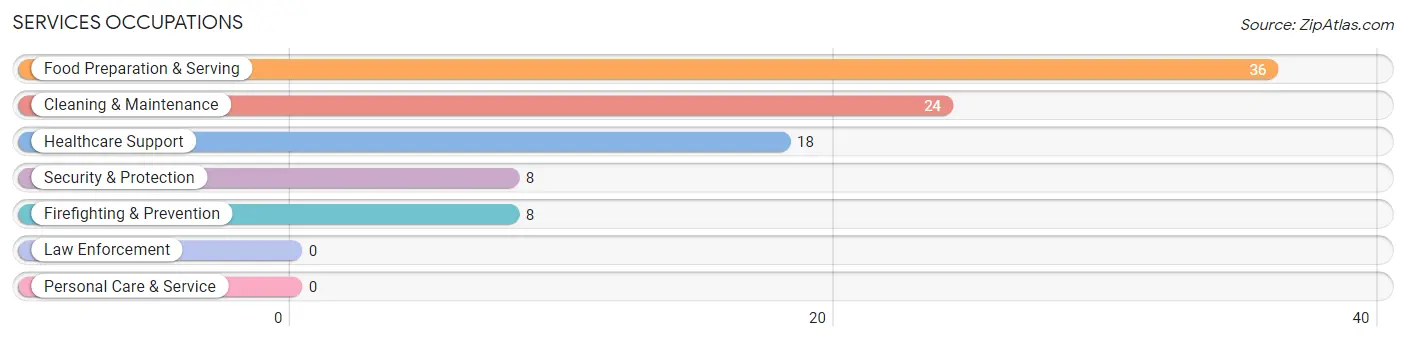
Services Occupations
The most common Services occupations in Mountainair are Food Preparation & Serving (36 | 11.4%), Cleaning & Maintenance (24 | 7.6%), Healthcare Support (18 | 5.7%), Security & Protection (8 | 2.5%), and Firefighting & Prevention (8 | 2.5%).
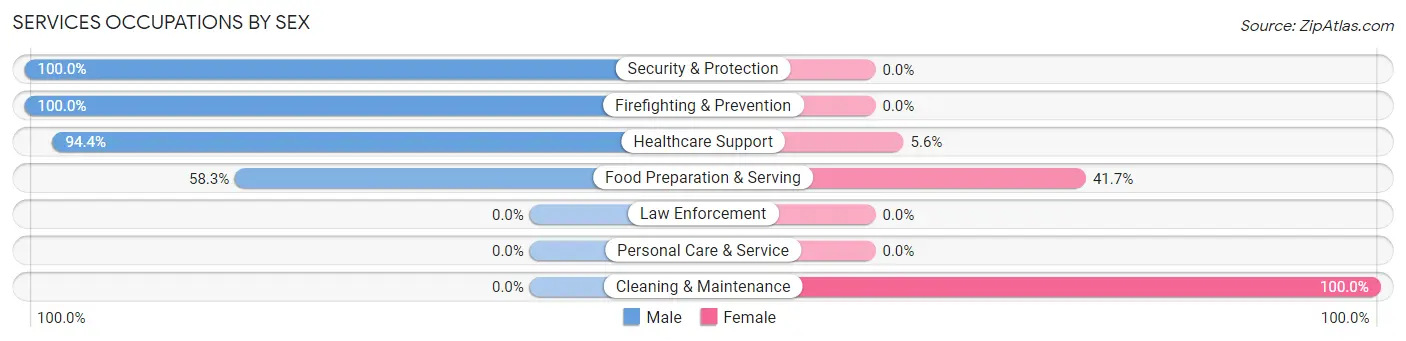
Services Occupations by Sex
Within the Services occupations in Mountainair, the most male-oriented occupations are Security & Protection (100.0%), Firefighting & Prevention (100.0%), and Healthcare Support (94.4%), while the most female-oriented occupations are Cleaning & Maintenance (100.0%), Food Preparation & Serving (41.7%), and Healthcare Support (5.6%).
| Occupation | Male | Female |
| Healthcare Support | 17 (94.4%) | 1 (5.6%) |
| Security & Protection | 8 (100.0%) | 0 (0.0%) |
| Firefighting & Prevention | 8 (100.0%) | 0 (0.0%) |
| Law Enforcement | 0 (0.0%) | 0 (0.0%) |
| Food Preparation & Serving | 21 (58.3%) | 15 (41.7%) |
| Cleaning & Maintenance | 0 (0.0%) | 24 (100.0%) |
| Personal Care & Service | 0 (0.0%) | 0 (0.0%) |
| Total (Category) | 46 (53.5%) | 40 (46.5%) |
| Total (Overall) | 177 (56.0%) | 139 (44.0%) |
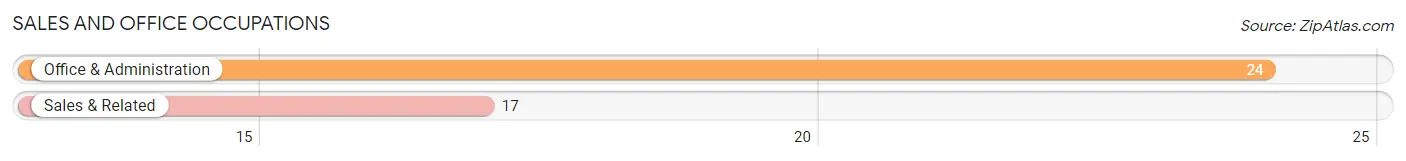
Sales and Office Occupations
The most common Sales and Office occupations in Mountainair are Office & Administration (24 | 7.6%), and Sales & Related (17 | 5.4%).
Sales and Office Occupations by Sex
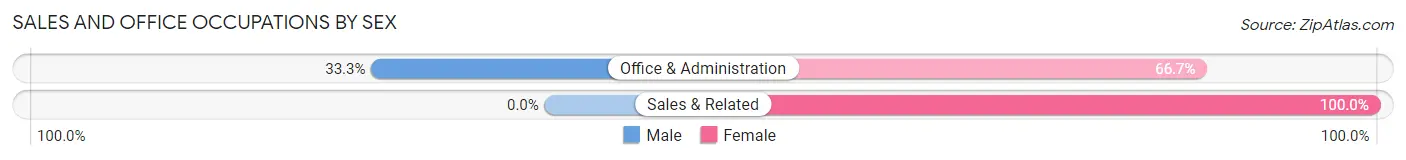
| Occupation | Male | Female |
| Sales & Related | 0 (0.0%) | 17 (100.0%) |
| Office & Administration | 8 (33.3%) | 16 (66.7%) |
| Total (Category) | 8 (19.5%) | 33 (80.5%) |
| Total (Overall) | 177 (56.0%) | 139 (44.0%) |
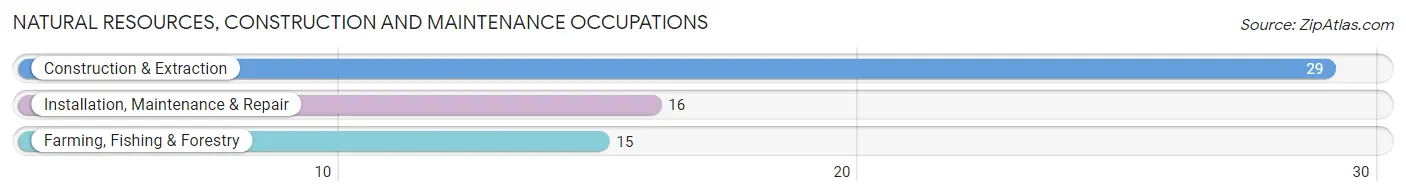
Natural Resources, Construction and Maintenance Occupations
The most common Natural Resources, Construction and Maintenance occupations in Mountainair are Construction & Extraction (29 | 9.2%), Installation, Maintenance & Repair (16 | 5.1%), and Farming, Fishing & Forestry (15 | 4.8%).
Natural Resources, Construction and Maintenance Occupations by Sex
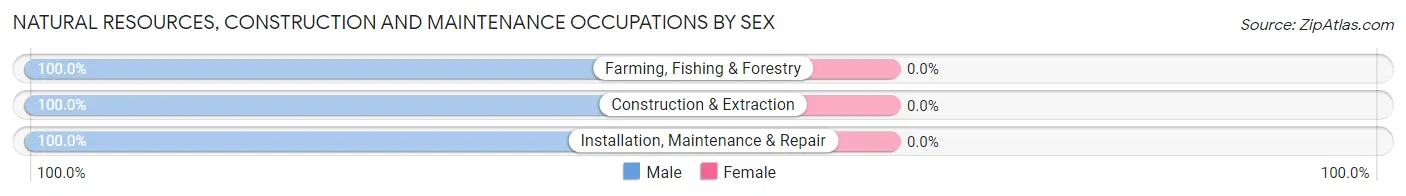
| Occupation | Male | Female |
| Farming, Fishing & Forestry | 15 (100.0%) | 0 (0.0%) |
| Construction & Extraction | 29 (100.0%) | 0 (0.0%) |
| Installation, Maintenance & Repair | 16 (100.0%) | 0 (0.0%) |
| Total (Category) | 60 (100.0%) | 0 (0.0%) |
| Total (Overall) | 177 (56.0%) | 139 (44.0%) |
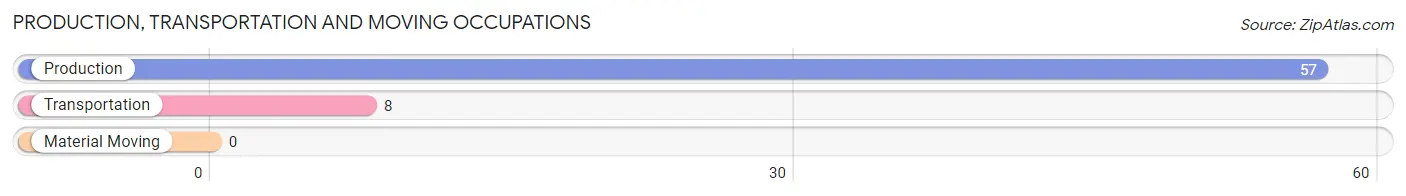
Production, Transportation and Moving Occupations
The most common Production, Transportation and Moving occupations in Mountainair are Production (57 | 18.0%), and Transportation (8 | 2.5%).
Production, Transportation and Moving Occupations by Sex
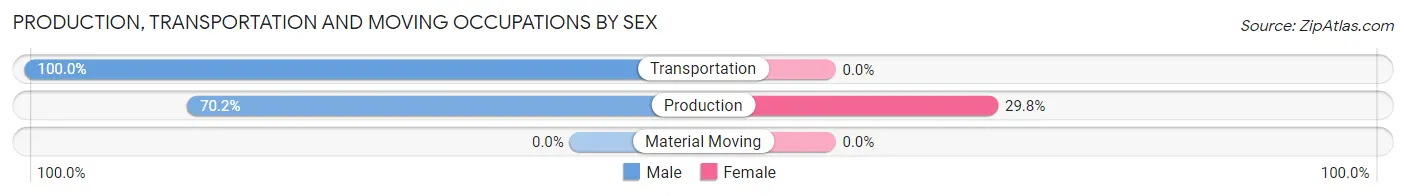
| Occupation | Male | Female |
| Production | 40 (70.2%) | 17 (29.8%) |
| Transportation | 8 (100.0%) | 0 (0.0%) |
| Material Moving | 0 (0.0%) | 0 (0.0%) |
| Total (Category) | 48 (73.9%) | 17 (26.2%) |
| Total (Overall) | 177 (56.0%) | 139 (44.0%) |
Employment Industries by Sex in Mountainair
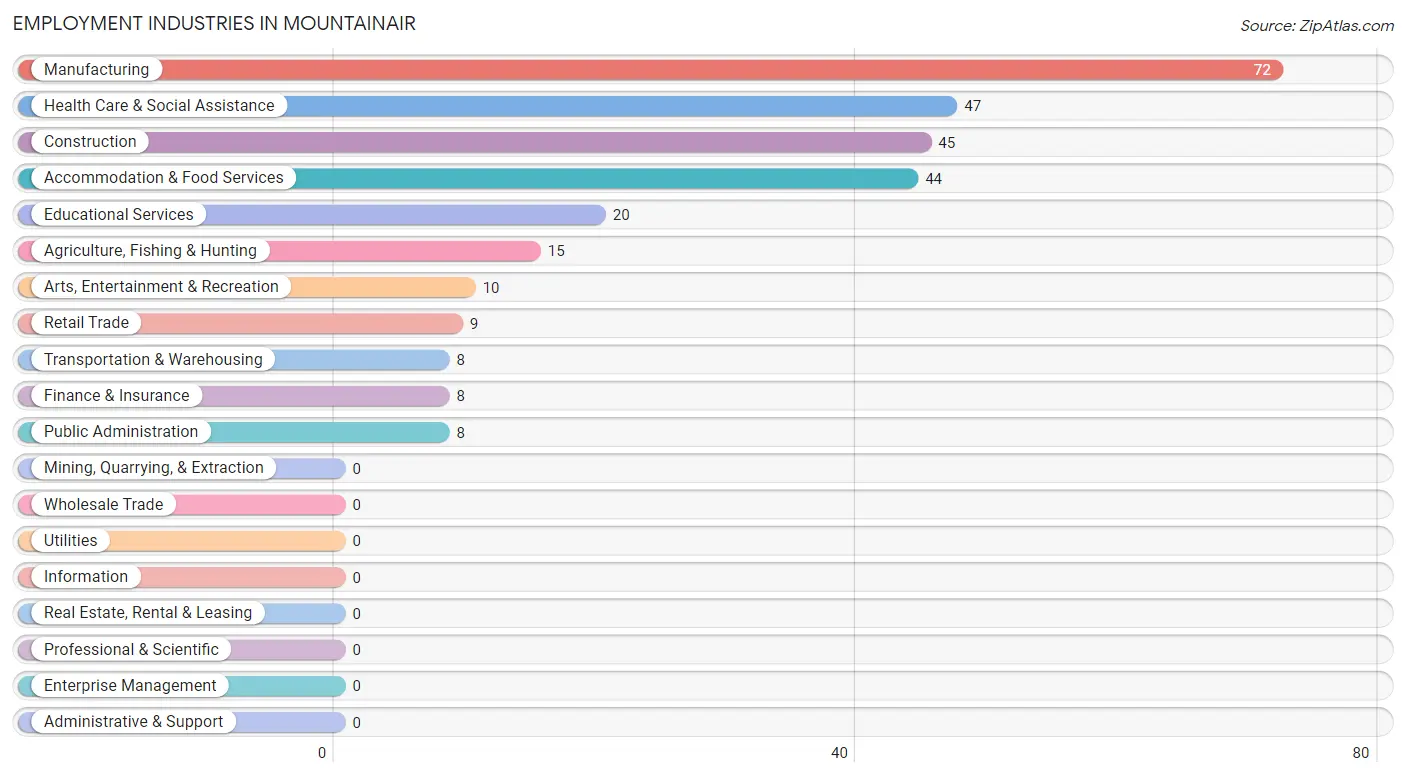
Employment Industries in Mountainair
The major employment industries in Mountainair include Manufacturing (72 | 22.8%), Health Care & Social Assistance (47 | 14.9%), Construction (45 | 14.2%), Accommodation & Food Services (44 | 13.9%), and Educational Services (20 | 6.3%).
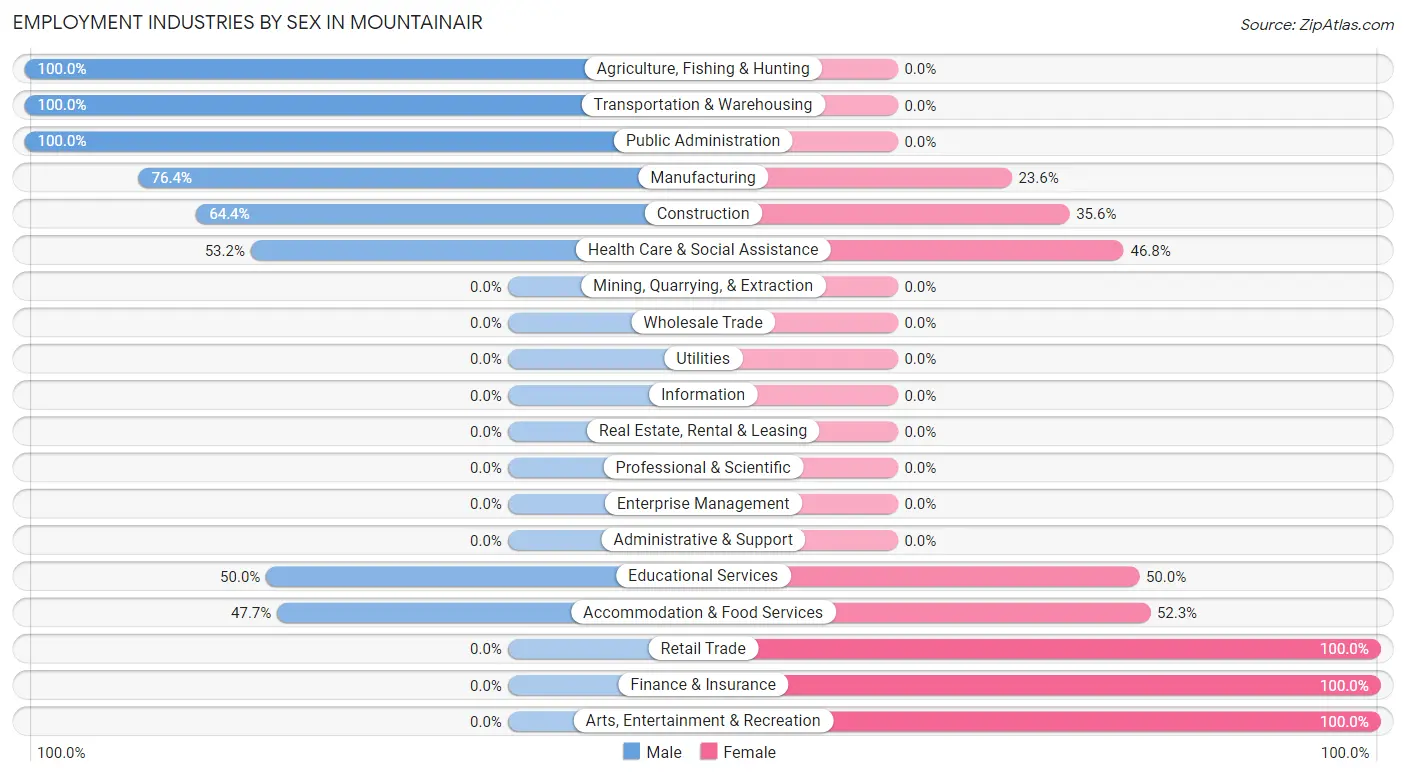
Employment Industries by Sex in Mountainair
The Mountainair industries that see more men than women are Agriculture, Fishing & Hunting (100.0%), Transportation & Warehousing (100.0%), and Public Administration (100.0%), whereas the industries that tend to have a higher number of women are Retail Trade (100.0%), Finance & Insurance (100.0%), and Arts, Entertainment & Recreation (100.0%).
| Industry | Male | Female |
| Agriculture, Fishing & Hunting | 15 (100.0%) | 0 (0.0%) |
| Mining, Quarrying, & Extraction | 0 (0.0%) | 0 (0.0%) |
| Construction | 29 (64.4%) | 16 (35.6%) |
| Manufacturing | 55 (76.4%) | 17 (23.6%) |
| Wholesale Trade | 0 (0.0%) | 0 (0.0%) |
| Retail Trade | 0 (0.0%) | 9 (100.0%) |
| Transportation & Warehousing | 8 (100.0%) | 0 (0.0%) |
| Utilities | 0 (0.0%) | 0 (0.0%) |
| Information | 0 (0.0%) | 0 (0.0%) |
| Finance & Insurance | 0 (0.0%) | 8 (100.0%) |
| Real Estate, Rental & Leasing | 0 (0.0%) | 0 (0.0%) |
| Professional & Scientific | 0 (0.0%) | 0 (0.0%) |
| Enterprise Management | 0 (0.0%) | 0 (0.0%) |
| Administrative & Support | 0 (0.0%) | 0 (0.0%) |
| Educational Services | 10 (50.0%) | 10 (50.0%) |
| Health Care & Social Assistance | 25 (53.2%) | 22 (46.8%) |
| Arts, Entertainment & Recreation | 0 (0.0%) | 10 (100.0%) |
| Accommodation & Food Services | 21 (47.7%) | 23 (52.3%) |
| Public Administration | 8 (100.0%) | 0 (0.0%) |
| Total | 177 (56.0%) | 139 (44.0%) |
Education in Mountainair
School Enrollment in Mountainair
The most common levels of schooling among the 325 students in Mountainair are high school (125 | 38.5%), middle school (86 | 26.5%), and college / undergraduate (37 | 11.4%).
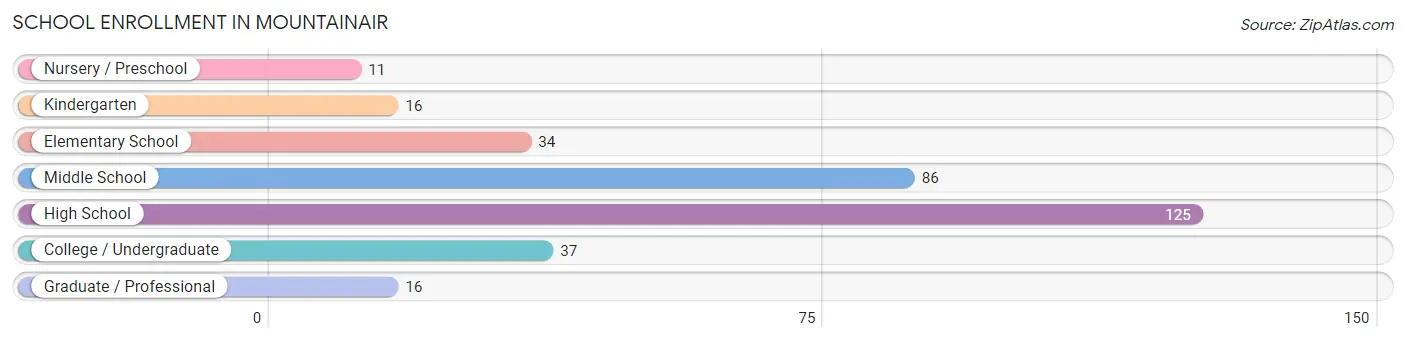
| School Level | # Students | % Students |
| Nursery / Preschool | 11 | 3.4% |
| Kindergarten | 16 | 4.9% |
| Elementary School | 34 | 10.5% |
| Middle School | 86 | 26.5% |
| High School | 125 | 38.5% |
| College / Undergraduate | 37 | 11.4% |
| Graduate / Professional | 16 | 4.9% |
| Total | 325 | 100.0% |
School Enrollment by Age by Funding Source in Mountainair
Out of a total of 325 students who are enrolled in schools in Mountainair, 17 (5.2%) attend a private institution, while the remaining 308 (94.8%) are enrolled in public schools. The age group of 20 to 24 year olds has the highest likelihood of being enrolled in private schools, with 9 (25.0% in the age bracket) enrolled. Conversely, the age group of 3 to 4 year olds has the lowest likelihood of being enrolled in a private school, with 11 (100.0% in the age bracket) attending a public institution.
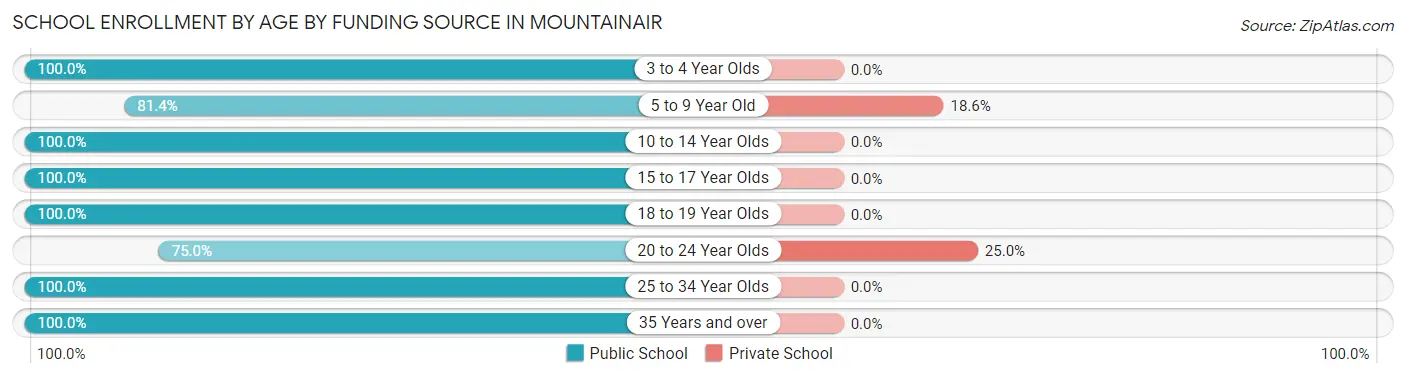
| Age Bracket | Public School | Private School |
| 3 to 4 Year Olds | 11 (100.0%) | 0 (0.0%) |
| 5 to 9 Year Old | 35 (81.4%) | 8 (18.6%) |
| 10 to 14 Year Olds | 119 (100.0%) | 0 (0.0%) |
| 15 to 17 Year Olds | 83 (100.0%) | 0 (0.0%) |
| 18 to 19 Year Olds | 16 (100.0%) | 0 (0.0%) |
| 20 to 24 Year Olds | 27 (75.0%) | 9 (25.0%) |
| 25 to 34 Year Olds | 7 (100.0%) | 0 (0.0%) |
| 35 Years and over | 10 (100.0%) | 0 (0.0%) |
| Total | 308 (94.8%) | 17 (5.2%) |
Educational Attainment by Field of Study in Mountainair
Education (26 | 25.2%), visual & performing arts (21 | 20.4%), literature & languages (11 | 10.7%), multidisciplinary studies (10 | 9.7%), and bio, nature & agricultural (8 | 7.8%) are the most common fields of study among 103 individuals in Mountainair who have obtained a bachelor's degree or higher.
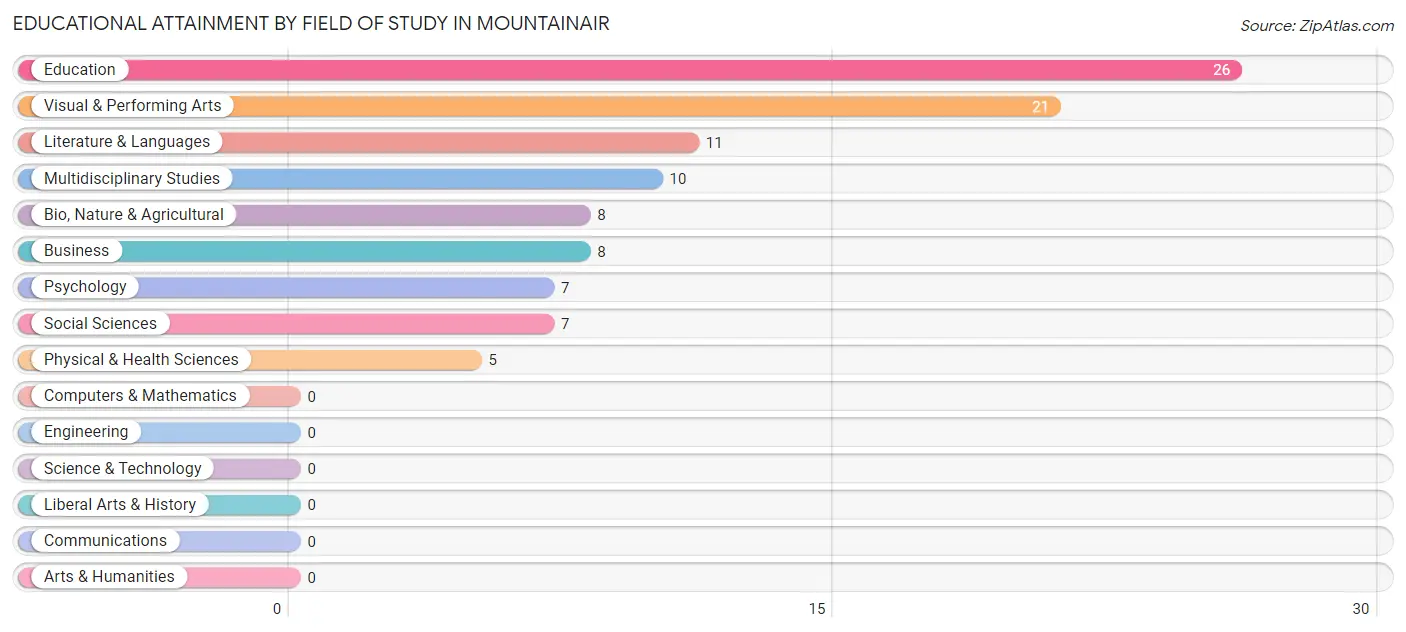
| Field of Study | # Graduates | % Graduates |
| Computers & Mathematics | 0 | 0.0% |
| Bio, Nature & Agricultural | 8 | 7.8% |
| Physical & Health Sciences | 5 | 4.9% |
| Psychology | 7 | 6.8% |
| Social Sciences | 7 | 6.8% |
| Engineering | 0 | 0.0% |
| Multidisciplinary Studies | 10 | 9.7% |
| Science & Technology | 0 | 0.0% |
| Business | 8 | 7.8% |
| Education | 26 | 25.2% |
| Literature & Languages | 11 | 10.7% |
| Liberal Arts & History | 0 | 0.0% |
| Visual & Performing Arts | 21 | 20.4% |
| Communications | 0 | 0.0% |
| Arts & Humanities | 0 | 0.0% |
| Total | 103 | 100.0% |
Transportation & Commute in Mountainair
Vehicle Availability by Sex in Mountainair
The most prevalent vehicle ownership categories in Mountainair are males with 4 vehicles (54, accounting for 30.5%) and females with 4 vehicles (45, making up 38.9%).
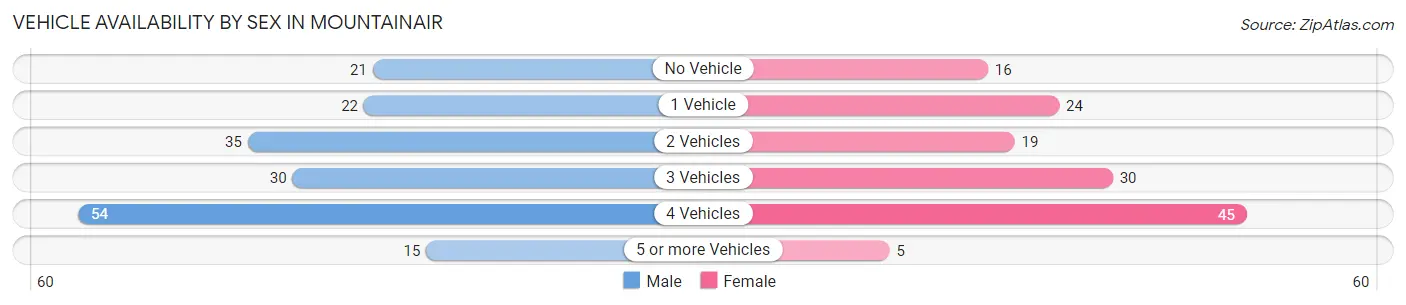
| Vehicles Available | Male | Female |
| No Vehicle | 21 (11.9%) | 16 (11.5%) |
| 1 Vehicle | 22 (12.4%) | 24 (17.3%) |
| 2 Vehicles | 35 (19.8%) | 19 (13.7%) |
| 3 Vehicles | 30 (17.0%) | 30 (21.6%) |
| 4 Vehicles | 54 (30.5%) | 45 (32.4%) |
| 5 or more Vehicles | 15 (8.5%) | 5 (3.6%) |
| Total | 177 (100.0%) | 139 (100.0%) |
Commute Time in Mountainair
The most frequently occuring commute durations in Mountainair are 5 to 9 minutes (81 commuters, 36.0%), less than 5 minutes (79 commuters, 35.1%), and 90 or more minutes (34 commuters, 15.1%).
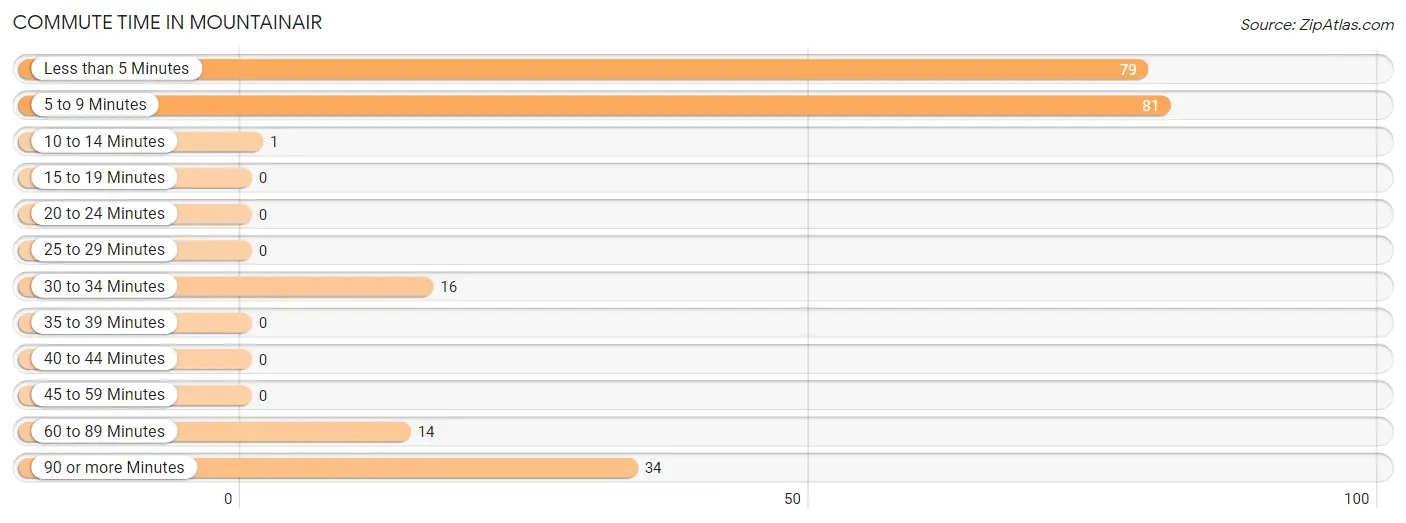
| Commute Time | # Commuters | % Commuters |
| Less than 5 Minutes | 79 | 35.1% |
| 5 to 9 Minutes | 81 | 36.0% |
| 10 to 14 Minutes | 1 | 0.4% |
| 15 to 19 Minutes | 0 | 0.0% |
| 20 to 24 Minutes | 0 | 0.0% |
| 25 to 29 Minutes | 0 | 0.0% |
| 30 to 34 Minutes | 16 | 7.1% |
| 35 to 39 Minutes | 0 | 0.0% |
| 40 to 44 Minutes | 0 | 0.0% |
| 45 to 59 Minutes | 0 | 0.0% |
| 60 to 89 Minutes | 14 | 6.2% |
| 90 or more Minutes | 34 | 15.1% |
Commute Time by Sex in Mountainair
The most common commute times in Mountainair are less than 5 minutes (50 commuters, 41.0%) for males and 5 to 9 minutes (43 commuters, 41.7%) for females.
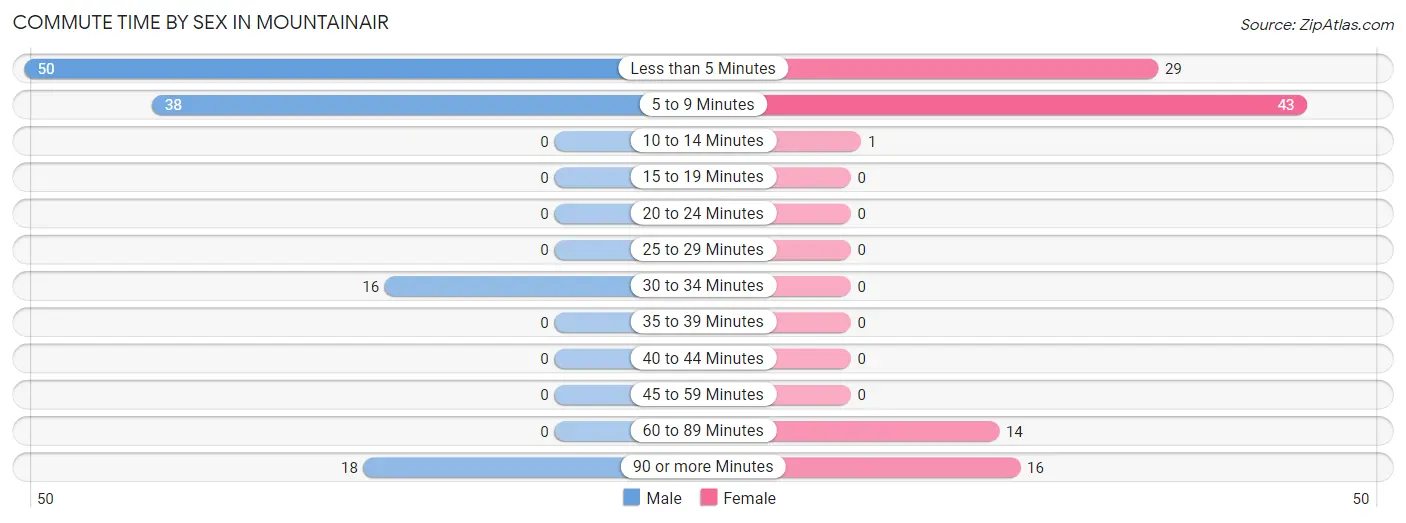
| Commute Time | Male | Female |
| Less than 5 Minutes | 50 (41.0%) | 29 (28.2%) |
| 5 to 9 Minutes | 38 (31.1%) | 43 (41.7%) |
| 10 to 14 Minutes | 0 (0.0%) | 1 (1.0%) |
| 15 to 19 Minutes | 0 (0.0%) | 0 (0.0%) |
| 20 to 24 Minutes | 0 (0.0%) | 0 (0.0%) |
| 25 to 29 Minutes | 0 (0.0%) | 0 (0.0%) |
| 30 to 34 Minutes | 16 (13.1%) | 0 (0.0%) |
| 35 to 39 Minutes | 0 (0.0%) | 0 (0.0%) |
| 40 to 44 Minutes | 0 (0.0%) | 0 (0.0%) |
| 45 to 59 Minutes | 0 (0.0%) | 0 (0.0%) |
| 60 to 89 Minutes | 0 (0.0%) | 14 (13.6%) |
| 90 or more Minutes | 18 (14.7%) | 16 (15.5%) |
Time of Departure to Work by Sex in Mountainair
The most frequent times of departure to work in Mountainair are 6:30 AM to 6:59 AM (50, 41.0%) for males and 5:30 AM to 5:59 AM (25, 24.3%) for females.
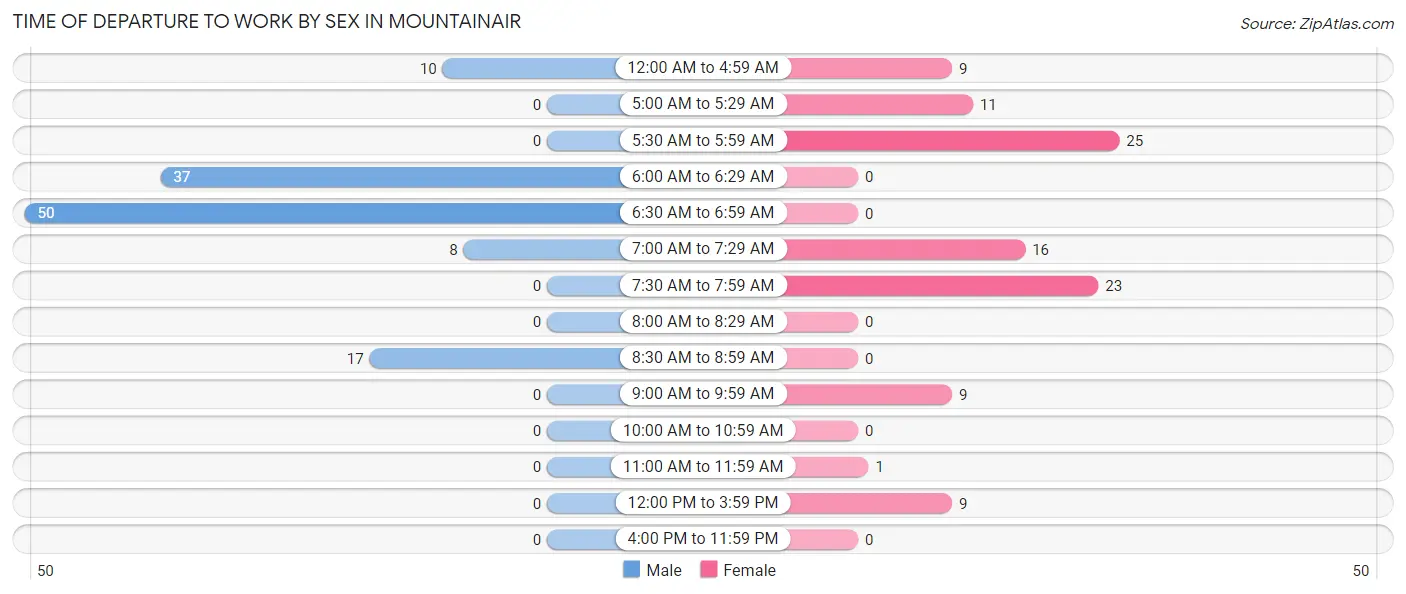
| Time of Departure | Male | Female |
| 12:00 AM to 4:59 AM | 10 (8.2%) | 9 (8.7%) |
| 5:00 AM to 5:29 AM | 0 (0.0%) | 11 (10.7%) |
| 5:30 AM to 5:59 AM | 0 (0.0%) | 25 (24.3%) |
| 6:00 AM to 6:29 AM | 37 (30.3%) | 0 (0.0%) |
| 6:30 AM to 6:59 AM | 50 (41.0%) | 0 (0.0%) |
| 7:00 AM to 7:29 AM | 8 (6.6%) | 16 (15.5%) |
| 7:30 AM to 7:59 AM | 0 (0.0%) | 23 (22.3%) |
| 8:00 AM to 8:29 AM | 0 (0.0%) | 0 (0.0%) |
| 8:30 AM to 8:59 AM | 17 (13.9%) | 0 (0.0%) |
| 9:00 AM to 9:59 AM | 0 (0.0%) | 9 (8.7%) |
| 10:00 AM to 10:59 AM | 0 (0.0%) | 0 (0.0%) |
| 11:00 AM to 11:59 AM | 0 (0.0%) | 1 (1.0%) |
| 12:00 PM to 3:59 PM | 0 (0.0%) | 9 (8.7%) |
| 4:00 PM to 11:59 PM | 0 (0.0%) | 0 (0.0%) |
| Total | 122 (100.0%) | 103 (100.0%) |
Housing Occupancy in Mountainair
Occupancy by Ownership in Mountainair
Of the total 332 dwellings in Mountainair, owner-occupied units account for 271 (81.6%), while renter-occupied units make up 61 (18.4%).
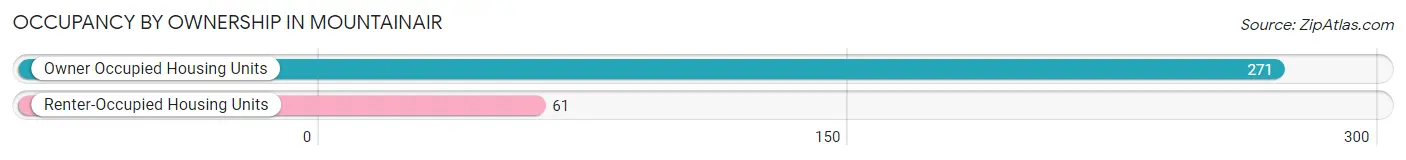
| Occupancy | # Housing Units | % Housing Units |
| Owner Occupied Housing Units | 271 | 81.6% |
| Renter-Occupied Housing Units | 61 | 18.4% |
| Total Occupied Housing Units | 332 | 100.0% |
Occupancy by Household Size in Mountainair
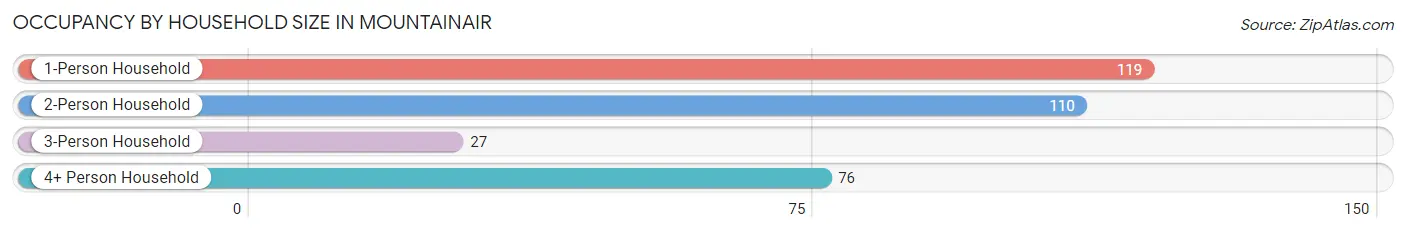
| Household Size | # Housing Units | % Housing Units |
| 1-Person Household | 119 | 35.8% |
| 2-Person Household | 110 | 33.1% |
| 3-Person Household | 27 | 8.1% |
| 4+ Person Household | 76 | 22.9% |
| Total Housing Units | 332 | 100.0% |
Occupancy by Ownership by Household Size in Mountainair
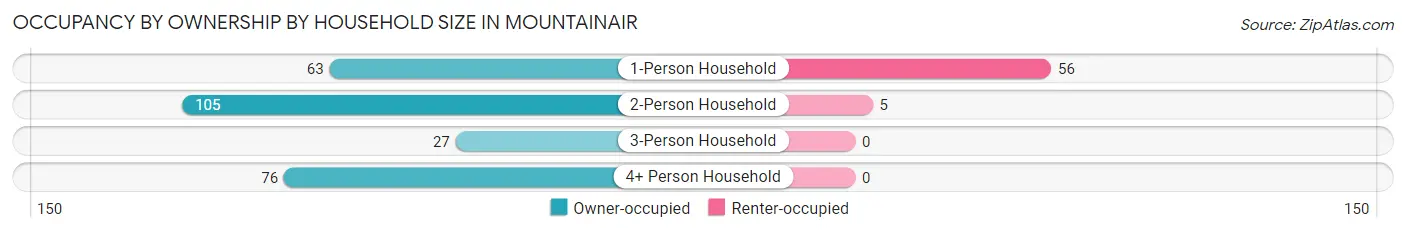
| Household Size | Owner-occupied | Renter-occupied |
| 1-Person Household | 63 (52.9%) | 56 (47.1%) |
| 2-Person Household | 105 (95.5%) | 5 (4.5%) |
| 3-Person Household | 27 (100.0%) | 0 (0.0%) |
| 4+ Person Household | 76 (100.0%) | 0 (0.0%) |
| Total Housing Units | 271 (81.6%) | 61 (18.4%) |
Occupancy by Educational Attainment in Mountainair
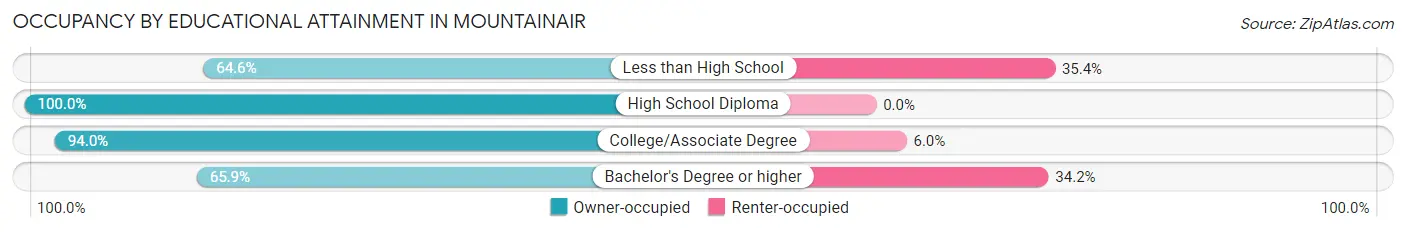
| Household Size | Owner-occupied | Renter-occupied |
| Less than High School | 51 (64.6%) | 28 (35.4%) |
| High School Diploma | 88 (100.0%) | 0 (0.0%) |
| College/Associate Degree | 78 (94.0%) | 5 (6.0%) |
| Bachelor's Degree or higher | 54 (65.8%) | 28 (34.2%) |
Occupancy by Age of Householder in Mountainair
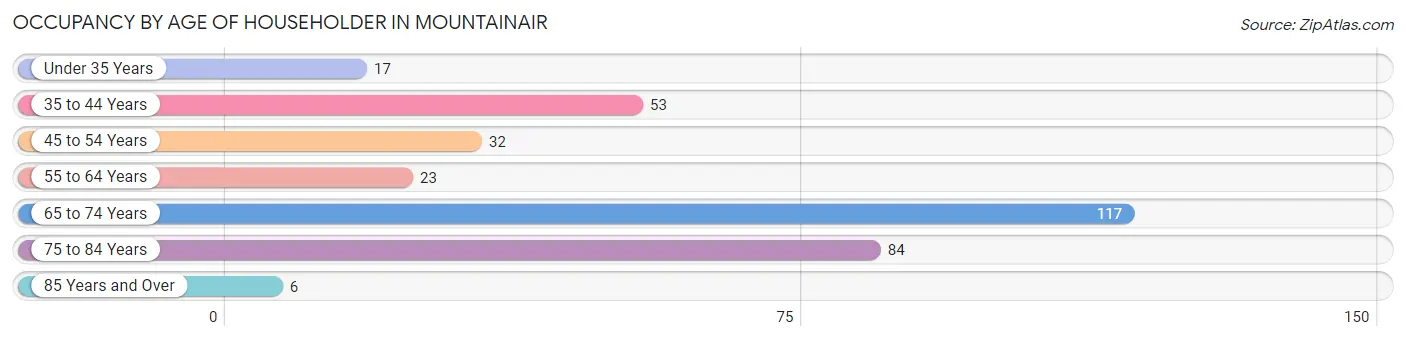
| Age Bracket | # Households | % Households |
| Under 35 Years | 17 | 5.1% |
| 35 to 44 Years | 53 | 16.0% |
| 45 to 54 Years | 32 | 9.6% |
| 55 to 64 Years | 23 | 6.9% |
| 65 to 74 Years | 117 | 35.2% |
| 75 to 84 Years | 84 | 25.3% |
| 85 Years and Over | 6 | 1.8% |
| Total | 332 | 100.0% |
Housing Finances in Mountainair
Median Income by Occupancy in Mountainair
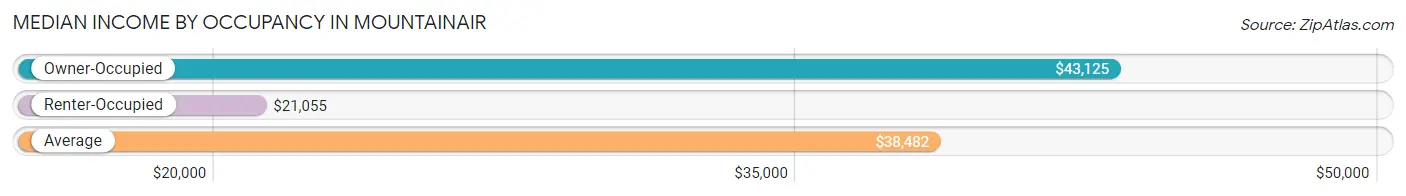
| Occupancy Type | # Households | Median Income |
| Owner-Occupied | 271 (81.6%) | $43,125 |
| Renter-Occupied | 61 (18.4%) | $21,055 |
| Average | 332 (100.0%) | $38,482 |
Occupancy by Householder Income Bracket in Mountainair
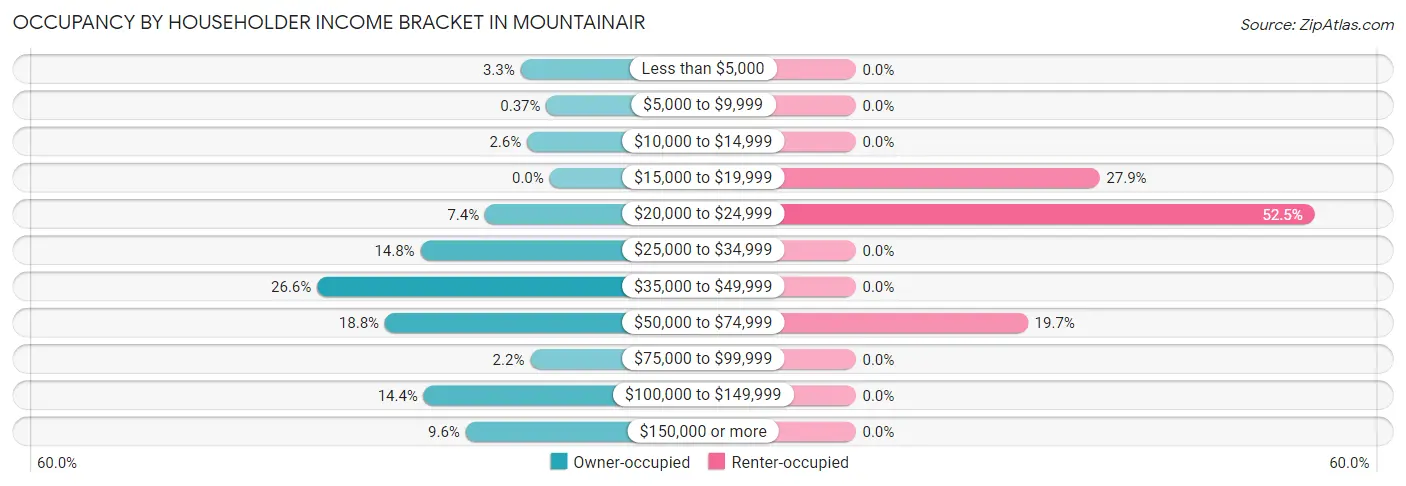
| Income Bracket | Owner-occupied | Renter-occupied |
| Less than $5,000 | 9 (3.3%) | 0 (0.0%) |
| $5,000 to $9,999 | 1 (0.4%) | 0 (0.0%) |
| $10,000 to $14,999 | 7 (2.6%) | 0 (0.0%) |
| $15,000 to $19,999 | 0 (0.0%) | 17 (27.9%) |
| $20,000 to $24,999 | 20 (7.4%) | 32 (52.5%) |
| $25,000 to $34,999 | 40 (14.8%) | 0 (0.0%) |
| $35,000 to $49,999 | 72 (26.6%) | 0 (0.0%) |
| $50,000 to $74,999 | 51 (18.8%) | 12 (19.7%) |
| $75,000 to $99,999 | 6 (2.2%) | 0 (0.0%) |
| $100,000 to $149,999 | 39 (14.4%) | 0 (0.0%) |
| $150,000 or more | 26 (9.6%) | 0 (0.0%) |
| Total | 271 (100.0%) | 61 (100.0%) |
Monthly Housing Cost Tiers in Mountainair
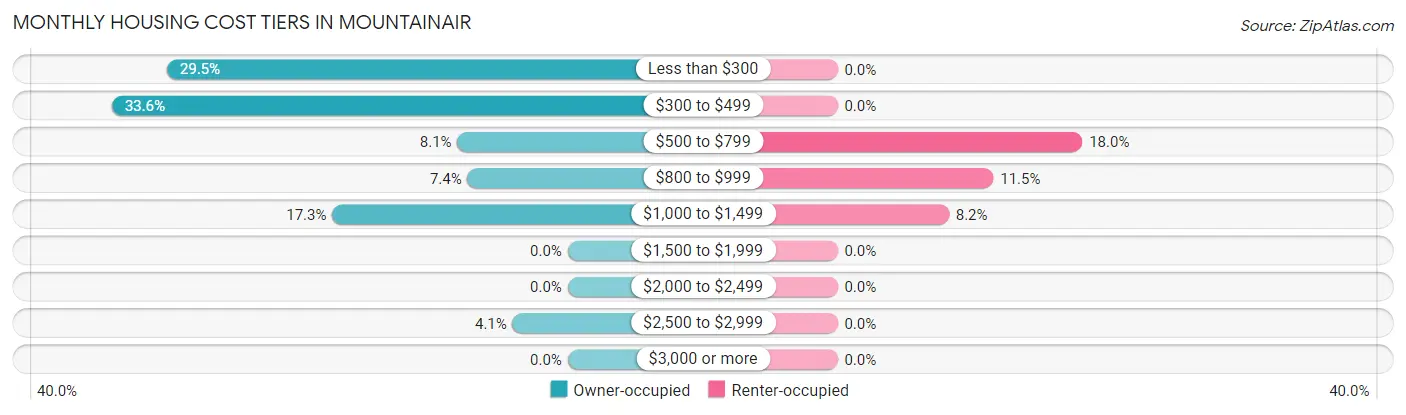
| Monthly Cost | Owner-occupied | Renter-occupied |
| Less than $300 | 80 (29.5%) | 0 (0.0%) |
| $300 to $499 | 91 (33.6%) | 0 (0.0%) |
| $500 to $799 | 22 (8.1%) | 11 (18.0%) |
| $800 to $999 | 20 (7.4%) | 7 (11.5%) |
| $1,000 to $1,499 | 47 (17.3%) | 5 (8.2%) |
| $1,500 to $1,999 | 0 (0.0%) | 0 (0.0%) |
| $2,000 to $2,499 | 0 (0.0%) | 0 (0.0%) |
| $2,500 to $2,999 | 11 (4.1%) | 0 (0.0%) |
| $3,000 or more | 0 (0.0%) | 0 (0.0%) |
| Total | 271 (100.0%) | 61 (100.0%) |
Physical Housing Characteristics in Mountainair
Housing Structures in Mountainair
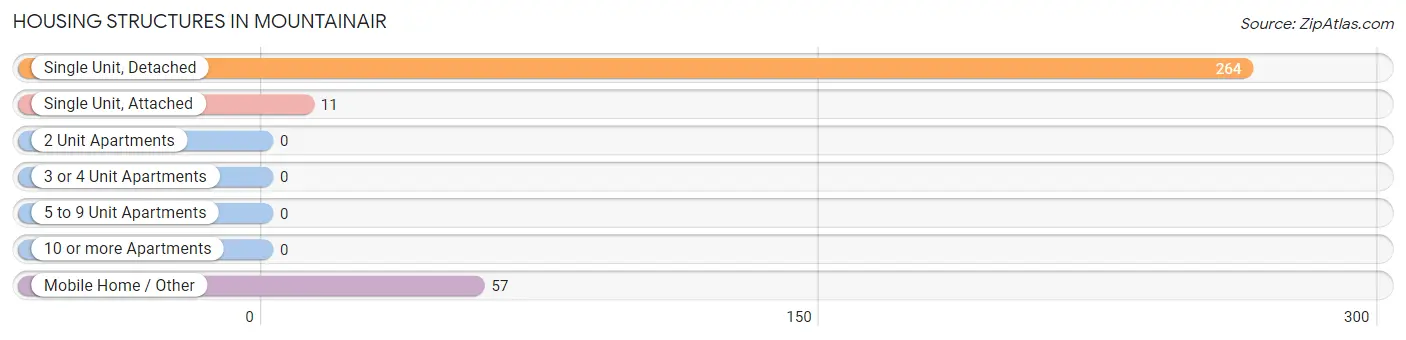
| Structure Type | # Housing Units | % Housing Units |
| Single Unit, Detached | 264 | 79.5% |
| Single Unit, Attached | 11 | 3.3% |
| 2 Unit Apartments | 0 | 0.0% |
| 3 or 4 Unit Apartments | 0 | 0.0% |
| 5 to 9 Unit Apartments | 0 | 0.0% |
| 10 or more Apartments | 0 | 0.0% |
| Mobile Home / Other | 57 | 17.2% |
| Total | 332 | 100.0% |
Housing Structures by Occupancy in Mountainair
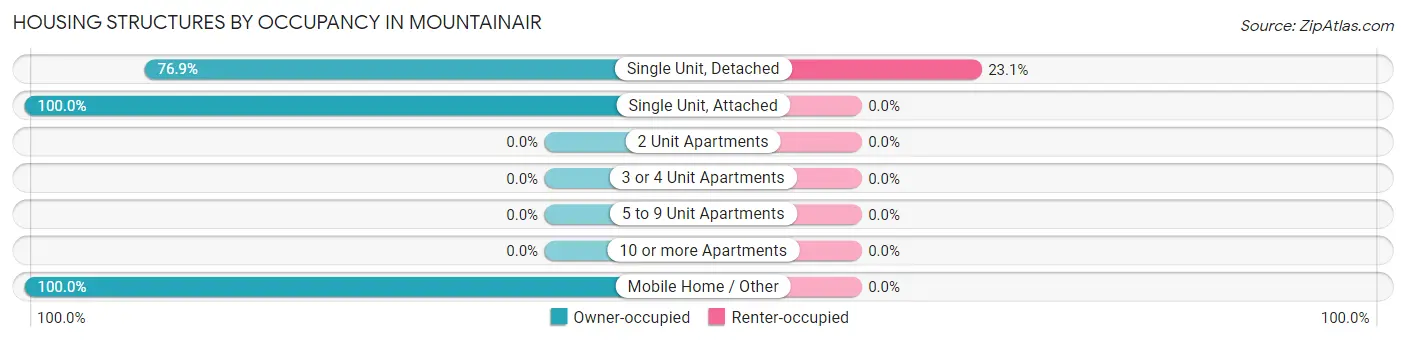
| Structure Type | Owner-occupied | Renter-occupied |
| Single Unit, Detached | 203 (76.9%) | 61 (23.1%) |
| Single Unit, Attached | 11 (100.0%) | 0 (0.0%) |
| 2 Unit Apartments | 0 (0.0%) | 0 (0.0%) |
| 3 or 4 Unit Apartments | 0 (0.0%) | 0 (0.0%) |
| 5 to 9 Unit Apartments | 0 (0.0%) | 0 (0.0%) |
| 10 or more Apartments | 0 (0.0%) | 0 (0.0%) |
| Mobile Home / Other | 57 (100.0%) | 0 (0.0%) |
| Total | 271 (81.6%) | 61 (18.4%) |
Housing Structures by Number of Rooms in Mountainair
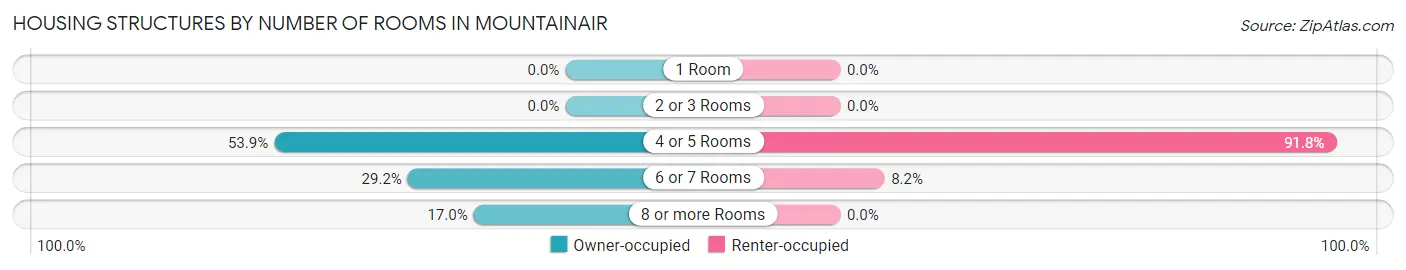
| Number of Rooms | Owner-occupied | Renter-occupied |
| 1 Room | 0 (0.0%) | 0 (0.0%) |
| 2 or 3 Rooms | 0 (0.0%) | 0 (0.0%) |
| 4 or 5 Rooms | 146 (53.9%) | 56 (91.8%) |
| 6 or 7 Rooms | 79 (29.1%) | 5 (8.2%) |
| 8 or more Rooms | 46 (17.0%) | 0 (0.0%) |
| Total | 271 (100.0%) | 61 (100.0%) |
Housing Structure by Heating Type in Mountainair
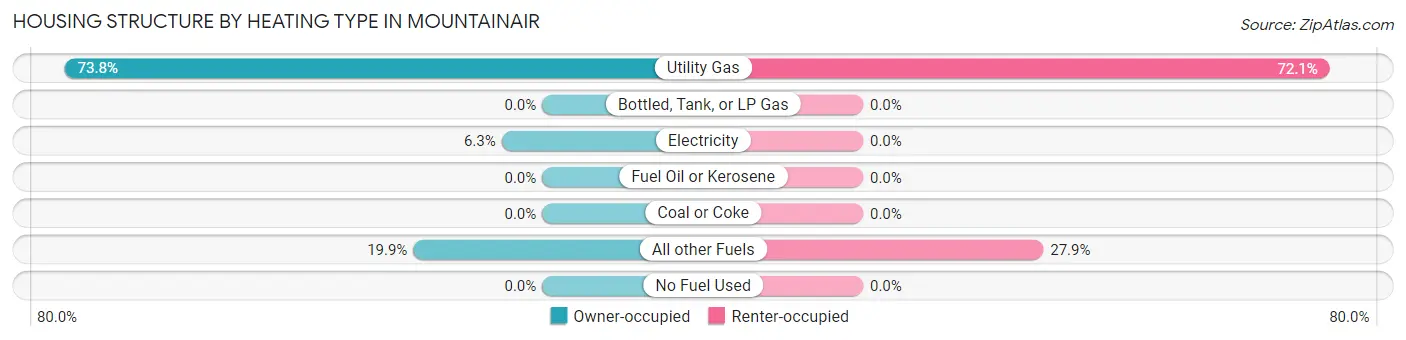
| Heating Type | Owner-occupied | Renter-occupied |
| Utility Gas | 200 (73.8%) | 44 (72.1%) |
| Bottled, Tank, or LP Gas | 0 (0.0%) | 0 (0.0%) |
| Electricity | 17 (6.3%) | 0 (0.0%) |
| Fuel Oil or Kerosene | 0 (0.0%) | 0 (0.0%) |
| Coal or Coke | 0 (0.0%) | 0 (0.0%) |
| All other Fuels | 54 (19.9%) | 17 (27.9%) |
| No Fuel Used | 0 (0.0%) | 0 (0.0%) |
| Total | 271 (100.0%) | 61 (100.0%) |
Household Vehicle Usage in Mountainair
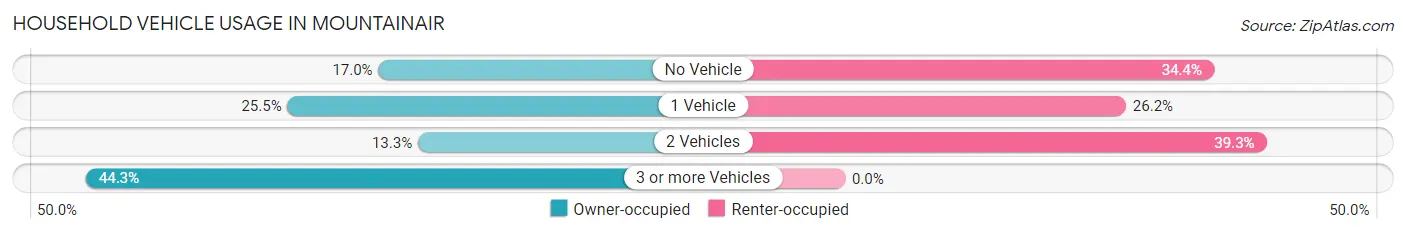
| Vehicles per Household | Owner-occupied | Renter-occupied |
| No Vehicle | 46 (17.0%) | 21 (34.4%) |
| 1 Vehicle | 69 (25.5%) | 16 (26.2%) |
| 2 Vehicles | 36 (13.3%) | 24 (39.3%) |
| 3 or more Vehicles | 120 (44.3%) | 0 (0.0%) |
| Total | 271 (100.0%) | 61 (100.0%) |
Real Estate & Mortgages in Mountainair
Real Estate and Mortgage Overview in Mountainair
| Characteristic | Without Mortgage | With Mortgage |
| Housing Units | 193 | 78 |
| Median Property Value | $85,900 | $177,500 |
| Median Household Income | $36,767 | $26 |
| Monthly Housing Costs | $325 | $0 |
| Real Estate Taxes | $403 | $0 |
Property Value by Mortgage Status in Mountainair
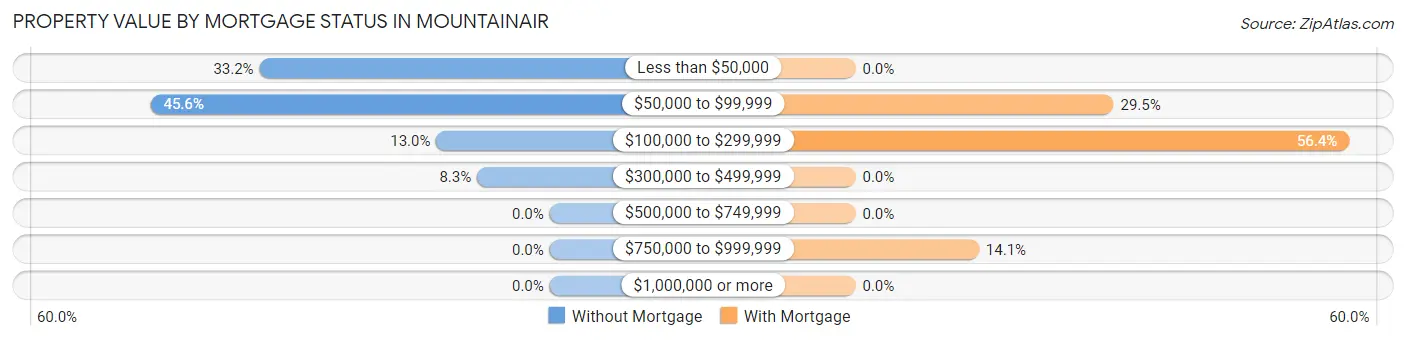
| Property Value | Without Mortgage | With Mortgage |
| Less than $50,000 | 64 (33.2%) | 0 (0.0%) |
| $50,000 to $99,999 | 88 (45.6%) | 23 (29.5%) |
| $100,000 to $299,999 | 25 (13.0%) | 44 (56.4%) |
| $300,000 to $499,999 | 16 (8.3%) | 0 (0.0%) |
| $500,000 to $749,999 | 0 (0.0%) | 0 (0.0%) |
| $750,000 to $999,999 | 0 (0.0%) | 11 (14.1%) |
| $1,000,000 or more | 0 (0.0%) | 0 (0.0%) |
| Total | 193 (100.0%) | 78 (100.0%) |
Household Income by Mortgage Status in Mountainair
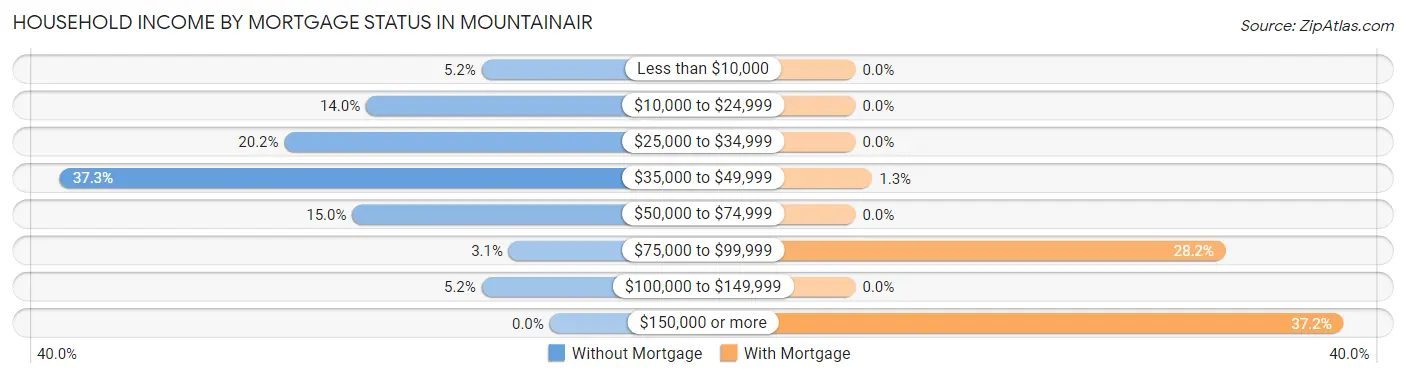
| Household Income | Without Mortgage | With Mortgage |
| Less than $10,000 | 10 (5.2%) | 0 (0.0%) |
| $10,000 to $24,999 | 27 (14.0%) | 0 (0.0%) |
| $25,000 to $34,999 | 39 (20.2%) | 0 (0.0%) |
| $35,000 to $49,999 | 72 (37.3%) | 1 (1.3%) |
| $50,000 to $74,999 | 29 (15.0%) | 0 (0.0%) |
| $75,000 to $99,999 | 6 (3.1%) | 22 (28.2%) |
| $100,000 to $149,999 | 10 (5.2%) | 0 (0.0%) |
| $150,000 or more | 0 (0.0%) | 29 (37.2%) |
| Total | 193 (100.0%) | 78 (100.0%) |
Property Value to Household Income Ratio in Mountainair
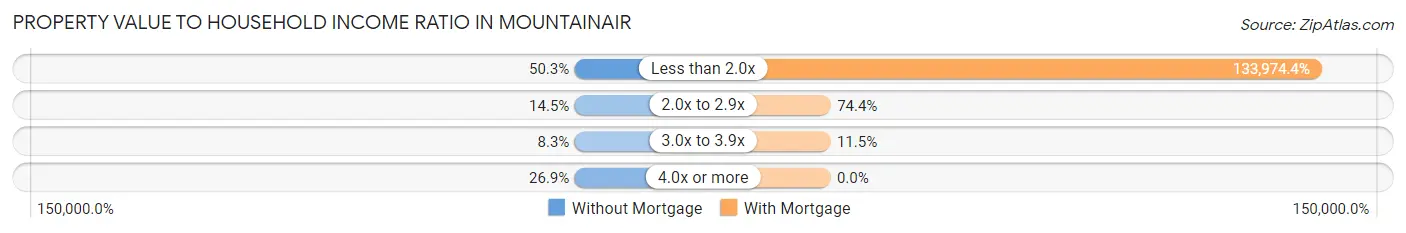
| Value-to-Income Ratio | Without Mortgage | With Mortgage |
| Less than 2.0x | 97 (50.3%) | 104,500 (133,974.4%) |
| 2.0x to 2.9x | 28 (14.5%) | 58 (74.4%) |
| 3.0x to 3.9x | 16 (8.3%) | 9 (11.5%) |
| 4.0x or more | 52 (26.9%) | 0 (0.0%) |
| Total | 193 (100.0%) | 78 (100.0%) |
Real Estate Taxes by Mortgage Status in Mountainair
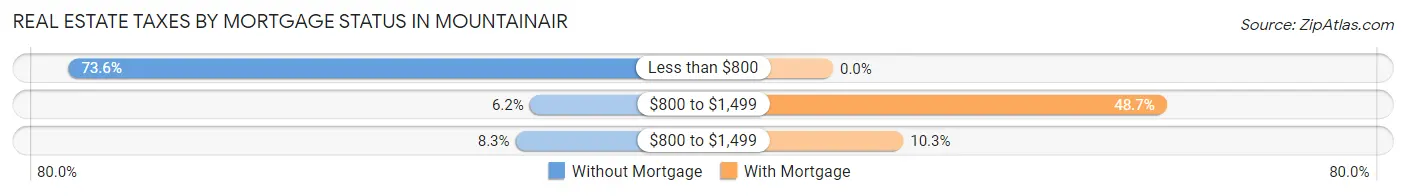
| Property Taxes | Without Mortgage | With Mortgage |
| Less than $800 | 142 (73.6%) | 0 (0.0%) |
| $800 to $1,499 | 12 (6.2%) | 38 (48.7%) |
| $800 to $1,499 | 16 (8.3%) | 8 (10.3%) |
| Total | 193 (100.0%) | 78 (100.0%) |
Health & Disability in Mountainair
Health Insurance Coverage by Age in Mountainair
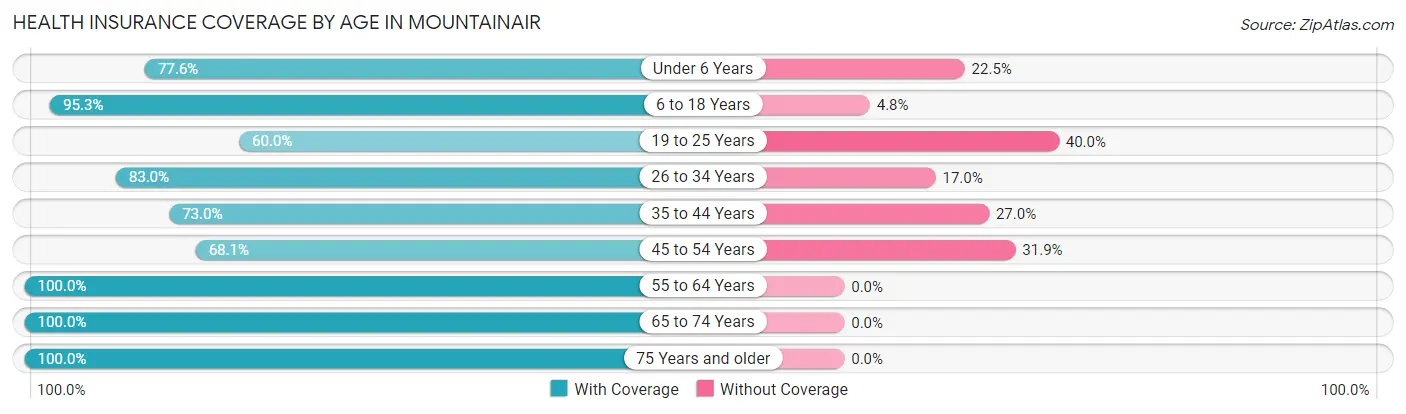
| Age Bracket | With Coverage | Without Coverage |
| Under 6 Years | 38 (77.5%) | 11 (22.5%) |
| 6 to 18 Years | 281 (95.3%) | 14 (4.8%) |
| 19 to 25 Years | 72 (60.0%) | 48 (40.0%) |
| 26 to 34 Years | 39 (83.0%) | 8 (17.0%) |
| 35 to 44 Years | 92 (73.0%) | 34 (27.0%) |
| 45 to 54 Years | 64 (68.1%) | 30 (31.9%) |
| 55 to 64 Years | 50 (100.0%) | 0 (0.0%) |
| 65 to 74 Years | 195 (100.0%) | 0 (0.0%) |
| 75 Years and older | 95 (100.0%) | 0 (0.0%) |
| Total | 926 (86.5%) | 145 (13.5%) |
Health Insurance Coverage by Citizenship Status in Mountainair
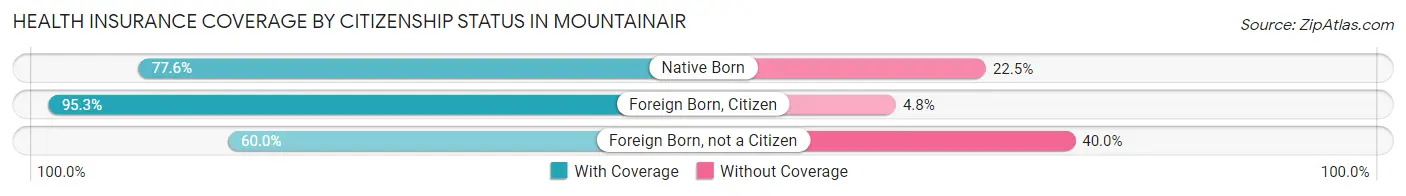
| Citizenship Status | With Coverage | Without Coverage |
| Native Born | 38 (77.5%) | 11 (22.5%) |
| Foreign Born, Citizen | 281 (95.3%) | 14 (4.8%) |
| Foreign Born, not a Citizen | 72 (60.0%) | 48 (40.0%) |
Health Insurance Coverage by Household Income in Mountainair
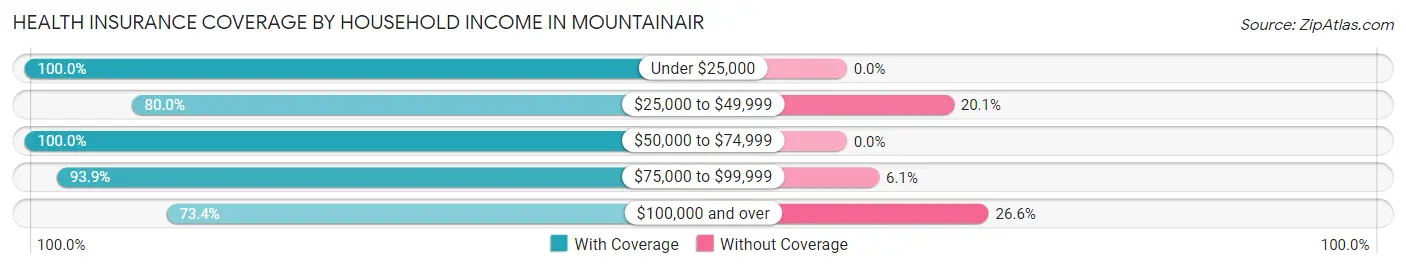
| Household Income | With Coverage | Without Coverage |
| Under $25,000 | 99 (100.0%) | 0 (0.0%) |
| $25,000 to $49,999 | 311 (79.9%) | 78 (20.1%) |
| $50,000 to $74,999 | 229 (100.0%) | 0 (0.0%) |
| $75,000 to $99,999 | 124 (93.9%) | 8 (6.1%) |
| $100,000 and over | 163 (73.4%) | 59 (26.6%) |
Public vs Private Health Insurance Coverage by Age in Mountainair
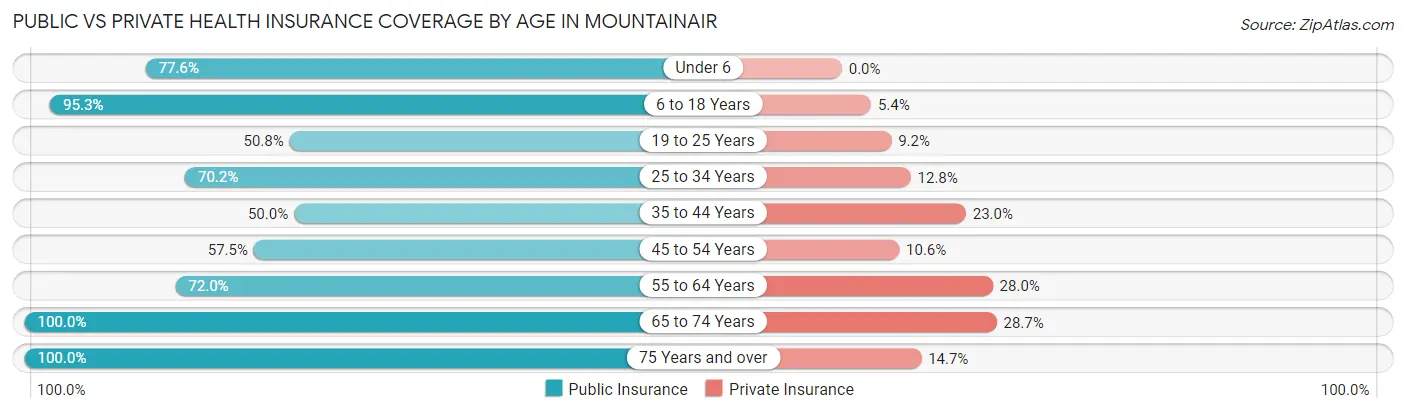
| Age Bracket | Public Insurance | Private Insurance |
| Under 6 | 38 (77.5%) | 0 (0.0%) |
| 6 to 18 Years | 281 (95.3%) | 16 (5.4%) |
| 19 to 25 Years | 61 (50.8%) | 11 (9.2%) |
| 25 to 34 Years | 33 (70.2%) | 6 (12.8%) |
| 35 to 44 Years | 63 (50.0%) | 29 (23.0%) |
| 45 to 54 Years | 54 (57.5%) | 10 (10.6%) |
| 55 to 64 Years | 36 (72.0%) | 14 (28.0%) |
| 65 to 74 Years | 195 (100.0%) | 56 (28.7%) |
| 75 Years and over | 95 (100.0%) | 14 (14.7%) |
| Total | 856 (79.9%) | 156 (14.6%) |
Disability Status by Sex by Age in Mountainair
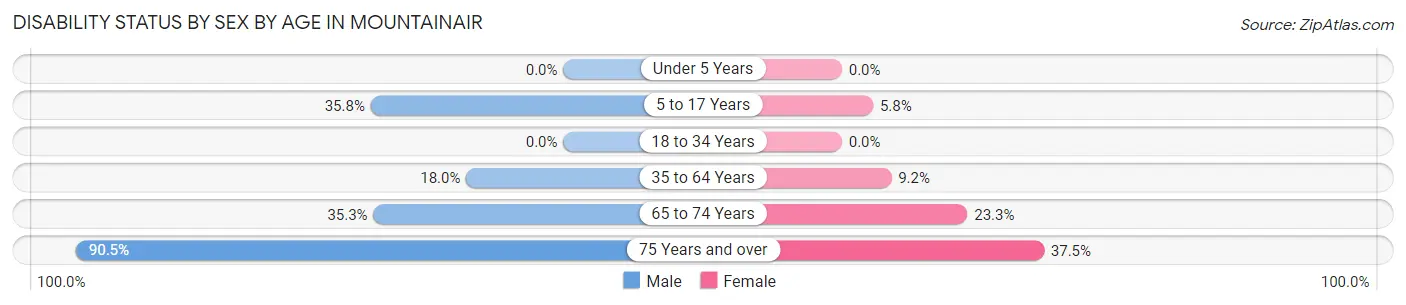
| Age Bracket | Male | Female |
| Under 5 Years | 0 (0.0%) | 0 (0.0%) |
| 5 to 17 Years | 69 (35.7%) | 7 (5.8%) |
| 18 to 34 Years | 0 (0.0%) | 0 (0.0%) |
| 35 to 64 Years | 29 (18.0%) | 10 (9.2%) |
| 65 to 74 Years | 43 (35.2%) | 17 (23.3%) |
| 75 Years and over | 57 (90.5%) | 12 (37.5%) |
Disability Class by Sex by Age in Mountainair
Disability Class: Hearing Difficulty
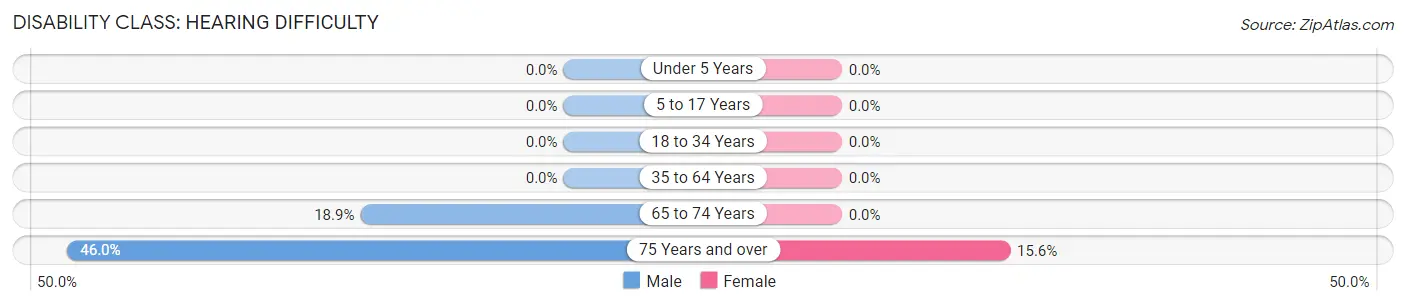
| Age Bracket | Male | Female |
| Under 5 Years | 0 (0.0%) | 0 (0.0%) |
| 5 to 17 Years | 0 (0.0%) | 0 (0.0%) |
| 18 to 34 Years | 0 (0.0%) | 0 (0.0%) |
| 35 to 64 Years | 0 (0.0%) | 0 (0.0%) |
| 65 to 74 Years | 23 (18.9%) | 0 (0.0%) |
| 75 Years and over | 29 (46.0%) | 5 (15.6%) |
Disability Class: Vision Difficulty
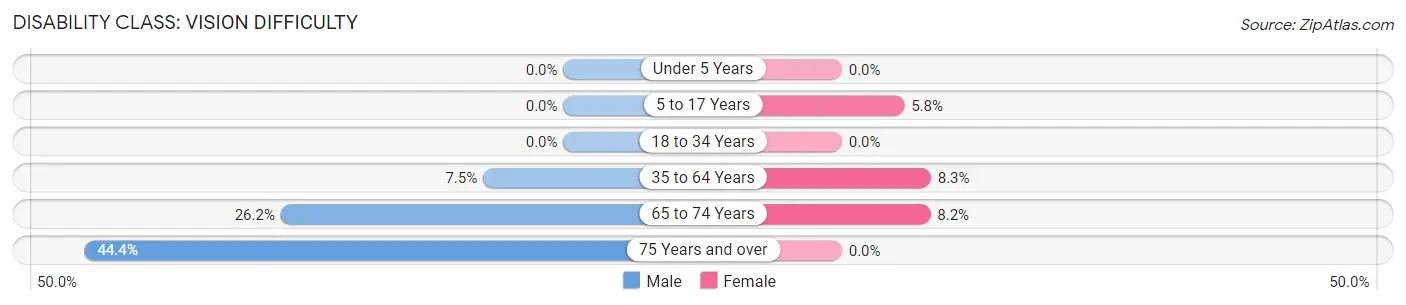
| Age Bracket | Male | Female |
| Under 5 Years | 0 (0.0%) | 0 (0.0%) |
| 5 to 17 Years | 0 (0.0%) | 7 (5.8%) |
| 18 to 34 Years | 0 (0.0%) | 0 (0.0%) |
| 35 to 64 Years | 12 (7.4%) | 9 (8.3%) |
| 65 to 74 Years | 32 (26.2%) | 6 (8.2%) |
| 75 Years and over | 28 (44.4%) | 0 (0.0%) |
Disability Class: Cognitive Difficulty
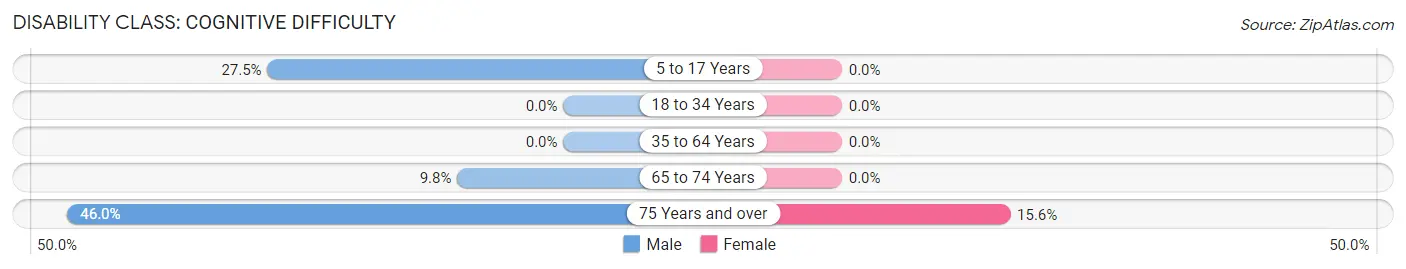
| Age Bracket | Male | Female |
| 5 to 17 Years | 53 (27.5%) | 0 (0.0%) |
| 18 to 34 Years | 0 (0.0%) | 0 (0.0%) |
| 35 to 64 Years | 0 (0.0%) | 0 (0.0%) |
| 65 to 74 Years | 12 (9.8%) | 0 (0.0%) |
| 75 Years and over | 29 (46.0%) | 5 (15.6%) |
Disability Class: Ambulatory Difficulty
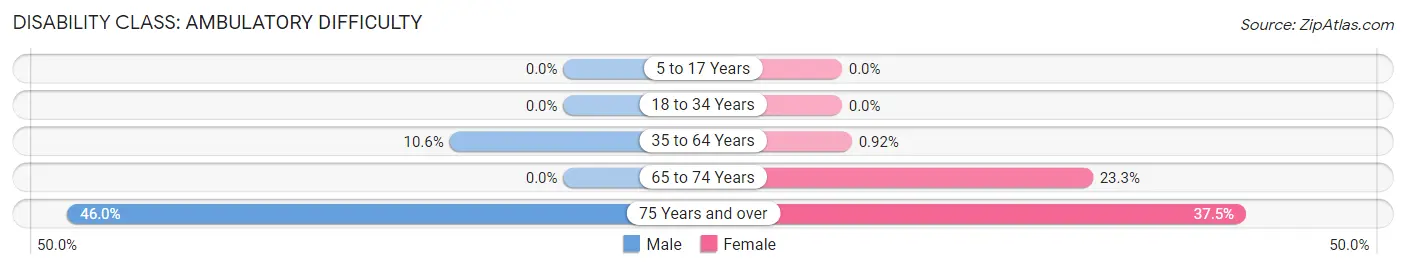
| Age Bracket | Male | Female |
| 5 to 17 Years | 0 (0.0%) | 0 (0.0%) |
| 18 to 34 Years | 0 (0.0%) | 0 (0.0%) |
| 35 to 64 Years | 17 (10.6%) | 1 (0.9%) |
| 65 to 74 Years | 0 (0.0%) | 17 (23.3%) |
| 75 Years and over | 29 (46.0%) | 12 (37.5%) |
Disability Class: Self-Care Difficulty
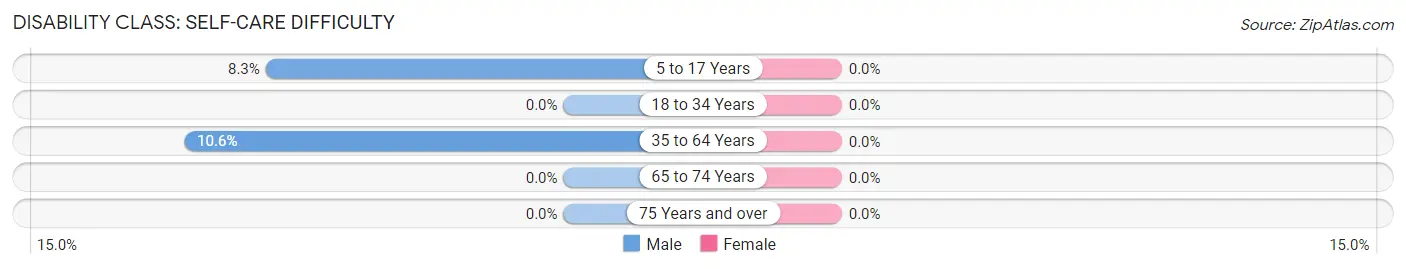
| Age Bracket | Male | Female |
| 5 to 17 Years | 16 (8.3%) | 0 (0.0%) |
| 18 to 34 Years | 0 (0.0%) | 0 (0.0%) |
| 35 to 64 Years | 17 (10.6%) | 0 (0.0%) |
| 65 to 74 Years | 0 (0.0%) | 0 (0.0%) |
| 75 Years and over | 0 (0.0%) | 0 (0.0%) |
Technology Access in Mountainair
Computing Device Access in Mountainair
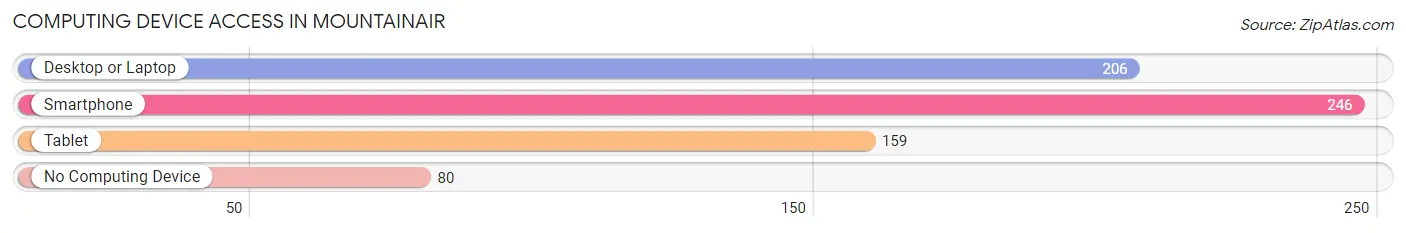
| Device Type | # Households | % Households |
| Desktop or Laptop | 206 | 62.1% |
| Smartphone | 246 | 74.1% |
| Tablet | 159 | 47.9% |
| No Computing Device | 80 | 24.1% |
| Total | 332 | 100.0% |
Internet Access in Mountainair
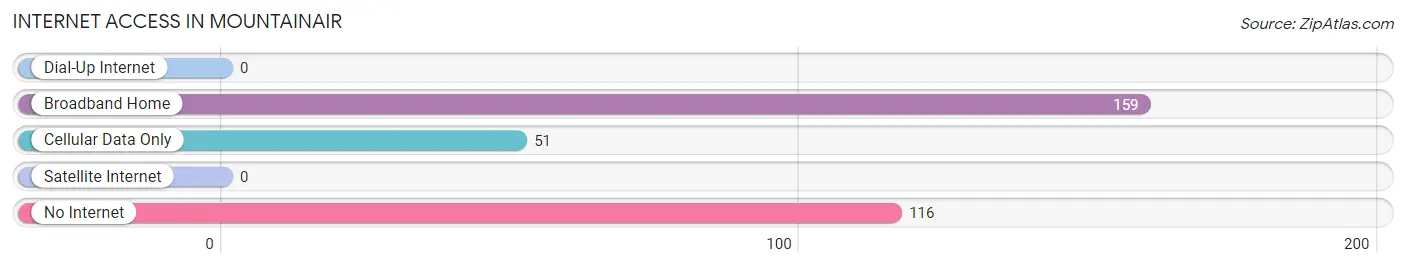
| Internet Type | # Households | % Households |
| Dial-Up Internet | 0 | 0.0% |
| Broadband Home | 159 | 47.9% |
| Cellular Data Only | 51 | 15.4% |
| Satellite Internet | 0 | 0.0% |
| No Internet | 116 | 34.9% |
| Total | 332 | 100.0% |
Mountainair Summary
Mountainair is a small town located in Torrance County, New Mexico, United States. It is situated in the Manzano Mountains, approximately 60 miles southeast of Albuquerque. The town was founded in 1903 and has a population of approximately 1,100 people.
Geography
Mountainair is located in the Manzano Mountains, at an elevation of 6,000 feet. The town is surrounded by the Cibola National Forest and is situated in a valley between the Manzano and Sandia Mountains. The town is located on the edge of the Rio Grande Rift, a geological feature that runs from Colorado to Mexico. The climate in Mountainair is semi-arid, with hot summers and cold winters.
Economy
Mountainair’s economy is largely based on agriculture and tourism. The town is home to several small farms, which produce a variety of crops, including alfalfa, corn, and wheat. The town is also home to several tourist attractions, including the Salinas Pueblo Missions National Monument, the Cibola National Forest, and the Manzano Mountains State Park.
Demographics
As of the 2010 census, the population of Mountainair was 1,121. The racial makeup of the town was 81.3% White, 0.7% African American, 0.9% Native American, 0.2% Asian, 0.1% Pacific Islander, 14.2% from other races, and 2.7% from two or more races. Hispanic or Latino of any race were 33.2% of the population.
The median income for a household in Mountainair was $25,000, and the median income for a family was $30,000. The per capita income for the town was $14,000. About 18.2% of families and 22.2% of the population were below the poverty line, including 28.3% of those under age 18 and 10.2% of those age 65 or over.
History
Mountainair was founded in 1903 by a group of settlers from the nearby town of Estancia. The town was originally called “Mountain Air”, but the name was later shortened to “Mountainair”. The town was incorporated in 1911 and has remained a small, rural community ever since.
In the early 20th century, Mountainair was a popular stop on the Santa Fe Trail. The town was also home to several ranches and farms, which produced a variety of crops, including alfalfa, corn, and wheat.
In the 1950s, the town began to experience a decline in population as many of its residents moved away in search of better economic opportunities. However, in recent years, the town has seen a resurgence in population as people have moved back to the area in search of a more rural lifestyle.
Conclusion
Mountainair is a small town located in Torrance County, New Mexico. It is situated in the Manzano Mountains, approximately 60 miles southeast of Albuquerque. The town was founded in 1903 and has a population of approximately 1,100 people. The economy of Mountainair is largely based on agriculture and tourism, and the town is home to several tourist attractions, including the Salinas Pueblo Missions National Monument, the Cibola National Forest, and the Manzano Mountains State Park. The racial makeup of the town is 81.3% White, 0.7% African American, 0.9% Native American, 0.2% Asian, 0.1% Pacific Islander, 14.2% from other races, and 2.7% from two or more races. The median income for a household in Mountainair was $25,000, and the median income for a family was $30,000. The town has seen a resurgence in population in recent years as people have moved back to the area in search of a more rural lifestyle.
Common Questions
What is Per Capita Income in Mountainair?
Per Capita income in Mountainair is $19,742.
What is the Median Family Income in Mountainair?
Median Family Income in Mountainair is $52,917.
What is the Median Household income in Mountainair?
Median Household Income in Mountainair is $38,482.
What is Income or Wage Gap in Mountainair?
Income or Wage Gap in Mountainair is 35.1%.
Women in Mountainair earn 64.9 cents for every dollar earned by a man.
What is Inequality or Gini Index in Mountainair?
Inequality or Gini Index in Mountainair is 0.45.
What is the Total Population of Mountainair?
Total Population of Mountainair is 1,071.
What is the Total Male Population of Mountainair?
Total Male Population of Mountainair is 656.
What is the Total Female Population of Mountainair?
Total Female Population of Mountainair is 415.
What is the Ratio of Males per 100 Females in Mountainair?
There are 158.07 Males per 100 Females in Mountainair.
What is the Ratio of Females per 100 Males in Mountainair?
There are 63.26 Females per 100 Males in Mountainair.
What is the Median Population Age in Mountainair?
Median Population Age in Mountainair is 39.2 Years.
What is the Average Family Size in Mountainair
Average Family Size in Mountainair is 4.4 People.
What is the Average Household Size in Mountainair
Average Household Size in Mountainair is 3.2 People.
How Large is the Labor Force in Mountainair?
There are 355 People in the Labor Forcein in Mountainair.
What is the Percentage of People in the Labor Force in Mountainair?
44.3% of People are in the Labor Force in Mountainair.
What is the Unemployment Rate in Mountainair?
Unemployment Rate in Mountainair is 11.0%.