Netarts, OR Map & Demographics
Netarts Map
Netarts Overview
$38,798
PER CAPITA INCOME
$70,819
AVG FAMILY INCOME
$70,515
AVG HOUSEHOLD INCOME
0.31
INEQUALITY / GINI INDEX
622
TOTAL POPULATION
398
MALE POPULATION
224
FEMALE POPULATION
177.68
MALES / 100 FEMALES
56.28
FEMALES / 100 MALES
62.6
MEDIAN AGE
2.5
AVG FAMILY SIZE
2.1
AVG HOUSEHOLD SIZE
242
LABOR FORCE [ PEOPLE ]
43.0%
PERCENT IN LABOR FORCE
Netarts Area Codes
Income in Netarts
Income Overview in Netarts
Per Capita Income in Netarts is $38,798, while median incomes of families and households are $70,819 and $70,515 respectively.
| Characteristic | Number | Measure |
| Per Capita Income | 622 | $38,798 |
| Median Family Income | 189 | $70,819 |
| Mean Family Income | 189 | $71,766 |
| Median Household Income | 298 | $70,515 |
| Mean Household Income | 298 | $74,229 |
| Income Deficit | 189 | $0 |
| Wage / Income Gap (%) | 622 | 0.00% |
| Wage / Income Gap ($) | 622 | 100.00¢ per $1 |
| Gini / Inequality Index | 622 | 0.31 |
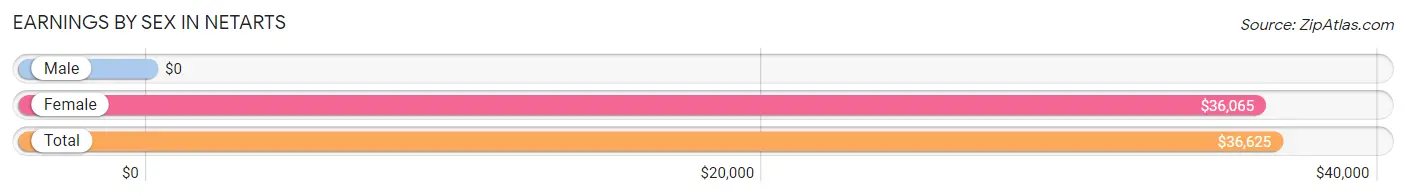
Earnings by Sex in Netarts
| Sex | Number | Average Earnings |
| Male | 130 (46.6%) | $0 |
| Female | 149 (53.4%) | $36,065 |
| Total | 279 (100.0%) | $36,625 |
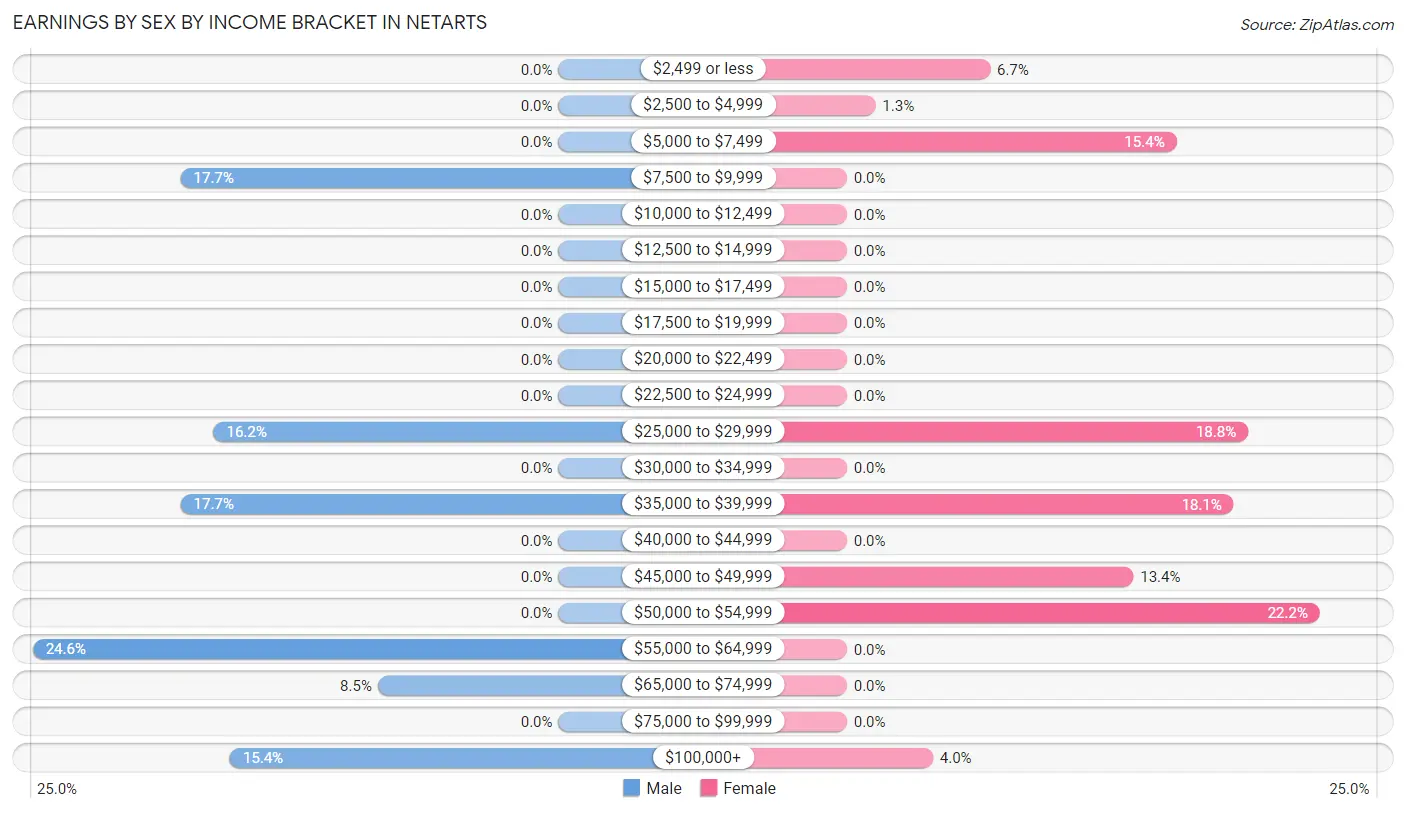
Earnings by Sex by Income Bracket in Netarts
The most common earnings brackets in Netarts are $55,000 to $64,999 for men (32 | 24.6%) and $50,000 to $54,999 for women (33 | 22.2%).
| Income | Male | Female |
| $2,499 or less | 0 (0.0%) | 10 (6.7%) |
| $2,500 to $4,999 | 0 (0.0%) | 2 (1.3%) |
| $5,000 to $7,499 | 0 (0.0%) | 23 (15.4%) |
| $7,500 to $9,999 | 23 (17.7%) | 0 (0.0%) |
| $10,000 to $12,499 | 0 (0.0%) | 0 (0.0%) |
| $12,500 to $14,999 | 0 (0.0%) | 0 (0.0%) |
| $15,000 to $17,499 | 0 (0.0%) | 0 (0.0%) |
| $17,500 to $19,999 | 0 (0.0%) | 0 (0.0%) |
| $20,000 to $22,499 | 0 (0.0%) | 0 (0.0%) |
| $22,500 to $24,999 | 0 (0.0%) | 0 (0.0%) |
| $25,000 to $29,999 | 21 (16.2%) | 28 (18.8%) |
| $30,000 to $34,999 | 0 (0.0%) | 0 (0.0%) |
| $35,000 to $39,999 | 23 (17.7%) | 27 (18.1%) |
| $40,000 to $44,999 | 0 (0.0%) | 0 (0.0%) |
| $45,000 to $49,999 | 0 (0.0%) | 20 (13.4%) |
| $50,000 to $54,999 | 0 (0.0%) | 33 (22.2%) |
| $55,000 to $64,999 | 32 (24.6%) | 0 (0.0%) |
| $65,000 to $74,999 | 11 (8.5%) | 0 (0.0%) |
| $75,000 to $99,999 | 0 (0.0%) | 0 (0.0%) |
| $100,000+ | 20 (15.4%) | 6 (4.0%) |
| Total | 130 (100.0%) | 149 (100.0%) |
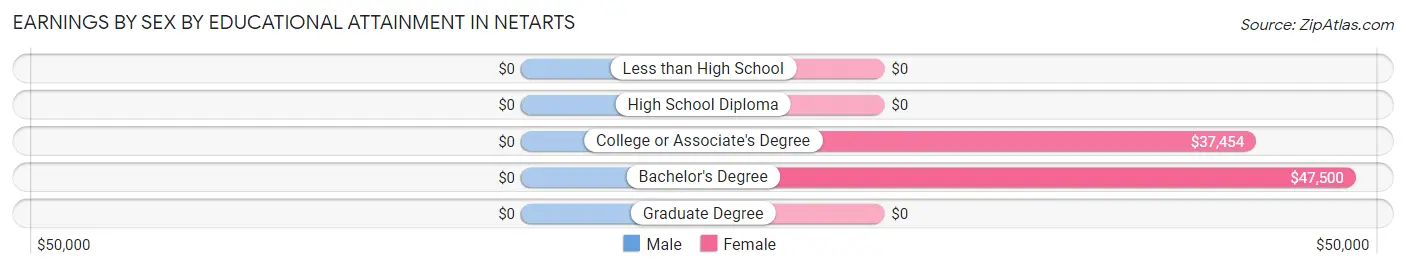
Earnings by Sex by Educational Attainment in Netarts
| Educational Attainment | Male Income | Female Income |
| Less than High School | - | - |
| High School Diploma | - | - |
| College or Associate's Degree | - | - |
| Bachelor's Degree | - | - |
| Graduate Degree | - | - |
| Total | - | - |
Family Income in Netarts
Family Income Brackets in Netarts
According to the Netarts family income data, there are 52 families falling into the $35,000 to $49,999 income range, which is the most common income bracket and makes up 27.5% of all families.
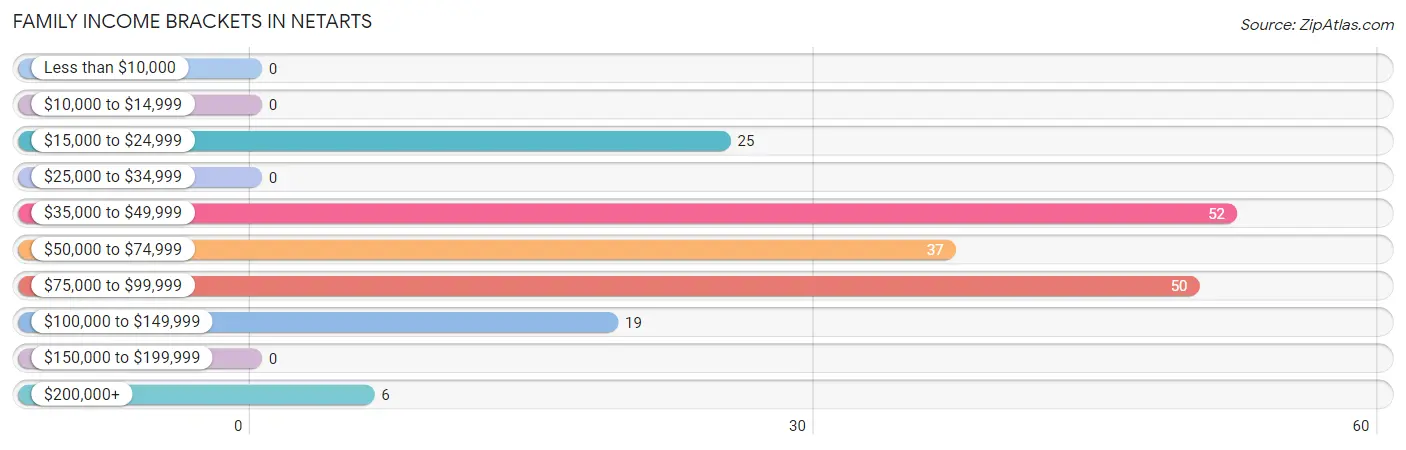
| Income Bracket | # Families | % Families |
| Less than $10,000 | 0 | 0.0% |
| $10,000 to $14,999 | 0 | 0.0% |
| $15,000 to $24,999 | 25 | 13.2% |
| $25,000 to $34,999 | 0 | 0.0% |
| $35,000 to $49,999 | 52 | 27.5% |
| $50,000 to $74,999 | 37 | 19.6% |
| $75,000 to $99,999 | 50 | 26.5% |
| $100,000 to $149,999 | 19 | 10.1% |
| $150,000 to $199,999 | 0 | 0.0% |
| $200,000+ | 6 | 3.2% |
Family Income by Famaliy Size in Netarts
2-person families (152 | 80.4%) account for the highest median family income in Netarts with $71,739 per family, while 2-person families (152 | 80.4%) have the highest median income of $35,870 per family member.
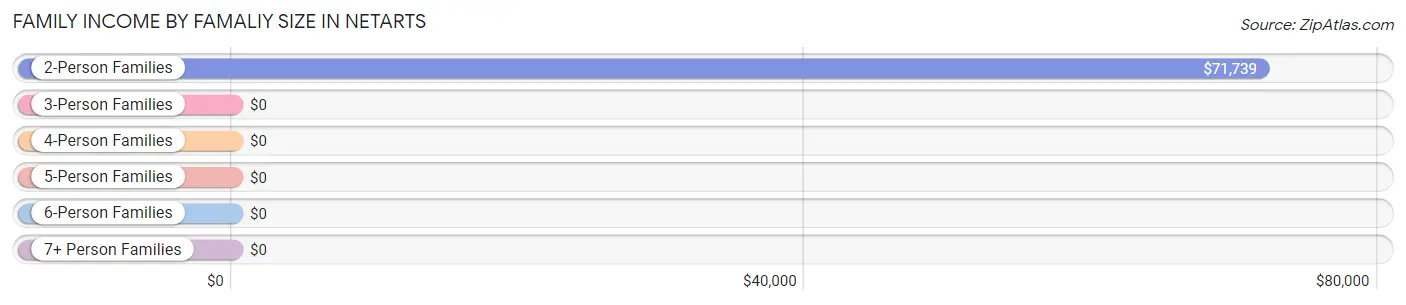
| Income Bracket | # Families | Median Income |
| 2-Person Families | 152 (80.4%) | $71,739 |
| 3-Person Families | 12 (6.4%) | $0 |
| 4-Person Families | 25 (13.2%) | $0 |
| 5-Person Families | 0 (0.0%) | $0 |
| 6-Person Families | 0 (0.0%) | $0 |
| 7+ Person Families | 0 (0.0%) | $0 |
| Total | 189 (100.0%) | $70,819 |
Family Income by Number of Earners in Netarts
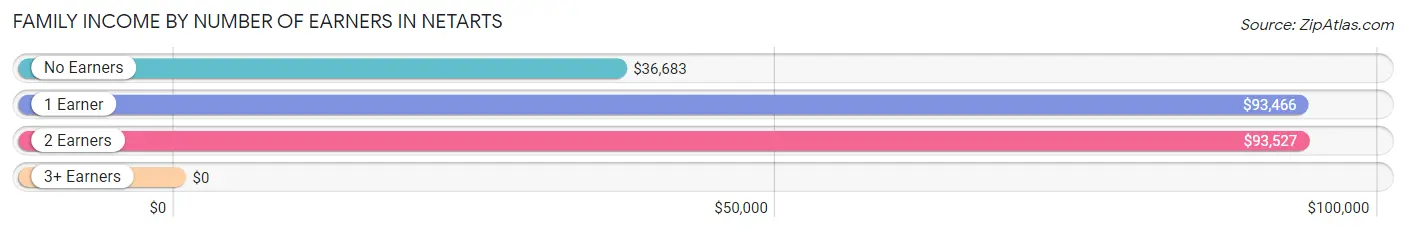
| Number of Earners | # Families | Median Income |
| No Earners | 85 (45.0%) | $36,683 |
| 1 Earner | 29 (15.3%) | $93,466 |
| 2 Earners | 69 (36.5%) | $93,527 |
| 3+ Earners | 6 (3.2%) | $0 |
| Total | 189 (100.0%) | $70,819 |
Household Income in Netarts
Household Income Brackets in Netarts
With 90 households falling in the category, the $50,000 to $74,999 income range is the most frequent in Netarts, accounting for 30.2% of all households.
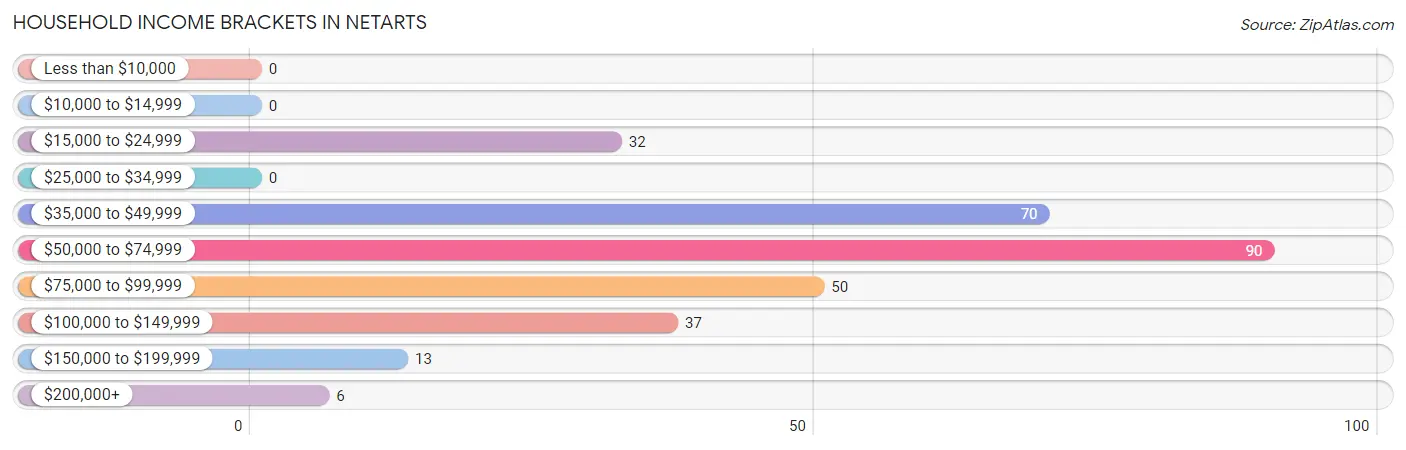
| Income Bracket | # Households | % Households |
| Less than $10,000 | 0 | 0.0% |
| $10,000 to $14,999 | 0 | 0.0% |
| $15,000 to $24,999 | 32 | 10.7% |
| $25,000 to $34,999 | 0 | 0.0% |
| $35,000 to $49,999 | 70 | 23.5% |
| $50,000 to $74,999 | 90 | 30.2% |
| $75,000 to $99,999 | 50 | 16.8% |
| $100,000 to $149,999 | 37 | 12.4% |
| $150,000 to $199,999 | 13 | 4.4% |
| $200,000+ | 6 | 2.0% |
Household Income by Householder Age in Netarts
The median household income in Netarts is $70,515, with the highest median household income of $71,793 found in the 45 to 64 years age bracket for the primary householder. A total of 83 households (27.9%) fall into this category.
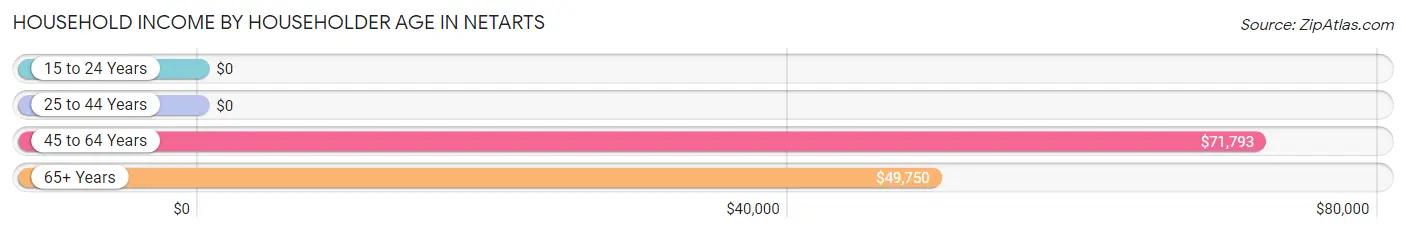
| Income Bracket | # Households | Median Income |
| 15 to 24 Years | 0 (0.0%) | $0 |
| 25 to 44 Years | 62 (20.8%) | $0 |
| 45 to 64 Years | 83 (27.9%) | $71,793 |
| 65+ Years | 153 (51.3%) | $49,750 |
| Total | 298 (100.0%) | $70,515 |
Poverty in Netarts
Income Below Poverty by Sex and Age in Netarts
With 27.9% poverty level for males and 0.4% for females among the residents of Netarts, 12 to 14 year old males and 75 year old and over females are the most vulnerable to poverty, with 33 males (100.0%) and 1 females (9.1%) in their respective age groups living below the poverty level.
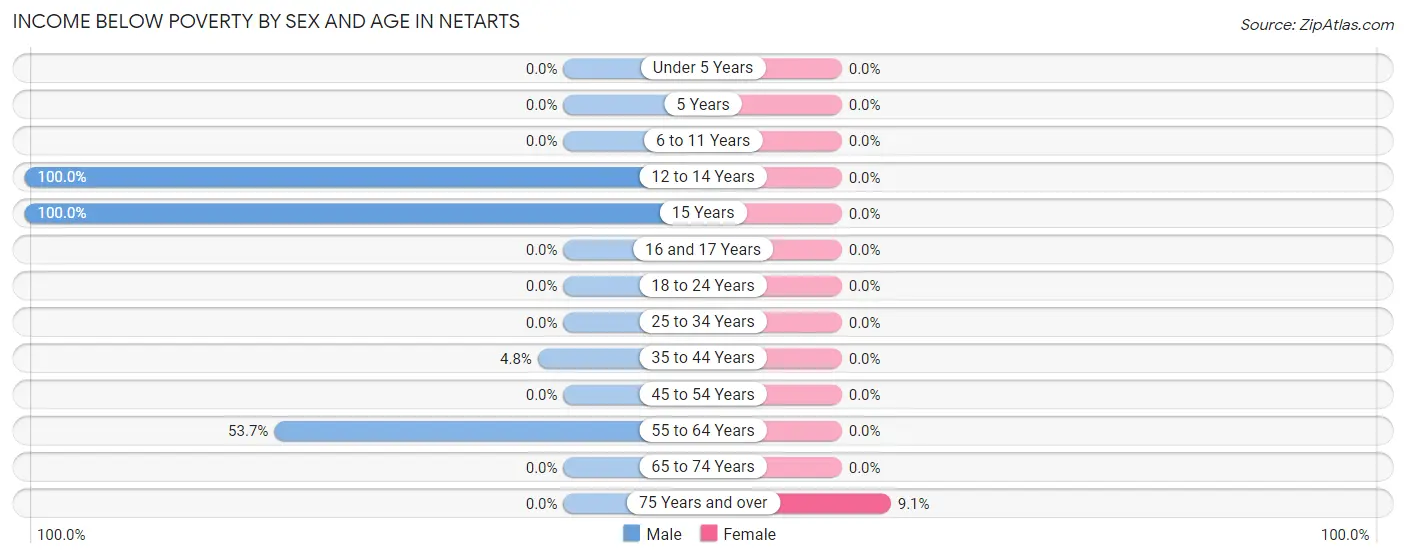
| Age Bracket | Male | Female |
| Under 5 Years | 0 (0.0%) | 0 (0.0%) |
| 5 Years | 0 (0.0%) | 0 (0.0%) |
| 6 to 11 Years | 0 (0.0%) | 0 (0.0%) |
| 12 to 14 Years | 33 (100.0%) | 0 (0.0%) |
| 15 Years | 26 (100.0%) | 0 (0.0%) |
| 16 and 17 Years | 0 (0.0%) | 0 (0.0%) |
| 18 to 24 Years | 0 (0.0%) | 0 (0.0%) |
| 25 to 34 Years | 0 (0.0%) | 0 (0.0%) |
| 35 to 44 Years | 1 (4.8%) | 0 (0.0%) |
| 45 to 54 Years | 0 (0.0%) | 0 (0.0%) |
| 55 to 64 Years | 51 (53.7%) | 0 (0.0%) |
| 65 to 74 Years | 0 (0.0%) | 0 (0.0%) |
| 75 Years and over | 0 (0.0%) | 1 (9.1%) |
| Total | 111 (27.9%) | 1 (0.4%) |
Income Above Poverty by Sex and Age in Netarts
According to the poverty statistics in Netarts, males aged 25 to 34 years and females aged 16 and 17 years are the age groups that are most secure financially, with 100.0% of males and 100.0% of females in these age groups living above the poverty line.
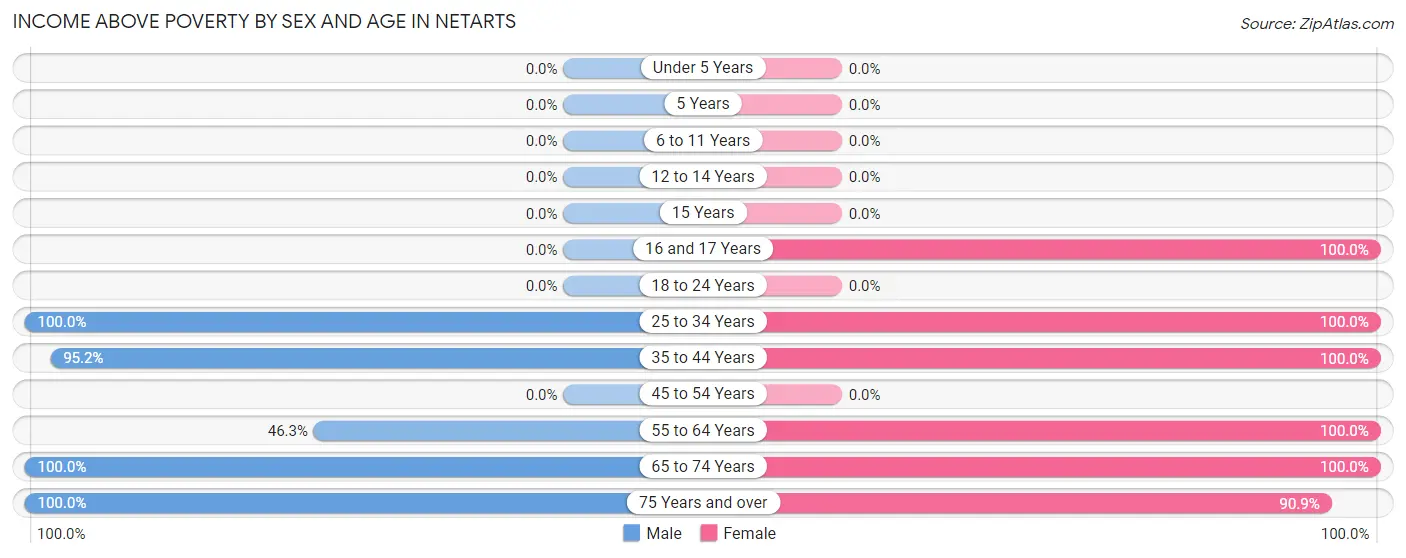
| Age Bracket | Male | Female |
| Under 5 Years | 0 (0.0%) | 0 (0.0%) |
| 5 Years | 0 (0.0%) | 0 (0.0%) |
| 6 to 11 Years | 0 (0.0%) | 0 (0.0%) |
| 12 to 14 Years | 0 (0.0%) | 0 (0.0%) |
| 15 Years | 0 (0.0%) | 0 (0.0%) |
| 16 and 17 Years | 0 (0.0%) | 5 (100.0%) |
| 18 to 24 Years | 0 (0.0%) | 0 (0.0%) |
| 25 to 34 Years | 43 (100.0%) | 33 (100.0%) |
| 35 to 44 Years | 20 (95.2%) | 8 (100.0%) |
| 45 to 54 Years | 0 (0.0%) | 0 (0.0%) |
| 55 to 64 Years | 44 (46.3%) | 80 (100.0%) |
| 65 to 74 Years | 145 (100.0%) | 87 (100.0%) |
| 75 Years and over | 35 (100.0%) | 10 (90.9%) |
| Total | 287 (72.1%) | 223 (99.6%) |
Income Below Poverty Among Married-Couple Families in Netarts
The poverty statistics for married-couple families in Netarts show that 13.7% or 25 of the total 182 families live below the poverty line. Families with 1 or 2 children have the highest poverty rate of 80.6%, comprising of 25 families. On the other hand, families with no children have the lowest poverty rate of 0.0%, which includes 0 families.
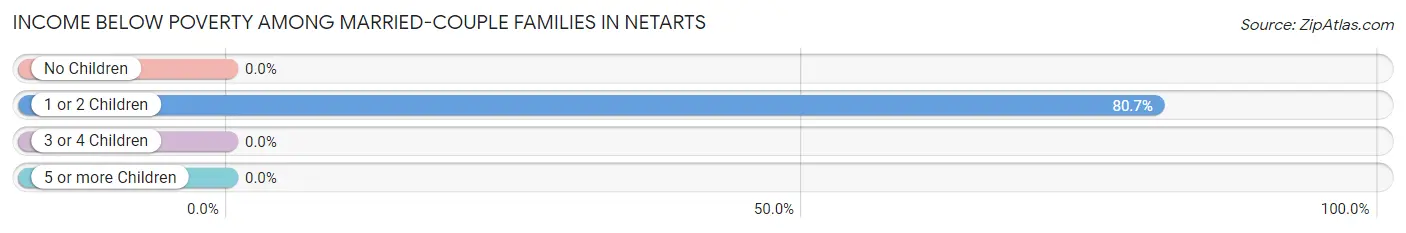
| Children | Above Poverty | Below Poverty |
| No Children | 151 (100.0%) | 0 (0.0%) |
| 1 or 2 Children | 6 (19.4%) | 25 (80.6%) |
| 3 or 4 Children | 0 (0.0%) | 0 (0.0%) |
| 5 or more Children | 0 (0.0%) | 0 (0.0%) |
| Total | 157 (86.3%) | 25 (13.7%) |
Income Below Poverty Among Single-Parent Households in Netarts
| Children | Single Father | Single Mother |
| No Children | 0 (0.0%) | 0 (0.0%) |
| 1 or 2 Children | 0 (0.0%) | 0 (0.0%) |
| 3 or 4 Children | 0 (0.0%) | 0 (0.0%) |
| 5 or more Children | 0 (0.0%) | 0 (0.0%) |
| Total | 0 (0.0%) | 0 (0.0%) |
Income Below Poverty Among Married-Couple vs Single-Parent Households in Netarts
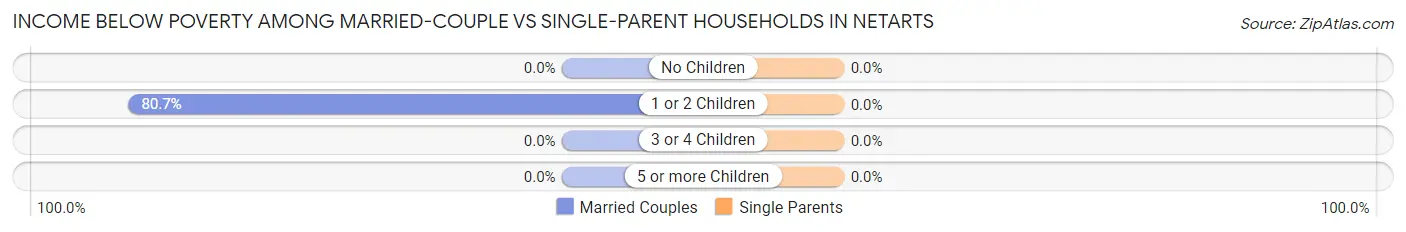
| Children | Married-Couple Families | Single-Parent Households |
| No Children | 0 (0.0%) | 0 (0.0%) |
| 1 or 2 Children | 25 (80.6%) | 0 (0.0%) |
| 3 or 4 Children | 0 (0.0%) | 0 (0.0%) |
| 5 or more Children | 0 (0.0%) | 0 (0.0%) |
| Total | 25 (13.7%) | 0 (0.0%) |
Race in Netarts
The most populous races in Netarts are White / Caucasian (608 | 97.8%), and Two or more Races (14 | 2.2%).
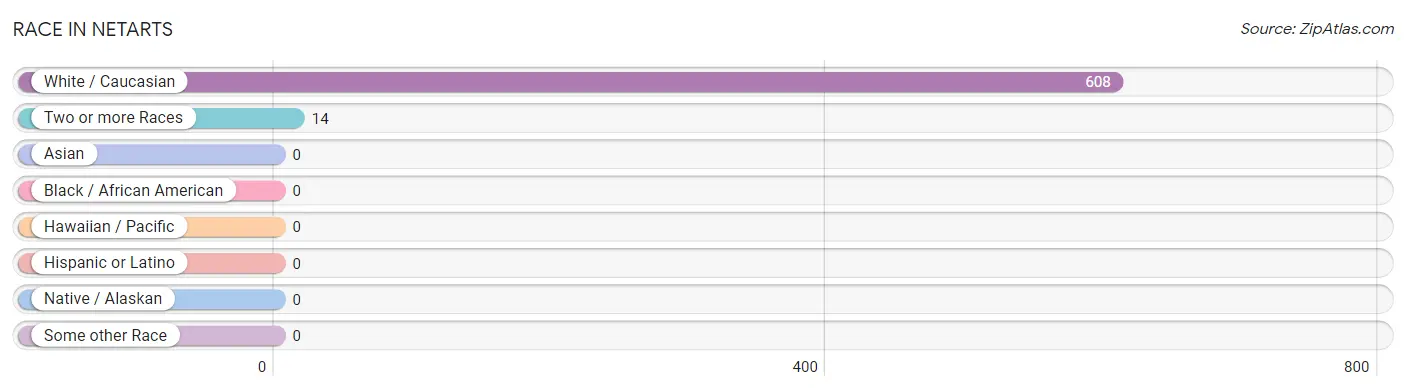
| Race | # Population | % Population |
| Asian | 0 | 0.0% |
| Black / African American | 0 | 0.0% |
| Hawaiian / Pacific | 0 | 0.0% |
| Hispanic or Latino | 0 | 0.0% |
| Native / Alaskan | 0 | 0.0% |
| White / Caucasian | 608 | 97.8% |
| Two or more Races | 14 | 2.2% |
| Some other Race | 0 | 0.0% |
| Total | 622 | 100.0% |
Ancestry in Netarts
The most populous ancestries reported in Netarts are English (129 | 20.7%), German (126 | 20.3%), Irish (63 | 10.1%), Swiss (40 | 6.4%), and Belgian (32 | 5.1%), together accounting for 62.7% of all Netarts residents.
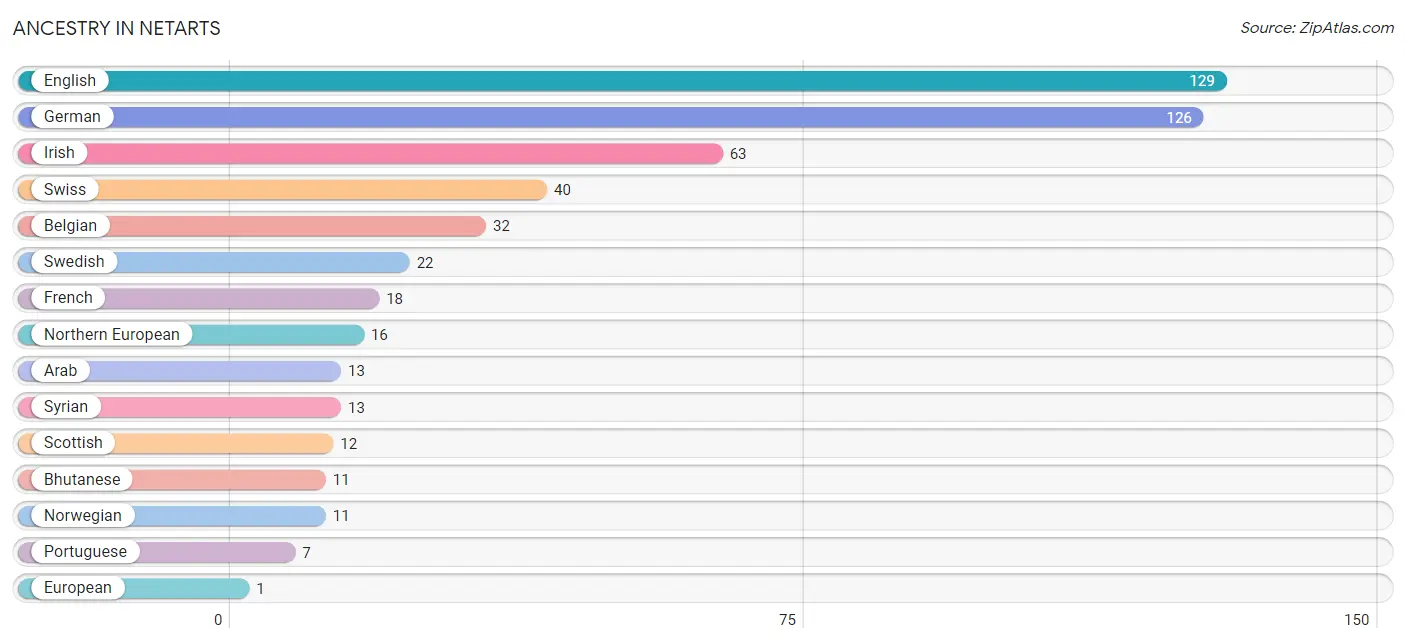
| Ancestry | # Population | % Population |
| Arab | 13 | 2.1% |
| Belgian | 32 | 5.1% |
| Bhutanese | 11 | 1.8% |
| English | 129 | 20.7% |
| European | 1 | 0.2% |
| French | 18 | 2.9% |
| German | 126 | 20.3% |
| Irish | 63 | 10.1% |
| Northern European | 16 | 2.6% |
| Norwegian | 11 | 1.8% |
| Portuguese | 7 | 1.1% |
| Scottish | 12 | 1.9% |
| Swedish | 22 | 3.5% |
| Swiss | 40 | 6.4% |
| Syrian | 13 | 2.1% | View All 15 Rows |
Immigrants in Netarts

| Immigration Origin | # Population | % Population | View All 0 Rows |
Sex and Age in Netarts
Sex and Age in Netarts
The most populous age groups in Netarts are 65 to 69 Years (75 | 18.8%) for men and 65 to 69 Years (73 | 32.6%) for women.
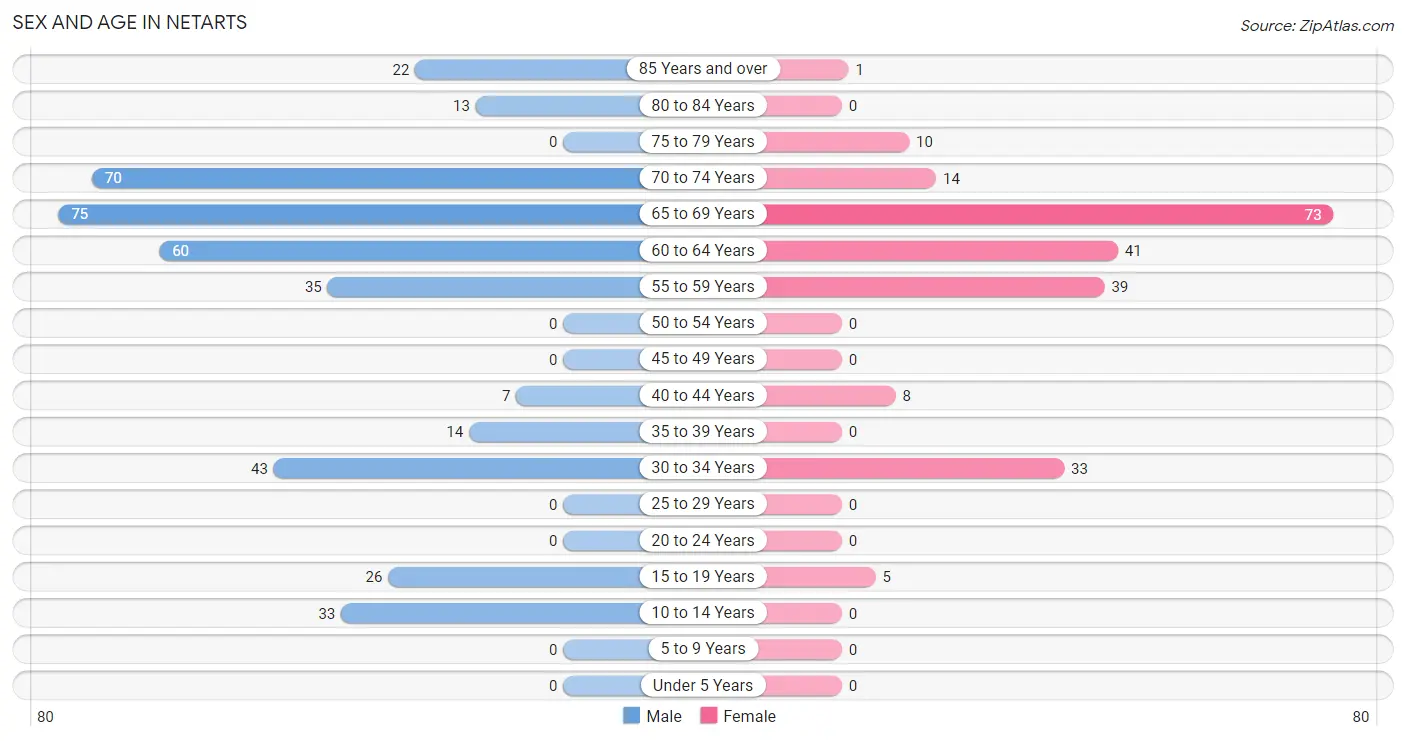
| Age Bracket | Male | Female |
| Under 5 Years | 0 (0.0%) | 0 (0.0%) |
| 5 to 9 Years | 0 (0.0%) | 0 (0.0%) |
| 10 to 14 Years | 33 (8.3%) | 0 (0.0%) |
| 15 to 19 Years | 26 (6.5%) | 5 (2.2%) |
| 20 to 24 Years | 0 (0.0%) | 0 (0.0%) |
| 25 to 29 Years | 0 (0.0%) | 0 (0.0%) |
| 30 to 34 Years | 43 (10.8%) | 33 (14.7%) |
| 35 to 39 Years | 14 (3.5%) | 0 (0.0%) |
| 40 to 44 Years | 7 (1.8%) | 8 (3.6%) |
| 45 to 49 Years | 0 (0.0%) | 0 (0.0%) |
| 50 to 54 Years | 0 (0.0%) | 0 (0.0%) |
| 55 to 59 Years | 35 (8.8%) | 39 (17.4%) |
| 60 to 64 Years | 60 (15.1%) | 41 (18.3%) |
| 65 to 69 Years | 75 (18.8%) | 73 (32.6%) |
| 70 to 74 Years | 70 (17.6%) | 14 (6.2%) |
| 75 to 79 Years | 0 (0.0%) | 10 (4.5%) |
| 80 to 84 Years | 13 (3.3%) | 0 (0.0%) |
| 85 Years and over | 22 (5.5%) | 1 (0.4%) |
| Total | 398 (100.0%) | 224 (100.0%) |
Families and Households in Netarts
Median Family Size in Netarts
The median family size in Netarts is 2.54 persons per family, with single female/mother families (1 | 0.5%) accounting for the largest median family size of 3 persons per family. On the other hand, married-couple families (182 | 96.3%) represent the smallest median family size with 2.54 persons per family.
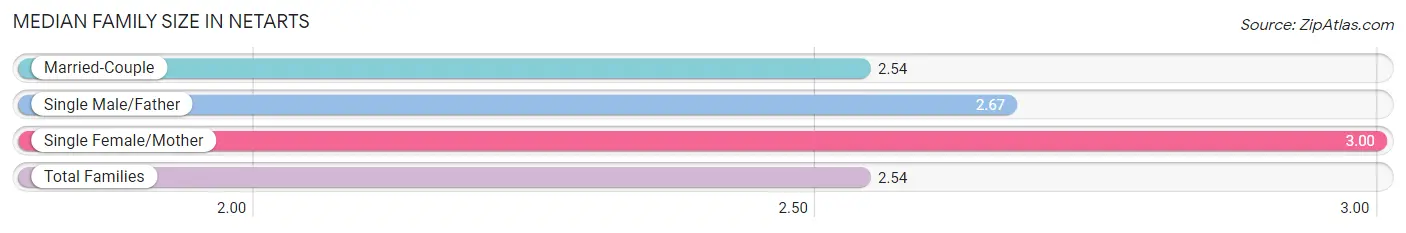
| Family Type | # Families | Family Size |
| Married-Couple | 182 (96.3%) | 2.54 |
| Single Male/Father | 6 (3.2%) | 2.67 |
| Single Female/Mother | 1 (0.5%) | 3.00 |
| Total Families | 189 (100.0%) | 2.54 |
Median Household Size in Netarts
The median household size in Netarts is 2.07 persons per household, with single female/mother households (1 | 0.3%) accounting for the largest median household size of 3 persons per household. non-family households (109 | 36.6%) represent the smallest median household size with 1.25 persons per household.
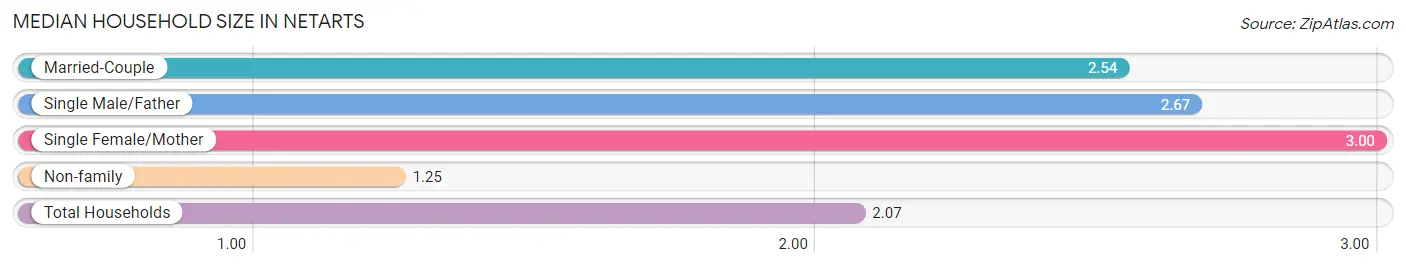
| Household Type | # Households | Household Size |
| Married-Couple | 182 (61.1%) | 2.54 |
| Single Male/Father | 6 (2.0%) | 2.67 |
| Single Female/Mother | 1 (0.3%) | 3.00 |
| Non-family | 109 (36.6%) | 1.25 |
| Total Households | 298 (100.0%) | 2.07 |
Household Size by Marriage Status in Netarts
Out of a total of 298 households in Netarts, 189 (63.4%) are family households, while 109 (36.6%) are nonfamily households. The most numerous type of family households are 2-person households, comprising 152, and the most common type of nonfamily households are 1-person households, comprising 86.
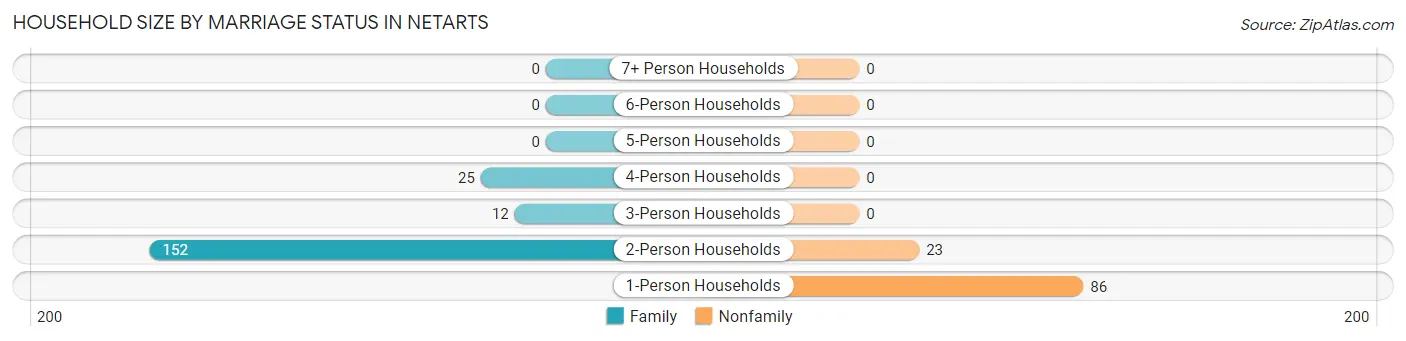
| Household Size | Family Households | Nonfamily Households |
| 1-Person Households | - | 86 (28.9%) |
| 2-Person Households | 152 (51.0%) | 23 (7.7%) |
| 3-Person Households | 12 (4.0%) | 0 (0.0%) |
| 4-Person Households | 25 (8.4%) | 0 (0.0%) |
| 5-Person Households | 0 (0.0%) | 0 (0.0%) |
| 6-Person Households | 0 (0.0%) | 0 (0.0%) |
| 7+ Person Households | 0 (0.0%) | 0 (0.0%) |
| Total | 189 (63.4%) | 109 (36.6%) |
Female Fertility in Netarts
Fertility by Age in Netarts
| Age Bracket | Women with Births | Births / 1,000 Women |
| 15 to 19 years | 0 (0.0%) | 0.0 |
| 20 to 34 years | 0 (0.0%) | 0.0 |
| 35 to 50 years | 0 (0.0%) | 0.0 |
| Total | 0 (0.0%) | 0.0 |
Fertility by Age by Marriage Status in Netarts
| Age Bracket | Married | Unmarried |
| 15 to 19 years | 0 (0.0%) | 0 (0.0%) |
| 20 to 34 years | 0 (0.0%) | 0 (0.0%) |
| 35 to 50 years | 0 (0.0%) | 0 (0.0%) |
| Total | 0 (0.0%) | 0 (0.0%) |
Fertility by Education in Netarts
| Educational Attainment | Women with Births | Births / 1,000 Women |
| Less than High School | 0 (0.0%) | 0.0 |
| High School Diploma | 0 (0.0%) | 0.0 |
| College or Associate's Degree | 0 (0.0%) | 0.0 |
| Bachelor's Degree | 0 (0.0%) | 0.0 |
| Graduate Degree | 0 (0.0%) | 0.0 |
| Total | 0 (0.0%) | 0.0 |
Fertility by Education by Marriage Status in Netarts
| Educational Attainment | Married | Unmarried |
| Less than High School | 0 (0.0%) | 0 (0.0%) |
| High School Diploma | 0 (0.0%) | 0 (0.0%) |
| College or Associate's Degree | 0 (0.0%) | 0 (0.0%) |
| Bachelor's Degree | 0 (0.0%) | 0 (0.0%) |
| Graduate Degree | 0 (0.0%) | 0 (0.0%) |
| Total | 0 (0.0%) | 0 (0.0%) |
Employment Characteristics in Netarts
Employment by Class of Employer in Netarts
Among the 242 employed individuals in Netarts, private company employees (136 | 56.2%), state government employees (79 | 32.6%), and self-employed (not incorporated) (14 | 5.8%) make up the most common classes of employment.
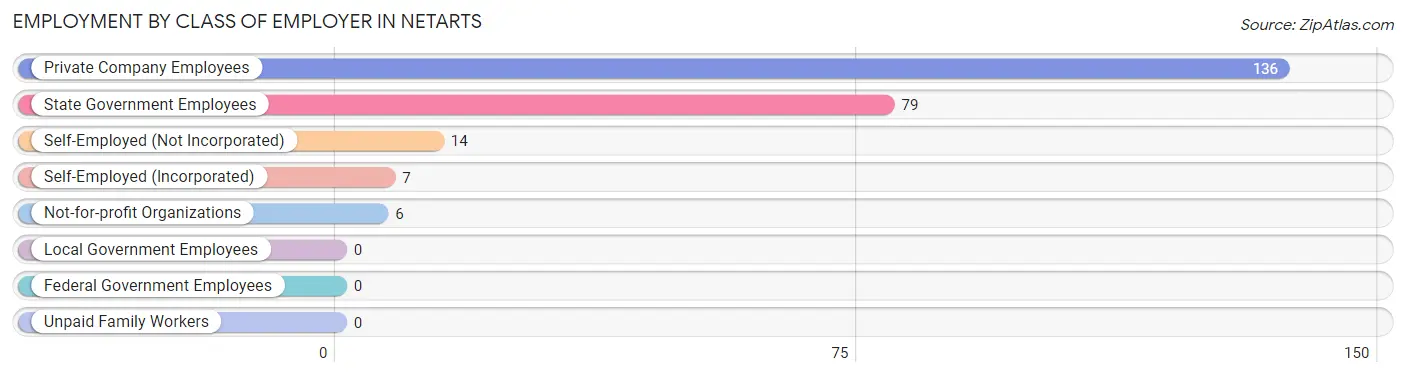
| Employer Class | # Employees | % Employees |
| Private Company Employees | 136 | 56.2% |
| Self-Employed (Incorporated) | 7 | 2.9% |
| Self-Employed (Not Incorporated) | 14 | 5.8% |
| Not-for-profit Organizations | 6 | 2.5% |
| Local Government Employees | 0 | 0.0% |
| State Government Employees | 79 | 32.6% |
| Federal Government Employees | 0 | 0.0% |
| Unpaid Family Workers | 0 | 0.0% |
| Total | 242 | 100.0% |
Employment Status by Age in Netarts
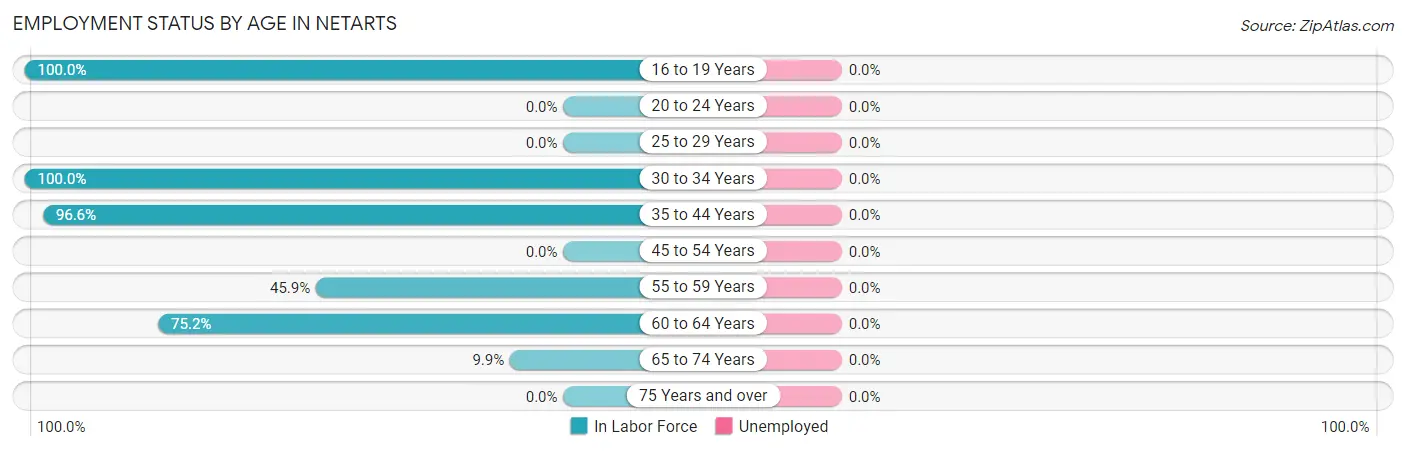
| Age Bracket | In Labor Force | Unemployed |
| 16 to 19 Years | 5 (100.0%) | 0 (0.0%) |
| 20 to 24 Years | 0 (0.0%) | 0 (0.0%) |
| 25 to 29 Years | 0 (0.0%) | 0 (0.0%) |
| 30 to 34 Years | 76 (100.0%) | 0 (0.0%) |
| 35 to 44 Years | 28 (96.6%) | 0 (0.0%) |
| 45 to 54 Years | 0 (0.0%) | 0 (0.0%) |
| 55 to 59 Years | 34 (45.9%) | 0 (0.0%) |
| 60 to 64 Years | 76 (75.2%) | 0 (0.0%) |
| 65 to 74 Years | 23 (9.9%) | 0 (0.0%) |
| 75 Years and over | 0 (0.0%) | 0 (0.0%) |
| Total | 242 (43.0%) | 0 (0.0%) |
Employment Status by Educational Attainment in Netarts
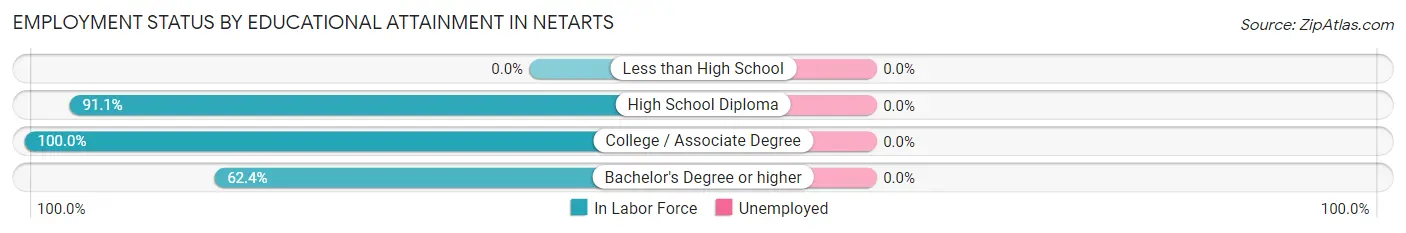
| Educational Attainment | In Labor Force | Unemployed |
| Less than High School | 0 (0.0%) | 0 (0.0%) |
| High School Diploma | 51 (91.1%) | 0 (0.0%) |
| College / Associate Degree | 105 (100.0%) | 0 (0.0%) |
| Bachelor's Degree or higher | 58 (62.4%) | 0 (0.0%) |
| Total | 214 (76.4%) | 0 (0.0%) |
Employment Occupations by Sex in Netarts
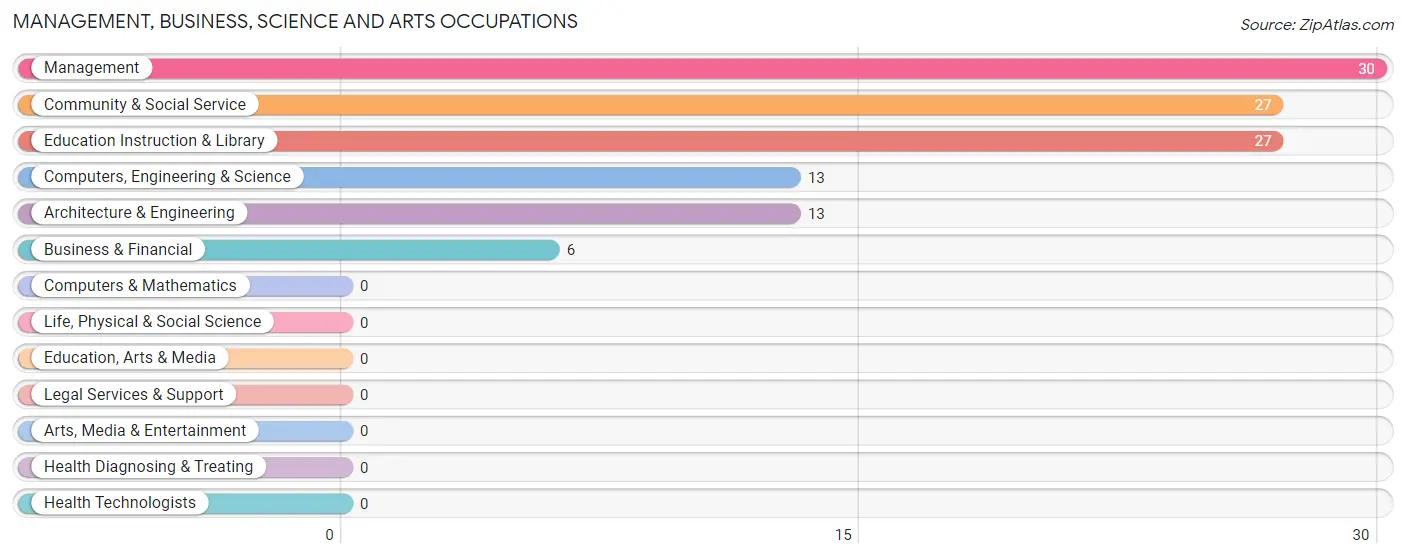
Management, Business, Science and Arts Occupations
The most common Management, Business, Science and Arts occupations in Netarts are Management (30 | 12.4%), Community & Social Service (27 | 11.2%), Education Instruction & Library (27 | 11.2%), Computers, Engineering & Science (13 | 5.4%), and Architecture & Engineering (13 | 5.4%).
Management, Business, Science and Arts Occupations by Sex
Within the Management, Business, Science and Arts occupations in Netarts, the most male-oriented occupations are Management (100.0%), Computers, Engineering & Science (100.0%), and Architecture & Engineering (100.0%), while the most female-oriented occupations are Business & Financial (100.0%), Community & Social Service (100.0%), and Education Instruction & Library (100.0%).
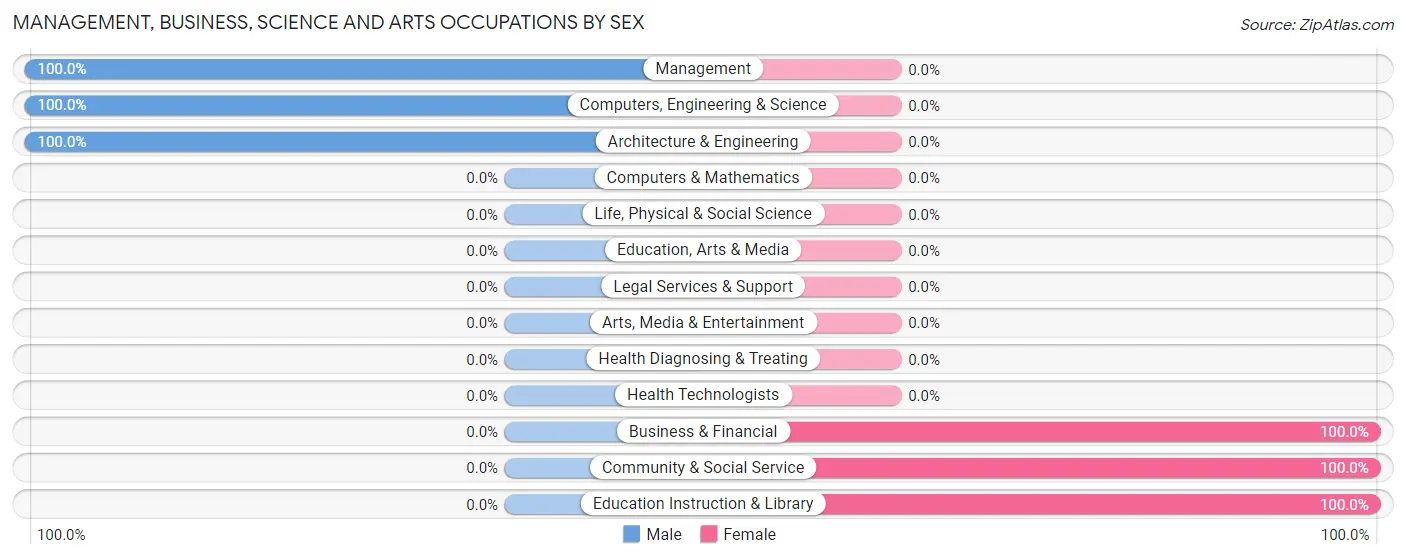
| Occupation | Male | Female |
| Management | 30 (100.0%) | 0 (0.0%) |
| Business & Financial | 0 (0.0%) | 6 (100.0%) |
| Computers, Engineering & Science | 13 (100.0%) | 0 (0.0%) |
| Computers & Mathematics | 0 (0.0%) | 0 (0.0%) |
| Architecture & Engineering | 13 (100.0%) | 0 (0.0%) |
| Life, Physical & Social Science | 0 (0.0%) | 0 (0.0%) |
| Community & Social Service | 0 (0.0%) | 27 (100.0%) |
| Education, Arts & Media | 0 (0.0%) | 0 (0.0%) |
| Legal Services & Support | 0 (0.0%) | 0 (0.0%) |
| Education Instruction & Library | 0 (0.0%) | 27 (100.0%) |
| Arts, Media & Entertainment | 0 (0.0%) | 0 (0.0%) |
| Health Diagnosing & Treating | 0 (0.0%) | 0 (0.0%) |
| Health Technologists | 0 (0.0%) | 0 (0.0%) |
| Total (Category) | 43 (56.6%) | 33 (43.4%) |
| Total (Overall) | 98 (40.5%) | 144 (59.5%) |
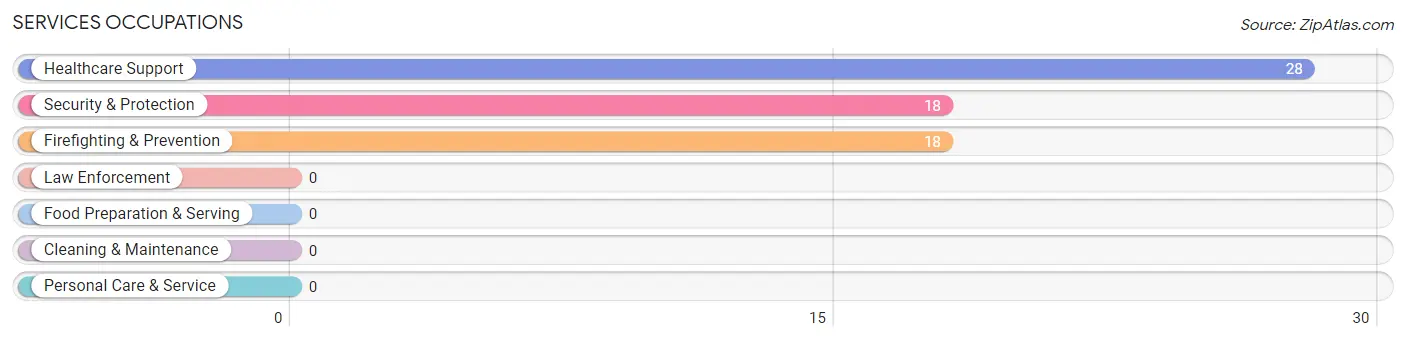
Services Occupations
The most common Services occupations in Netarts are Healthcare Support (28 | 11.6%), Security & Protection (18 | 7.4%), and Firefighting & Prevention (18 | 7.4%).
Services Occupations by Sex
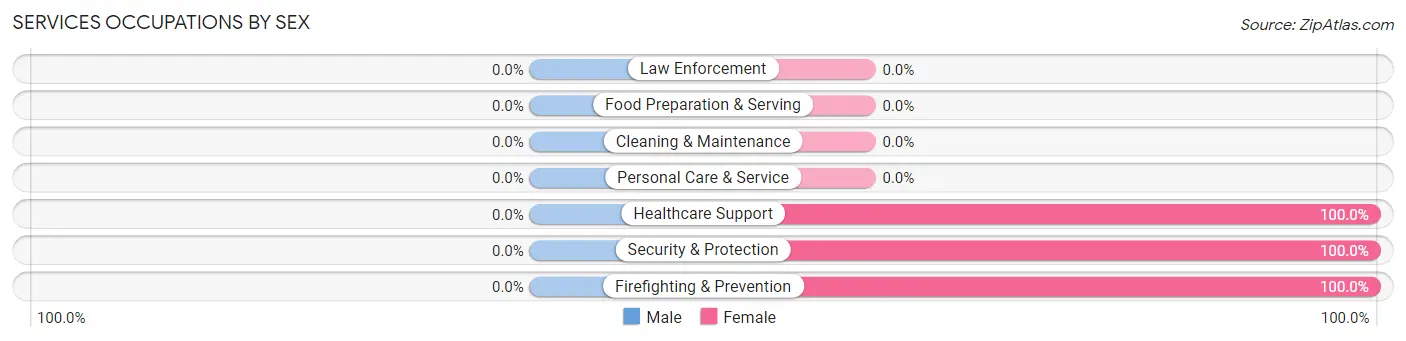
| Occupation | Male | Female |
| Healthcare Support | 0 (0.0%) | 28 (100.0%) |
| Security & Protection | 0 (0.0%) | 18 (100.0%) |
| Firefighting & Prevention | 0 (0.0%) | 18 (100.0%) |
| Law Enforcement | 0 (0.0%) | 0 (0.0%) |
| Food Preparation & Serving | 0 (0.0%) | 0 (0.0%) |
| Cleaning & Maintenance | 0 (0.0%) | 0 (0.0%) |
| Personal Care & Service | 0 (0.0%) | 0 (0.0%) |
| Total (Category) | 0 (0.0%) | 46 (100.0%) |
| Total (Overall) | 98 (40.5%) | 144 (59.5%) |
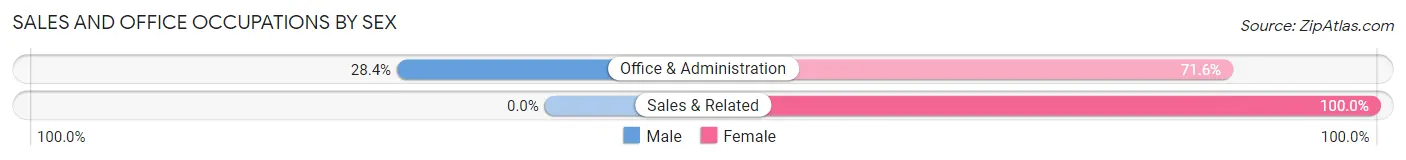
Sales and Office Occupations
The most common Sales and Office occupations in Netarts are Office & Administration (81 | 33.5%), and Sales & Related (7 | 2.9%).
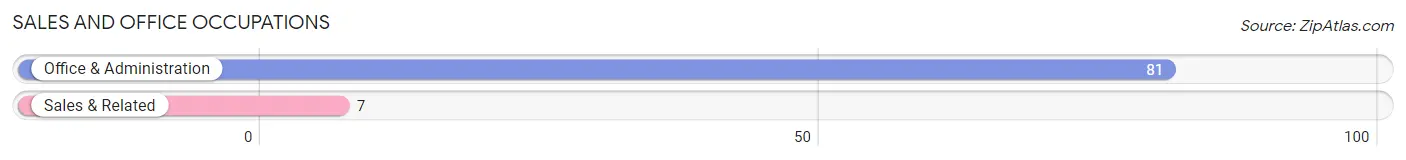
Sales and Office Occupations by Sex
| Occupation | Male | Female |
| Sales & Related | 0 (0.0%) | 7 (100.0%) |
| Office & Administration | 23 (28.4%) | 58 (71.6%) |
| Total (Category) | 23 (26.1%) | 65 (73.9%) |
| Total (Overall) | 98 (40.5%) | 144 (59.5%) |
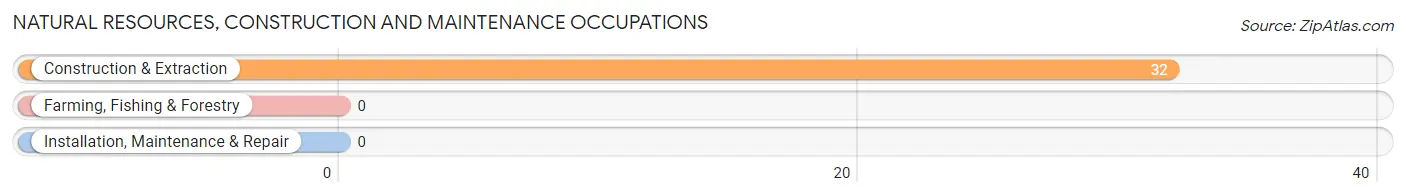
Natural Resources, Construction and Maintenance Occupations
The most common Natural Resources, Construction and Maintenance occupations in Netarts are , and Construction & Extraction (32 | 13.2%).
Natural Resources, Construction and Maintenance Occupations by Sex
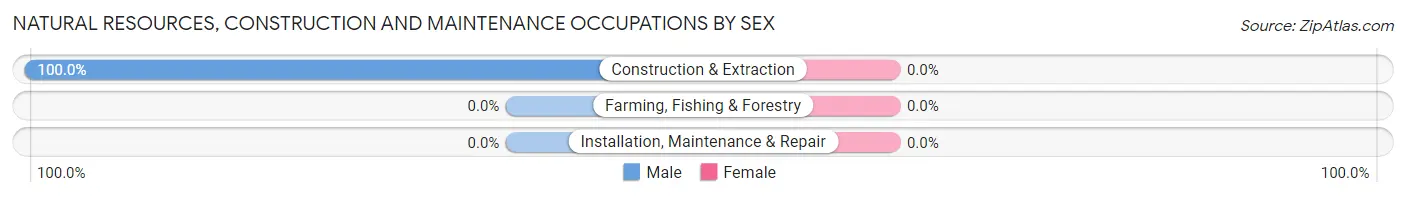
| Occupation | Male | Female |
| Farming, Fishing & Forestry | 0 (0.0%) | 0 (0.0%) |
| Construction & Extraction | 32 (100.0%) | 0 (0.0%) |
| Installation, Maintenance & Repair | 0 (0.0%) | 0 (0.0%) |
| Total (Category) | 32 (100.0%) | 0 (0.0%) |
| Total (Overall) | 98 (40.5%) | 144 (59.5%) |
Production, Transportation and Moving Occupations
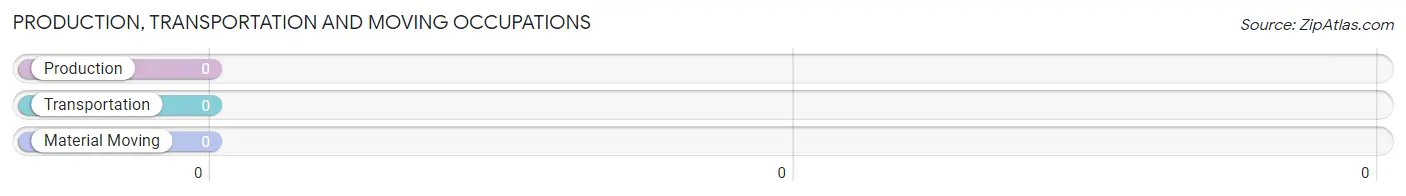
Production, Transportation and Moving Occupations by Sex
| Occupation | Male | Female |
| Production | 0 (0.0%) | 0 (0.0%) |
| Transportation | 0 (0.0%) | 0 (0.0%) |
| Material Moving | 0 (0.0%) | 0 (0.0%) |
| Total (Category) | 0 (0.0%) | 0 (0.0%) |
| Total (Overall) | 98 (40.5%) | 144 (59.5%) |
Employment Industries by Sex in Netarts
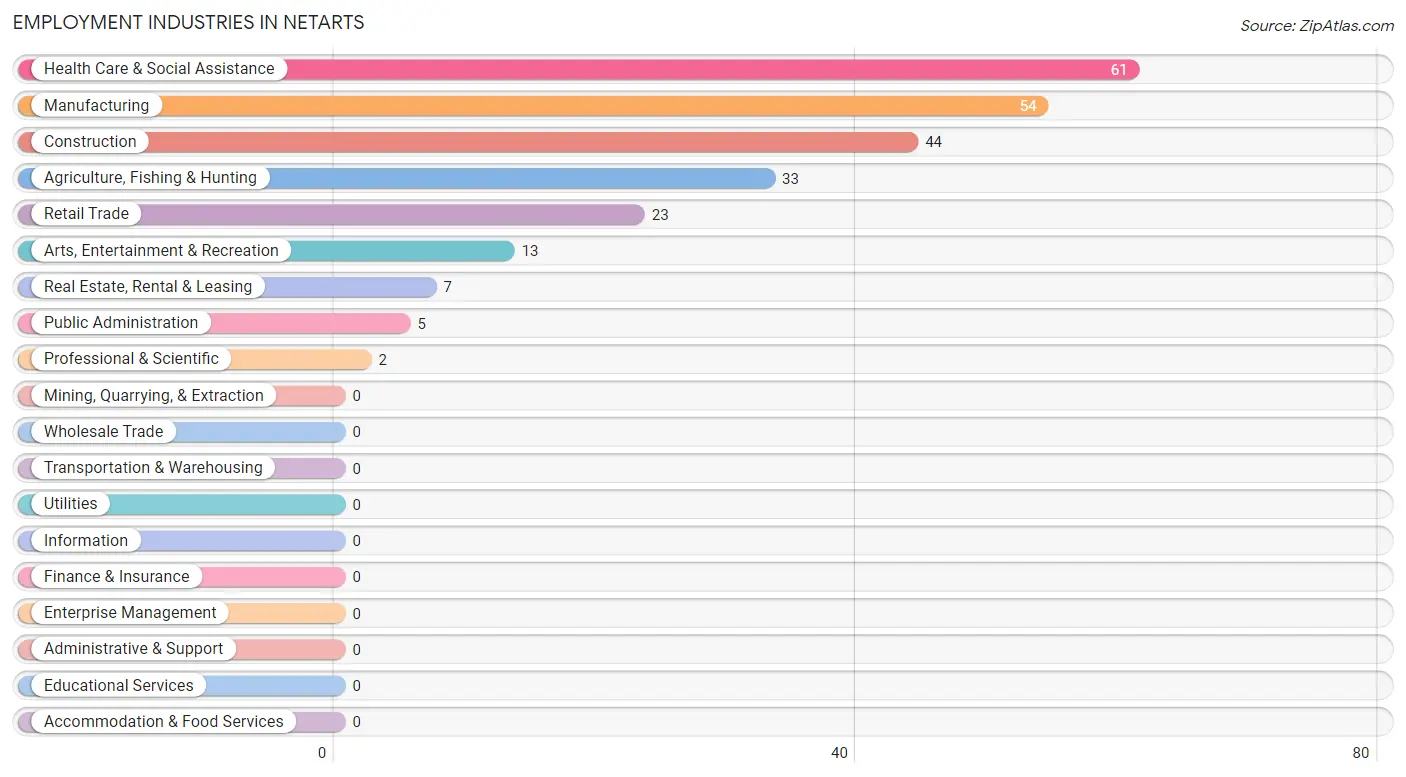
Employment Industries in Netarts
The major employment industries in Netarts include Health Care & Social Assistance (61 | 25.2%), Manufacturing (54 | 22.3%), Construction (44 | 18.2%), Agriculture, Fishing & Hunting (33 | 13.6%), and Retail Trade (23 | 9.5%).
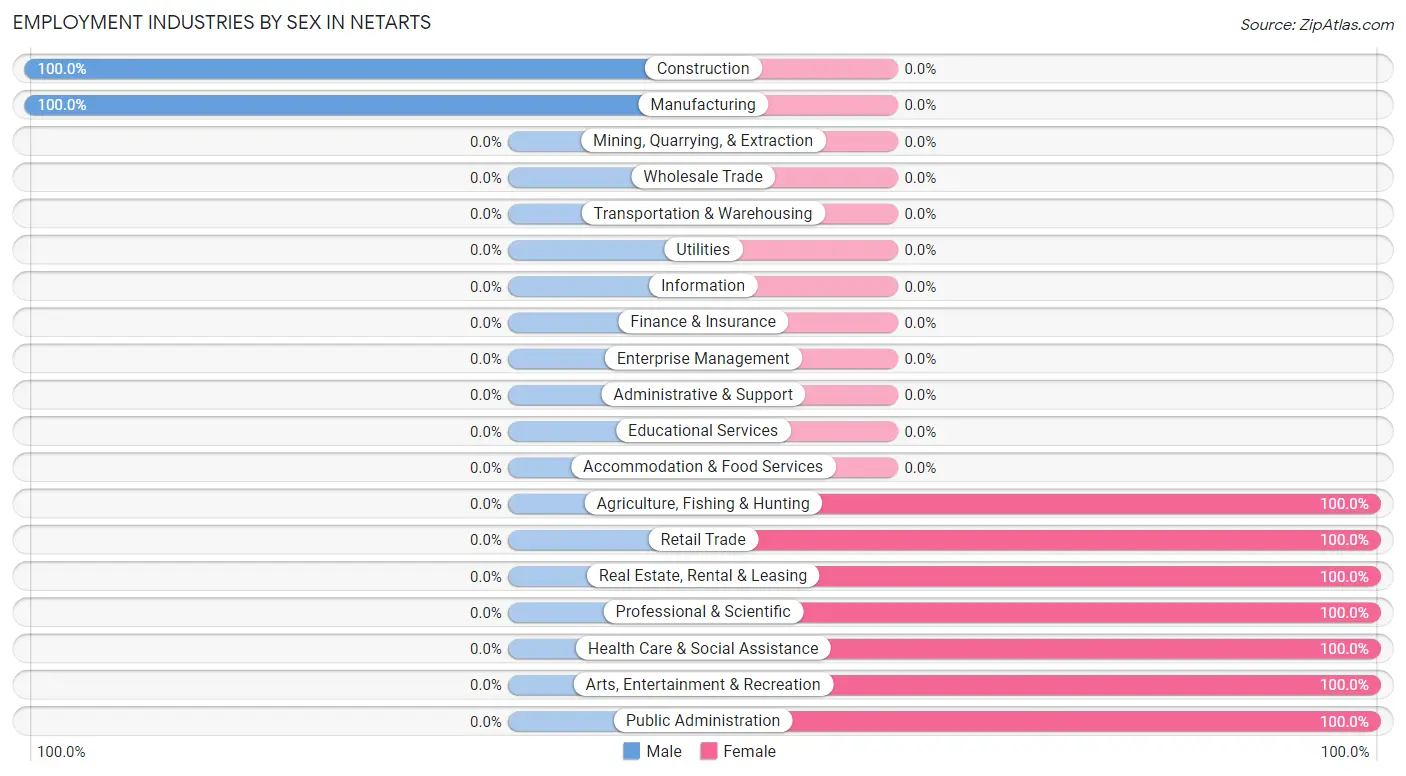
Employment Industries by Sex in Netarts
The Netarts industries that see more men than women are Construction (100.0%), and Manufacturing (100.0%), whereas the industries that tend to have a higher number of women are Agriculture, Fishing & Hunting (100.0%), Retail Trade (100.0%), and Real Estate, Rental & Leasing (100.0%).
| Industry | Male | Female |
| Agriculture, Fishing & Hunting | 0 (0.0%) | 33 (100.0%) |
| Mining, Quarrying, & Extraction | 0 (0.0%) | 0 (0.0%) |
| Construction | 44 (100.0%) | 0 (0.0%) |
| Manufacturing | 54 (100.0%) | 0 (0.0%) |
| Wholesale Trade | 0 (0.0%) | 0 (0.0%) |
| Retail Trade | 0 (0.0%) | 23 (100.0%) |
| Transportation & Warehousing | 0 (0.0%) | 0 (0.0%) |
| Utilities | 0 (0.0%) | 0 (0.0%) |
| Information | 0 (0.0%) | 0 (0.0%) |
| Finance & Insurance | 0 (0.0%) | 0 (0.0%) |
| Real Estate, Rental & Leasing | 0 (0.0%) | 7 (100.0%) |
| Professional & Scientific | 0 (0.0%) | 2 (100.0%) |
| Enterprise Management | 0 (0.0%) | 0 (0.0%) |
| Administrative & Support | 0 (0.0%) | 0 (0.0%) |
| Educational Services | 0 (0.0%) | 0 (0.0%) |
| Health Care & Social Assistance | 0 (0.0%) | 61 (100.0%) |
| Arts, Entertainment & Recreation | 0 (0.0%) | 13 (100.0%) |
| Accommodation & Food Services | 0 (0.0%) | 0 (0.0%) |
| Public Administration | 0 (0.0%) | 5 (100.0%) |
| Total | 98 (40.5%) | 144 (59.5%) |
Education in Netarts
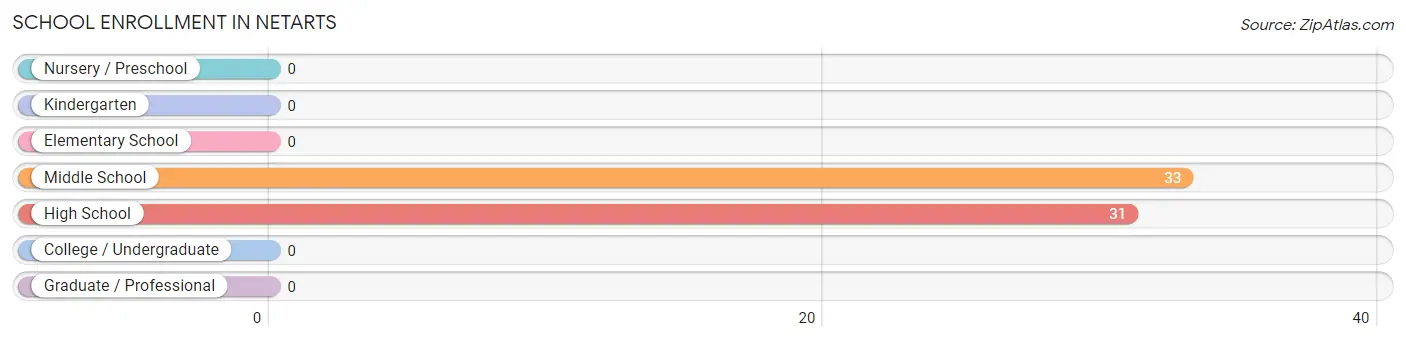
School Enrollment in Netarts
The most common levels of schooling among the 64 students in Netarts are middle school (33 | 51.6%), and high school (31 | 48.4%).
| School Level | # Students | % Students |
| Nursery / Preschool | 0 | 0.0% |
| Kindergarten | 0 | 0.0% |
| Elementary School | 0 | 0.0% |
| Middle School | 33 | 51.6% |
| High School | 31 | 48.4% |
| College / Undergraduate | 0 | 0.0% |
| Graduate / Professional | 0 | 0.0% |
| Total | 64 | 100.0% |
School Enrollment by Age by Funding Source in Netarts
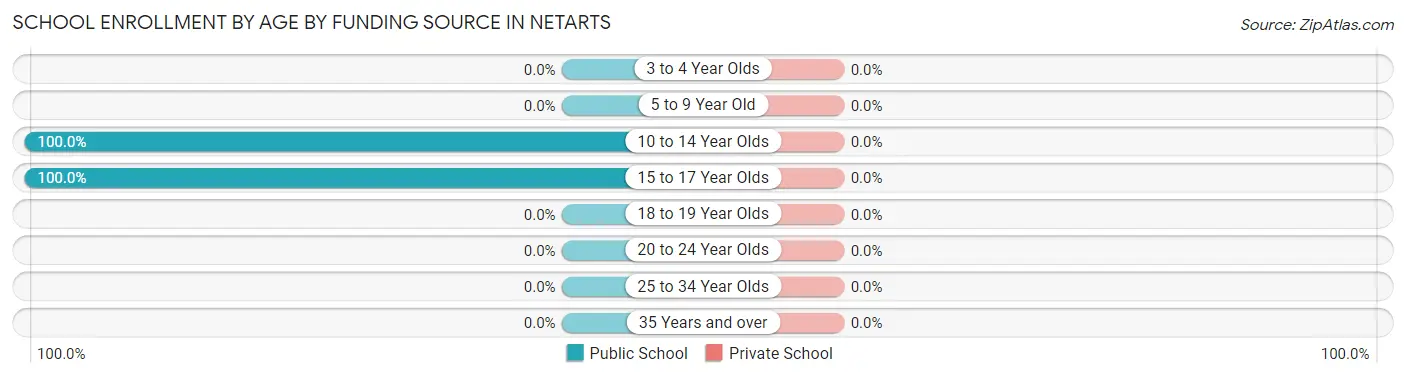
| Age Bracket | Public School | Private School |
| 3 to 4 Year Olds | 0 (0.0%) | 0 (0.0%) |
| 5 to 9 Year Old | 0 (0.0%) | 0 (0.0%) |
| 10 to 14 Year Olds | 33 (100.0%) | 0 (0.0%) |
| 15 to 17 Year Olds | 31 (100.0%) | 0 (0.0%) |
| 18 to 19 Year Olds | 0 (0.0%) | 0 (0.0%) |
| 20 to 24 Year Olds | 0 (0.0%) | 0 (0.0%) |
| 25 to 34 Year Olds | 0 (0.0%) | 0 (0.0%) |
| 35 Years and over | 0 (0.0%) | 0 (0.0%) |
| Total | 64 (100.0%) | 0 (0.0%) |
Educational Attainment by Field of Study in Netarts
Business (48 | 28.6%), bio, nature & agricultural (33 | 19.6%), social sciences (24 | 14.3%), engineering (24 | 14.3%), and education (20 | 11.9%) are the most common fields of study among 168 individuals in Netarts who have obtained a bachelor's degree or higher.
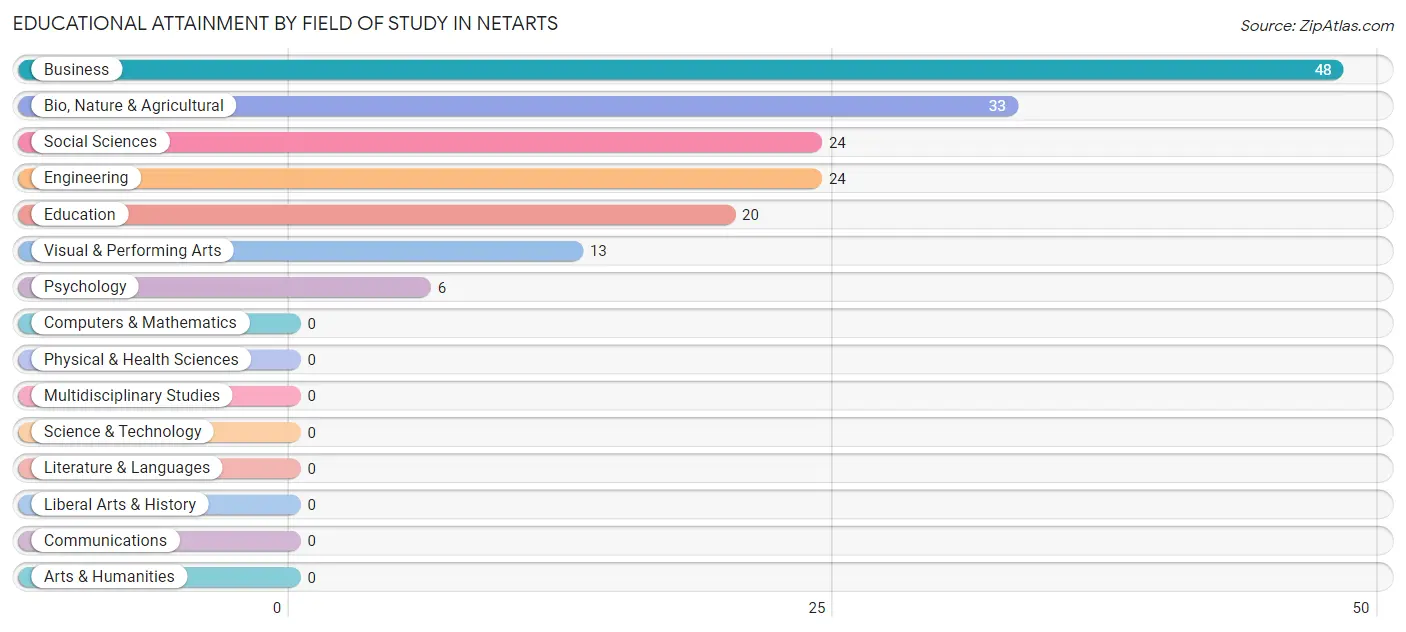
| Field of Study | # Graduates | % Graduates |
| Computers & Mathematics | 0 | 0.0% |
| Bio, Nature & Agricultural | 33 | 19.6% |
| Physical & Health Sciences | 0 | 0.0% |
| Psychology | 6 | 3.6% |
| Social Sciences | 24 | 14.3% |
| Engineering | 24 | 14.3% |
| Multidisciplinary Studies | 0 | 0.0% |
| Science & Technology | 0 | 0.0% |
| Business | 48 | 28.6% |
| Education | 20 | 11.9% |
| Literature & Languages | 0 | 0.0% |
| Liberal Arts & History | 0 | 0.0% |
| Visual & Performing Arts | 13 | 7.7% |
| Communications | 0 | 0.0% |
| Arts & Humanities | 0 | 0.0% |
| Total | 168 | 100.0% |
Transportation & Commute in Netarts
Vehicle Availability by Sex in Netarts
The most prevalent vehicle ownership categories in Netarts are males with 2 vehicles (44, accounting for 44.9%) and females with 2 vehicles (48, making up 30.6%).
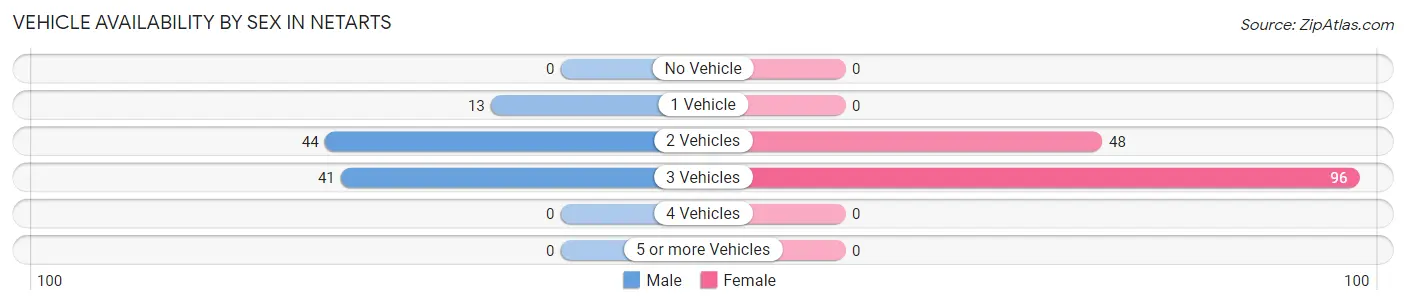
| Vehicles Available | Male | Female |
| No Vehicle | 0 (0.0%) | 0 (0.0%) |
| 1 Vehicle | 13 (13.3%) | 0 (0.0%) |
| 2 Vehicles | 44 (44.9%) | 48 (33.3%) |
| 3 Vehicles | 41 (41.8%) | 96 (66.7%) |
| 4 Vehicles | 0 (0.0%) | 0 (0.0%) |
| 5 or more Vehicles | 0 (0.0%) | 0 (0.0%) |
| Total | 98 (100.0%) | 144 (100.0%) |
Commute Time in Netarts
The most frequently occuring commute durations in Netarts are 15 to 19 minutes (60 commuters, 25.4%), 10 to 14 minutes (50 commuters, 21.2%), and 60 to 89 minutes (46 commuters, 19.5%).
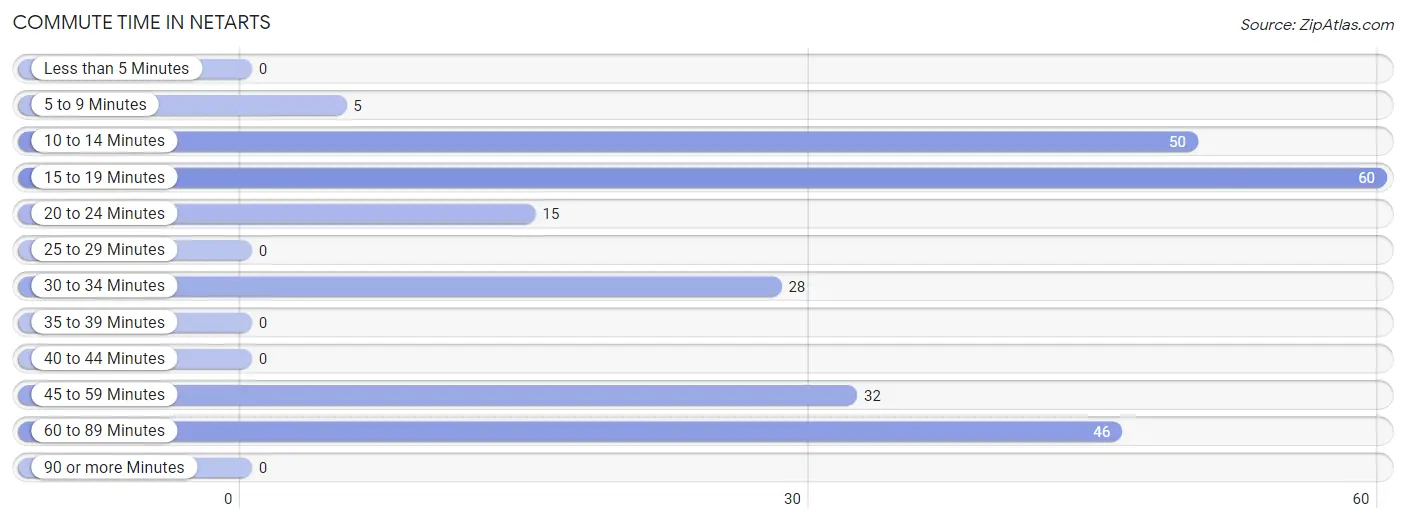
| Commute Time | # Commuters | % Commuters |
| Less than 5 Minutes | 0 | 0.0% |
| 5 to 9 Minutes | 5 | 2.1% |
| 10 to 14 Minutes | 50 | 21.2% |
| 15 to 19 Minutes | 60 | 25.4% |
| 20 to 24 Minutes | 15 | 6.4% |
| 25 to 29 Minutes | 0 | 0.0% |
| 30 to 34 Minutes | 28 | 11.9% |
| 35 to 39 Minutes | 0 | 0.0% |
| 40 to 44 Minutes | 0 | 0.0% |
| 45 to 59 Minutes | 32 | 13.6% |
| 60 to 89 Minutes | 46 | 19.5% |
| 90 or more Minutes | 0 | 0.0% |
Commute Time by Sex in Netarts
The most common commute times in Netarts are 45 to 59 minutes (32 commuters, 32.7%) for males and 60 to 89 minutes (33 commuters, 23.9%) for females.
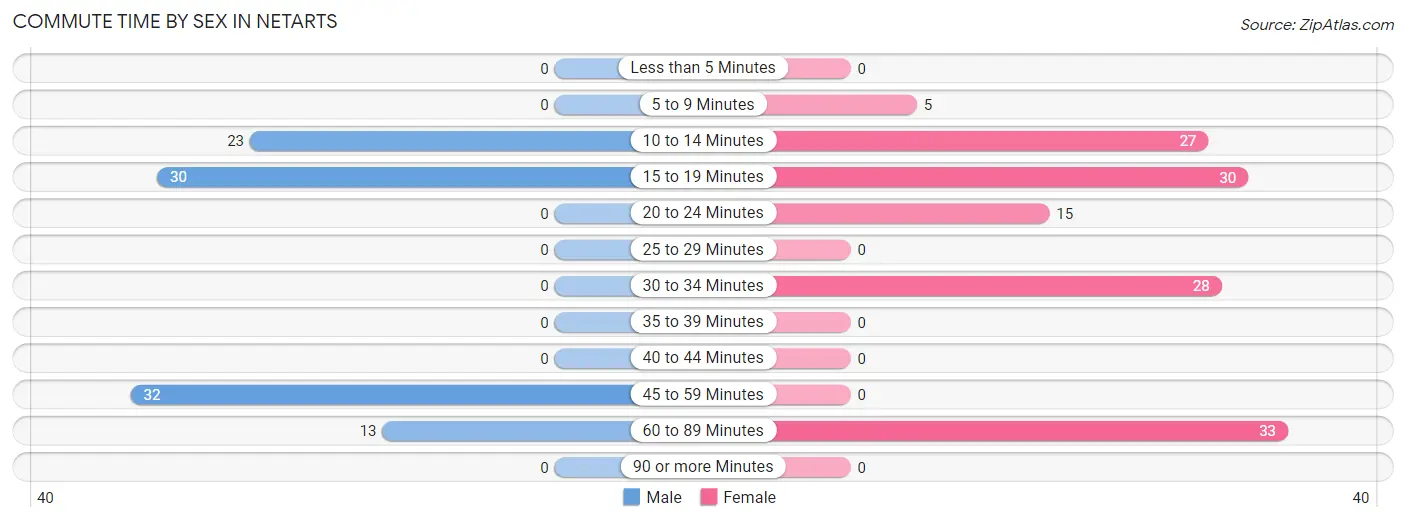
| Commute Time | Male | Female |
| Less than 5 Minutes | 0 (0.0%) | 0 (0.0%) |
| 5 to 9 Minutes | 0 (0.0%) | 5 (3.6%) |
| 10 to 14 Minutes | 23 (23.5%) | 27 (19.6%) |
| 15 to 19 Minutes | 30 (30.6%) | 30 (21.7%) |
| 20 to 24 Minutes | 0 (0.0%) | 15 (10.9%) |
| 25 to 29 Minutes | 0 (0.0%) | 0 (0.0%) |
| 30 to 34 Minutes | 0 (0.0%) | 28 (20.3%) |
| 35 to 39 Minutes | 0 (0.0%) | 0 (0.0%) |
| 40 to 44 Minutes | 0 (0.0%) | 0 (0.0%) |
| 45 to 59 Minutes | 32 (32.7%) | 0 (0.0%) |
| 60 to 89 Minutes | 13 (13.3%) | 33 (23.9%) |
| 90 or more Minutes | 0 (0.0%) | 0 (0.0%) |
Time of Departure to Work by Sex in Netarts
The most frequent times of departure to work in Netarts are 12:00 AM to 4:59 AM (32, 32.7%) for males and 7:30 AM to 7:59 AM (55, 39.9%) for females.
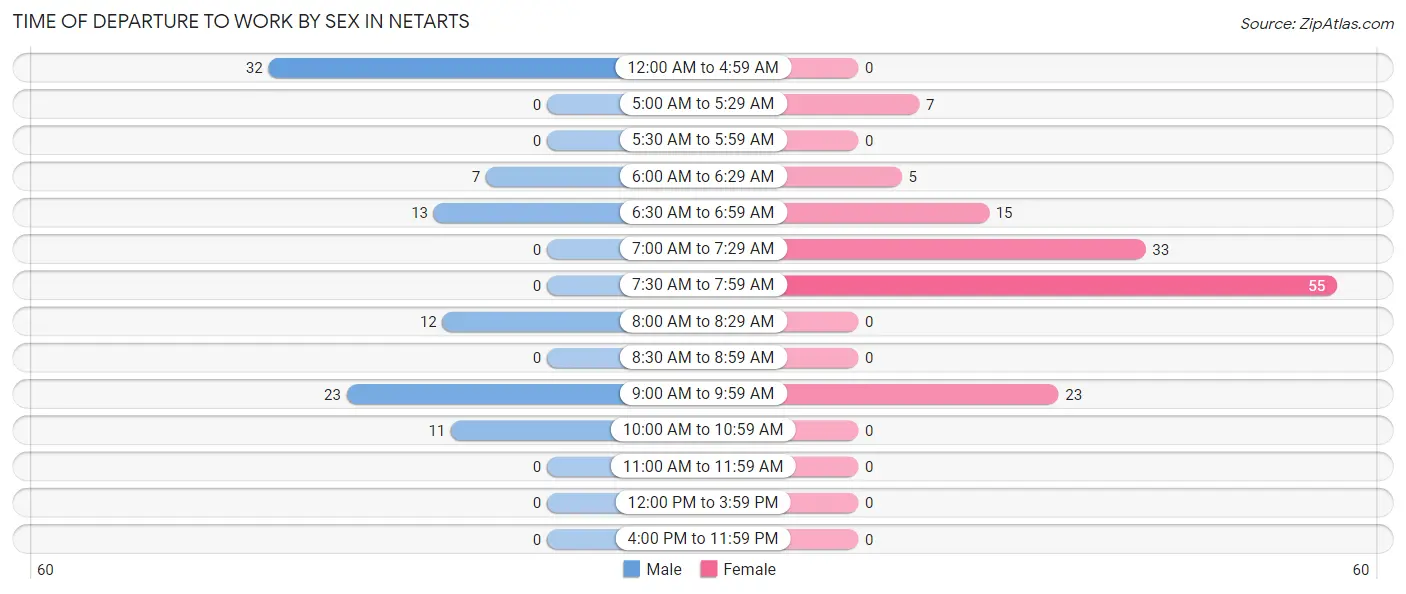
| Time of Departure | Male | Female |
| 12:00 AM to 4:59 AM | 32 (32.7%) | 0 (0.0%) |
| 5:00 AM to 5:29 AM | 0 (0.0%) | 7 (5.1%) |
| 5:30 AM to 5:59 AM | 0 (0.0%) | 0 (0.0%) |
| 6:00 AM to 6:29 AM | 7 (7.1%) | 5 (3.6%) |
| 6:30 AM to 6:59 AM | 13 (13.3%) | 15 (10.9%) |
| 7:00 AM to 7:29 AM | 0 (0.0%) | 33 (23.9%) |
| 7:30 AM to 7:59 AM | 0 (0.0%) | 55 (39.9%) |
| 8:00 AM to 8:29 AM | 12 (12.2%) | 0 (0.0%) |
| 8:30 AM to 8:59 AM | 0 (0.0%) | 0 (0.0%) |
| 9:00 AM to 9:59 AM | 23 (23.5%) | 23 (16.7%) |
| 10:00 AM to 10:59 AM | 11 (11.2%) | 0 (0.0%) |
| 11:00 AM to 11:59 AM | 0 (0.0%) | 0 (0.0%) |
| 12:00 PM to 3:59 PM | 0 (0.0%) | 0 (0.0%) |
| 4:00 PM to 11:59 PM | 0 (0.0%) | 0 (0.0%) |
| Total | 98 (100.0%) | 138 (100.0%) |
Housing Occupancy in Netarts
Occupancy by Ownership in Netarts
Of the total 298 dwellings in Netarts, owner-occupied units account for 196 (65.8%), while renter-occupied units make up 102 (34.2%).
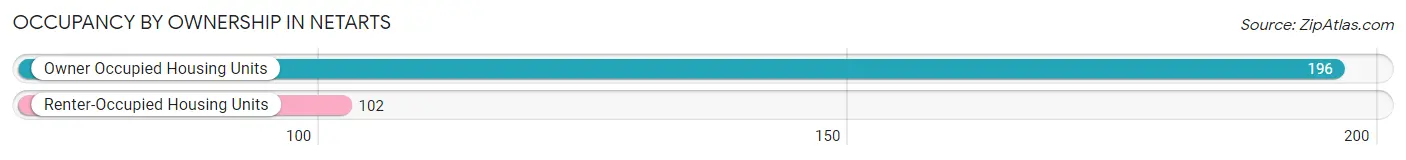
| Occupancy | # Housing Units | % Housing Units |
| Owner Occupied Housing Units | 196 | 65.8% |
| Renter-Occupied Housing Units | 102 | 34.2% |
| Total Occupied Housing Units | 298 | 100.0% |
Occupancy by Household Size in Netarts
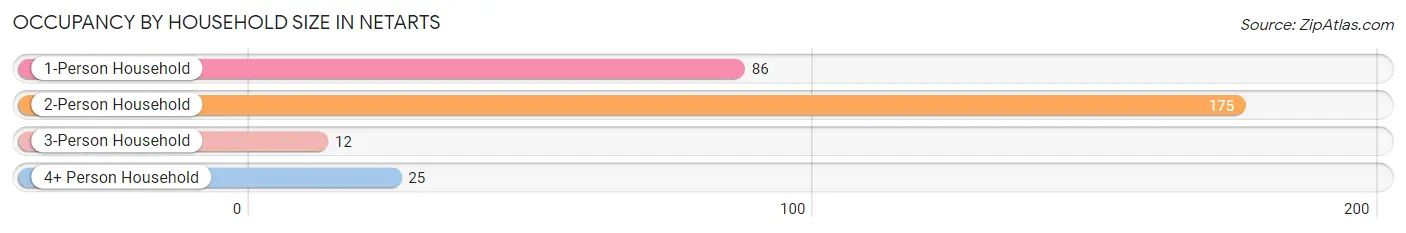
| Household Size | # Housing Units | % Housing Units |
| 1-Person Household | 86 | 28.9% |
| 2-Person Household | 175 | 58.7% |
| 3-Person Household | 12 | 4.0% |
| 4+ Person Household | 25 | 8.4% |
| Total Housing Units | 298 | 100.0% |
Occupancy by Ownership by Household Size in Netarts
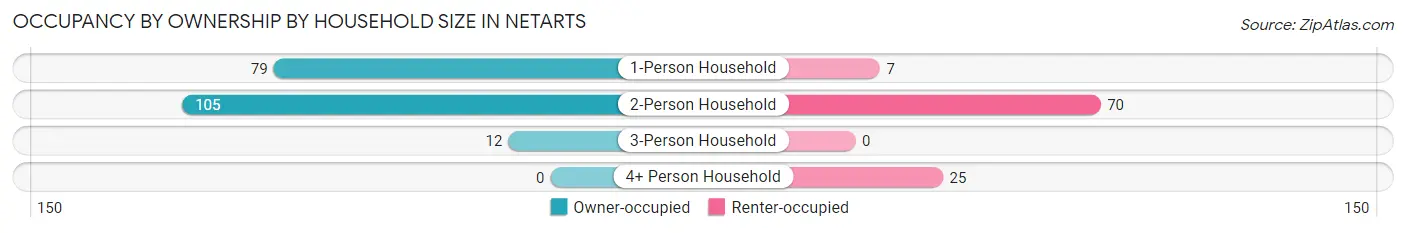
| Household Size | Owner-occupied | Renter-occupied |
| 1-Person Household | 79 (91.9%) | 7 (8.1%) |
| 2-Person Household | 105 (60.0%) | 70 (40.0%) |
| 3-Person Household | 12 (100.0%) | 0 (0.0%) |
| 4+ Person Household | 0 (0.0%) | 25 (100.0%) |
| Total Housing Units | 196 (65.8%) | 102 (34.2%) |
Occupancy by Educational Attainment in Netarts
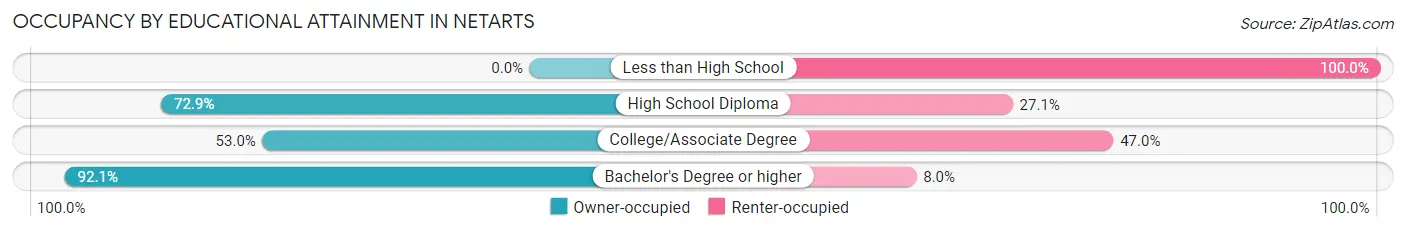
| Household Size | Owner-occupied | Renter-occupied |
| Less than High School | 0 (0.0%) | 25 (100.0%) |
| High School Diploma | 62 (72.9%) | 23 (27.1%) |
| College/Associate Degree | 53 (53.0%) | 47 (47.0%) |
| Bachelor's Degree or higher | 81 (92.0%) | 7 (8.0%) |
Occupancy by Age of Householder in Netarts
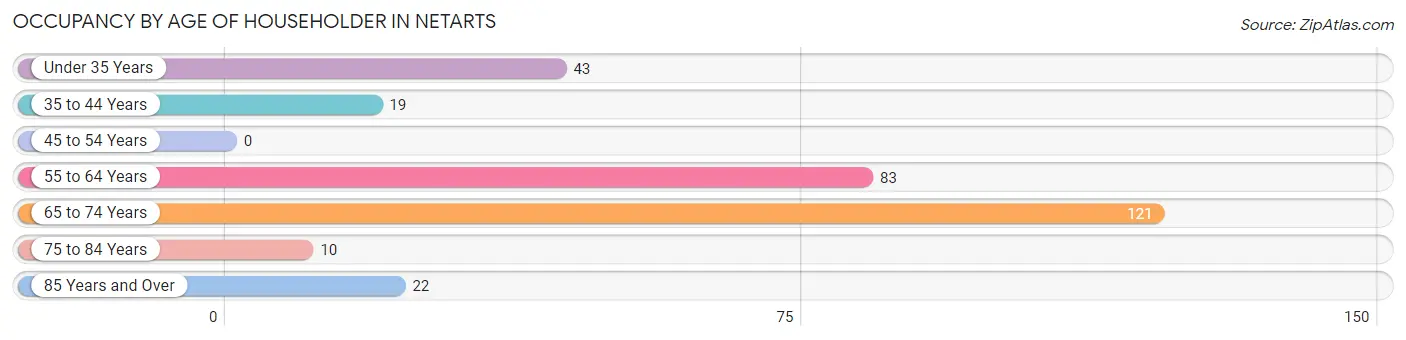
| Age Bracket | # Households | % Households |
| Under 35 Years | 43 | 14.4% |
| 35 to 44 Years | 19 | 6.4% |
| 45 to 54 Years | 0 | 0.0% |
| 55 to 64 Years | 83 | 27.9% |
| 65 to 74 Years | 121 | 40.6% |
| 75 to 84 Years | 10 | 3.4% |
| 85 Years and Over | 22 | 7.4% |
| Total | 298 | 100.0% |
Housing Finances in Netarts
Median Income by Occupancy in Netarts
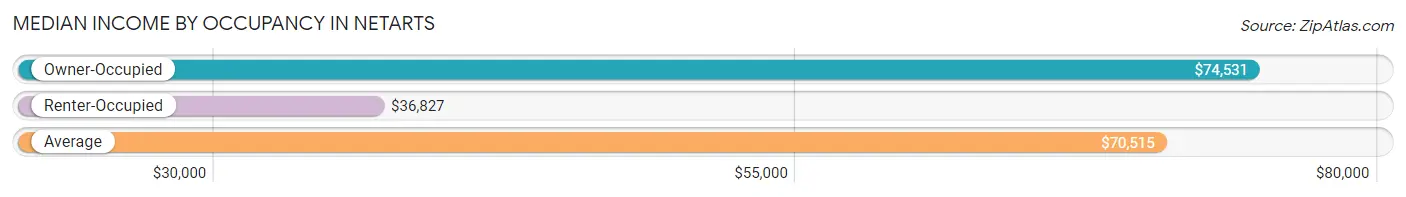
| Occupancy Type | # Households | Median Income |
| Owner-Occupied | 196 (65.8%) | $74,531 |
| Renter-Occupied | 102 (34.2%) | $36,827 |
| Average | 298 (100.0%) | $70,515 |
Occupancy by Householder Income Bracket in Netarts
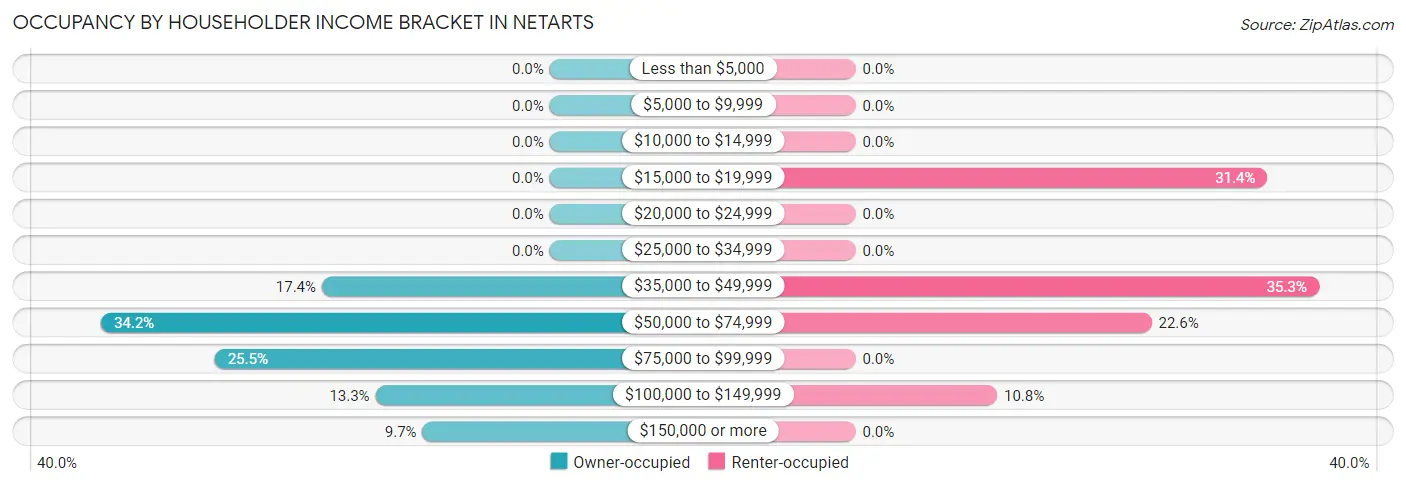
| Income Bracket | Owner-occupied | Renter-occupied |
| Less than $5,000 | 0 (0.0%) | 0 (0.0%) |
| $5,000 to $9,999 | 0 (0.0%) | 0 (0.0%) |
| $10,000 to $14,999 | 0 (0.0%) | 0 (0.0%) |
| $15,000 to $19,999 | 0 (0.0%) | 32 (31.4%) |
| $20,000 to $24,999 | 0 (0.0%) | 0 (0.0%) |
| $25,000 to $34,999 | 0 (0.0%) | 0 (0.0%) |
| $35,000 to $49,999 | 34 (17.3%) | 36 (35.3%) |
| $50,000 to $74,999 | 67 (34.2%) | 23 (22.6%) |
| $75,000 to $99,999 | 50 (25.5%) | 0 (0.0%) |
| $100,000 to $149,999 | 26 (13.3%) | 11 (10.8%) |
| $150,000 or more | 19 (9.7%) | 0 (0.0%) |
| Total | 196 (100.0%) | 102 (100.0%) |
Monthly Housing Cost Tiers in Netarts
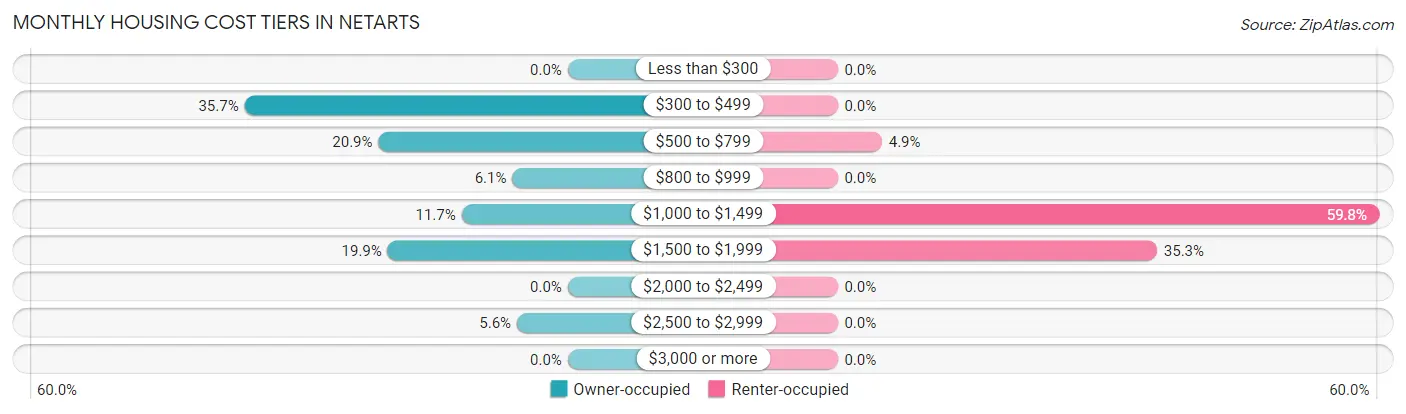
| Monthly Cost | Owner-occupied | Renter-occupied |
| Less than $300 | 0 (0.0%) | 0 (0.0%) |
| $300 to $499 | 70 (35.7%) | 0 (0.0%) |
| $500 to $799 | 41 (20.9%) | 5 (4.9%) |
| $800 to $999 | 12 (6.1%) | 0 (0.0%) |
| $1,000 to $1,499 | 23 (11.7%) | 61 (59.8%) |
| $1,500 to $1,999 | 39 (19.9%) | 36 (35.3%) |
| $2,000 to $2,499 | 0 (0.0%) | 0 (0.0%) |
| $2,500 to $2,999 | 11 (5.6%) | 0 (0.0%) |
| $3,000 or more | 0 (0.0%) | 0 (0.0%) |
| Total | 196 (100.0%) | 102 (100.0%) |
Physical Housing Characteristics in Netarts
Housing Structures in Netarts
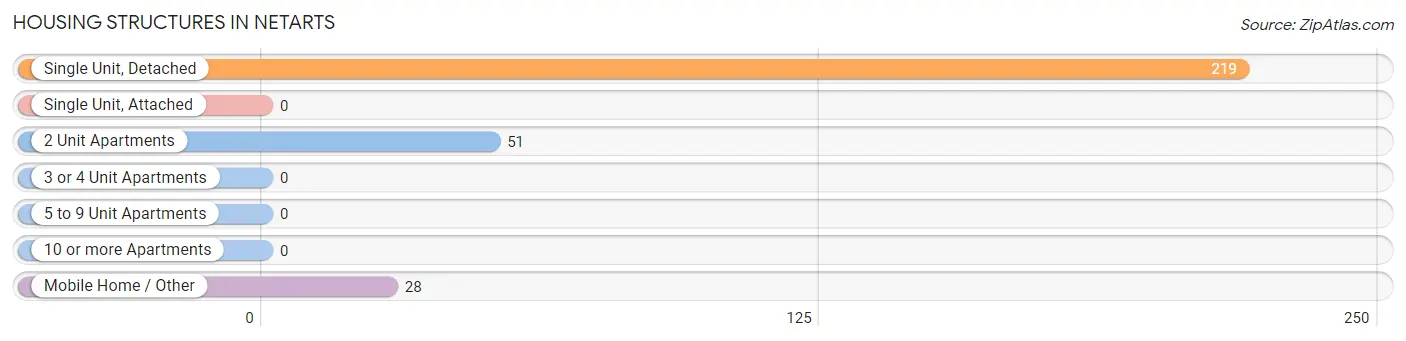
| Structure Type | # Housing Units | % Housing Units |
| Single Unit, Detached | 219 | 73.5% |
| Single Unit, Attached | 0 | 0.0% |
| 2 Unit Apartments | 51 | 17.1% |
| 3 or 4 Unit Apartments | 0 | 0.0% |
| 5 to 9 Unit Apartments | 0 | 0.0% |
| 10 or more Apartments | 0 | 0.0% |
| Mobile Home / Other | 28 | 9.4% |
| Total | 298 | 100.0% |
Housing Structures by Occupancy in Netarts
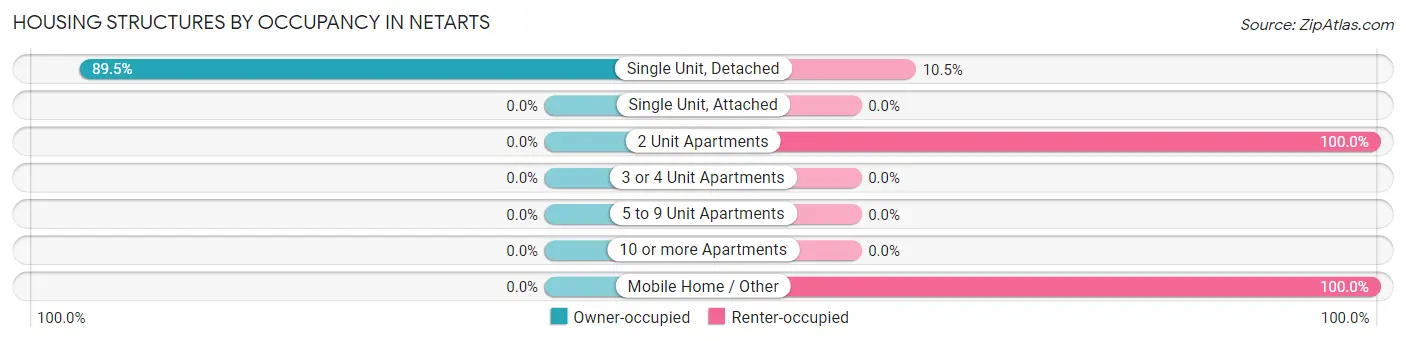
| Structure Type | Owner-occupied | Renter-occupied |
| Single Unit, Detached | 196 (89.5%) | 23 (10.5%) |
| Single Unit, Attached | 0 (0.0%) | 0 (0.0%) |
| 2 Unit Apartments | 0 (0.0%) | 51 (100.0%) |
| 3 or 4 Unit Apartments | 0 (0.0%) | 0 (0.0%) |
| 5 to 9 Unit Apartments | 0 (0.0%) | 0 (0.0%) |
| 10 or more Apartments | 0 (0.0%) | 0 (0.0%) |
| Mobile Home / Other | 0 (0.0%) | 28 (100.0%) |
| Total | 196 (65.8%) | 102 (34.2%) |
Housing Structures by Number of Rooms in Netarts
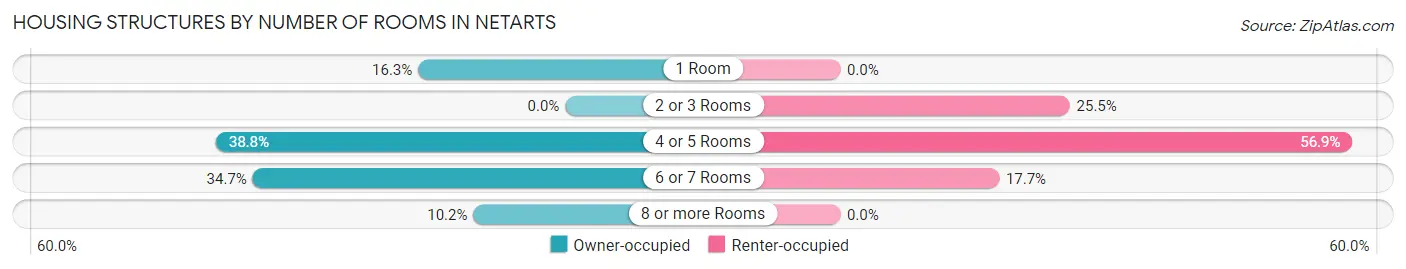
| Number of Rooms | Owner-occupied | Renter-occupied |
| 1 Room | 32 (16.3%) | 0 (0.0%) |
| 2 or 3 Rooms | 0 (0.0%) | 26 (25.5%) |
| 4 or 5 Rooms | 76 (38.8%) | 58 (56.9%) |
| 6 or 7 Rooms | 68 (34.7%) | 18 (17.6%) |
| 8 or more Rooms | 20 (10.2%) | 0 (0.0%) |
| Total | 196 (100.0%) | 102 (100.0%) |
Housing Structure by Heating Type in Netarts
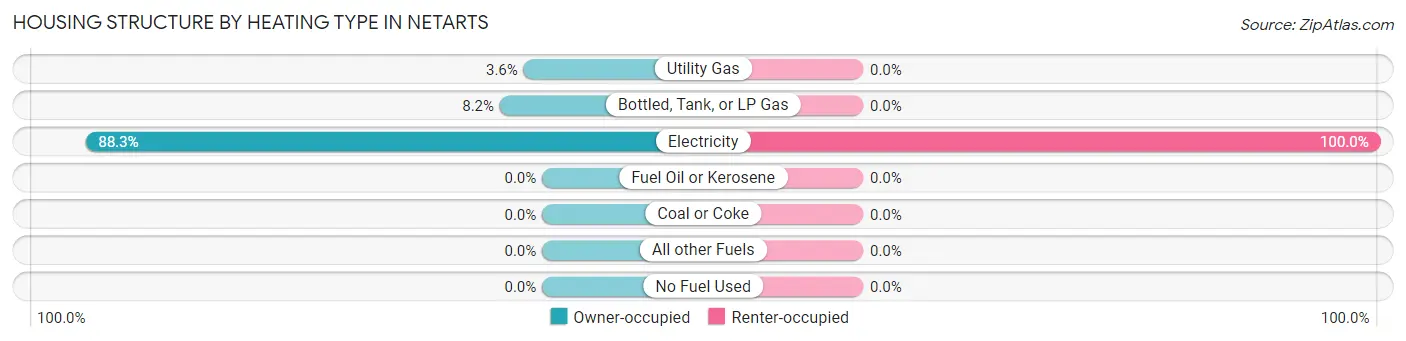
| Heating Type | Owner-occupied | Renter-occupied |
| Utility Gas | 7 (3.6%) | 0 (0.0%) |
| Bottled, Tank, or LP Gas | 16 (8.2%) | 0 (0.0%) |
| Electricity | 173 (88.3%) | 102 (100.0%) |
| Fuel Oil or Kerosene | 0 (0.0%) | 0 (0.0%) |
| Coal or Coke | 0 (0.0%) | 0 (0.0%) |
| All other Fuels | 0 (0.0%) | 0 (0.0%) |
| No Fuel Used | 0 (0.0%) | 0 (0.0%) |
| Total | 196 (100.0%) | 102 (100.0%) |
Household Vehicle Usage in Netarts
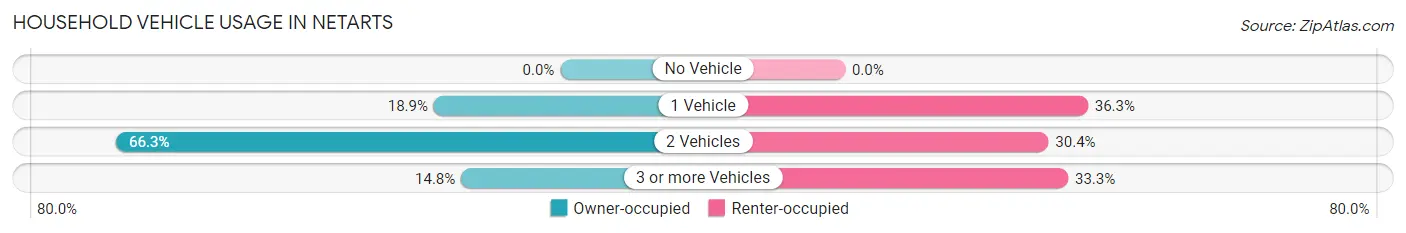
| Vehicles per Household | Owner-occupied | Renter-occupied |
| No Vehicle | 0 (0.0%) | 0 (0.0%) |
| 1 Vehicle | 37 (18.9%) | 37 (36.3%) |
| 2 Vehicles | 130 (66.3%) | 31 (30.4%) |
| 3 or more Vehicles | 29 (14.8%) | 34 (33.3%) |
| Total | 196 (100.0%) | 102 (100.0%) |
Real Estate & Mortgages in Netarts
Real Estate and Mortgage Overview in Netarts
| Characteristic | Without Mortgage | With Mortgage |
| Housing Units | 139 | 57 |
| Median Property Value | $290,800 | $387,000 |
| Median Household Income | $73,516 | $19 |
| Monthly Housing Costs | $495 | $0 |
| Real Estate Taxes | $2,763 | $0 |
Property Value by Mortgage Status in Netarts
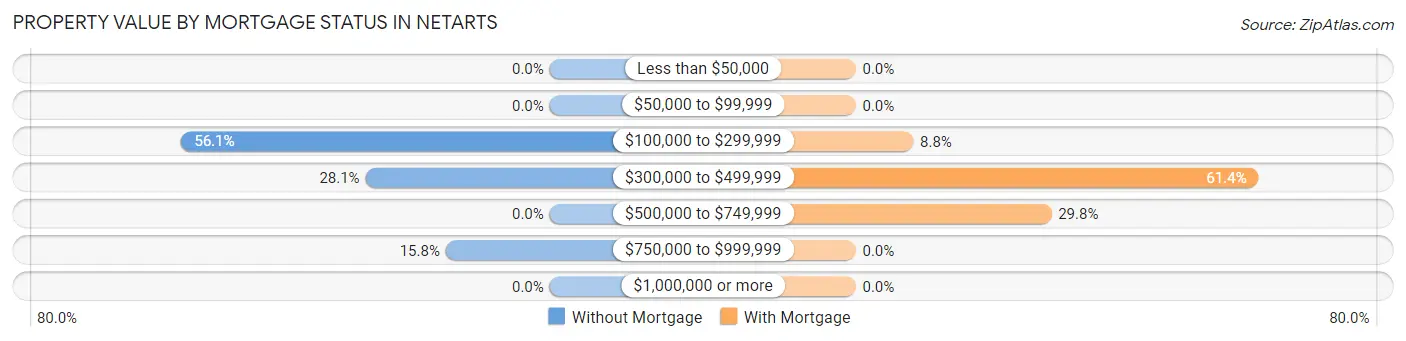
| Property Value | Without Mortgage | With Mortgage |
| Less than $50,000 | 0 (0.0%) | 0 (0.0%) |
| $50,000 to $99,999 | 0 (0.0%) | 0 (0.0%) |
| $100,000 to $299,999 | 78 (56.1%) | 5 (8.8%) |
| $300,000 to $499,999 | 39 (28.1%) | 35 (61.4%) |
| $500,000 to $749,999 | 0 (0.0%) | 17 (29.8%) |
| $750,000 to $999,999 | 22 (15.8%) | 0 (0.0%) |
| $1,000,000 or more | 0 (0.0%) | 0 (0.0%) |
| Total | 139 (100.0%) | 57 (100.0%) |
Household Income by Mortgage Status in Netarts
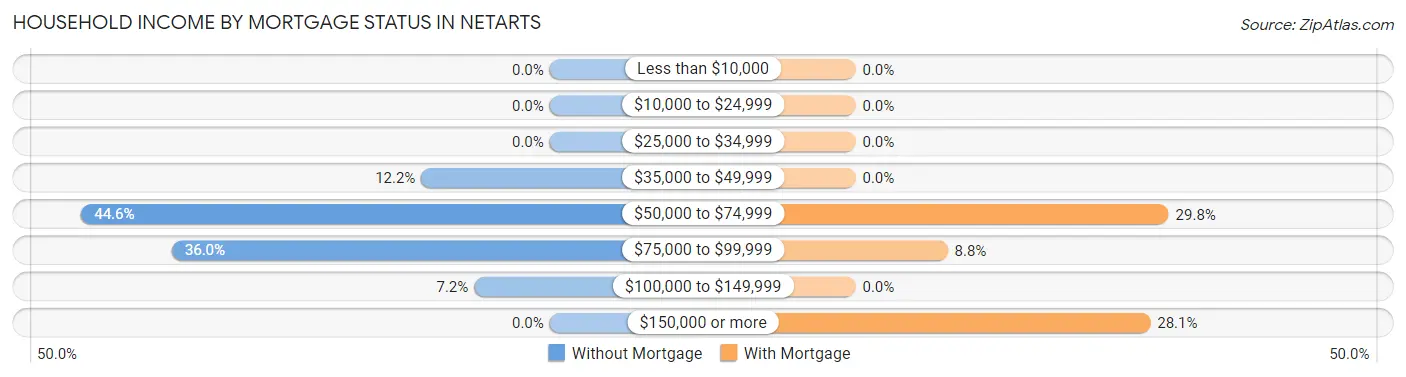
| Household Income | Without Mortgage | With Mortgage |
| Less than $10,000 | 0 (0.0%) | 0 (0.0%) |
| $10,000 to $24,999 | 0 (0.0%) | 0 (0.0%) |
| $25,000 to $34,999 | 0 (0.0%) | 0 (0.0%) |
| $35,000 to $49,999 | 17 (12.2%) | 0 (0.0%) |
| $50,000 to $74,999 | 62 (44.6%) | 17 (29.8%) |
| $75,000 to $99,999 | 50 (36.0%) | 5 (8.8%) |
| $100,000 to $149,999 | 10 (7.2%) | 0 (0.0%) |
| $150,000 or more | 0 (0.0%) | 16 (28.1%) |
| Total | 139 (100.0%) | 57 (100.0%) |
Property Value to Household Income Ratio in Netarts
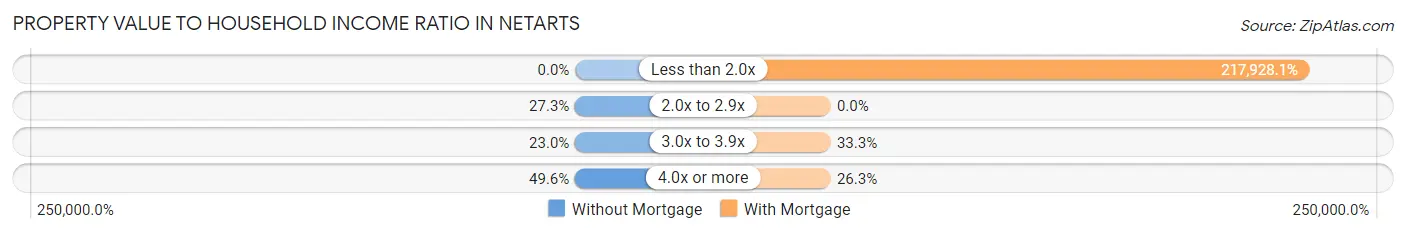
| Value-to-Income Ratio | Without Mortgage | With Mortgage |
| Less than 2.0x | 0 (0.0%) | 124,219 (217,928.1%) |
| 2.0x to 2.9x | 38 (27.3%) | 0 (0.0%) |
| 3.0x to 3.9x | 32 (23.0%) | 19 (33.3%) |
| 4.0x or more | 69 (49.6%) | 15 (26.3%) |
| Total | 139 (100.0%) | 57 (100.0%) |
Real Estate Taxes by Mortgage Status in Netarts
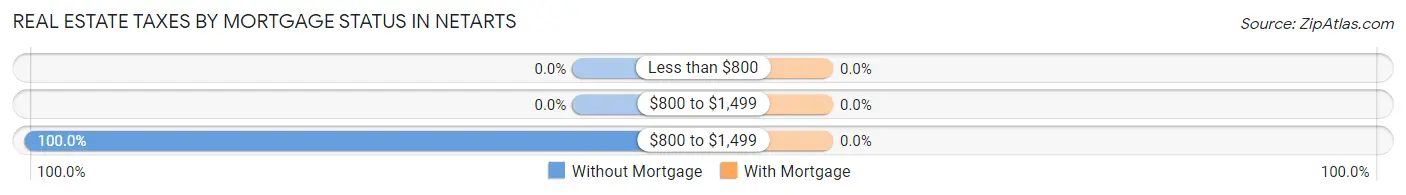
| Property Taxes | Without Mortgage | With Mortgage |
| Less than $800 | 0 (0.0%) | 0 (0.0%) |
| $800 to $1,499 | 0 (0.0%) | 0 (0.0%) |
| $800 to $1,499 | 139 (100.0%) | 0 (0.0%) |
| Total | 139 (100.0%) | 57 (100.0%) |
Health & Disability in Netarts
Health Insurance Coverage by Age in Netarts
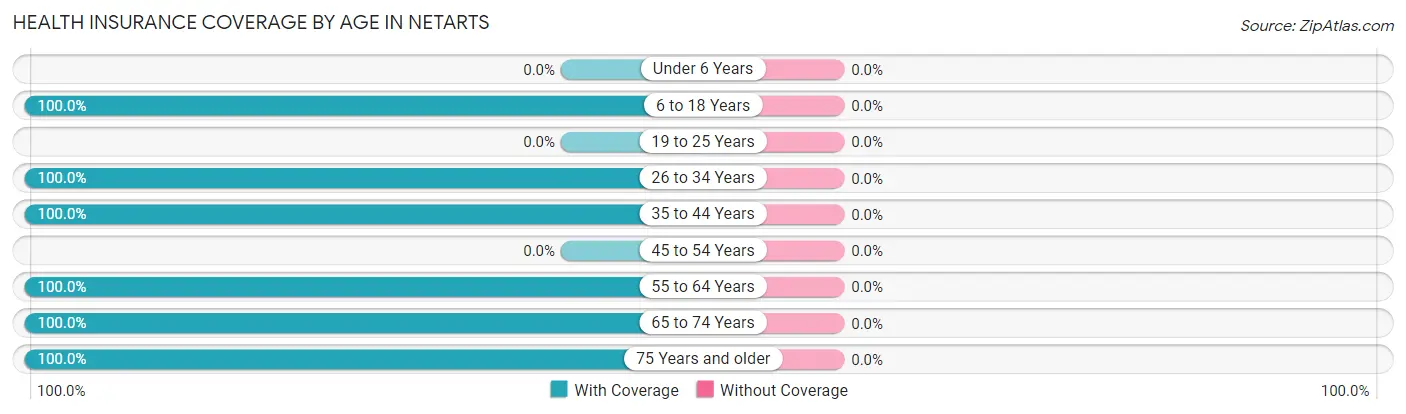
| Age Bracket | With Coverage | Without Coverage |
| Under 6 Years | 0 (0.0%) | 0 (0.0%) |
| 6 to 18 Years | 64 (100.0%) | 0 (0.0%) |
| 19 to 25 Years | 0 (0.0%) | 0 (0.0%) |
| 26 to 34 Years | 76 (100.0%) | 0 (0.0%) |
| 35 to 44 Years | 29 (100.0%) | 0 (0.0%) |
| 45 to 54 Years | 0 (0.0%) | 0 (0.0%) |
| 55 to 64 Years | 175 (100.0%) | 0 (0.0%) |
| 65 to 74 Years | 232 (100.0%) | 0 (0.0%) |
| 75 Years and older | 46 (100.0%) | 0 (0.0%) |
| Total | 622 (100.0%) | 0 (0.0%) |
Health Insurance Coverage by Citizenship Status in Netarts
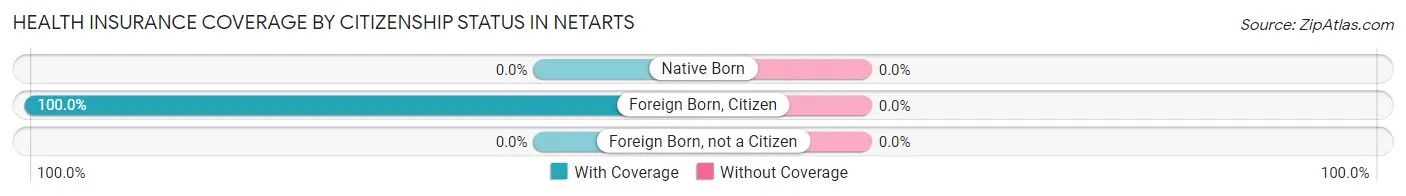
| Citizenship Status | With Coverage | Without Coverage |
| Native Born | 0 (0.0%) | 0 (0.0%) |
| Foreign Born, Citizen | 64 (100.0%) | 0 (0.0%) |
| Foreign Born, not a Citizen | 0 (0.0%) | 0 (0.0%) |
Health Insurance Coverage by Household Income in Netarts
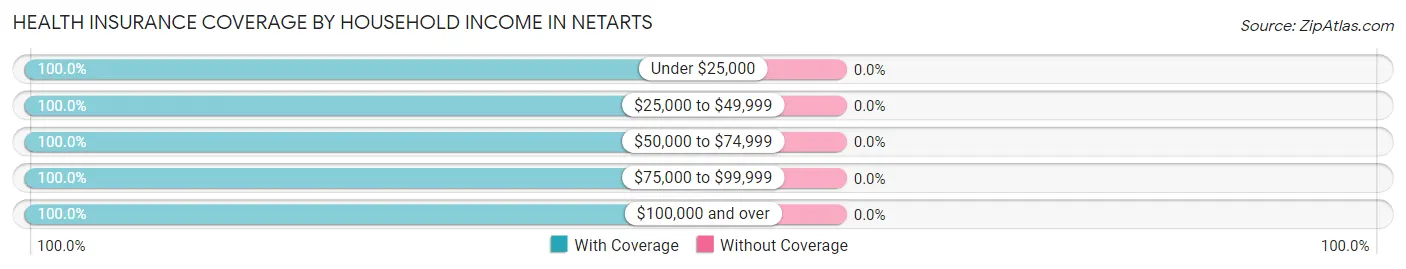
| Household Income | With Coverage | Without Coverage |
| Under $25,000 | 117 (100.0%) | 0 (0.0%) |
| $25,000 to $49,999 | 128 (100.0%) | 0 (0.0%) |
| $50,000 to $74,999 | 139 (100.0%) | 0 (0.0%) |
| $75,000 to $99,999 | 96 (100.0%) | 0 (0.0%) |
| $100,000 and over | 137 (100.0%) | 0 (0.0%) |
Public vs Private Health Insurance Coverage by Age in Netarts
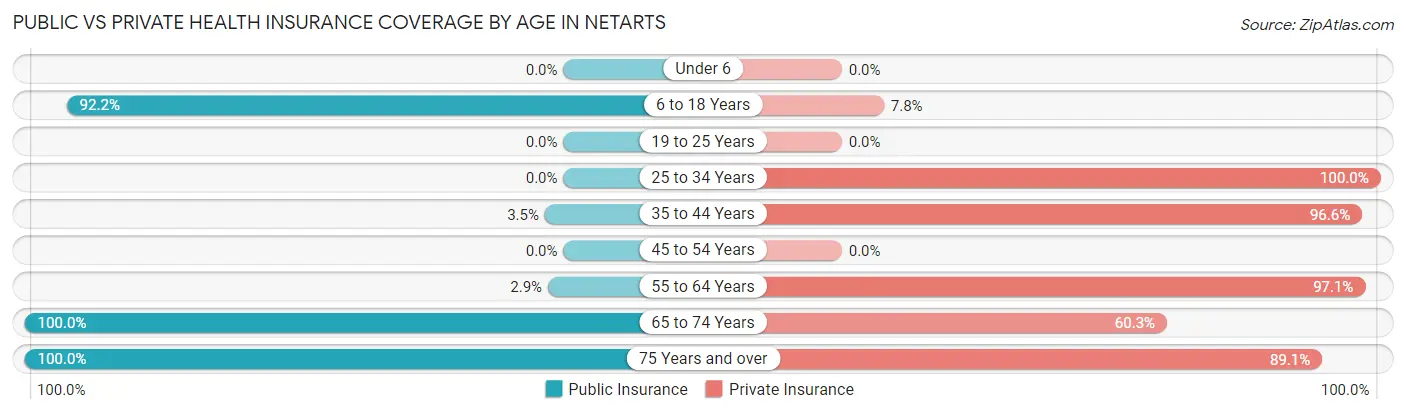
| Age Bracket | Public Insurance | Private Insurance |
| Under 6 | 0 (0.0%) | 0 (0.0%) |
| 6 to 18 Years | 59 (92.2%) | 5 (7.8%) |
| 19 to 25 Years | 0 (0.0%) | 0 (0.0%) |
| 25 to 34 Years | 0 (0.0%) | 76 (100.0%) |
| 35 to 44 Years | 1 (3.5%) | 28 (96.6%) |
| 45 to 54 Years | 0 (0.0%) | 0 (0.0%) |
| 55 to 64 Years | 5 (2.9%) | 170 (97.1%) |
| 65 to 74 Years | 232 (100.0%) | 140 (60.3%) |
| 75 Years and over | 46 (100.0%) | 41 (89.1%) |
| Total | 343 (55.1%) | 460 (74.0%) |
Disability Status by Sex by Age in Netarts
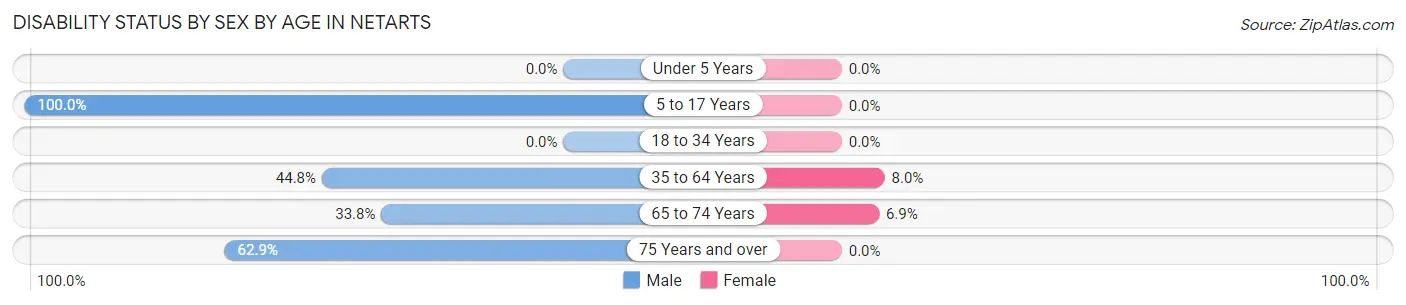
| Age Bracket | Male | Female |
| Under 5 Years | 0 (0.0%) | 0 (0.0%) |
| 5 to 17 Years | 59 (100.0%) | 0 (0.0%) |
| 18 to 34 Years | 0 (0.0%) | 0 (0.0%) |
| 35 to 64 Years | 52 (44.8%) | 7 (8.0%) |
| 65 to 74 Years | 49 (33.8%) | 6 (6.9%) |
| 75 Years and over | 22 (62.9%) | 0 (0.0%) |
Disability Class by Sex by Age in Netarts
Disability Class: Hearing Difficulty
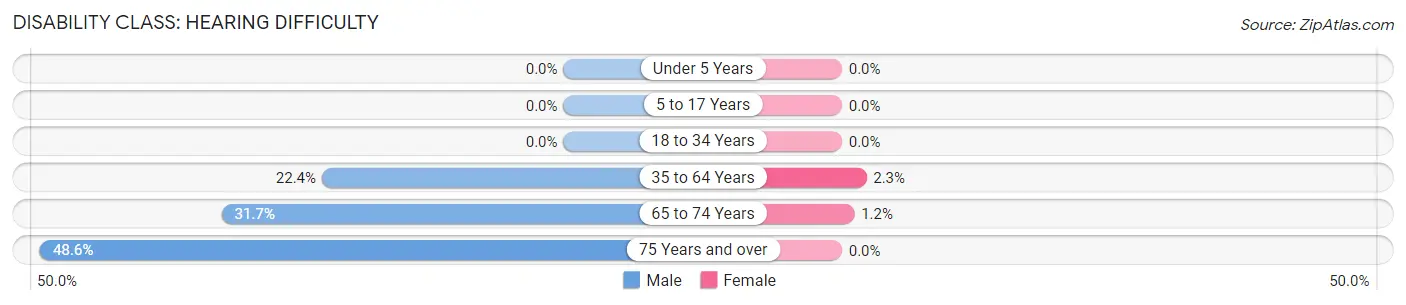
| Age Bracket | Male | Female |
| Under 5 Years | 0 (0.0%) | 0 (0.0%) |
| 5 to 17 Years | 0 (0.0%) | 0 (0.0%) |
| 18 to 34 Years | 0 (0.0%) | 0 (0.0%) |
| 35 to 64 Years | 26 (22.4%) | 2 (2.3%) |
| 65 to 74 Years | 46 (31.7%) | 1 (1.1%) |
| 75 Years and over | 17 (48.6%) | 0 (0.0%) |
Disability Class: Vision Difficulty
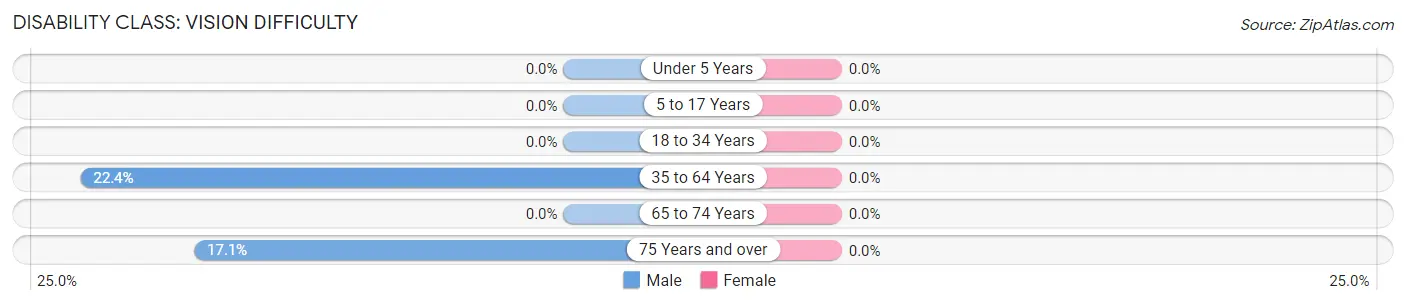
| Age Bracket | Male | Female |
| Under 5 Years | 0 (0.0%) | 0 (0.0%) |
| 5 to 17 Years | 0 (0.0%) | 0 (0.0%) |
| 18 to 34 Years | 0 (0.0%) | 0 (0.0%) |
| 35 to 64 Years | 26 (22.4%) | 0 (0.0%) |
| 65 to 74 Years | 0 (0.0%) | 0 (0.0%) |
| 75 Years and over | 6 (17.1%) | 0 (0.0%) |
Disability Class: Cognitive Difficulty
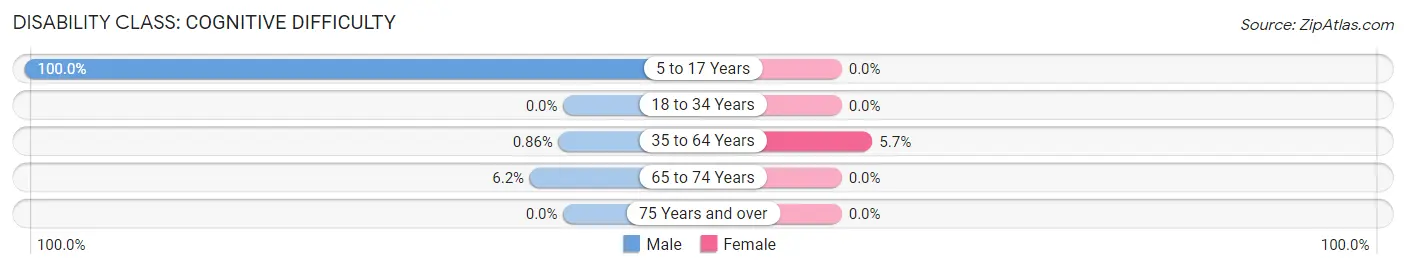
| Age Bracket | Male | Female |
| 5 to 17 Years | 59 (100.0%) | 0 (0.0%) |
| 18 to 34 Years | 0 (0.0%) | 0 (0.0%) |
| 35 to 64 Years | 1 (0.9%) | 5 (5.7%) |
| 65 to 74 Years | 9 (6.2%) | 0 (0.0%) |
| 75 Years and over | 0 (0.0%) | 0 (0.0%) |
Disability Class: Ambulatory Difficulty
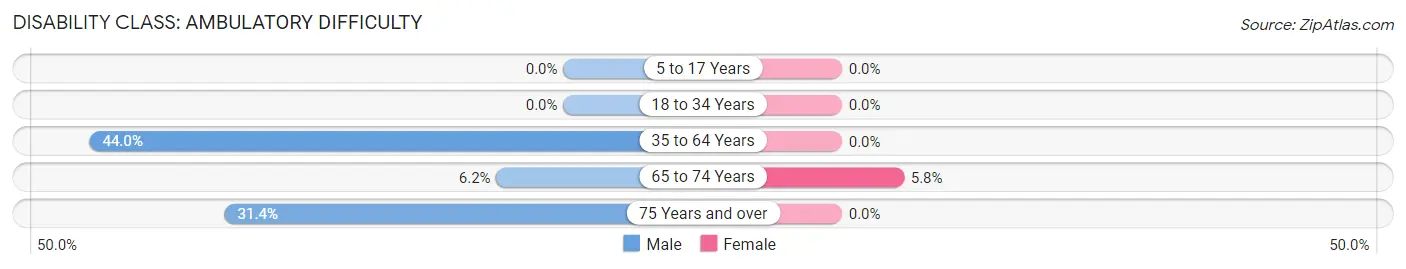
| Age Bracket | Male | Female |
| 5 to 17 Years | 0 (0.0%) | 0 (0.0%) |
| 18 to 34 Years | 0 (0.0%) | 0 (0.0%) |
| 35 to 64 Years | 51 (44.0%) | 0 (0.0%) |
| 65 to 74 Years | 9 (6.2%) | 5 (5.8%) |
| 75 Years and over | 11 (31.4%) | 0 (0.0%) |
Disability Class: Self-Care Difficulty
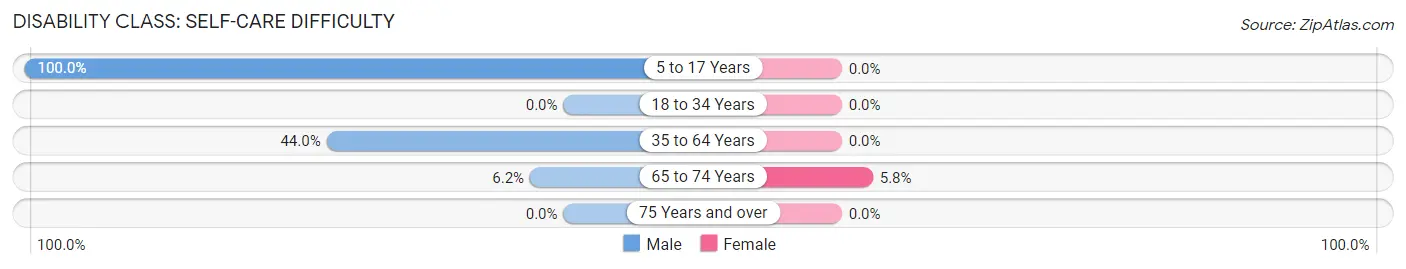
| Age Bracket | Male | Female |
| 5 to 17 Years | 59 (100.0%) | 0 (0.0%) |
| 18 to 34 Years | 0 (0.0%) | 0 (0.0%) |
| 35 to 64 Years | 51 (44.0%) | 0 (0.0%) |
| 65 to 74 Years | 9 (6.2%) | 5 (5.8%) |
| 75 Years and over | 0 (0.0%) | 0 (0.0%) |
Technology Access in Netarts
Computing Device Access in Netarts
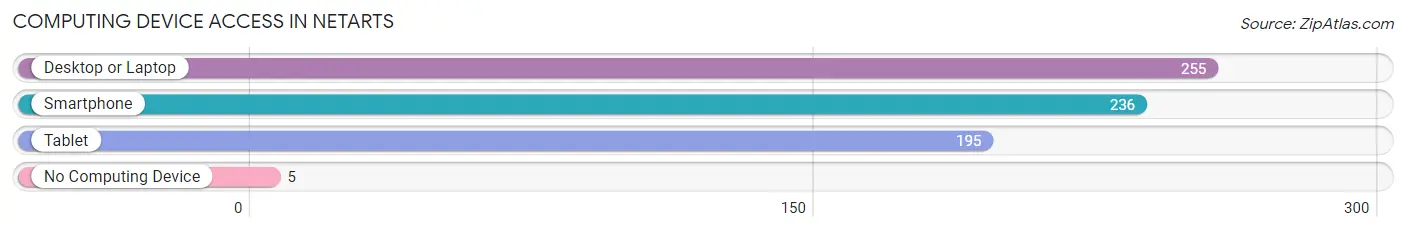
| Device Type | # Households | % Households |
| Desktop or Laptop | 255 | 85.6% |
| Smartphone | 236 | 79.2% |
| Tablet | 195 | 65.4% |
| No Computing Device | 5 | 1.7% |
| Total | 298 | 100.0% |
Internet Access in Netarts
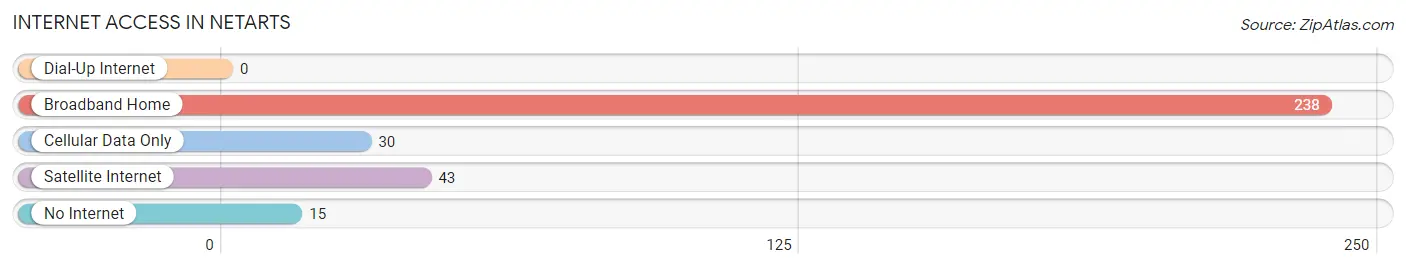
| Internet Type | # Households | % Households |
| Dial-Up Internet | 0 | 0.0% |
| Broadband Home | 238 | 79.9% |
| Cellular Data Only | 30 | 10.1% |
| Satellite Internet | 43 | 14.4% |
| No Internet | 15 | 5.0% |
| Total | 298 | 100.0% |
Netarts Summary
History
Netarts, Oregon is a small unincorporated community located in Tillamook County, Oregon. It is situated on the north side of Netarts Bay, a large estuary that is part of the larger Tillamook Bay. The area was first settled in the late 1800s by a group of settlers from the nearby town of Tillamook. The settlers were attracted to the area due to its abundance of fish and wildlife, as well as its close proximity to the ocean.
The first post office in Netarts was established in 1891, and the town was officially incorporated in 1895. The town was named after the nearby Netarts Bay, which was named after the Native American tribe that lived in the area.
In the early 1900s, the town was a popular destination for tourists, who came to enjoy the area’s natural beauty and abundant fishing opportunities. The town also had a thriving lumber industry, which provided jobs for many of the town’s residents.
In the 1950s, the town began to decline as the lumber industry moved away and the tourist industry began to decline. The town’s population dropped from a peak of over 500 in the 1940s to just over 200 in the 2000 census.
Geography
Netarts is located in the northern part of Tillamook County, Oregon. It is situated on the north side of Netarts Bay, a large estuary that is part of the larger Tillamook Bay. The town is surrounded by the Oregon Coast Range to the east and the Pacific Ocean to the west.
The town is located at an elevation of approximately 20 feet above sea level. The climate in the area is mild, with temperatures rarely dropping below freezing in the winter and rarely exceeding 80 degrees in the summer.
Economy
The economy of Netarts is largely based on tourism and fishing. The town is a popular destination for tourists who come to enjoy the area’s natural beauty and abundant fishing opportunities. The town also has a thriving commercial fishing industry, which provides jobs for many of the town’s residents.
In addition to tourism and fishing, the town also has a small retail sector. There are several small shops and restaurants in the town, as well as a few small businesses.
Demographics
As of the 2000 census, the population of Netarts was 203. The racial makeup of the town was 97.5% White, 0.5% Native American, 0.5% Asian, and 1.5% from other races. The median household income was $30,000, and the median family income was $35,000.
The town is served by the Netarts-Oceanside School District, which includes two elementary schools and one middle school. The town also has a public library and a volunteer fire department.
Netarts is a small, quiet community that is known for its natural beauty and abundance of fishing opportunities. It is a popular destination for tourists and a great place to live for those who enjoy the outdoors.
Common Questions
What is Per Capita Income in Netarts?
Per Capita income in Netarts is $38,798.
What is the Median Family Income in Netarts?
Median Family Income in Netarts is $70,819.
What is the Median Household income in Netarts?
Median Household Income in Netarts is $70,515.
What is Inequality or Gini Index in Netarts?
Inequality or Gini Index in Netarts is 0.31.
What is the Total Population of Netarts?
Total Population of Netarts is 622.
What is the Total Male Population of Netarts?
Total Male Population of Netarts is 398.
What is the Total Female Population of Netarts?
Total Female Population of Netarts is 224.
What is the Ratio of Males per 100 Females in Netarts?
There are 177.68 Males per 100 Females in Netarts.
What is the Ratio of Females per 100 Males in Netarts?
There are 56.28 Females per 100 Males in Netarts.
What is the Median Population Age in Netarts?
Median Population Age in Netarts is 62.6 Years.
What is the Average Family Size in Netarts
Average Family Size in Netarts is 2.5 People.
What is the Average Household Size in Netarts
Average Household Size in Netarts is 2.1 People.
How Large is the Labor Force in Netarts?
There are 242 People in the Labor Forcein in Netarts.
What is the Percentage of People in the Labor Force in Netarts?
43.0% of People are in the Labor Force in Netarts.