Star Valley Ranch, WY Map & Demographics
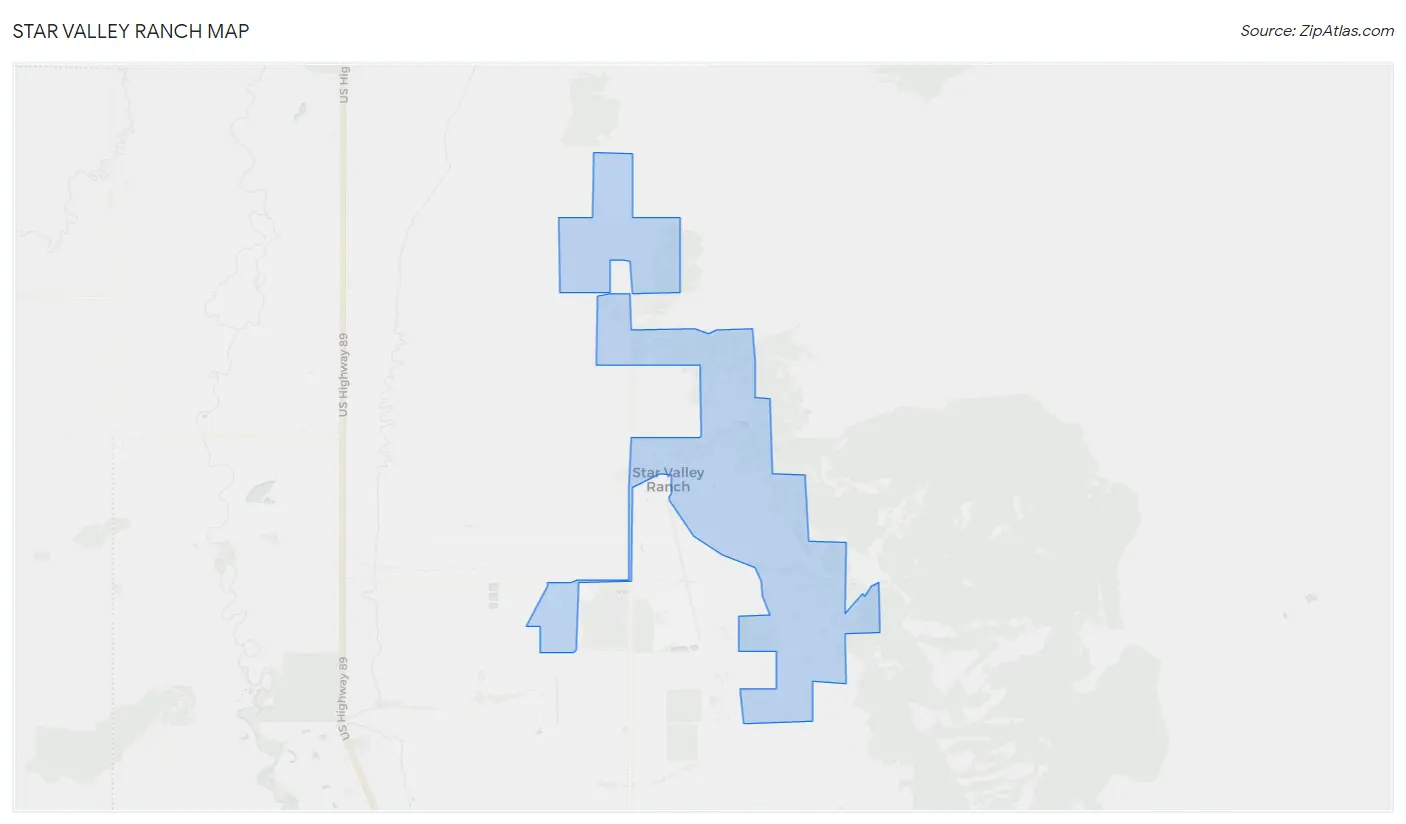
Star Valley Ranch Map
Star Valley Ranch Overview
$51,578
PER CAPITA INCOME
$109,135
AVG FAMILY INCOME
$92,250
AVG HOUSEHOLD INCOME
29.1%
WAGE / INCOME GAP [ % ]
70.9¢/ $1
WAGE / INCOME GAP [ $ ]
0.36
INEQUALITY / GINI INDEX
2,231
TOTAL POPULATION
1,223
MALE POPULATION
1,008
FEMALE POPULATION
121.33
MALES / 100 FEMALES
82.42
FEMALES / 100 MALES
51.8
MEDIAN AGE
2.7
AVG FAMILY SIZE
2.5
AVG HOUSEHOLD SIZE
1,027
LABOR FORCE [ PEOPLE ]
54.5%
PERCENT IN LABOR FORCE
1.2%
UNEMPLOYMENT RATE
Star Valley Ranch Area Codes
Income in Star Valley Ranch
Income Overview in Star Valley Ranch
Per Capita Income in Star Valley Ranch is $51,578, while median incomes of families and households are $109,135 and $92,250 respectively.
| Characteristic | Number | Measure |
| Per Capita Income | 2,231 | $51,578 |
| Median Family Income | 685 | $109,135 |
| Mean Family Income | 685 | $132,257 |
| Median Household Income | 891 | $92,250 |
| Mean Household Income | 891 | $124,719 |
| Income Deficit | 685 | $0 |
| Wage / Income Gap (%) | 2,231 | 29.06% |
| Wage / Income Gap ($) | 2,231 | 70.94¢ per $1 |
| Gini / Inequality Index | 2,231 | 0.36 |
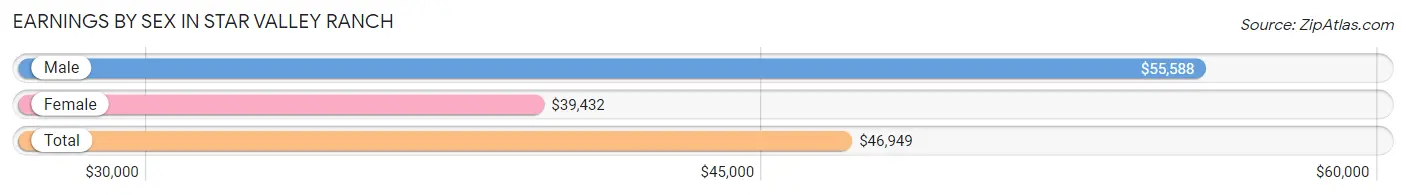
Earnings by Sex in Star Valley Ranch
Average Earnings in Star Valley Ranch are $46,949, $55,588 for men and $39,432 for women, a difference of 29.1%.
| Sex | Number | Average Earnings |
| Male | 656 (59.7%) | $55,588 |
| Female | 442 (40.3%) | $39,432 |
| Total | 1,098 (100.0%) | $46,949 |
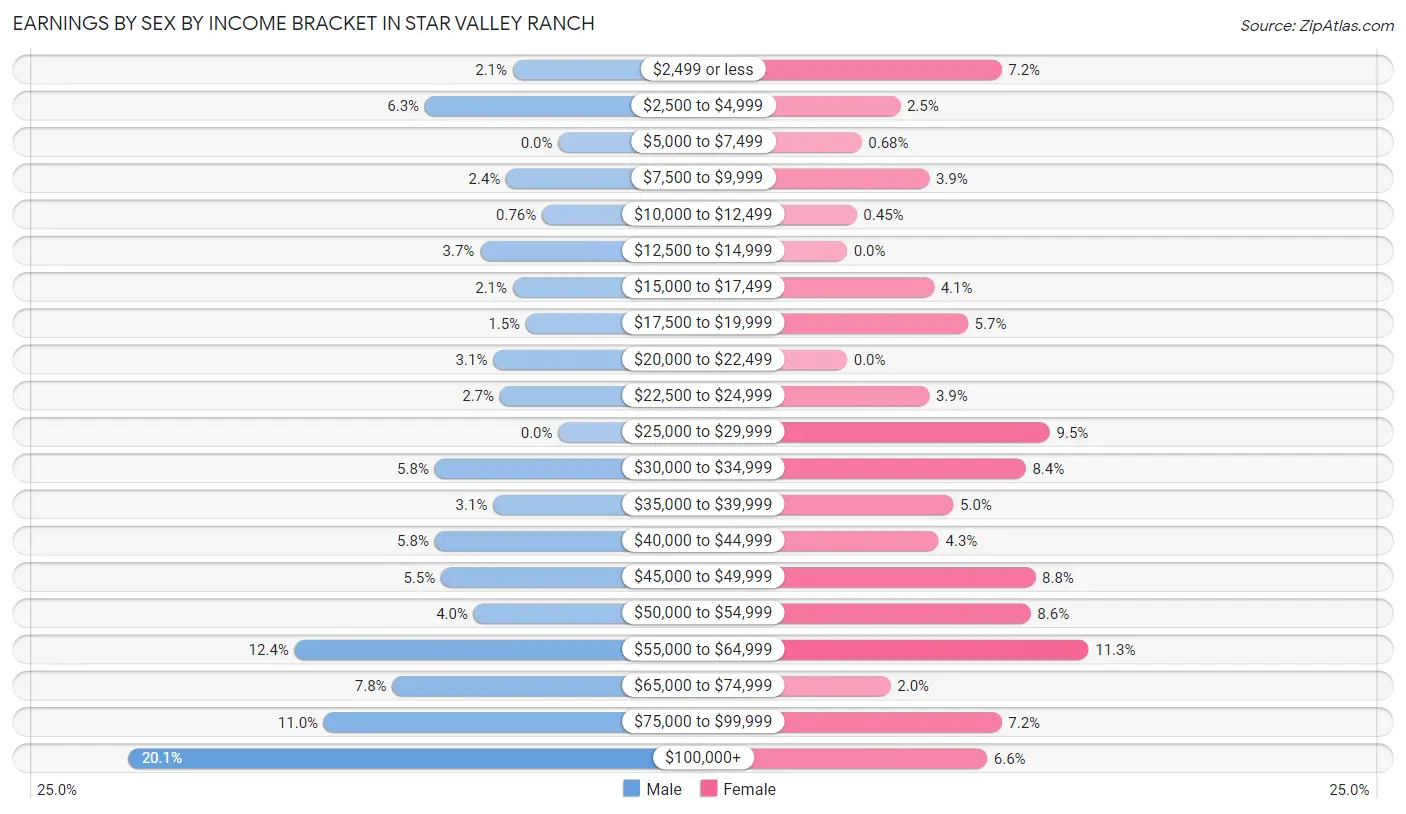
Earnings by Sex by Income Bracket in Star Valley Ranch
The most common earnings brackets in Star Valley Ranch are $100,000+ for men (132 | 20.1%) and $55,000 to $64,999 for women (50 | 11.3%).
| Income | Male | Female |
| $2,499 or less | 14 (2.1%) | 32 (7.2%) |
| $2,500 to $4,999 | 41 (6.2%) | 11 (2.5%) |
| $5,000 to $7,499 | 0 (0.0%) | 3 (0.7%) |
| $7,500 to $9,999 | 16 (2.4%) | 17 (3.8%) |
| $10,000 to $12,499 | 5 (0.8%) | 2 (0.4%) |
| $12,500 to $14,999 | 24 (3.7%) | 0 (0.0%) |
| $15,000 to $17,499 | 14 (2.1%) | 18 (4.1%) |
| $17,500 to $19,999 | 10 (1.5%) | 25 (5.7%) |
| $20,000 to $22,499 | 20 (3.0%) | 0 (0.0%) |
| $22,500 to $24,999 | 18 (2.7%) | 17 (3.8%) |
| $25,000 to $29,999 | 0 (0.0%) | 42 (9.5%) |
| $30,000 to $34,999 | 38 (5.8%) | 37 (8.4%) |
| $35,000 to $39,999 | 20 (3.0%) | 22 (5.0%) |
| $40,000 to $44,999 | 38 (5.8%) | 19 (4.3%) |
| $45,000 to $49,999 | 36 (5.5%) | 39 (8.8%) |
| $50,000 to $54,999 | 26 (4.0%) | 38 (8.6%) |
| $55,000 to $64,999 | 81 (12.3%) | 50 (11.3%) |
| $65,000 to $74,999 | 51 (7.8%) | 9 (2.0%) |
| $75,000 to $99,999 | 72 (11.0%) | 32 (7.2%) |
| $100,000+ | 132 (20.1%) | 29 (6.6%) |
| Total | 656 (100.0%) | 442 (100.0%) |
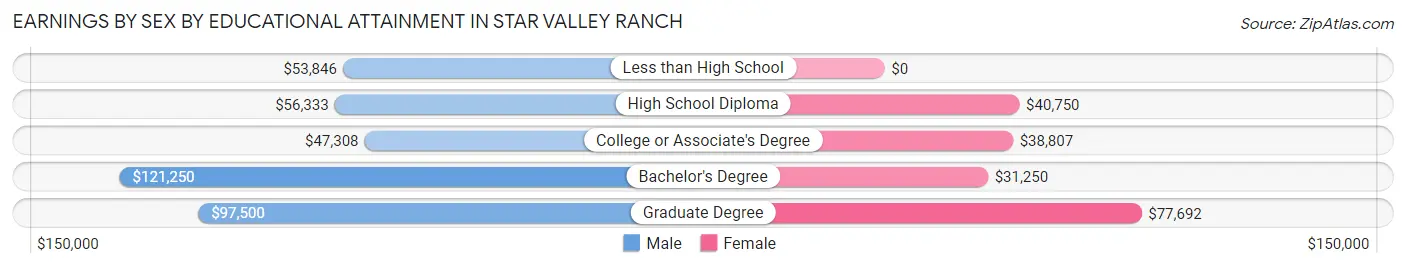
Earnings by Sex by Educational Attainment in Star Valley Ranch
Average earnings in Star Valley Ranch are $60,921 for men and $38,977 for women, a difference of 36.0%. Men with an educational attainment of bachelor's degree enjoy the highest average annual earnings of $121,250, while those with college or associate's degree education earn the least with $47,308. Women with an educational attainment of graduate degree earn the most with the average annual earnings of $77,692, while those with bachelor's degree education have the smallest earnings of $31,250.
| Educational Attainment | Male Income | Female Income |
| Less than High School | $53,846 | $0 |
| High School Diploma | $56,333 | $40,750 |
| College or Associate's Degree | $47,308 | $38,807 |
| Bachelor's Degree | $121,250 | $31,250 |
| Graduate Degree | $97,500 | $77,692 |
| Total | $60,921 | $38,977 |
Family Income in Star Valley Ranch
Family Income Brackets in Star Valley Ranch
According to the Star Valley Ranch family income data, there are 170 families falling into the $100,000 to $149,999 income range, which is the most common income bracket and makes up 24.8% of all families.
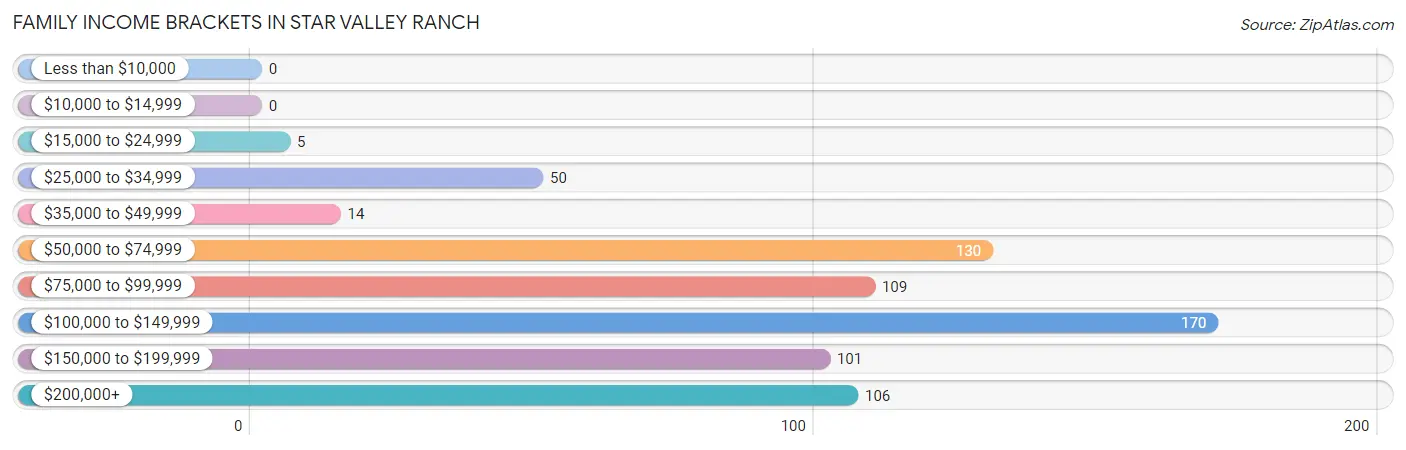
| Income Bracket | # Families | % Families |
| Less than $10,000 | 0 | 0.0% |
| $10,000 to $14,999 | 0 | 0.0% |
| $15,000 to $24,999 | 5 | 0.7% |
| $25,000 to $34,999 | 50 | 7.3% |
| $35,000 to $49,999 | 14 | 2.0% |
| $50,000 to $74,999 | 130 | 19.0% |
| $75,000 to $99,999 | 109 | 15.9% |
| $100,000 to $149,999 | 170 | 24.8% |
| $150,000 to $199,999 | 101 | 14.7% |
| $200,000+ | 106 | 15.5% |
Family Income by Famaliy Size in Star Valley Ranch
5-person families (39 | 5.7%) account for the highest median family income in Star Valley Ranch with $130,139 per family, while 2-person families (493 | 72.0%) have the highest median income of $55,848 per family member.
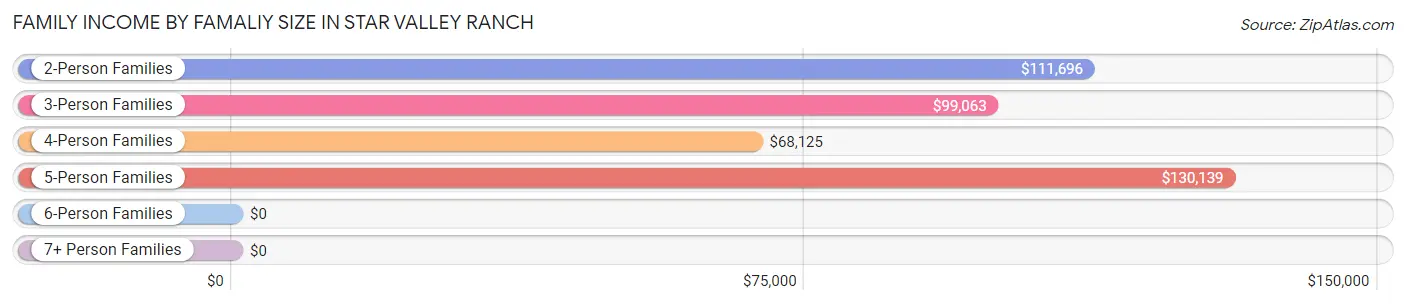
| Income Bracket | # Families | Median Income |
| 2-Person Families | 493 (72.0%) | $111,696 |
| 3-Person Families | 96 (14.0%) | $99,063 |
| 4-Person Families | 36 (5.3%) | $68,125 |
| 5-Person Families | 39 (5.7%) | $130,139 |
| 6-Person Families | 5 (0.7%) | $0 |
| 7+ Person Families | 16 (2.3%) | $0 |
| Total | 685 (100.0%) | $109,135 |
Family Income by Number of Earners in Star Valley Ranch
The median family income in Star Valley Ranch is $109,135, with families comprising 3+ earners (39) having the highest median family income of $178,438, while families with 1 earner (170) have the lowest median family income of $90,000, accounting for 5.7% and 24.8% of families, respectively.
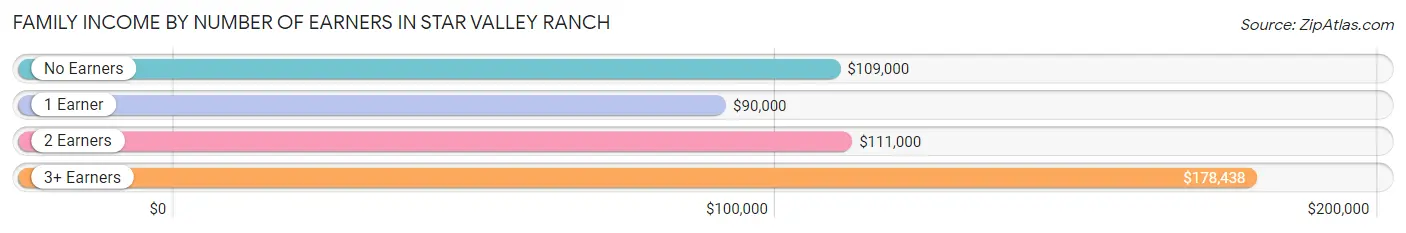
| Number of Earners | # Families | Median Income |
| No Earners | 230 (33.6%) | $109,000 |
| 1 Earner | 170 (24.8%) | $90,000 |
| 2 Earners | 246 (35.9%) | $111,000 |
| 3+ Earners | 39 (5.7%) | $178,438 |
| Total | 685 (100.0%) | $109,135 |
Household Income in Star Valley Ranch
Household Income Brackets in Star Valley Ranch
With 206 households falling in the category, the $50,000 to $74,999 income range is the most frequent in Star Valley Ranch, accounting for 23.1% of all households. In contrast, only 2 households (0.2%) fall into the $10,000 to $14,999 income bracket, making it the least populous group.
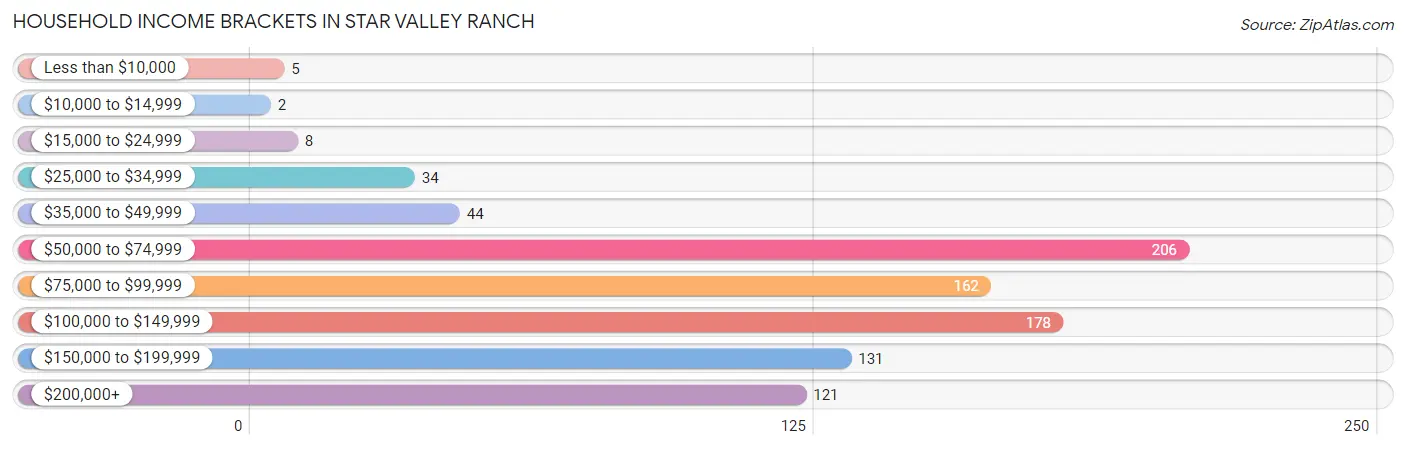
| Income Bracket | # Households | % Households |
| Less than $10,000 | 5 | 0.6% |
| $10,000 to $14,999 | 2 | 0.2% |
| $15,000 to $24,999 | 8 | 0.9% |
| $25,000 to $34,999 | 34 | 3.8% |
| $35,000 to $49,999 | 44 | 4.9% |
| $50,000 to $74,999 | 206 | 23.1% |
| $75,000 to $99,999 | 162 | 18.2% |
| $100,000 to $149,999 | 178 | 20.0% |
| $150,000 to $199,999 | 131 | 14.7% |
| $200,000+ | 121 | 13.6% |
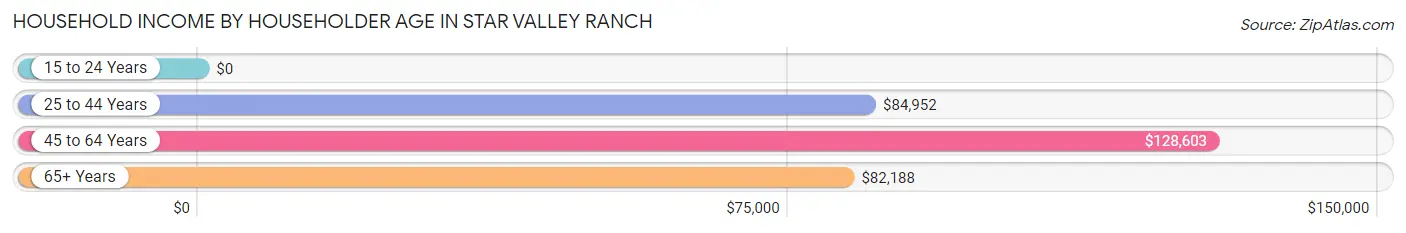
Household Income by Householder Age in Star Valley Ranch
The median household income in Star Valley Ranch is $92,250, with the highest median household income of $128,603 found in the 45 to 64 years age bracket for the primary householder. A total of 297 households (33.3%) fall into this category. Meanwhile, the 15 to 24 years age bracket for the primary householder has the lowest median household income of $0, with 5 households (0.6%) in this group.
| Income Bracket | # Households | Median Income |
| 15 to 24 Years | 5 (0.6%) | $0 |
| 25 to 44 Years | 221 (24.8%) | $84,952 |
| 45 to 64 Years | 297 (33.3%) | $128,603 |
| 65+ Years | 368 (41.3%) | $82,188 |
| Total | 891 (100.0%) | $92,250 |
Poverty in Star Valley Ranch
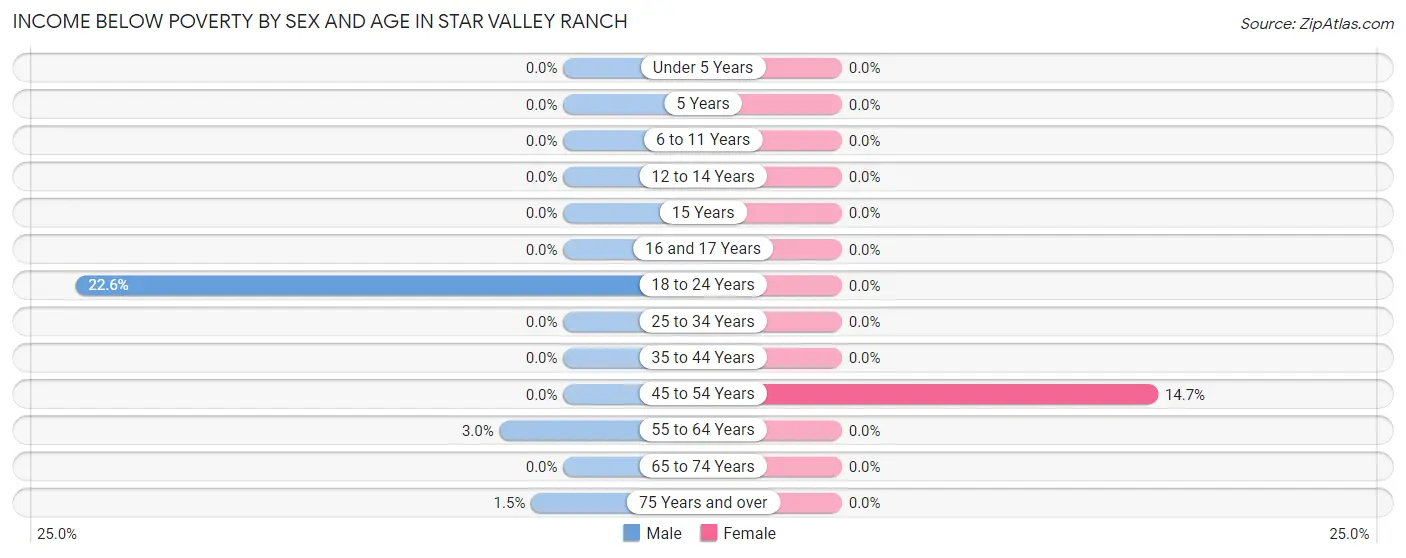
Income Below Poverty by Sex and Age in Star Valley Ranch
With 2.5% poverty level for males and 2.2% for females among the residents of Star Valley Ranch, 18 to 24 year old males and 45 to 54 year old females are the most vulnerable to poverty, with 24 males (22.6%) and 22 females (14.7%) in their respective age groups living below the poverty level.
| Age Bracket | Male | Female |
| Under 5 Years | 0 (0.0%) | 0 (0.0%) |
| 5 Years | 0 (0.0%) | 0 (0.0%) |
| 6 to 11 Years | 0 (0.0%) | 0 (0.0%) |
| 12 to 14 Years | 0 (0.0%) | 0 (0.0%) |
| 15 Years | 0 (0.0%) | 0 (0.0%) |
| 16 and 17 Years | 0 (0.0%) | 0 (0.0%) |
| 18 to 24 Years | 24 (22.6%) | 0 (0.0%) |
| 25 to 34 Years | 0 (0.0%) | 0 (0.0%) |
| 35 to 44 Years | 0 (0.0%) | 0 (0.0%) |
| 45 to 54 Years | 0 (0.0%) | 22 (14.7%) |
| 55 to 64 Years | 5 (3.0%) | 0 (0.0%) |
| 65 to 74 Years | 0 (0.0%) | 0 (0.0%) |
| 75 Years and over | 2 (1.5%) | 0 (0.0%) |
| Total | 31 (2.5%) | 22 (2.2%) |
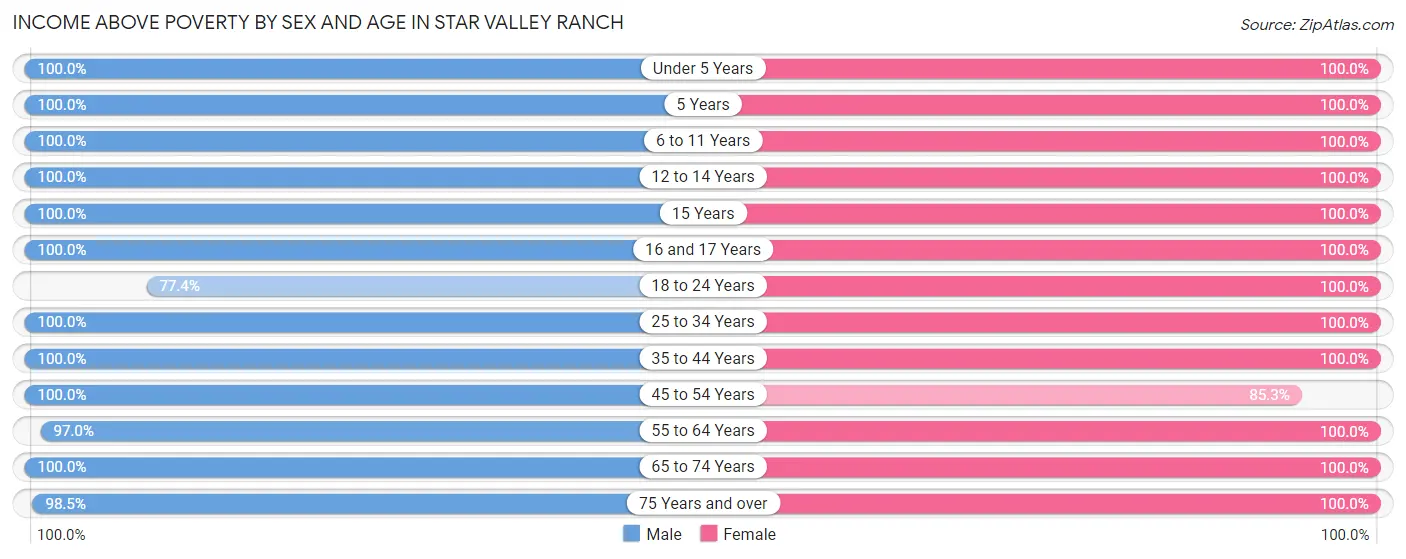
Income Above Poverty by Sex and Age in Star Valley Ranch
According to the poverty statistics in Star Valley Ranch, males aged under 5 years and females aged under 5 years are the age groups that are most secure financially, with 100.0% of males and 100.0% of females in these age groups living above the poverty line.
| Age Bracket | Male | Female |
| Under 5 Years | 66 (100.0%) | 11 (100.0%) |
| 5 Years | 8 (100.0%) | 2 (100.0%) |
| 6 to 11 Years | 77 (100.0%) | 77 (100.0%) |
| 12 to 14 Years | 50 (100.0%) | 32 (100.0%) |
| 15 Years | 22 (100.0%) | 2 (100.0%) |
| 16 and 17 Years | 14 (100.0%) | 24 (100.0%) |
| 18 to 24 Years | 82 (77.4%) | 34 (100.0%) |
| 25 to 34 Years | 131 (100.0%) | 85 (100.0%) |
| 35 to 44 Years | 122 (100.0%) | 117 (100.0%) |
| 45 to 54 Years | 112 (100.0%) | 128 (85.3%) |
| 55 to 64 Years | 164 (97.0%) | 156 (100.0%) |
| 65 to 74 Years | 212 (100.0%) | 209 (100.0%) |
| 75 Years and over | 132 (98.5%) | 109 (100.0%) |
| Total | 1,192 (97.5%) | 986 (97.8%) |
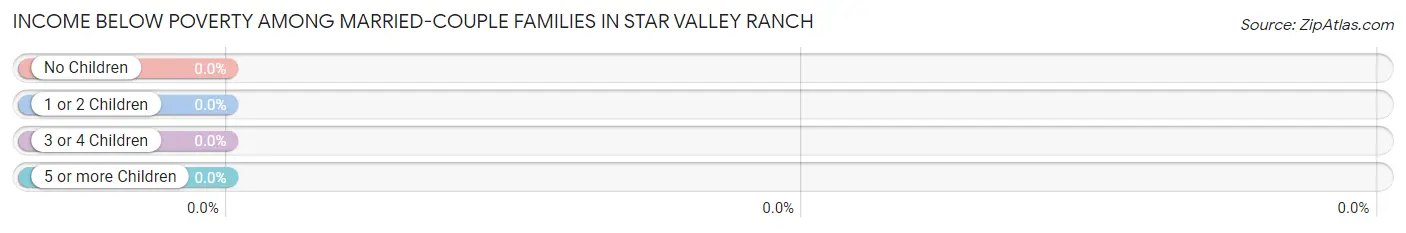
Income Below Poverty Among Married-Couple Families in Star Valley Ranch
| Children | Above Poverty | Below Poverty |
| No Children | 488 (100.0%) | 0 (0.0%) |
| 1 or 2 Children | 84 (100.0%) | 0 (0.0%) |
| 3 or 4 Children | 32 (100.0%) | 0 (0.0%) |
| 5 or more Children | 16 (100.0%) | 0 (0.0%) |
| Total | 620 (100.0%) | 0 (0.0%) |
Income Below Poverty Among Single-Parent Households in Star Valley Ranch
| Children | Single Father | Single Mother |
| No Children | 0 (0.0%) | 0 (0.0%) |
| 1 or 2 Children | 0 (0.0%) | 0 (0.0%) |
| 3 or 4 Children | 0 (0.0%) | 0 (0.0%) |
| 5 or more Children | 0 (0.0%) | 0 (0.0%) |
| Total | 0 (0.0%) | 0 (0.0%) |
Income Below Poverty Among Married-Couple vs Single-Parent Households in Star Valley Ranch
| Children | Married-Couple Families | Single-Parent Households |
| No Children | 0 (0.0%) | 0 (0.0%) |
| 1 or 2 Children | 0 (0.0%) | 0 (0.0%) |
| 3 or 4 Children | 0 (0.0%) | 0 (0.0%) |
| 5 or more Children | 0 (0.0%) | 0 (0.0%) |
| Total | 0 (0.0%) | 0 (0.0%) |
Race in Star Valley Ranch
The most populous races in Star Valley Ranch are White / Caucasian (2,012 | 90.2%), Two or more Races (166 | 7.4%), and Hispanic or Latino (164 | 7.3%).
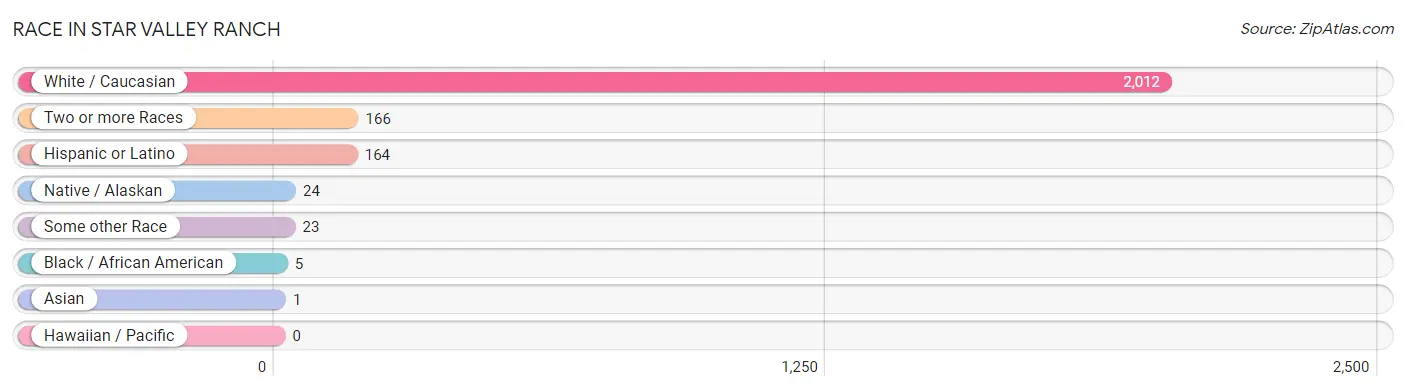
| Race | # Population | % Population |
| Asian | 1 | 0.0% |
| Black / African American | 5 | 0.2% |
| Hawaiian / Pacific | 0 | 0.0% |
| Hispanic or Latino | 164 | 7.3% |
| Native / Alaskan | 24 | 1.1% |
| White / Caucasian | 2,012 | 90.2% |
| Two or more Races | 166 | 7.4% |
| Some other Race | 23 | 1.0% |
| Total | 2,231 | 100.0% |
Ancestry in Star Valley Ranch
The most populous ancestries reported in Star Valley Ranch are English (547 | 24.5%), German (418 | 18.7%), Irish (238 | 10.7%), Scottish (149 | 6.7%), and American (139 | 6.2%), together accounting for 66.8% of all Star Valley Ranch residents.
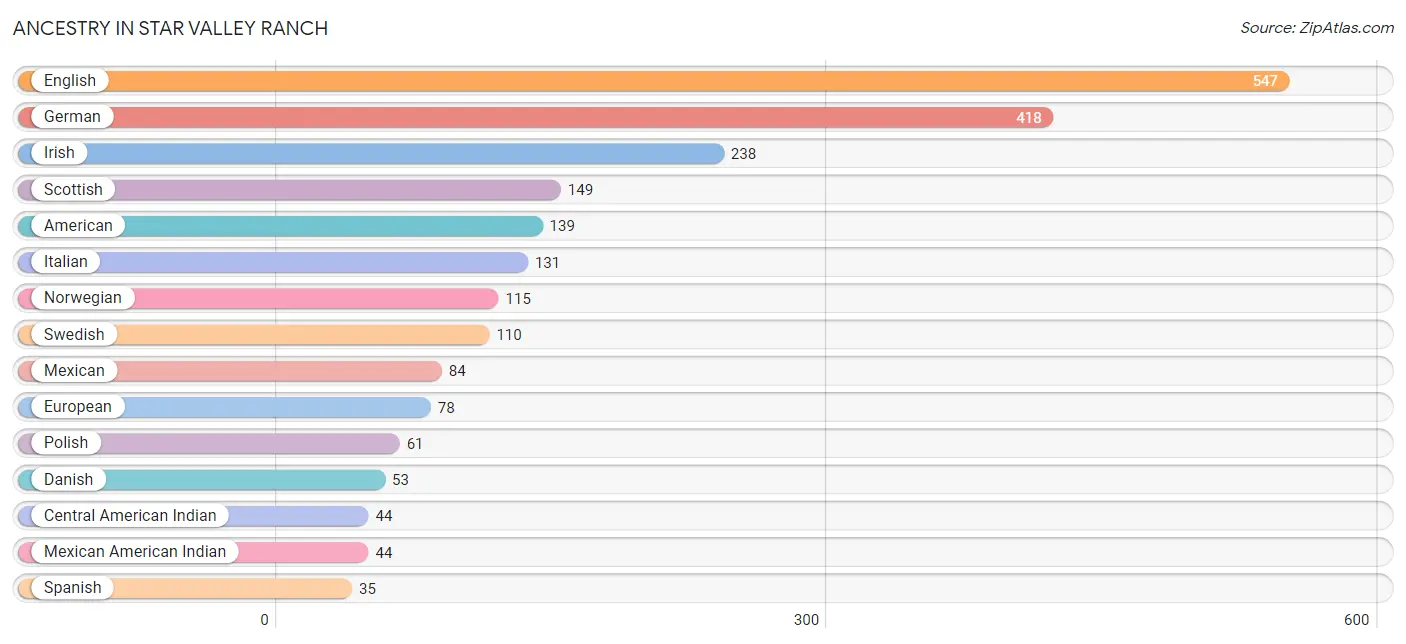
| Ancestry | # Population | % Population |
| American | 139 | 6.2% |
| Arab | 3 | 0.1% |
| Armenian | 8 | 0.4% |
| Austrian | 8 | 0.4% |
| Belgian | 2 | 0.1% |
| British | 12 | 0.5% |
| Central American | 28 | 1.3% |
| Central American Indian | 44 | 2.0% |
| Cherokee | 4 | 0.2% |
| Comanche | 12 | 0.5% |
| Danish | 53 | 2.4% |
| Dutch | 20 | 0.9% |
| Ecuadorian | 4 | 0.2% |
| English | 547 | 24.5% |
| European | 78 | 3.5% |
| Finnish | 3 | 0.1% |
| French | 31 | 1.4% |
| French Canadian | 15 | 0.7% |
| German | 418 | 18.7% |
| Guatemalan | 18 | 0.8% |
| Irish | 238 | 10.7% |
| Italian | 131 | 5.9% |
| Korean | 16 | 0.7% |
| Latvian | 4 | 0.2% |
| Lebanese | 3 | 0.1% |
| Mexican | 84 | 3.8% |
| Mexican American Indian | 44 | 2.0% |
| Native Hawaiian | 1 | 0.0% |
| Navajo | 13 | 0.6% |
| Norwegian | 115 | 5.1% |
| Ottawa | 17 | 0.8% |
| Panamanian | 10 | 0.4% |
| Polish | 61 | 2.7% |
| Portuguese | 8 | 0.4% |
| Scandinavian | 5 | 0.2% |
| Scotch-Irish | 14 | 0.6% |
| Scottish | 149 | 6.7% |
| Shoshone | 12 | 0.5% |
| Slavic | 5 | 0.2% |
| South American | 4 | 0.2% |
| Spaniard | 13 | 0.6% |
| Spanish | 35 | 1.6% |
| Swedish | 110 | 4.9% |
| Swiss | 14 | 0.6% |
| Thai | 4 | 0.2% |
| Welsh | 15 | 0.7% | View All 46 Rows |
Immigrants in Star Valley Ranch
The most numerous immigrant groups reported in Star Valley Ranch came from Central America (34 | 1.5%), Latin America (34 | 1.5%), Mexico (20 | 0.9%), Panama (10 | 0.4%), and Guatemala (4 | 0.2%), together accounting for 4.6% of all Star Valley Ranch residents.
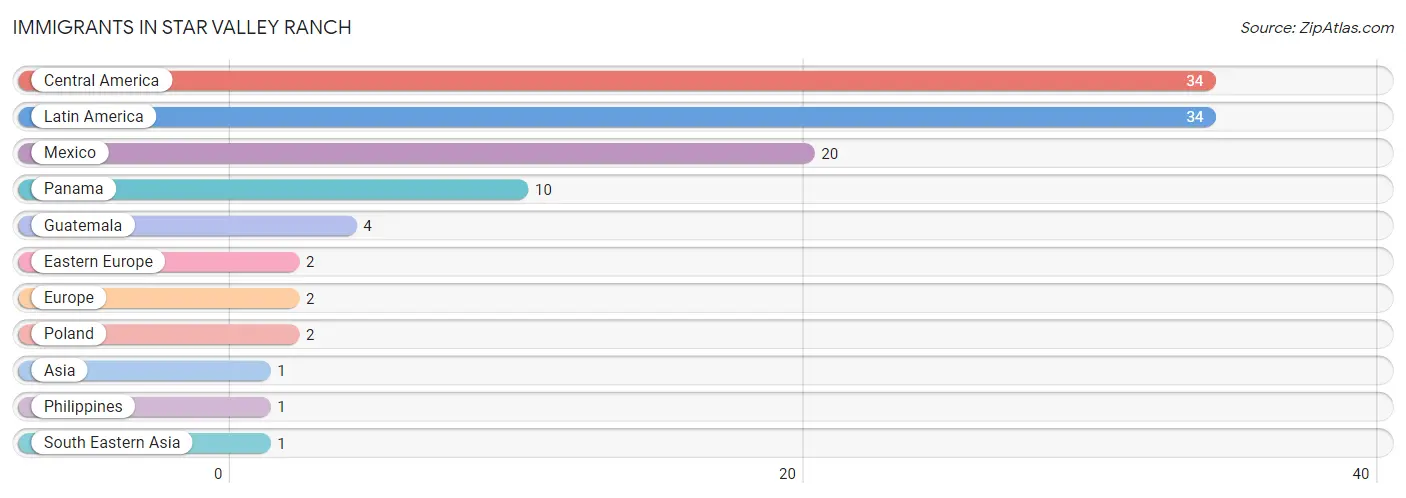
| Immigration Origin | # Population | % Population |
| Asia | 1 | 0.0% |
| Central America | 34 | 1.5% |
| Eastern Europe | 2 | 0.1% |
| Europe | 2 | 0.1% |
| Guatemala | 4 | 0.2% |
| Latin America | 34 | 1.5% |
| Mexico | 20 | 0.9% |
| Panama | 10 | 0.4% |
| Philippines | 1 | 0.0% |
| Poland | 2 | 0.1% |
| South Eastern Asia | 1 | 0.0% | View All 11 Rows |
Sex and Age in Star Valley Ranch
Sex and Age in Star Valley Ranch
The most populous age groups in Star Valley Ranch are 65 to 69 Years (113 | 9.2%) for men and 65 to 69 Years (113 | 11.2%) for women.
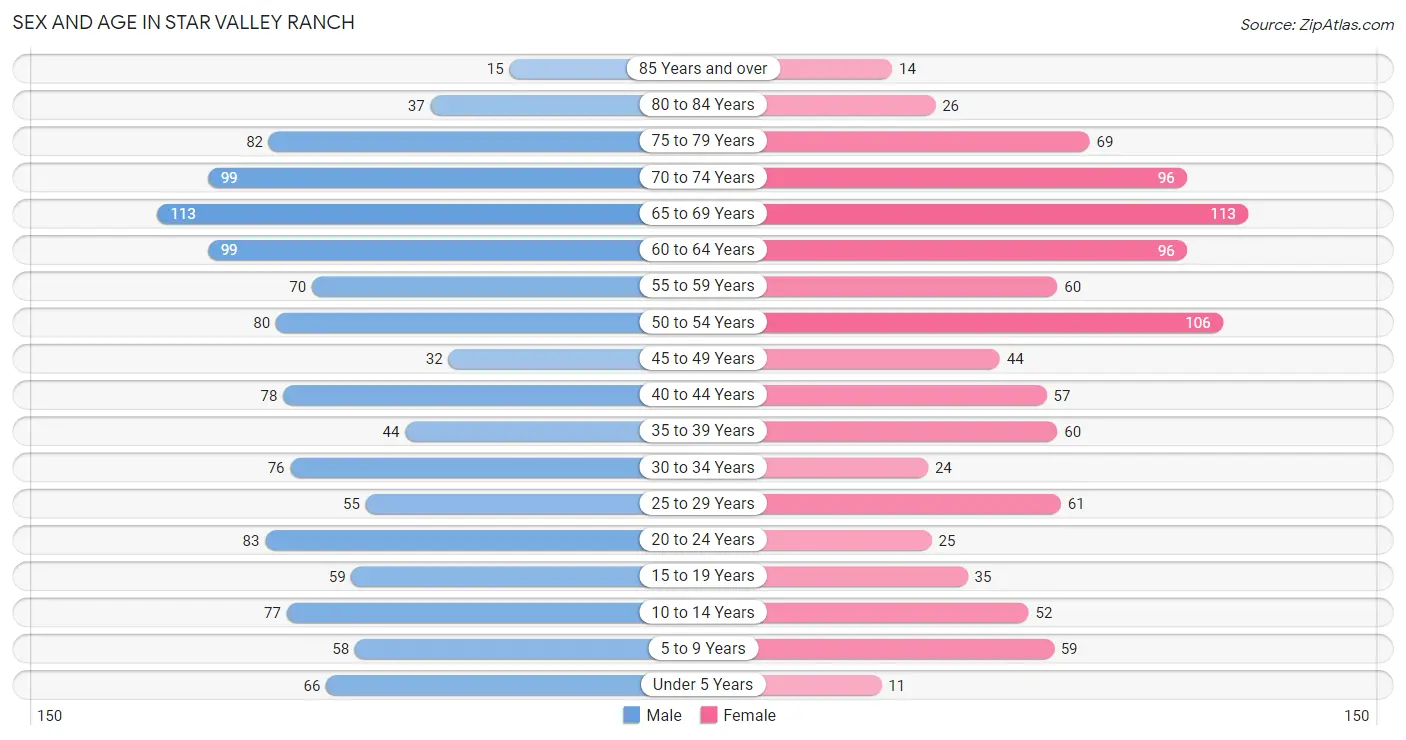
| Age Bracket | Male | Female |
| Under 5 Years | 66 (5.4%) | 11 (1.1%) |
| 5 to 9 Years | 58 (4.7%) | 59 (5.9%) |
| 10 to 14 Years | 77 (6.3%) | 52 (5.2%) |
| 15 to 19 Years | 59 (4.8%) | 35 (3.5%) |
| 20 to 24 Years | 83 (6.8%) | 25 (2.5%) |
| 25 to 29 Years | 55 (4.5%) | 61 (6.0%) |
| 30 to 34 Years | 76 (6.2%) | 24 (2.4%) |
| 35 to 39 Years | 44 (3.6%) | 60 (5.9%) |
| 40 to 44 Years | 78 (6.4%) | 57 (5.7%) |
| 45 to 49 Years | 32 (2.6%) | 44 (4.4%) |
| 50 to 54 Years | 80 (6.5%) | 106 (10.5%) |
| 55 to 59 Years | 70 (5.7%) | 60 (5.9%) |
| 60 to 64 Years | 99 (8.1%) | 96 (9.5%) |
| 65 to 69 Years | 113 (9.2%) | 113 (11.2%) |
| 70 to 74 Years | 99 (8.1%) | 96 (9.5%) |
| 75 to 79 Years | 82 (6.7%) | 69 (6.9%) |
| 80 to 84 Years | 37 (3.0%) | 26 (2.6%) |
| 85 Years and over | 15 (1.2%) | 14 (1.4%) |
| Total | 1,223 (100.0%) | 1,008 (100.0%) |
Families and Households in Star Valley Ranch
Median Family Size in Star Valley Ranch
The median family size in Star Valley Ranch is 2.71 persons per family, with married-couple families (620 | 90.5%) accounting for the largest median family size of 2.75 persons per family. On the other hand, single male/father families (12 | 1.8%) represent the smallest median family size with 2.42 persons per family.
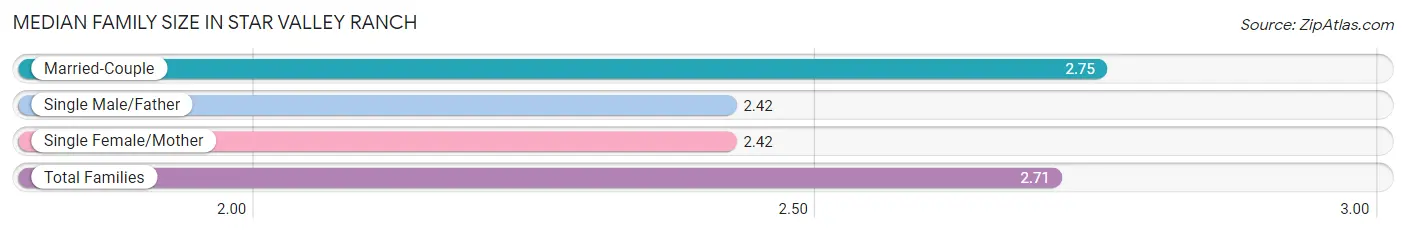
| Family Type | # Families | Family Size |
| Married-Couple | 620 (90.5%) | 2.75 |
| Single Male/Father | 12 (1.8%) | 2.42 |
| Single Female/Mother | 53 (7.7%) | 2.42 |
| Total Families | 685 (100.0%) | 2.71 |
Median Household Size in Star Valley Ranch
The median household size in Star Valley Ranch is 2.50 persons per household, with single male/father households (12 | 1.3%) accounting for the largest median household size of 4.25 persons per household. non-family households (206 | 23.1%) represent the smallest median household size with 1.51 persons per household.
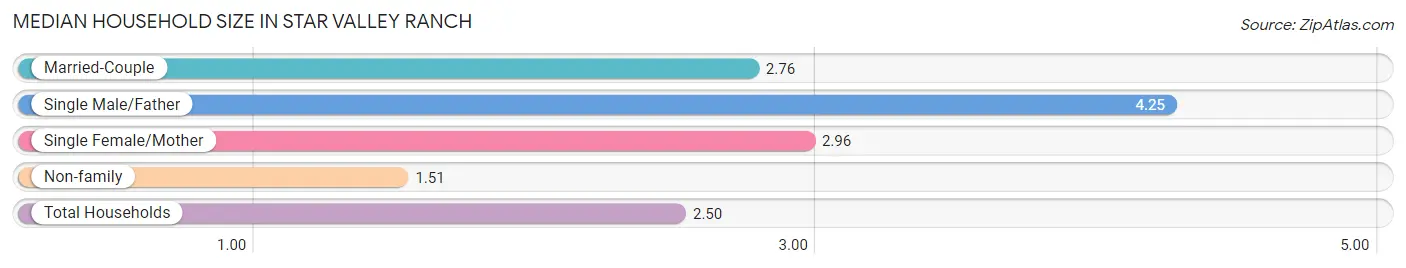
| Household Type | # Households | Household Size |
| Married-Couple | 620 (69.6%) | 2.76 |
| Single Male/Father | 12 (1.3%) | 4.25 |
| Single Female/Mother | 53 (5.9%) | 2.96 |
| Non-family | 206 (23.1%) | 1.51 |
| Total Households | 891 (100.0%) | 2.50 |
Household Size by Marriage Status in Star Valley Ranch
Out of a total of 891 households in Star Valley Ranch, 685 (76.9%) are family households, while 206 (23.1%) are nonfamily households. The most numerous type of family households are 2-person households, comprising 461, and the most common type of nonfamily households are 1-person households, comprising 149.

| Household Size | Family Households | Nonfamily Households |
| 1-Person Households | - | 149 (16.7%) |
| 2-Person Households | 461 (51.7%) | 43 (4.8%) |
| 3-Person Households | 112 (12.6%) | 10 (1.1%) |
| 4-Person Households | 52 (5.8%) | 4 (0.4%) |
| 5-Person Households | 39 (4.4%) | 0 (0.0%) |
| 6-Person Households | 5 (0.6%) | 0 (0.0%) |
| 7+ Person Households | 16 (1.8%) | 0 (0.0%) |
| Total | 685 (76.9%) | 206 (23.1%) |
Female Fertility in Star Valley Ranch
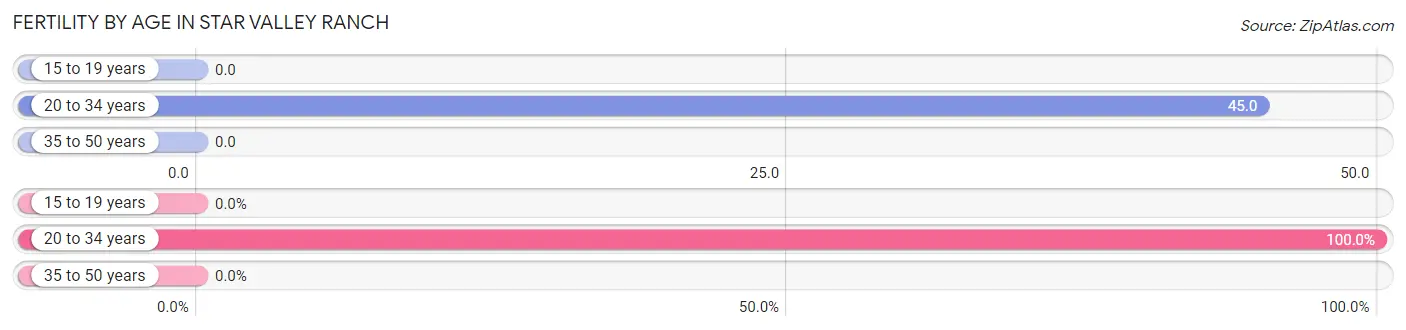
Fertility by Age in Star Valley Ranch
Average fertility rate in Star Valley Ranch is 16.0 births per 1,000 women. Women in the age bracket of 20 to 34 years have the highest fertility rate with 45.0 births per 1,000 women. Women in the age bracket of 20 to 34 years acount for 100.0% of all women with births.
| Age Bracket | Women with Births | Births / 1,000 Women |
| 15 to 19 years | 0 (0.0%) | 0.0 |
| 20 to 34 years | 5 (100.0%) | 45.0 |
| 35 to 50 years | 0 (0.0%) | 0.0 |
| Total | 5 (100.0%) | 16.0 |
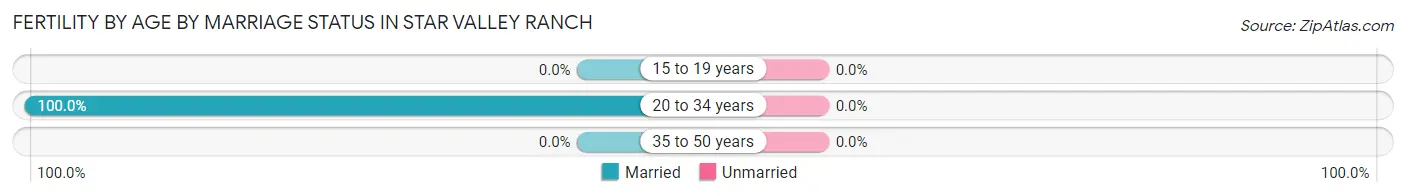
Fertility by Age by Marriage Status in Star Valley Ranch
| Age Bracket | Married | Unmarried |
| 15 to 19 years | 0 (0.0%) | 0 (0.0%) |
| 20 to 34 years | 5 (100.0%) | 0 (0.0%) |
| 35 to 50 years | 0 (0.0%) | 0 (0.0%) |
| Total | 5 (100.0%) | 0 (0.0%) |
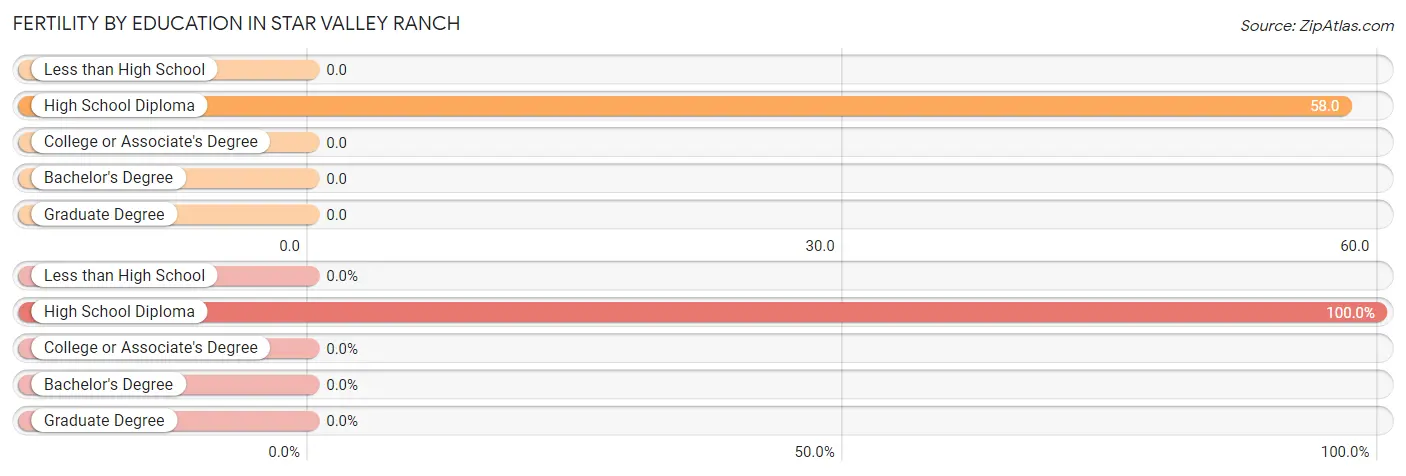
Fertility by Education in Star Valley Ranch
| Educational Attainment | Women with Births | Births / 1,000 Women |
| Less than High School | 0 (0.0%) | 0.0 |
| High School Diploma | 5 (100.0%) | 58.0 |
| College or Associate's Degree | 0 (0.0%) | 0.0 |
| Bachelor's Degree | 0 (0.0%) | 0.0 |
| Graduate Degree | 0 (0.0%) | 0.0 |
| Total | 5 (100.0%) | 16.0 |
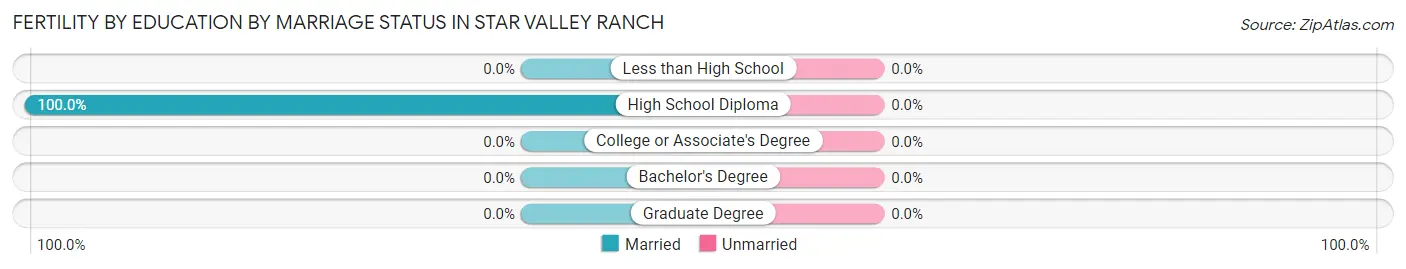
Fertility by Education by Marriage Status in Star Valley Ranch
| Educational Attainment | Married | Unmarried |
| Less than High School | 0 (0.0%) | 0 (0.0%) |
| High School Diploma | 5 (100.0%) | 0 (0.0%) |
| College or Associate's Degree | 0 (0.0%) | 0 (0.0%) |
| Bachelor's Degree | 0 (0.0%) | 0 (0.0%) |
| Graduate Degree | 0 (0.0%) | 0 (0.0%) |
| Total | 5 (100.0%) | 0 (0.0%) |
Employment Characteristics in Star Valley Ranch
Employment by Class of Employer in Star Valley Ranch
Among the 958 employed individuals in Star Valley Ranch, private company employees (568 | 59.3%), self-employed (incorporated) (100 | 10.4%), and self-employed (not incorporated) (99 | 10.3%) make up the most common classes of employment.
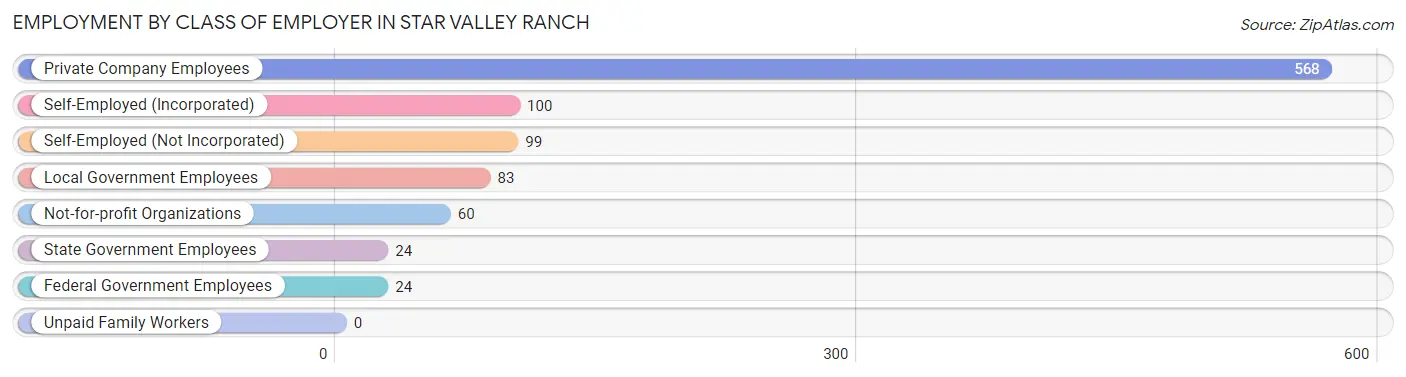
| Employer Class | # Employees | % Employees |
| Private Company Employees | 568 | 59.3% |
| Self-Employed (Incorporated) | 100 | 10.4% |
| Self-Employed (Not Incorporated) | 99 | 10.3% |
| Not-for-profit Organizations | 60 | 6.3% |
| Local Government Employees | 83 | 8.7% |
| State Government Employees | 24 | 2.5% |
| Federal Government Employees | 24 | 2.5% |
| Unpaid Family Workers | 0 | 0.0% |
| Total | 958 | 100.0% |
Employment Status by Age in Star Valley Ranch
According to the labor force statistics for Star Valley Ranch, out of the total population over 16 years of age (1,884), 54.5% or 1,027 individuals are in the labor force, with 1.2% or 12 of them unemployed. The age group with the highest labor force participation rate is 20 to 24 years, with 100.0% or 108 individuals in the labor force. Within the labor force, the 45 to 54 years age range has the highest percentage of unemployed individuals, with 5.5% or 12 of them being unemployed.
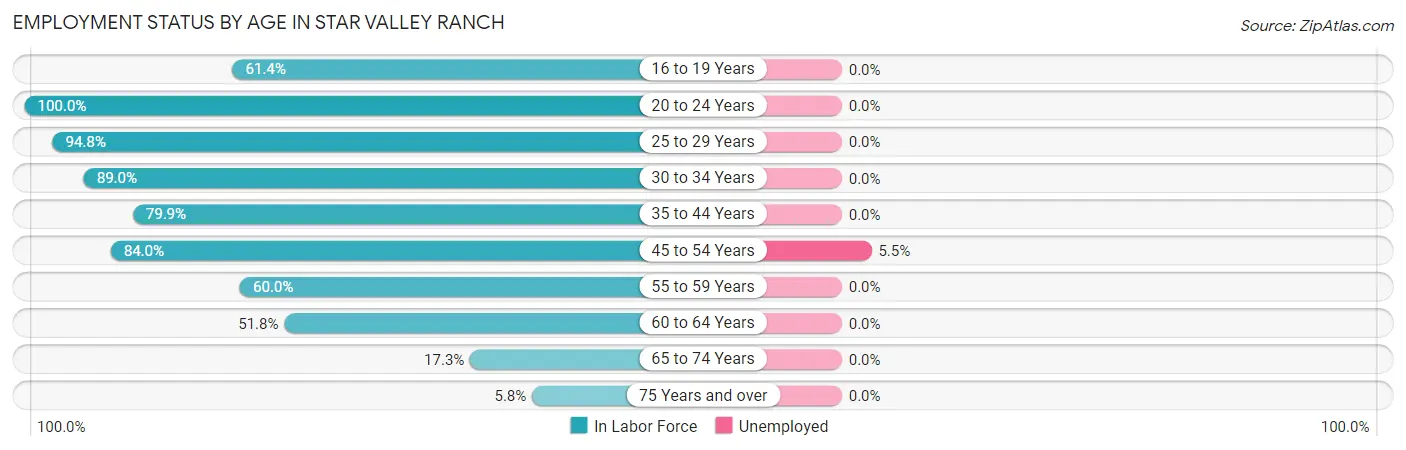
| Age Bracket | In Labor Force | Unemployed |
| 16 to 19 Years | 43 (61.4%) | 0 (0.0%) |
| 20 to 24 Years | 108 (100.0%) | 0 (0.0%) |
| 25 to 29 Years | 110 (94.8%) | 0 (0.0%) |
| 30 to 34 Years | 89 (89.0%) | 0 (0.0%) |
| 35 to 44 Years | 191 (79.9%) | 0 (0.0%) |
| 45 to 54 Years | 220 (84.0%) | 12 (5.5%) |
| 55 to 59 Years | 78 (60.0%) | 0 (0.0%) |
| 60 to 64 Years | 101 (51.8%) | 0 (0.0%) |
| 65 to 74 Years | 73 (17.3%) | 0 (0.0%) |
| 75 Years and over | 14 (5.8%) | 0 (0.0%) |
| Total | 1,027 (54.5%) | 12 (1.2%) |
Employment Status by Educational Attainment in Star Valley Ranch
According to labor force statistics for Star Valley Ranch, 75.7% of individuals (789) out of the total population between 25 and 64 years of age (1,042) are in the labor force, with 1.5% or 12 of them being unemployed. The group with the highest labor force participation rate are those with the educational attainment of less than high school, with 87.7% or 64 individuals in the labor force. Within the labor force, individuals with college / associate degree education have the highest percentage of unemployment, with 4.5% or 12 of them being unemployed.
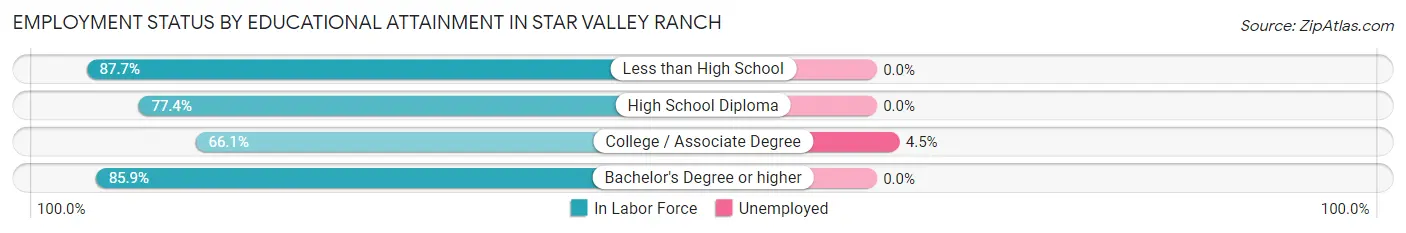
| Educational Attainment | In Labor Force | Unemployed |
| Less than High School | 64 (87.7%) | 0 (0.0%) |
| High School Diploma | 233 (77.4%) | 0 (0.0%) |
| College / Associate Degree | 273 (66.1%) | 19 (4.5%) |
| Bachelor's Degree or higher | 219 (85.9%) | 0 (0.0%) |
| Total | 789 (75.7%) | 16 (1.5%) |
Employment Occupations by Sex in Star Valley Ranch
Management, Business, Science and Arts Occupations
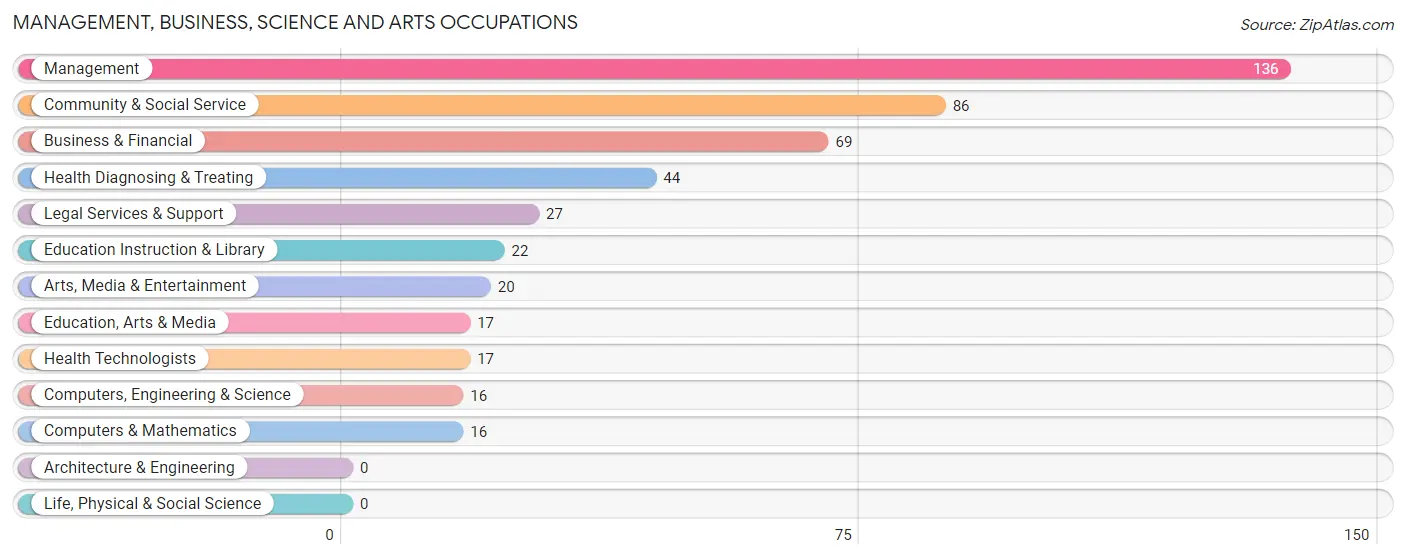
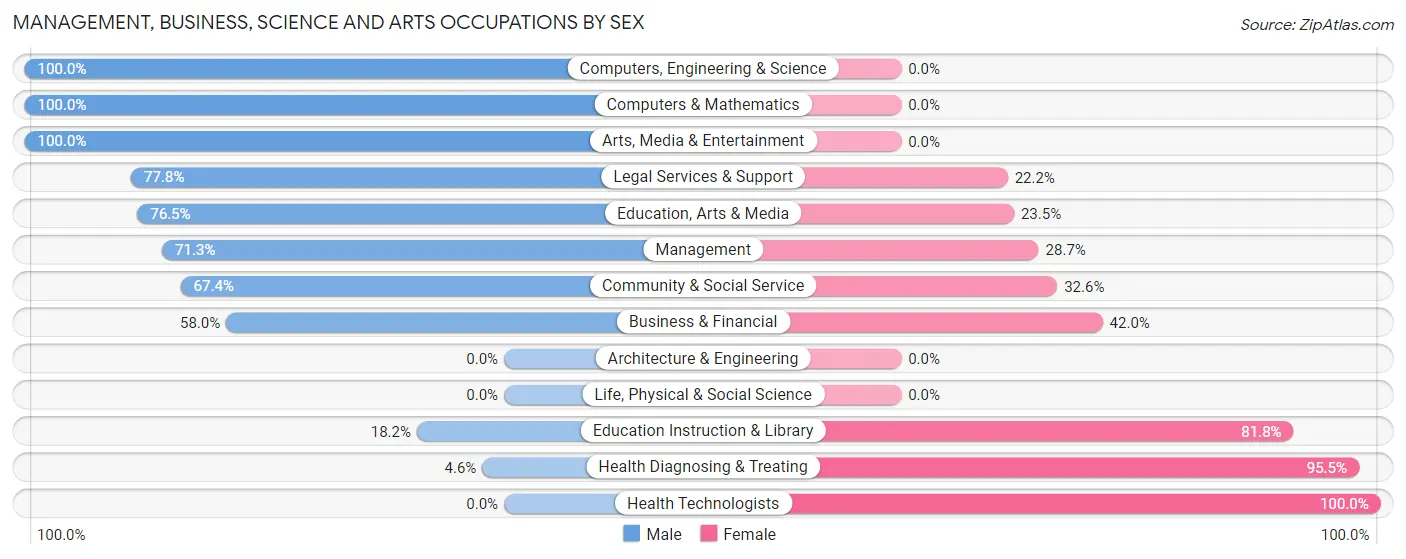
The most common Management, Business, Science and Arts occupations in Star Valley Ranch are Management (136 | 13.5%), Community & Social Service (86 | 8.5%), Business & Financial (69 | 6.9%), Health Diagnosing & Treating (44 | 4.4%), and Legal Services & Support (27 | 2.7%).
Management, Business, Science and Arts Occupations by Sex
Within the Management, Business, Science and Arts occupations in Star Valley Ranch, the most male-oriented occupations are Computers, Engineering & Science (100.0%), Computers & Mathematics (100.0%), and Arts, Media & Entertainment (100.0%), while the most female-oriented occupations are Health Technologists (100.0%), Health Diagnosing & Treating (95.5%), and Education Instruction & Library (81.8%).
| Occupation | Male | Female |
| Management | 97 (71.3%) | 39 (28.7%) |
| Business & Financial | 40 (58.0%) | 29 (42.0%) |
| Computers, Engineering & Science | 16 (100.0%) | 0 (0.0%) |
| Computers & Mathematics | 16 (100.0%) | 0 (0.0%) |
| Architecture & Engineering | 0 (0.0%) | 0 (0.0%) |
| Life, Physical & Social Science | 0 (0.0%) | 0 (0.0%) |
| Community & Social Service | 58 (67.4%) | 28 (32.6%) |
| Education, Arts & Media | 13 (76.5%) | 4 (23.5%) |
| Legal Services & Support | 21 (77.8%) | 6 (22.2%) |
| Education Instruction & Library | 4 (18.2%) | 18 (81.8%) |
| Arts, Media & Entertainment | 20 (100.0%) | 0 (0.0%) |
| Health Diagnosing & Treating | 2 (4.5%) | 42 (95.5%) |
| Health Technologists | 0 (0.0%) | 17 (100.0%) |
| Total (Category) | 213 (60.7%) | 138 (39.3%) |
| Total (Overall) | 608 (60.4%) | 399 (39.6%) |
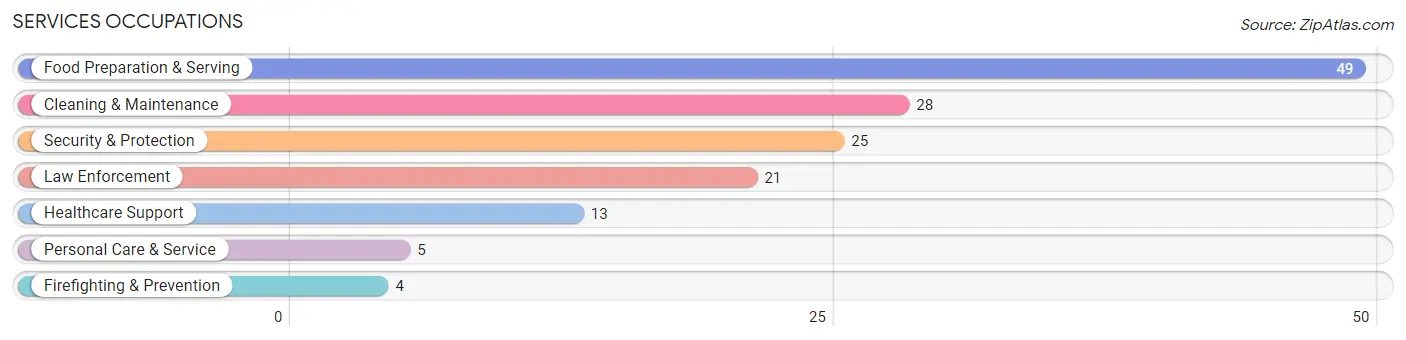
Services Occupations
The most common Services occupations in Star Valley Ranch are Food Preparation & Serving (49 | 4.9%), Cleaning & Maintenance (28 | 2.8%), Security & Protection (25 | 2.5%), Law Enforcement (21 | 2.1%), and Healthcare Support (13 | 1.3%).
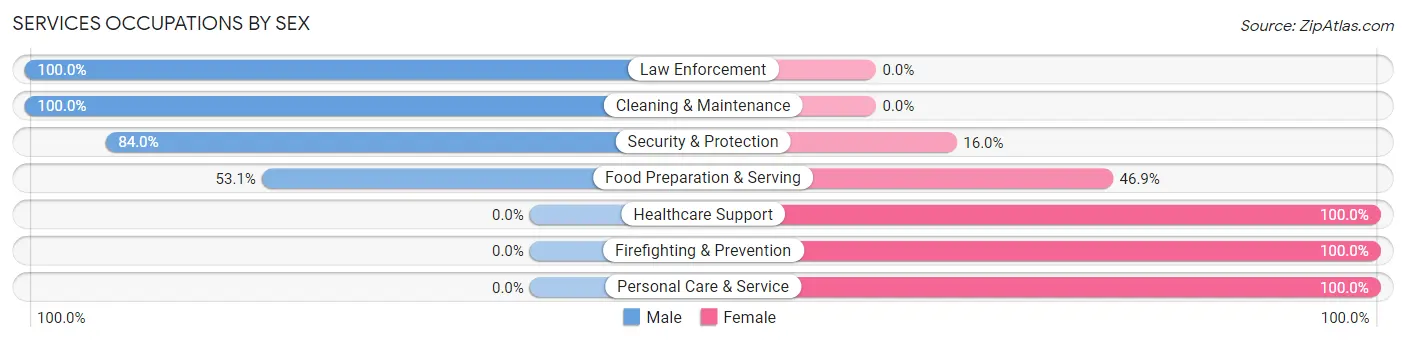
Services Occupations by Sex
Within the Services occupations in Star Valley Ranch, the most male-oriented occupations are Law Enforcement (100.0%), Cleaning & Maintenance (100.0%), and Security & Protection (84.0%), while the most female-oriented occupations are Healthcare Support (100.0%), Firefighting & Prevention (100.0%), and Personal Care & Service (100.0%).
| Occupation | Male | Female |
| Healthcare Support | 0 (0.0%) | 13 (100.0%) |
| Security & Protection | 21 (84.0%) | 4 (16.0%) |
| Firefighting & Prevention | 0 (0.0%) | 4 (100.0%) |
| Law Enforcement | 21 (100.0%) | 0 (0.0%) |
| Food Preparation & Serving | 26 (53.1%) | 23 (46.9%) |
| Cleaning & Maintenance | 28 (100.0%) | 0 (0.0%) |
| Personal Care & Service | 0 (0.0%) | 5 (100.0%) |
| Total (Category) | 75 (62.5%) | 45 (37.5%) |
| Total (Overall) | 608 (60.4%) | 399 (39.6%) |
Sales and Office Occupations
The most common Sales and Office occupations in Star Valley Ranch are Office & Administration (143 | 14.2%), and Sales & Related (109 | 10.8%).
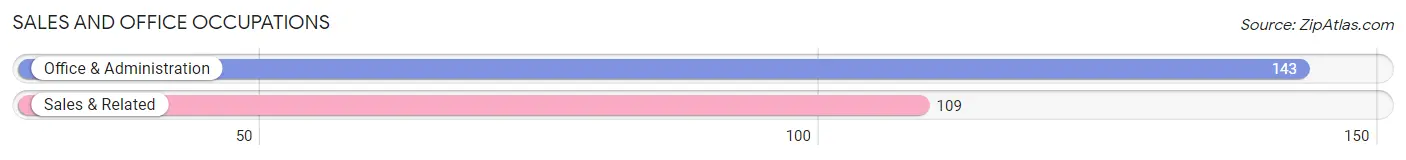
Sales and Office Occupations by Sex
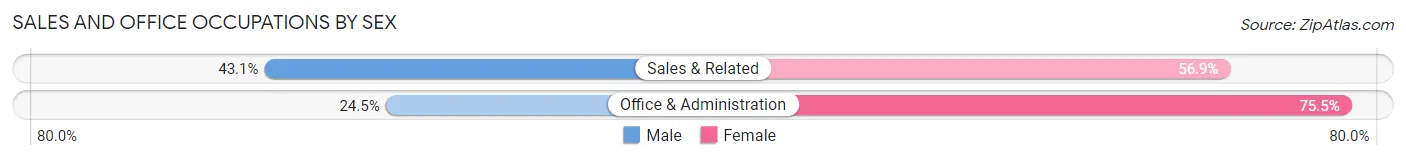
| Occupation | Male | Female |
| Sales & Related | 47 (43.1%) | 62 (56.9%) |
| Office & Administration | 35 (24.5%) | 108 (75.5%) |
| Total (Category) | 82 (32.5%) | 170 (67.5%) |
| Total (Overall) | 608 (60.4%) | 399 (39.6%) |
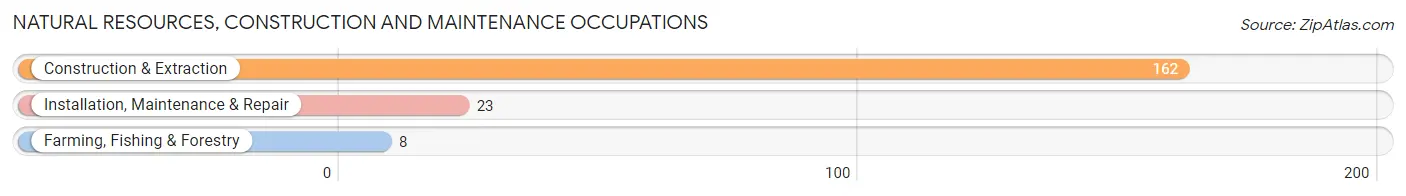
Natural Resources, Construction and Maintenance Occupations
The most common Natural Resources, Construction and Maintenance occupations in Star Valley Ranch are Construction & Extraction (162 | 16.1%), Installation, Maintenance & Repair (23 | 2.3%), and Farming, Fishing & Forestry (8 | 0.8%).
Natural Resources, Construction and Maintenance Occupations by Sex
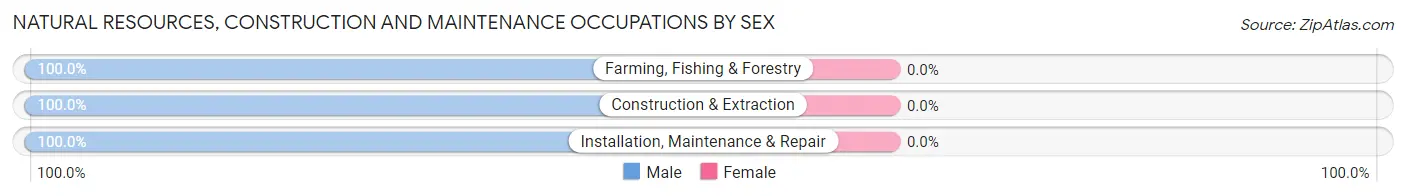
| Occupation | Male | Female |
| Farming, Fishing & Forestry | 8 (100.0%) | 0 (0.0%) |
| Construction & Extraction | 162 (100.0%) | 0 (0.0%) |
| Installation, Maintenance & Repair | 23 (100.0%) | 0 (0.0%) |
| Total (Category) | 193 (100.0%) | 0 (0.0%) |
| Total (Overall) | 608 (60.4%) | 399 (39.6%) |
Production, Transportation and Moving Occupations
The most common Production, Transportation and Moving occupations in Star Valley Ranch are Production (66 | 6.6%), Transportation (15 | 1.5%), and Material Moving (10 | 1.0%).
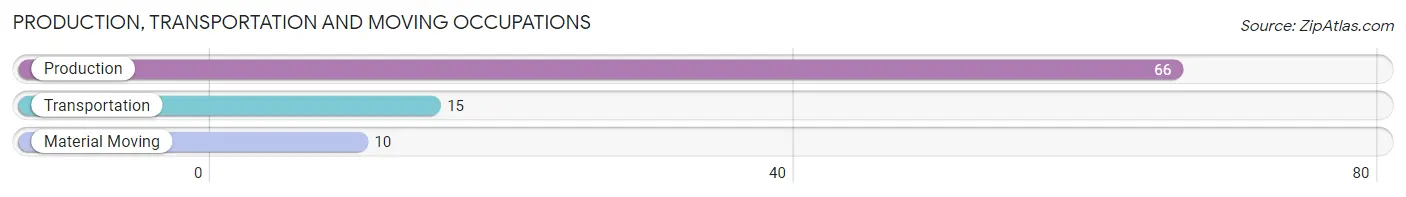
Production, Transportation and Moving Occupations by Sex
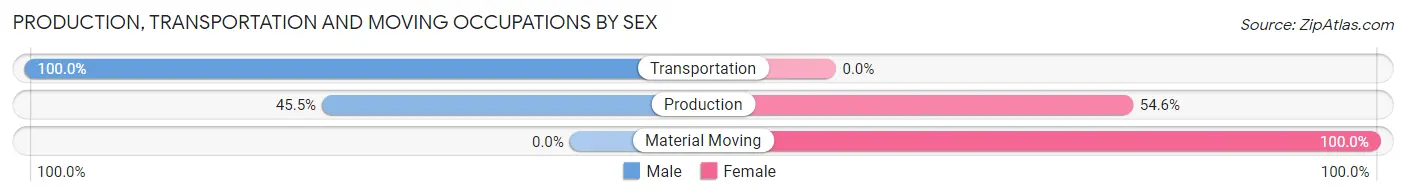
| Occupation | Male | Female |
| Production | 30 (45.5%) | 36 (54.5%) |
| Transportation | 15 (100.0%) | 0 (0.0%) |
| Material Moving | 0 (0.0%) | 10 (100.0%) |
| Total (Category) | 45 (49.4%) | 46 (50.5%) |
| Total (Overall) | 608 (60.4%) | 399 (39.6%) |
Employment Industries by Sex in Star Valley Ranch
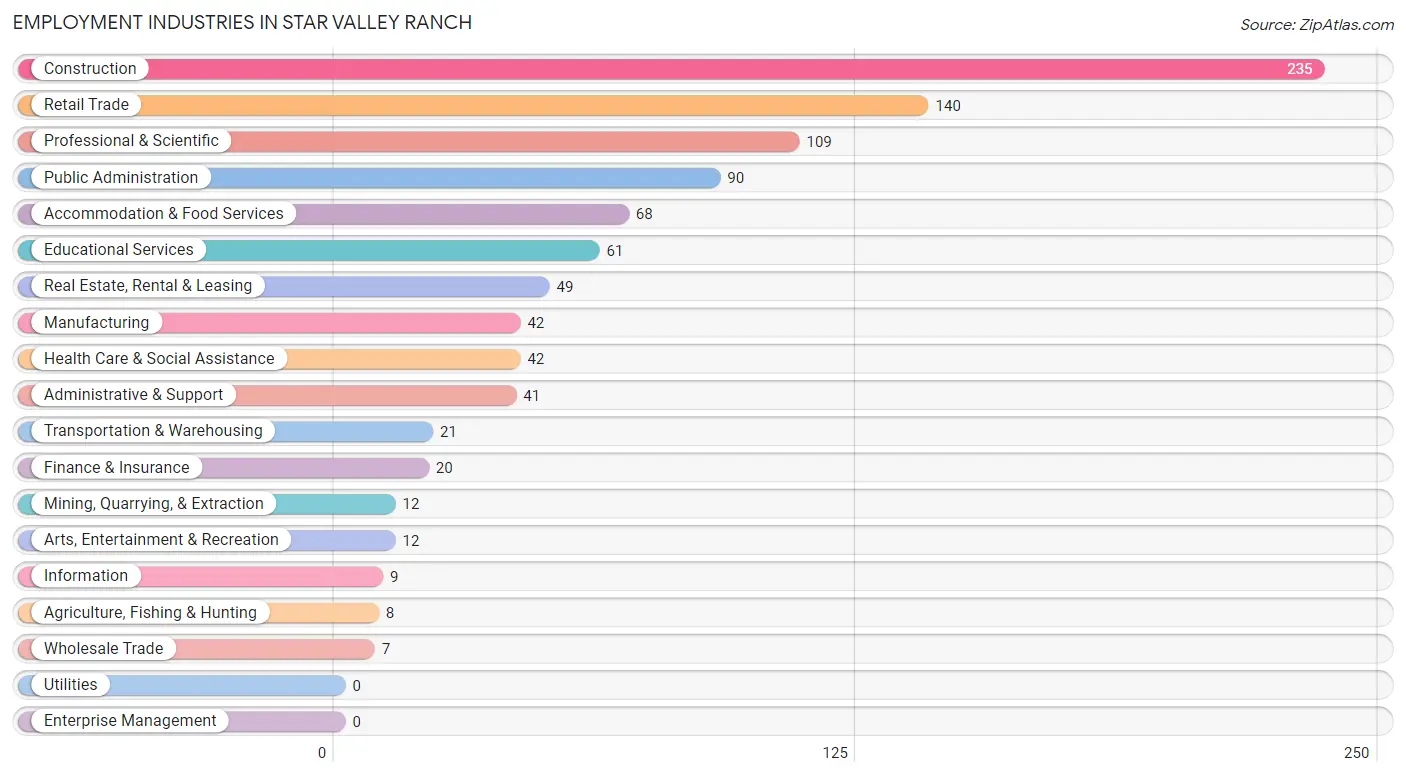
Employment Industries in Star Valley Ranch
The major employment industries in Star Valley Ranch include Construction (235 | 23.3%), Retail Trade (140 | 13.9%), Professional & Scientific (109 | 10.8%), Public Administration (90 | 8.9%), and Accommodation & Food Services (68 | 6.8%).
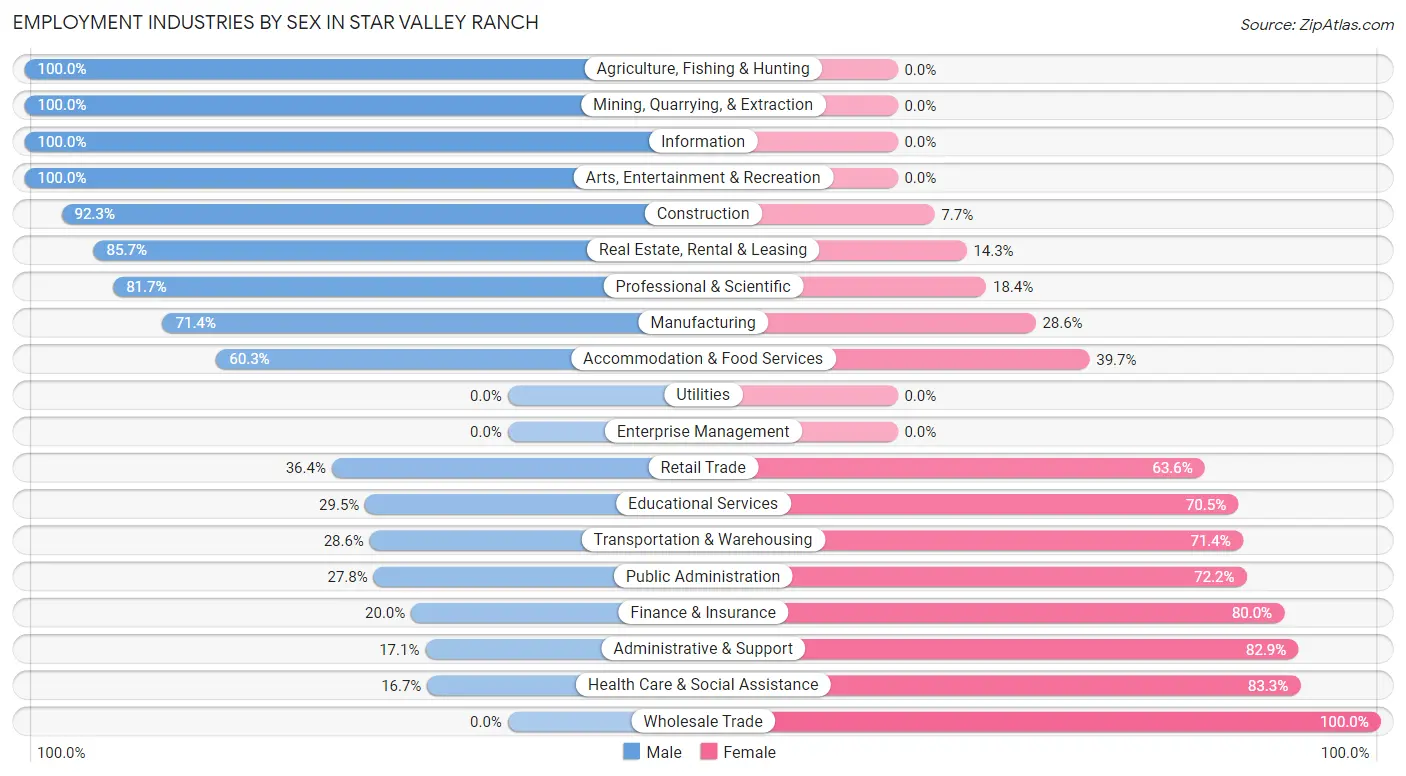
Employment Industries by Sex in Star Valley Ranch
The Star Valley Ranch industries that see more men than women are Agriculture, Fishing & Hunting (100.0%), Mining, Quarrying, & Extraction (100.0%), and Information (100.0%), whereas the industries that tend to have a higher number of women are Wholesale Trade (100.0%), Health Care & Social Assistance (83.3%), and Administrative & Support (82.9%).
| Industry | Male | Female |
| Agriculture, Fishing & Hunting | 8 (100.0%) | 0 (0.0%) |
| Mining, Quarrying, & Extraction | 12 (100.0%) | 0 (0.0%) |
| Construction | 217 (92.3%) | 18 (7.7%) |
| Manufacturing | 30 (71.4%) | 12 (28.6%) |
| Wholesale Trade | 0 (0.0%) | 7 (100.0%) |
| Retail Trade | 51 (36.4%) | 89 (63.6%) |
| Transportation & Warehousing | 6 (28.6%) | 15 (71.4%) |
| Utilities | 0 (0.0%) | 0 (0.0%) |
| Information | 9 (100.0%) | 0 (0.0%) |
| Finance & Insurance | 4 (20.0%) | 16 (80.0%) |
| Real Estate, Rental & Leasing | 42 (85.7%) | 7 (14.3%) |
| Professional & Scientific | 89 (81.7%) | 20 (18.3%) |
| Enterprise Management | 0 (0.0%) | 0 (0.0%) |
| Administrative & Support | 7 (17.1%) | 34 (82.9%) |
| Educational Services | 18 (29.5%) | 43 (70.5%) |
| Health Care & Social Assistance | 7 (16.7%) | 35 (83.3%) |
| Arts, Entertainment & Recreation | 12 (100.0%) | 0 (0.0%) |
| Accommodation & Food Services | 41 (60.3%) | 27 (39.7%) |
| Public Administration | 25 (27.8%) | 65 (72.2%) |
| Total | 608 (60.4%) | 399 (39.6%) |
Education in Star Valley Ranch
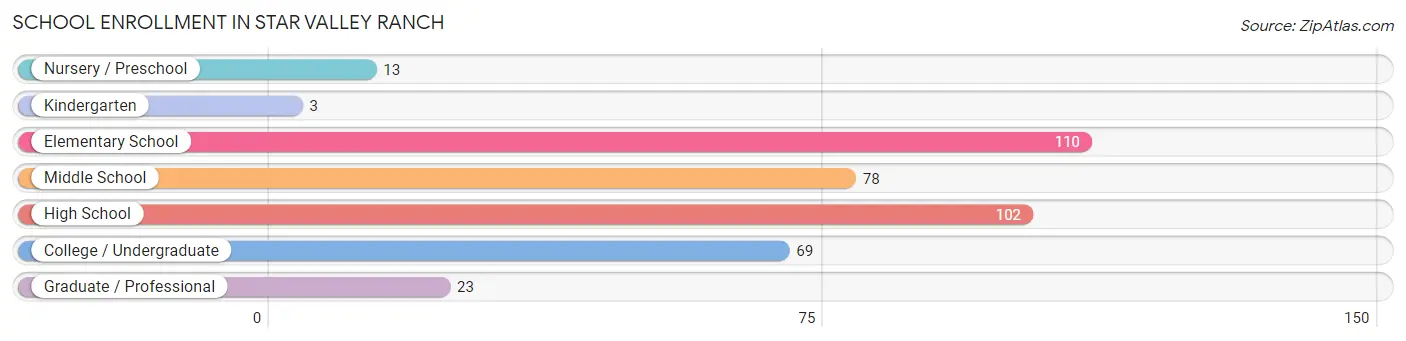
School Enrollment in Star Valley Ranch
The most common levels of schooling among the 398 students in Star Valley Ranch are elementary school (110 | 27.6%), high school (102 | 25.6%), and middle school (78 | 19.6%).
| School Level | # Students | % Students |
| Nursery / Preschool | 13 | 3.3% |
| Kindergarten | 3 | 0.7% |
| Elementary School | 110 | 27.6% |
| Middle School | 78 | 19.6% |
| High School | 102 | 25.6% |
| College / Undergraduate | 69 | 17.3% |
| Graduate / Professional | 23 | 5.8% |
| Total | 398 | 100.0% |
School Enrollment by Age by Funding Source in Star Valley Ranch
Out of a total of 398 students who are enrolled in schools in Star Valley Ranch, 41 (10.3%) attend a private institution, while the remaining 357 (89.7%) are enrolled in public schools. The age group of 25 to 34 year olds has the highest likelihood of being enrolled in private schools, with 13 (68.4% in the age bracket) enrolled. Conversely, the age group of 3 to 4 year olds has the lowest likelihood of being enrolled in a private school, with 5 (100.0% in the age bracket) attending a public institution.
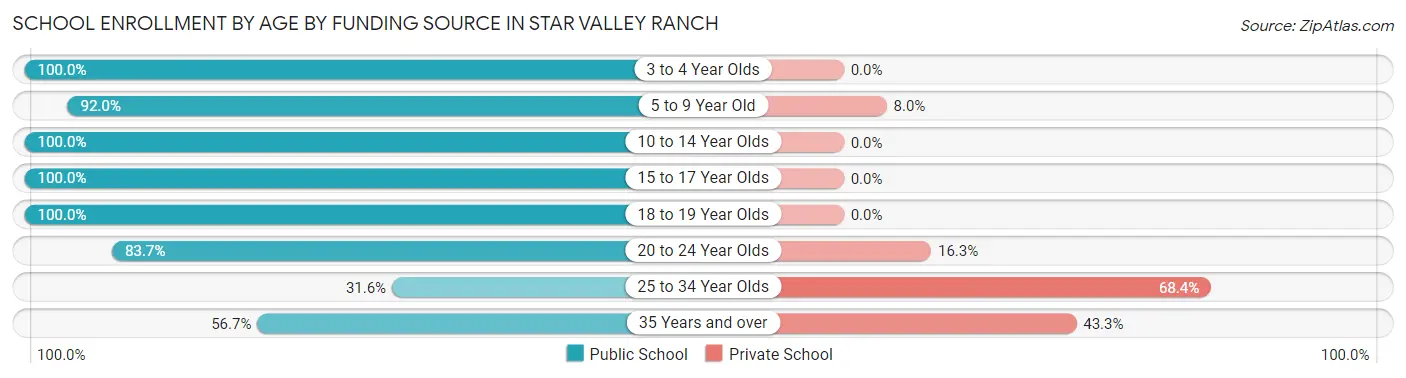
| Age Bracket | Public School | Private School |
| 3 to 4 Year Olds | 5 (100.0%) | 0 (0.0%) |
| 5 to 9 Year Old | 92 (92.0%) | 8 (8.0%) |
| 10 to 14 Year Olds | 129 (100.0%) | 0 (0.0%) |
| 15 to 17 Year Olds | 62 (100.0%) | 0 (0.0%) |
| 18 to 19 Year Olds | 10 (100.0%) | 0 (0.0%) |
| 20 to 24 Year Olds | 36 (83.7%) | 7 (16.3%) |
| 25 to 34 Year Olds | 6 (31.6%) | 13 (68.4%) |
| 35 Years and over | 17 (56.7%) | 13 (43.3%) |
| Total | 357 (89.7%) | 41 (10.3%) |
Educational Attainment by Field of Study in Star Valley Ranch
Education (144 | 23.3%), business (120 | 19.5%), bio, nature & agricultural (83 | 13.5%), engineering (67 | 10.9%), and computers & mathematics (40 | 6.5%) are the most common fields of study among 617 individuals in Star Valley Ranch who have obtained a bachelor's degree or higher.
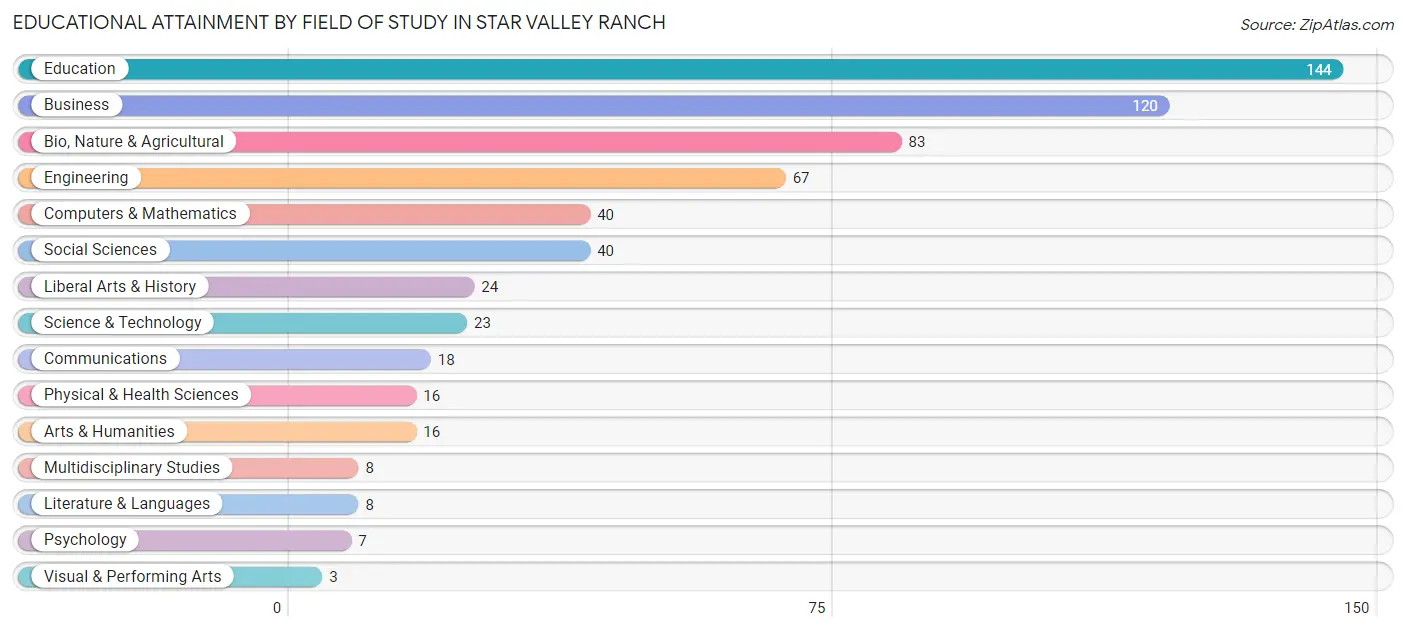
| Field of Study | # Graduates | % Graduates |
| Computers & Mathematics | 40 | 6.5% |
| Bio, Nature & Agricultural | 83 | 13.5% |
| Physical & Health Sciences | 16 | 2.6% |
| Psychology | 7 | 1.1% |
| Social Sciences | 40 | 6.5% |
| Engineering | 67 | 10.9% |
| Multidisciplinary Studies | 8 | 1.3% |
| Science & Technology | 23 | 3.7% |
| Business | 120 | 19.5% |
| Education | 144 | 23.3% |
| Literature & Languages | 8 | 1.3% |
| Liberal Arts & History | 24 | 3.9% |
| Visual & Performing Arts | 3 | 0.5% |
| Communications | 18 | 2.9% |
| Arts & Humanities | 16 | 2.6% |
| Total | 617 | 100.0% |
Transportation & Commute in Star Valley Ranch
Vehicle Availability by Sex in Star Valley Ranch
The most prevalent vehicle ownership categories in Star Valley Ranch are males with 2 vehicles (284, accounting for 49.0%) and females with 2 vehicles (174, making up 75.1%).
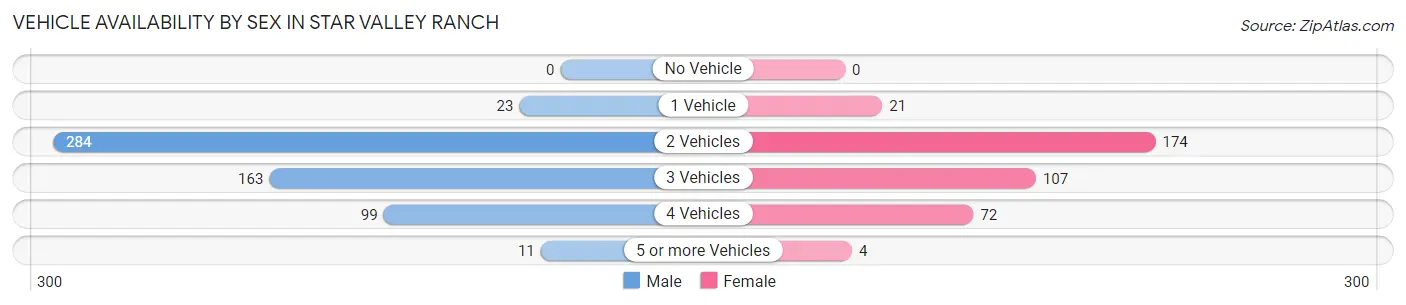
| Vehicles Available | Male | Female |
| No Vehicle | 0 (0.0%) | 0 (0.0%) |
| 1 Vehicle | 23 (4.0%) | 21 (5.6%) |
| 2 Vehicles | 284 (49.0%) | 174 (46.0%) |
| 3 Vehicles | 163 (28.1%) | 107 (28.3%) |
| 4 Vehicles | 99 (17.1%) | 72 (19.1%) |
| 5 or more Vehicles | 11 (1.9%) | 4 (1.1%) |
| Total | 580 (100.0%) | 378 (100.0%) |
Commute Time in Star Valley Ranch
The most frequently occuring commute durations in Star Valley Ranch are 60 to 89 minutes (231 commuters, 31.2%), 30 to 34 minutes (153 commuters, 20.6%), and 90 or more minutes (76 commuters, 10.3%).
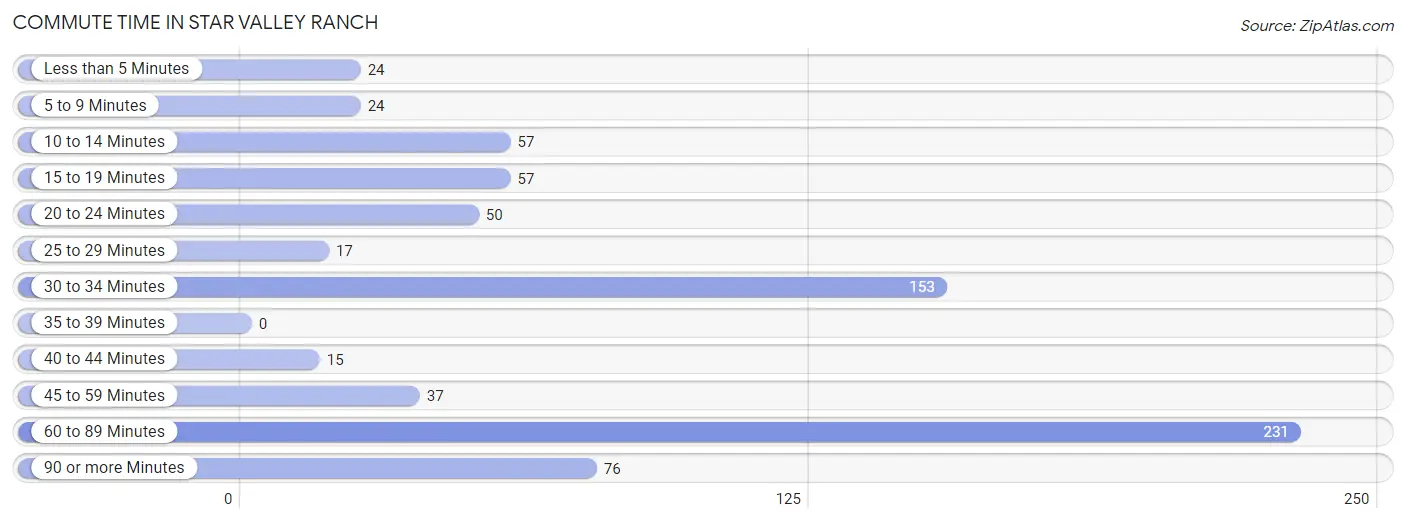
| Commute Time | # Commuters | % Commuters |
| Less than 5 Minutes | 24 | 3.2% |
| 5 to 9 Minutes | 24 | 3.2% |
| 10 to 14 Minutes | 57 | 7.7% |
| 15 to 19 Minutes | 57 | 7.7% |
| 20 to 24 Minutes | 50 | 6.8% |
| 25 to 29 Minutes | 17 | 2.3% |
| 30 to 34 Minutes | 153 | 20.6% |
| 35 to 39 Minutes | 0 | 0.0% |
| 40 to 44 Minutes | 15 | 2.0% |
| 45 to 59 Minutes | 37 | 5.0% |
| 60 to 89 Minutes | 231 | 31.2% |
| 90 or more Minutes | 76 | 10.3% |
Commute Time by Sex in Star Valley Ranch
The most common commute times in Star Valley Ranch are 60 to 89 minutes (172 commuters, 38.1%) for males and 30 to 34 minutes (84 commuters, 29.1%) for females.

| Commute Time | Male | Female |
| Less than 5 Minutes | 5 (1.1%) | 19 (6.6%) |
| 5 to 9 Minutes | 15 (3.3%) | 9 (3.1%) |
| 10 to 14 Minutes | 40 (8.8%) | 17 (5.9%) |
| 15 to 19 Minutes | 41 (9.1%) | 16 (5.5%) |
| 20 to 24 Minutes | 34 (7.5%) | 16 (5.5%) |
| 25 to 29 Minutes | 8 (1.8%) | 9 (3.1%) |
| 30 to 34 Minutes | 69 (15.3%) | 84 (29.1%) |
| 35 to 39 Minutes | 0 (0.0%) | 0 (0.0%) |
| 40 to 44 Minutes | 15 (3.3%) | 0 (0.0%) |
| 45 to 59 Minutes | 22 (4.9%) | 15 (5.2%) |
| 60 to 89 Minutes | 172 (38.1%) | 59 (20.4%) |
| 90 or more Minutes | 31 (6.9%) | 45 (15.6%) |
Time of Departure to Work by Sex in Star Valley Ranch
The most frequent times of departure to work in Star Valley Ranch are 6:30 AM to 6:59 AM (60, 13.3%) for males and 6:30 AM to 6:59 AM (61, 21.1%) for females.
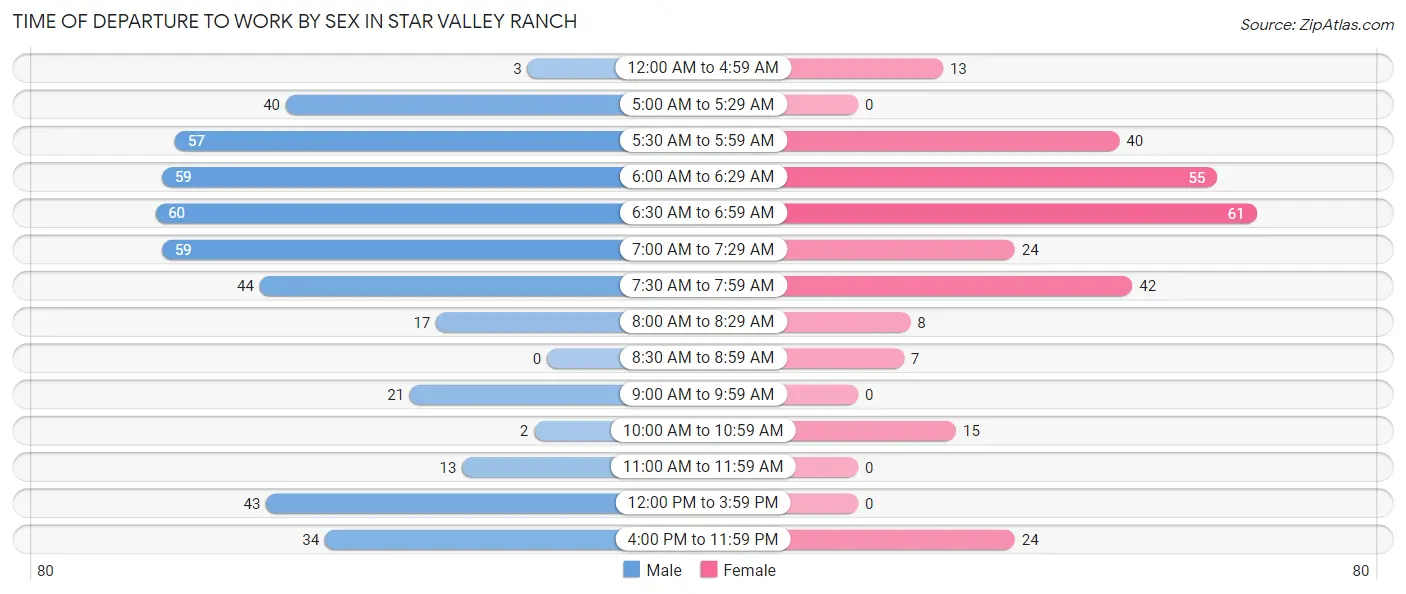
| Time of Departure | Male | Female |
| 12:00 AM to 4:59 AM | 3 (0.7%) | 13 (4.5%) |
| 5:00 AM to 5:29 AM | 40 (8.8%) | 0 (0.0%) |
| 5:30 AM to 5:59 AM | 57 (12.6%) | 40 (13.8%) |
| 6:00 AM to 6:29 AM | 59 (13.1%) | 55 (19.0%) |
| 6:30 AM to 6:59 AM | 60 (13.3%) | 61 (21.1%) |
| 7:00 AM to 7:29 AM | 59 (13.1%) | 24 (8.3%) |
| 7:30 AM to 7:59 AM | 44 (9.7%) | 42 (14.5%) |
| 8:00 AM to 8:29 AM | 17 (3.8%) | 8 (2.8%) |
| 8:30 AM to 8:59 AM | 0 (0.0%) | 7 (2.4%) |
| 9:00 AM to 9:59 AM | 21 (4.6%) | 0 (0.0%) |
| 10:00 AM to 10:59 AM | 2 (0.4%) | 15 (5.2%) |
| 11:00 AM to 11:59 AM | 13 (2.9%) | 0 (0.0%) |
| 12:00 PM to 3:59 PM | 43 (9.5%) | 0 (0.0%) |
| 4:00 PM to 11:59 PM | 34 (7.5%) | 24 (8.3%) |
| Total | 452 (100.0%) | 289 (100.0%) |
Housing Occupancy in Star Valley Ranch
Occupancy by Ownership in Star Valley Ranch
Of the total 891 dwellings in Star Valley Ranch, owner-occupied units account for 816 (91.6%), while renter-occupied units make up 75 (8.4%).
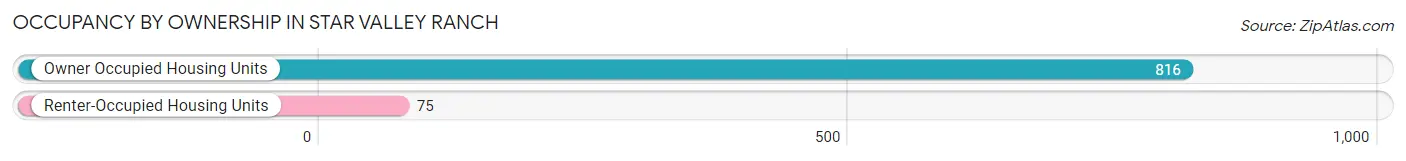
| Occupancy | # Housing Units | % Housing Units |
| Owner Occupied Housing Units | 816 | 91.6% |
| Renter-Occupied Housing Units | 75 | 8.4% |
| Total Occupied Housing Units | 891 | 100.0% |
Occupancy by Household Size in Star Valley Ranch
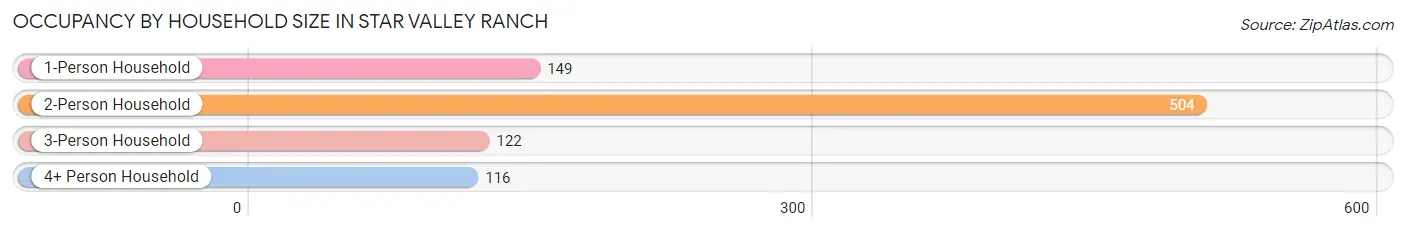
| Household Size | # Housing Units | % Housing Units |
| 1-Person Household | 149 | 16.7% |
| 2-Person Household | 504 | 56.6% |
| 3-Person Household | 122 | 13.7% |
| 4+ Person Household | 116 | 13.0% |
| Total Housing Units | 891 | 100.0% |
Occupancy by Ownership by Household Size in Star Valley Ranch
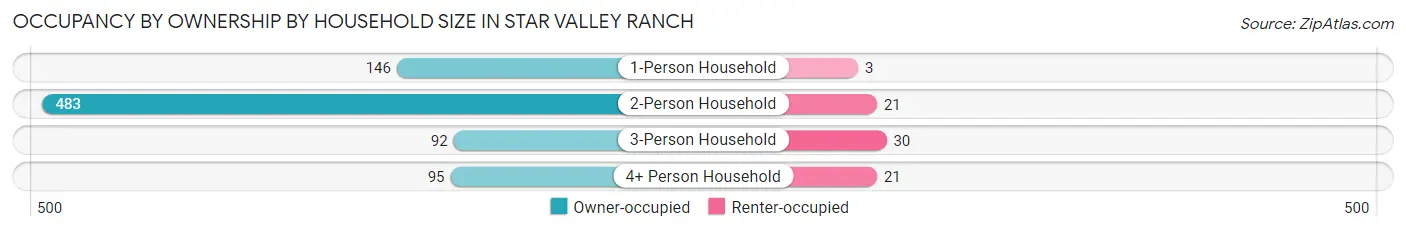
| Household Size | Owner-occupied | Renter-occupied |
| 1-Person Household | 146 (98.0%) | 3 (2.0%) |
| 2-Person Household | 483 (95.8%) | 21 (4.2%) |
| 3-Person Household | 92 (75.4%) | 30 (24.6%) |
| 4+ Person Household | 95 (81.9%) | 21 (18.1%) |
| Total Housing Units | 816 (91.6%) | 75 (8.4%) |
Occupancy by Educational Attainment in Star Valley Ranch
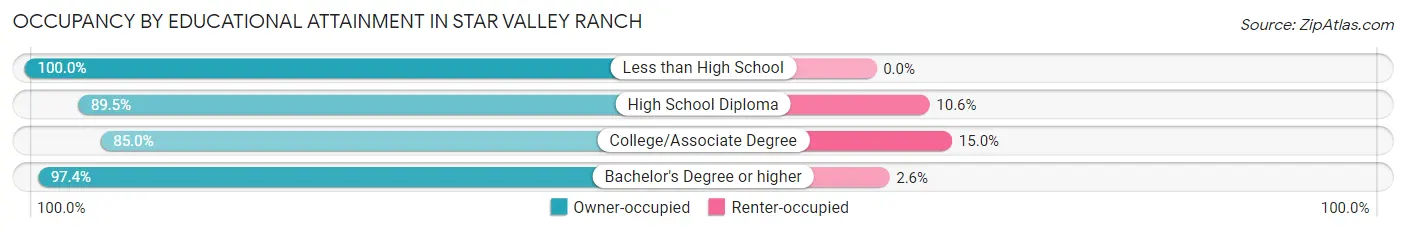
| Household Size | Owner-occupied | Renter-occupied |
| Less than High School | 15 (100.0%) | 0 (0.0%) |
| High School Diploma | 178 (89.4%) | 21 (10.5%) |
| College/Associate Degree | 249 (85.0%) | 44 (15.0%) |
| Bachelor's Degree or higher | 374 (97.4%) | 10 (2.6%) |
Occupancy by Age of Householder in Star Valley Ranch
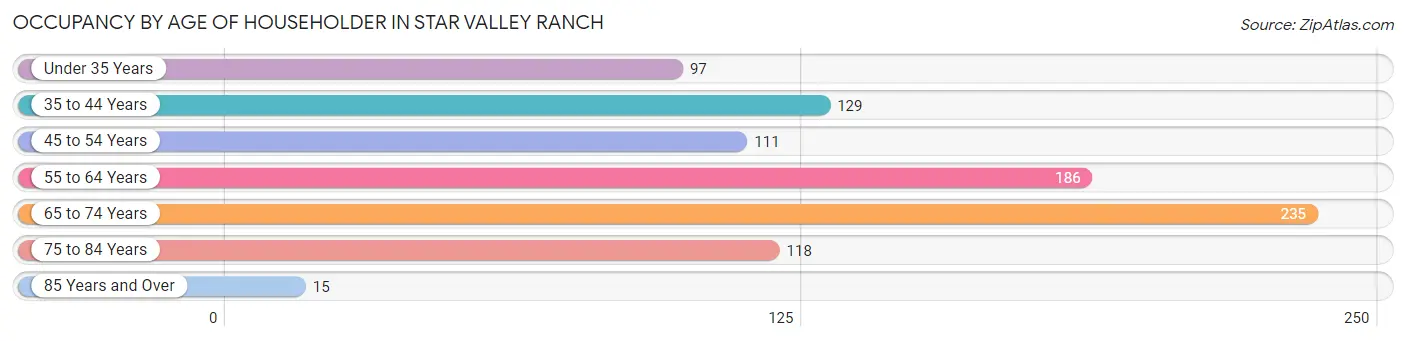
| Age Bracket | # Households | % Households |
| Under 35 Years | 97 | 10.9% |
| 35 to 44 Years | 129 | 14.5% |
| 45 to 54 Years | 111 | 12.5% |
| 55 to 64 Years | 186 | 20.9% |
| 65 to 74 Years | 235 | 26.4% |
| 75 to 84 Years | 118 | 13.2% |
| 85 Years and Over | 15 | 1.7% |
| Total | 891 | 100.0% |
Housing Finances in Star Valley Ranch
Median Income by Occupancy in Star Valley Ranch
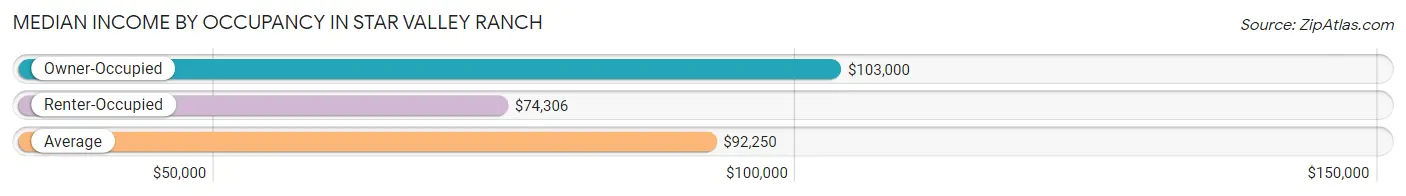
| Occupancy Type | # Households | Median Income |
| Owner-Occupied | 816 (91.6%) | $103,000 |
| Renter-Occupied | 75 (8.4%) | $74,306 |
| Average | 891 (100.0%) | $92,250 |
Occupancy by Householder Income Bracket in Star Valley Ranch
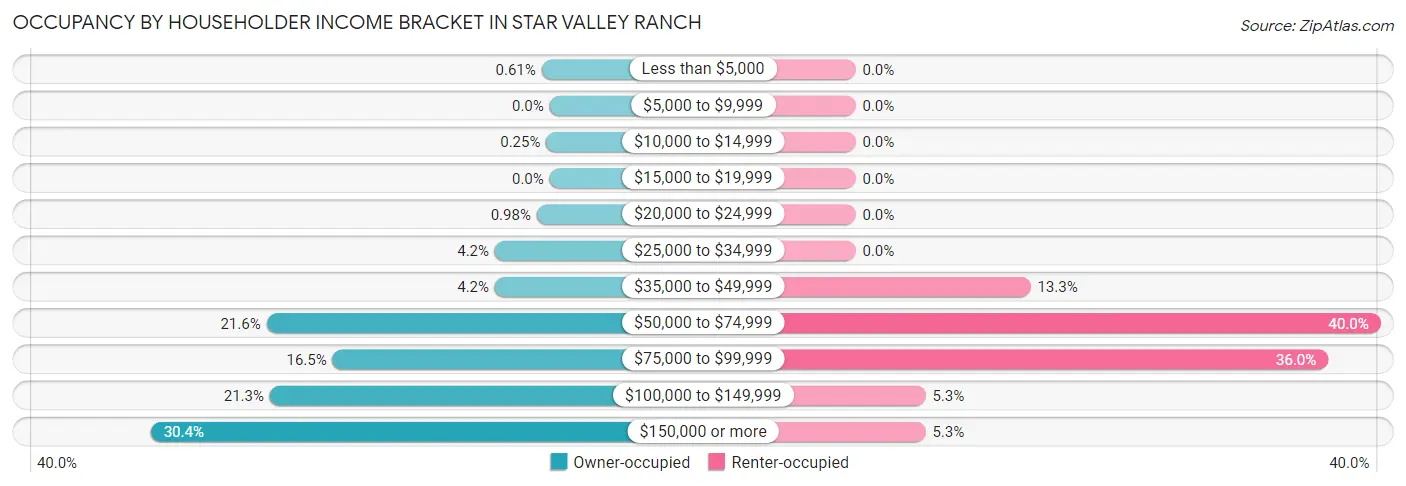
| Income Bracket | Owner-occupied | Renter-occupied |
| Less than $5,000 | 5 (0.6%) | 0 (0.0%) |
| $5,000 to $9,999 | 0 (0.0%) | 0 (0.0%) |
| $10,000 to $14,999 | 2 (0.3%) | 0 (0.0%) |
| $15,000 to $19,999 | 0 (0.0%) | 0 (0.0%) |
| $20,000 to $24,999 | 8 (1.0%) | 0 (0.0%) |
| $25,000 to $34,999 | 34 (4.2%) | 0 (0.0%) |
| $35,000 to $49,999 | 34 (4.2%) | 10 (13.3%) |
| $50,000 to $74,999 | 176 (21.6%) | 30 (40.0%) |
| $75,000 to $99,999 | 135 (16.5%) | 27 (36.0%) |
| $100,000 to $149,999 | 174 (21.3%) | 4 (5.3%) |
| $150,000 or more | 248 (30.4%) | 4 (5.3%) |
| Total | 816 (100.0%) | 75 (100.0%) |
Monthly Housing Cost Tiers in Star Valley Ranch
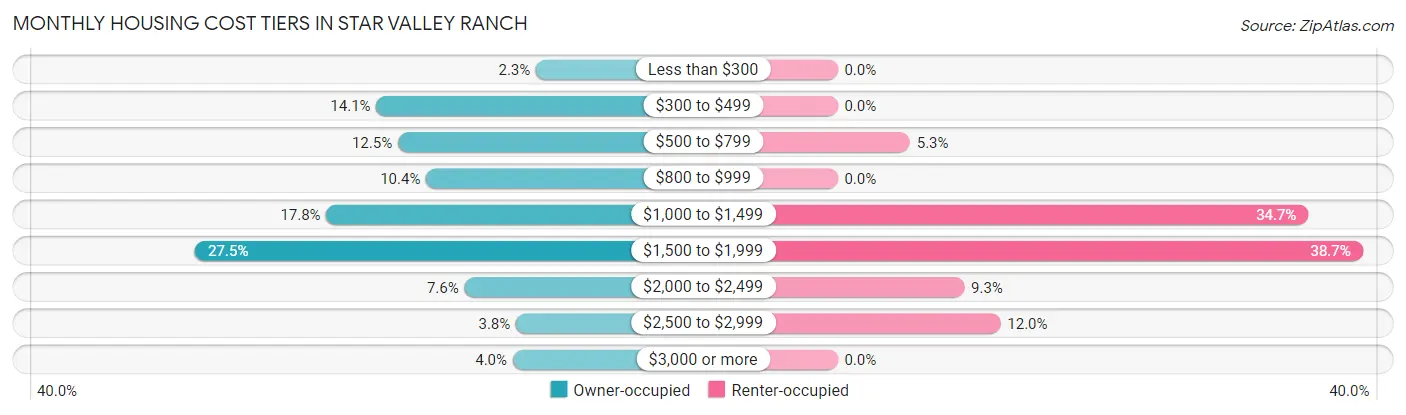
| Monthly Cost | Owner-occupied | Renter-occupied |
| Less than $300 | 19 (2.3%) | 0 (0.0%) |
| $300 to $499 | 115 (14.1%) | 0 (0.0%) |
| $500 to $799 | 102 (12.5%) | 4 (5.3%) |
| $800 to $999 | 85 (10.4%) | 0 (0.0%) |
| $1,000 to $1,499 | 145 (17.8%) | 26 (34.7%) |
| $1,500 to $1,999 | 224 (27.5%) | 29 (38.7%) |
| $2,000 to $2,499 | 62 (7.6%) | 7 (9.3%) |
| $2,500 to $2,999 | 31 (3.8%) | 9 (12.0%) |
| $3,000 or more | 33 (4.0%) | 0 (0.0%) |
| Total | 816 (100.0%) | 75 (100.0%) |
Physical Housing Characteristics in Star Valley Ranch
Housing Structures in Star Valley Ranch
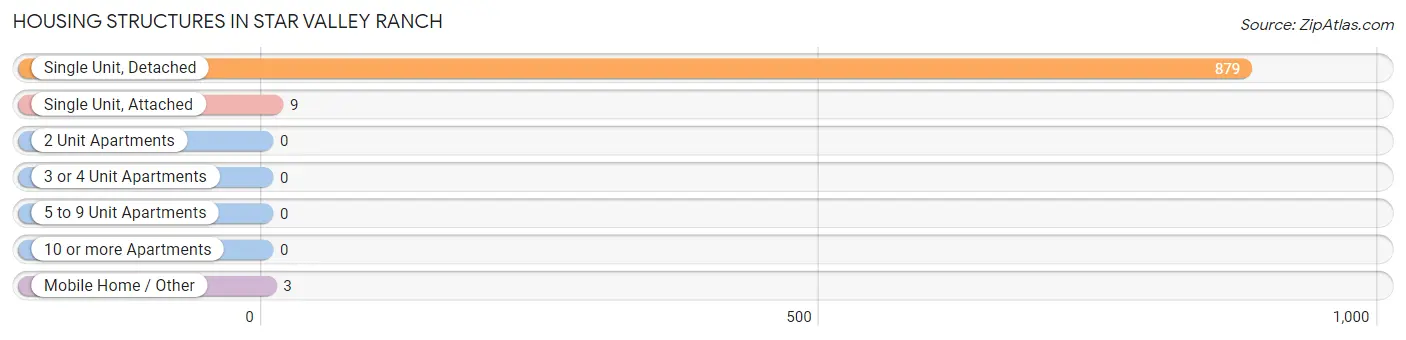
| Structure Type | # Housing Units | % Housing Units |
| Single Unit, Detached | 879 | 98.7% |
| Single Unit, Attached | 9 | 1.0% |
| 2 Unit Apartments | 0 | 0.0% |
| 3 or 4 Unit Apartments | 0 | 0.0% |
| 5 to 9 Unit Apartments | 0 | 0.0% |
| 10 or more Apartments | 0 | 0.0% |
| Mobile Home / Other | 3 | 0.3% |
| Total | 891 | 100.0% |
Housing Structures by Occupancy in Star Valley Ranch
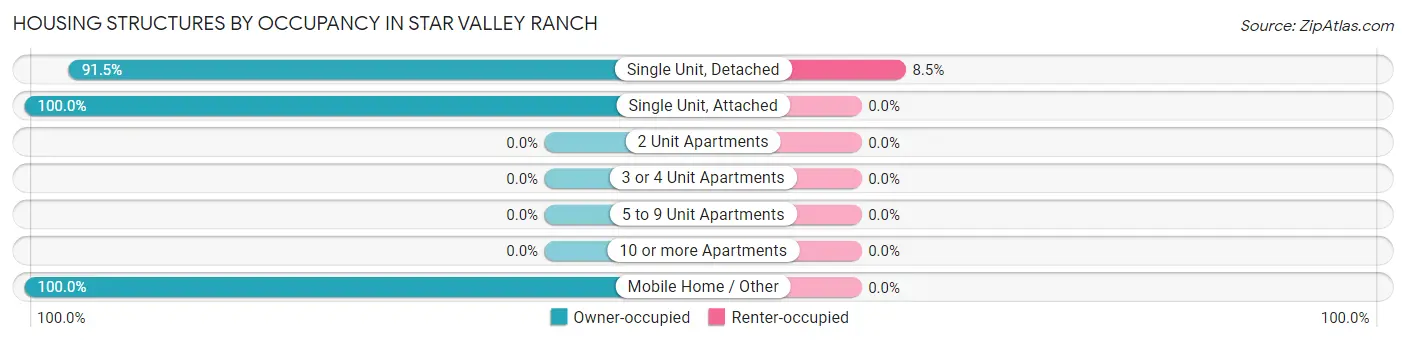
| Structure Type | Owner-occupied | Renter-occupied |
| Single Unit, Detached | 804 (91.5%) | 75 (8.5%) |
| Single Unit, Attached | 9 (100.0%) | 0 (0.0%) |
| 2 Unit Apartments | 0 (0.0%) | 0 (0.0%) |
| 3 or 4 Unit Apartments | 0 (0.0%) | 0 (0.0%) |
| 5 to 9 Unit Apartments | 0 (0.0%) | 0 (0.0%) |
| 10 or more Apartments | 0 (0.0%) | 0 (0.0%) |
| Mobile Home / Other | 3 (100.0%) | 0 (0.0%) |
| Total | 816 (91.6%) | 75 (8.4%) |
Housing Structures by Number of Rooms in Star Valley Ranch
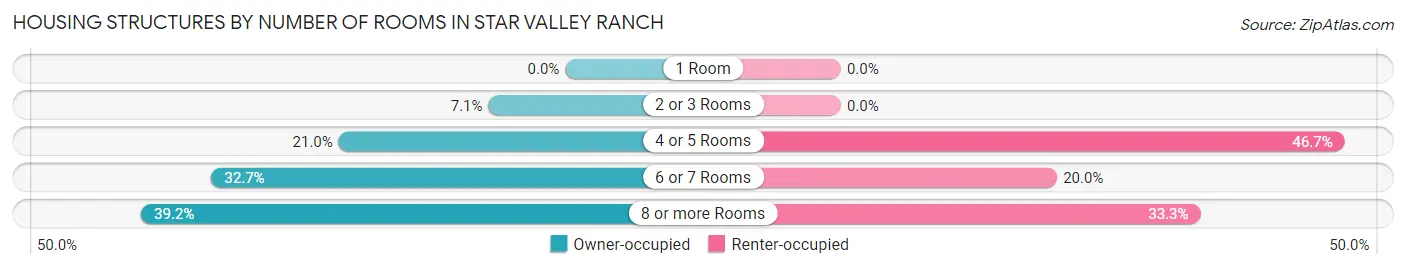
| Number of Rooms | Owner-occupied | Renter-occupied |
| 1 Room | 0 (0.0%) | 0 (0.0%) |
| 2 or 3 Rooms | 58 (7.1%) | 0 (0.0%) |
| 4 or 5 Rooms | 171 (21.0%) | 35 (46.7%) |
| 6 or 7 Rooms | 267 (32.7%) | 15 (20.0%) |
| 8 or more Rooms | 320 (39.2%) | 25 (33.3%) |
| Total | 816 (100.0%) | 75 (100.0%) |
Housing Structure by Heating Type in Star Valley Ranch
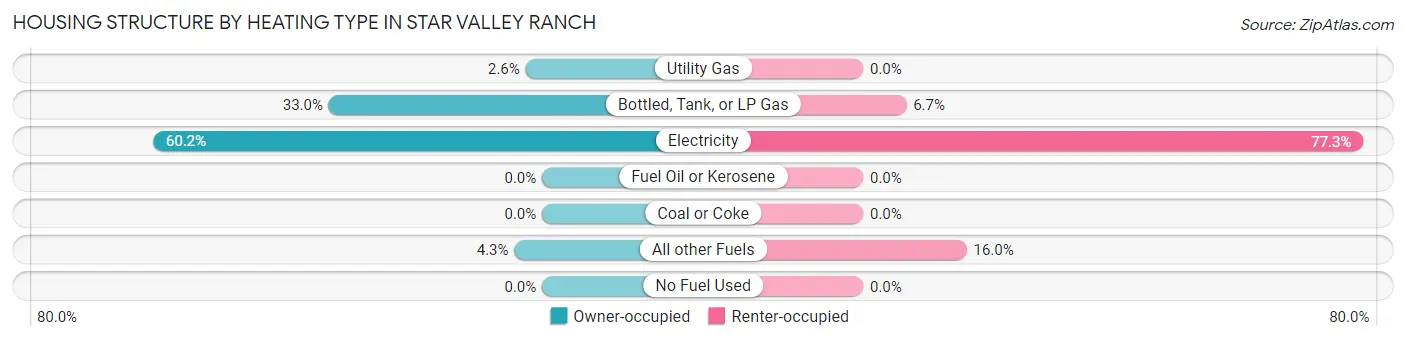
| Heating Type | Owner-occupied | Renter-occupied |
| Utility Gas | 21 (2.6%) | 0 (0.0%) |
| Bottled, Tank, or LP Gas | 269 (33.0%) | 5 (6.7%) |
| Electricity | 491 (60.2%) | 58 (77.3%) |
| Fuel Oil or Kerosene | 0 (0.0%) | 0 (0.0%) |
| Coal or Coke | 0 (0.0%) | 0 (0.0%) |
| All other Fuels | 35 (4.3%) | 12 (16.0%) |
| No Fuel Used | 0 (0.0%) | 0 (0.0%) |
| Total | 816 (100.0%) | 75 (100.0%) |
Household Vehicle Usage in Star Valley Ranch
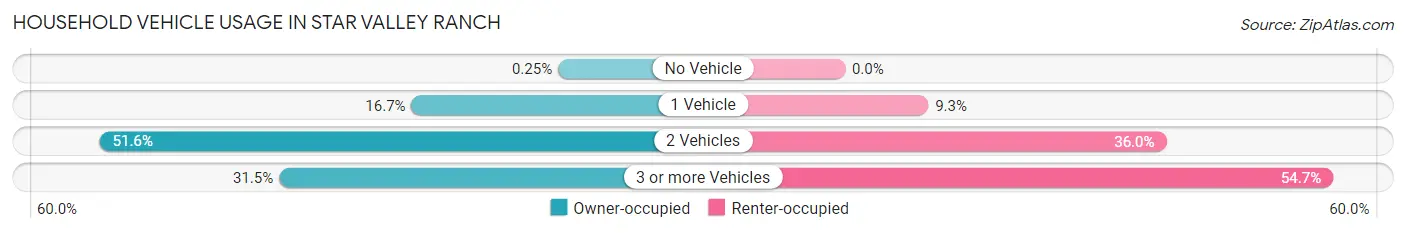
| Vehicles per Household | Owner-occupied | Renter-occupied |
| No Vehicle | 2 (0.3%) | 0 (0.0%) |
| 1 Vehicle | 136 (16.7%) | 7 (9.3%) |
| 2 Vehicles | 421 (51.6%) | 27 (36.0%) |
| 3 or more Vehicles | 257 (31.5%) | 41 (54.7%) |
| Total | 816 (100.0%) | 75 (100.0%) |
Real Estate & Mortgages in Star Valley Ranch
Real Estate and Mortgage Overview in Star Valley Ranch
| Characteristic | Without Mortgage | With Mortgage |
| Housing Units | 291 | 525 |
| Median Property Value | $447,300 | $400,500 |
| Median Household Income | $85,781 | $168 |
| Monthly Housing Costs | $530 | $33 |
| Real Estate Taxes | $2,159 | $11 |
Property Value by Mortgage Status in Star Valley Ranch
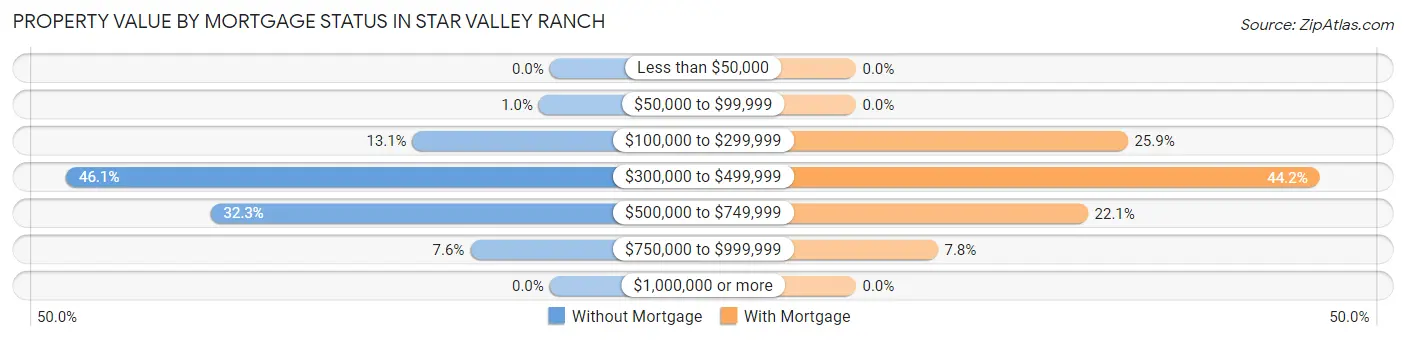
| Property Value | Without Mortgage | With Mortgage |
| Less than $50,000 | 0 (0.0%) | 0 (0.0%) |
| $50,000 to $99,999 | 3 (1.0%) | 0 (0.0%) |
| $100,000 to $299,999 | 38 (13.1%) | 136 (25.9%) |
| $300,000 to $499,999 | 134 (46.1%) | 232 (44.2%) |
| $500,000 to $749,999 | 94 (32.3%) | 116 (22.1%) |
| $750,000 to $999,999 | 22 (7.6%) | 41 (7.8%) |
| $1,000,000 or more | 0 (0.0%) | 0 (0.0%) |
| Total | 291 (100.0%) | 525 (100.0%) |
Household Income by Mortgage Status in Star Valley Ranch
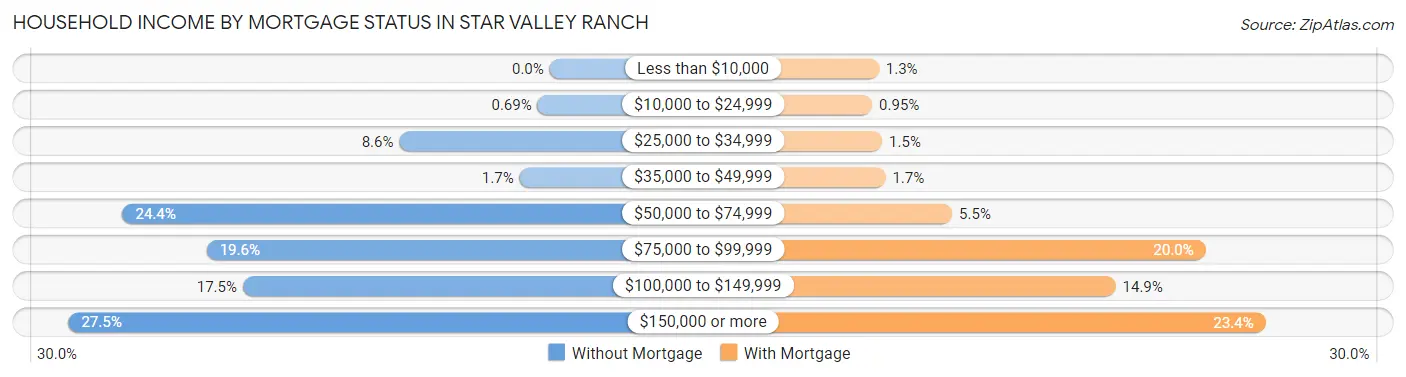
| Household Income | Without Mortgage | With Mortgage |
| Less than $10,000 | 0 (0.0%) | 7 (1.3%) |
| $10,000 to $24,999 | 2 (0.7%) | 5 (0.9%) |
| $25,000 to $34,999 | 25 (8.6%) | 8 (1.5%) |
| $35,000 to $49,999 | 5 (1.7%) | 9 (1.7%) |
| $50,000 to $74,999 | 71 (24.4%) | 29 (5.5%) |
| $75,000 to $99,999 | 57 (19.6%) | 105 (20.0%) |
| $100,000 to $149,999 | 51 (17.5%) | 78 (14.9%) |
| $150,000 or more | 80 (27.5%) | 123 (23.4%) |
| Total | 291 (100.0%) | 525 (100.0%) |
Property Value to Household Income Ratio in Star Valley Ranch
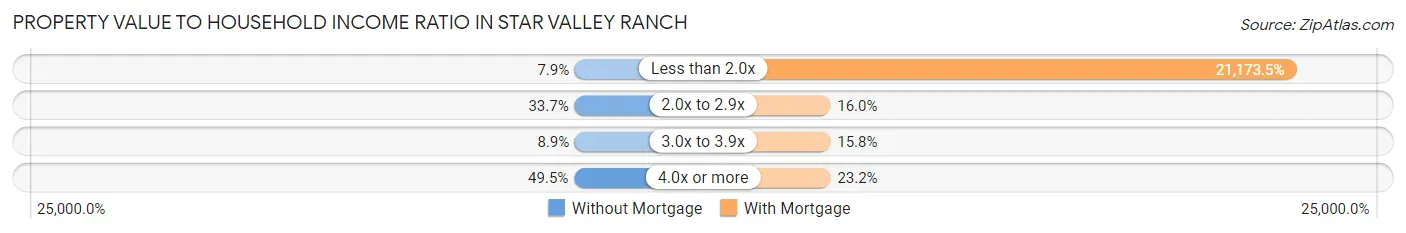
| Value-to-Income Ratio | Without Mortgage | With Mortgage |
| Less than 2.0x | 23 (7.9%) | 111,161 (21,173.5%) |
| 2.0x to 2.9x | 98 (33.7%) | 84 (16.0%) |
| 3.0x to 3.9x | 26 (8.9%) | 83 (15.8%) |
| 4.0x or more | 144 (49.5%) | 122 (23.2%) |
| Total | 291 (100.0%) | 525 (100.0%) |
Real Estate Taxes by Mortgage Status in Star Valley Ranch
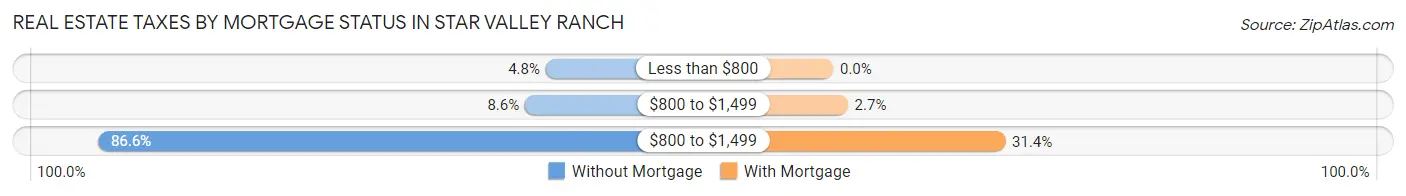
| Property Taxes | Without Mortgage | With Mortgage |
| Less than $800 | 14 (4.8%) | 0 (0.0%) |
| $800 to $1,499 | 25 (8.6%) | 14 (2.7%) |
| $800 to $1,499 | 252 (86.6%) | 165 (31.4%) |
| Total | 291 (100.0%) | 525 (100.0%) |
Health & Disability in Star Valley Ranch
Health Insurance Coverage by Age in Star Valley Ranch
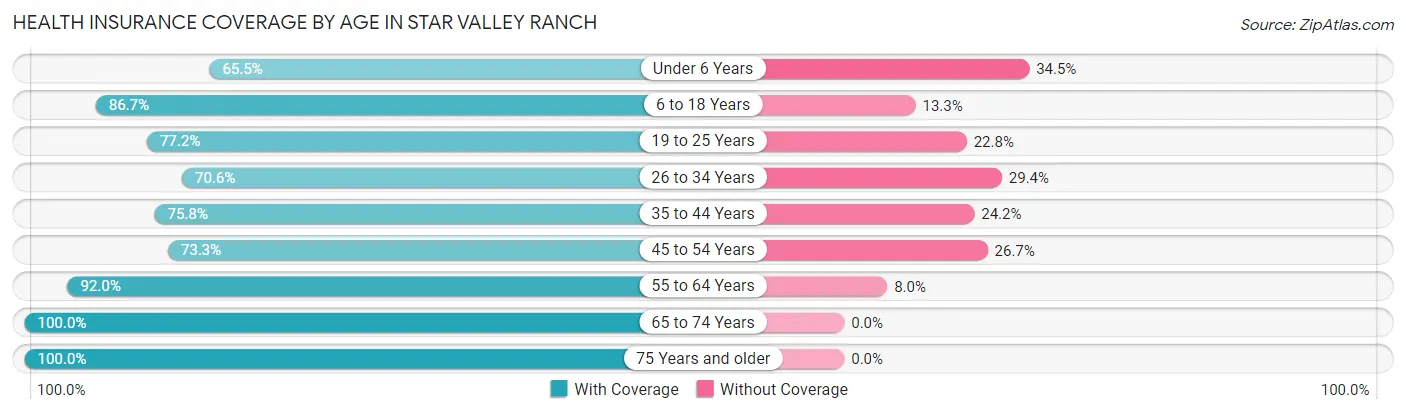
| Age Bracket | With Coverage | Without Coverage |
| Under 6 Years | 57 (65.5%) | 30 (34.5%) |
| 6 to 18 Years | 274 (86.7%) | 42 (13.3%) |
| 19 to 25 Years | 98 (77.2%) | 29 (22.8%) |
| 26 to 34 Years | 149 (70.6%) | 62 (29.4%) |
| 35 to 44 Years | 175 (75.8%) | 56 (24.2%) |
| 45 to 54 Years | 192 (73.3%) | 70 (26.7%) |
| 55 to 64 Years | 299 (92.0%) | 26 (8.0%) |
| 65 to 74 Years | 421 (100.0%) | 0 (0.0%) |
| 75 Years and older | 243 (100.0%) | 0 (0.0%) |
| Total | 1,908 (85.8%) | 315 (14.2%) |
Health Insurance Coverage by Citizenship Status in Star Valley Ranch
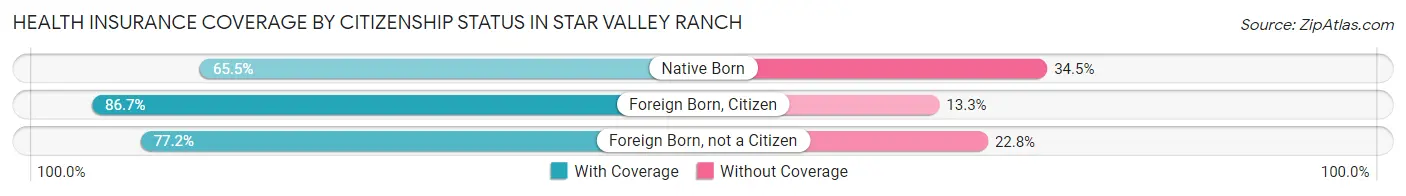
| Citizenship Status | With Coverage | Without Coverage |
| Native Born | 57 (65.5%) | 30 (34.5%) |
| Foreign Born, Citizen | 274 (86.7%) | 42 (13.3%) |
| Foreign Born, not a Citizen | 98 (77.2%) | 29 (22.8%) |
Health Insurance Coverage by Household Income in Star Valley Ranch
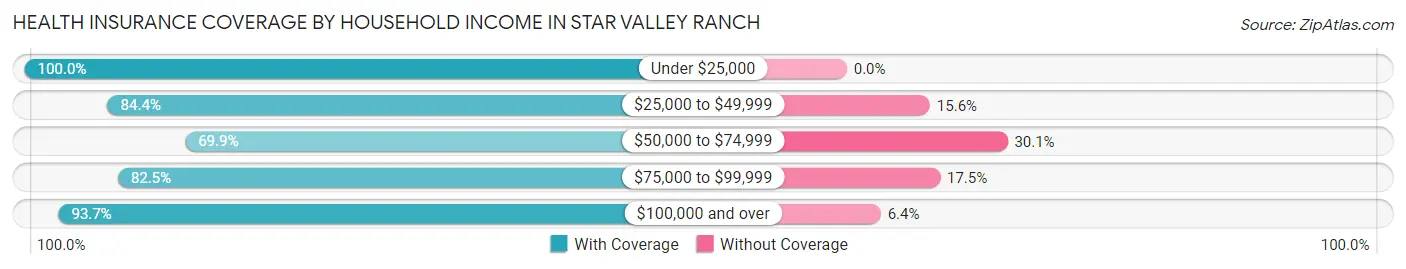
| Household Income | With Coverage | Without Coverage |
| Under $25,000 | 20 (100.0%) | 0 (0.0%) |
| $25,000 to $49,999 | 103 (84.4%) | 19 (15.6%) |
| $50,000 to $74,999 | 353 (69.9%) | 152 (30.1%) |
| $75,000 to $99,999 | 326 (82.5%) | 69 (17.5%) |
| $100,000 and over | 1,106 (93.6%) | 75 (6.4%) |
Public vs Private Health Insurance Coverage by Age in Star Valley Ranch
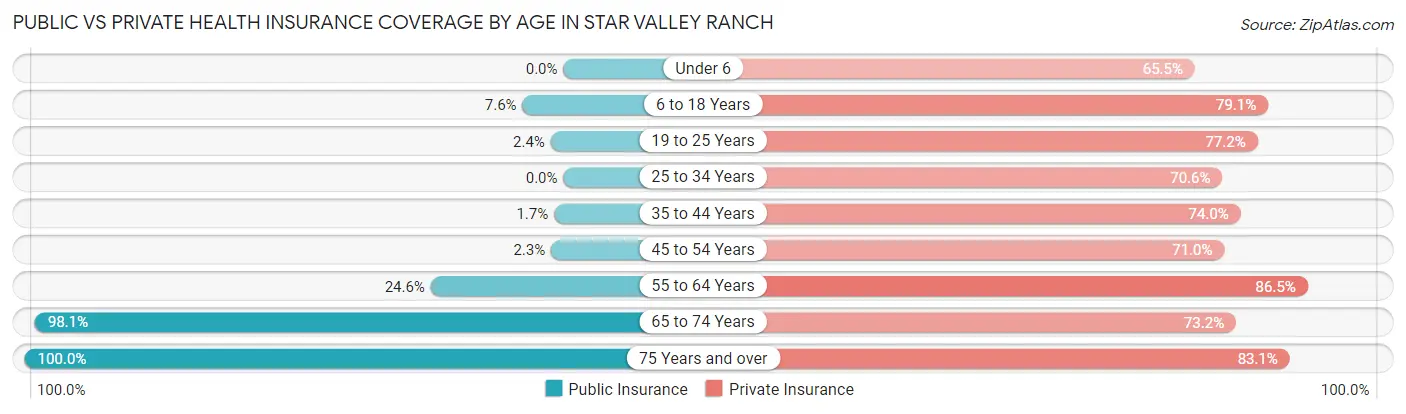
| Age Bracket | Public Insurance | Private Insurance |
| Under 6 | 0 (0.0%) | 57 (65.5%) |
| 6 to 18 Years | 24 (7.6%) | 250 (79.1%) |
| 19 to 25 Years | 3 (2.4%) | 98 (77.2%) |
| 25 to 34 Years | 0 (0.0%) | 149 (70.6%) |
| 35 to 44 Years | 4 (1.7%) | 171 (74.0%) |
| 45 to 54 Years | 6 (2.3%) | 186 (71.0%) |
| 55 to 64 Years | 80 (24.6%) | 281 (86.5%) |
| 65 to 74 Years | 413 (98.1%) | 308 (73.2%) |
| 75 Years and over | 243 (100.0%) | 202 (83.1%) |
| Total | 773 (34.8%) | 1,702 (76.6%) |
Disability Status by Sex by Age in Star Valley Ranch
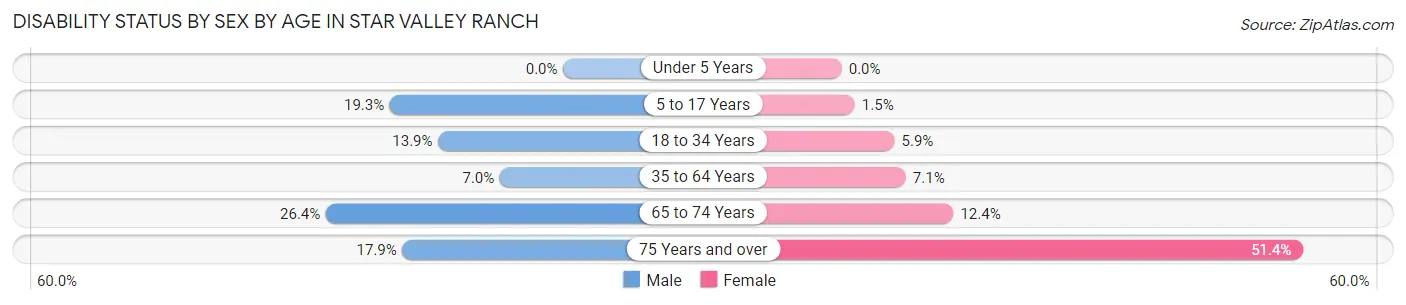
| Age Bracket | Male | Female |
| Under 5 Years | 0 (0.0%) | 0 (0.0%) |
| 5 to 17 Years | 33 (19.3%) | 2 (1.5%) |
| 18 to 34 Years | 33 (13.9%) | 7 (5.9%) |
| 35 to 64 Years | 28 (7.0%) | 30 (7.1%) |
| 65 to 74 Years | 56 (26.4%) | 26 (12.4%) |
| 75 Years and over | 24 (17.9%) | 56 (51.4%) |
Disability Class by Sex by Age in Star Valley Ranch
Disability Class: Hearing Difficulty
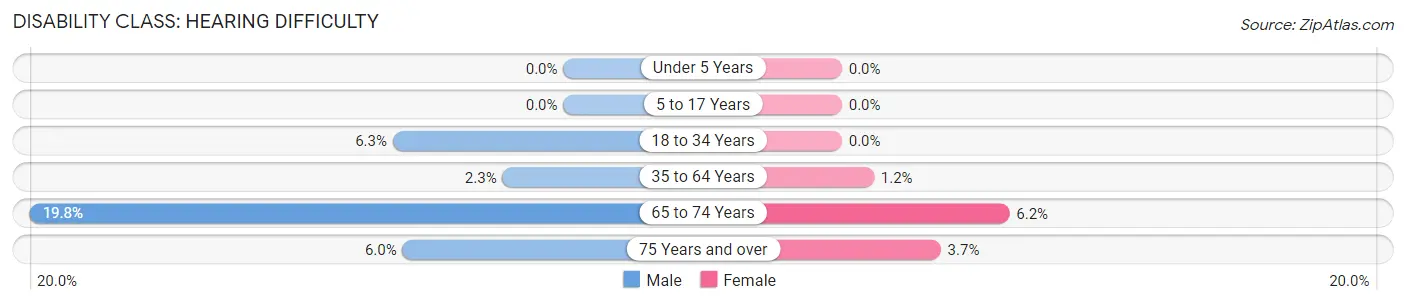
| Age Bracket | Male | Female |
| Under 5 Years | 0 (0.0%) | 0 (0.0%) |
| 5 to 17 Years | 0 (0.0%) | 0 (0.0%) |
| 18 to 34 Years | 15 (6.3%) | 0 (0.0%) |
| 35 to 64 Years | 9 (2.3%) | 5 (1.2%) |
| 65 to 74 Years | 42 (19.8%) | 13 (6.2%) |
| 75 Years and over | 8 (6.0%) | 4 (3.7%) |
Disability Class: Vision Difficulty
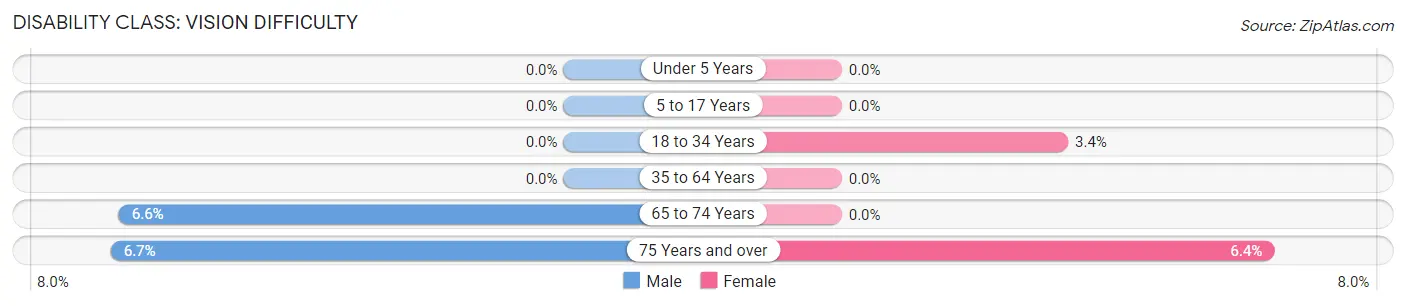
| Age Bracket | Male | Female |
| Under 5 Years | 0 (0.0%) | 0 (0.0%) |
| 5 to 17 Years | 0 (0.0%) | 0 (0.0%) |
| 18 to 34 Years | 0 (0.0%) | 4 (3.4%) |
| 35 to 64 Years | 0 (0.0%) | 0 (0.0%) |
| 65 to 74 Years | 14 (6.6%) | 0 (0.0%) |
| 75 Years and over | 9 (6.7%) | 7 (6.4%) |
Disability Class: Cognitive Difficulty
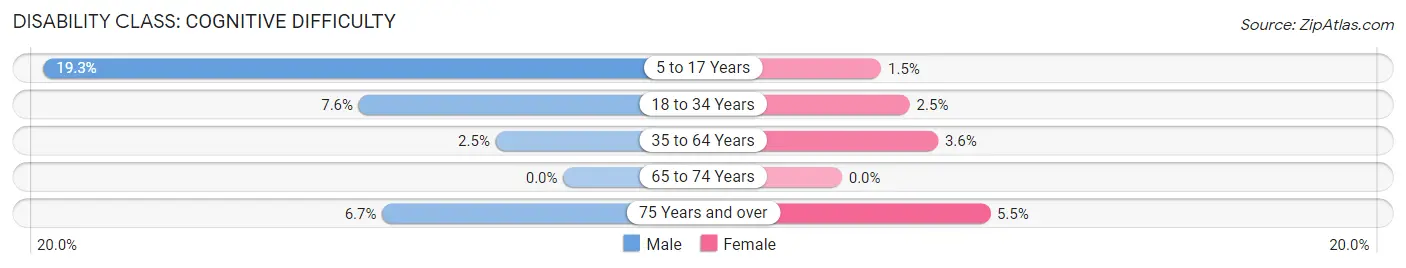
| Age Bracket | Male | Female |
| 5 to 17 Years | 33 (19.3%) | 2 (1.5%) |
| 18 to 34 Years | 18 (7.6%) | 3 (2.5%) |
| 35 to 64 Years | 10 (2.5%) | 15 (3.6%) |
| 65 to 74 Years | 0 (0.0%) | 0 (0.0%) |
| 75 Years and over | 9 (6.7%) | 6 (5.5%) |
Disability Class: Ambulatory Difficulty
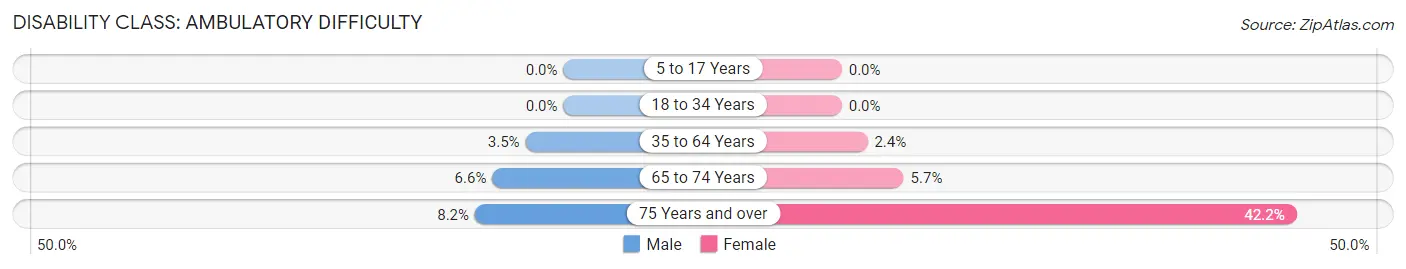
| Age Bracket | Male | Female |
| 5 to 17 Years | 0 (0.0%) | 0 (0.0%) |
| 18 to 34 Years | 0 (0.0%) | 0 (0.0%) |
| 35 to 64 Years | 14 (3.5%) | 10 (2.4%) |
| 65 to 74 Years | 14 (6.6%) | 12 (5.7%) |
| 75 Years and over | 11 (8.2%) | 46 (42.2%) |
Disability Class: Self-Care Difficulty
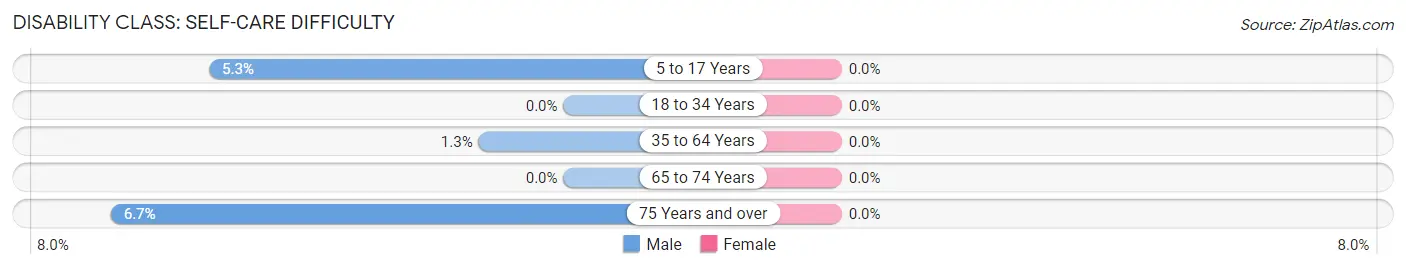
| Age Bracket | Male | Female |
| 5 to 17 Years | 9 (5.3%) | 0 (0.0%) |
| 18 to 34 Years | 0 (0.0%) | 0 (0.0%) |
| 35 to 64 Years | 5 (1.3%) | 0 (0.0%) |
| 65 to 74 Years | 0 (0.0%) | 0 (0.0%) |
| 75 Years and over | 9 (6.7%) | 0 (0.0%) |
Technology Access in Star Valley Ranch
Computing Device Access in Star Valley Ranch
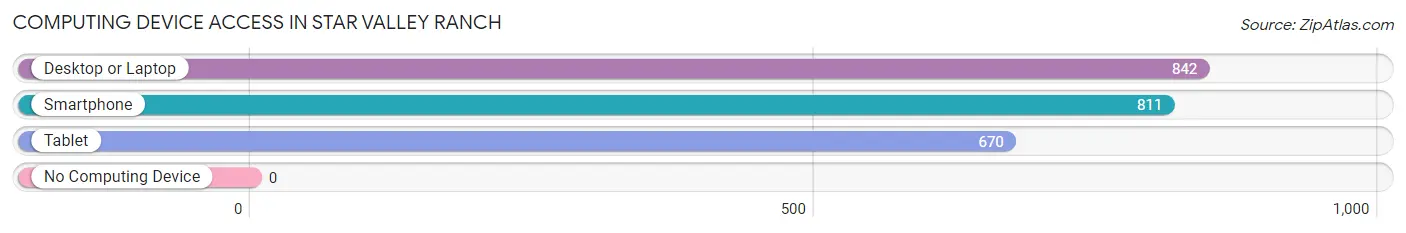
| Device Type | # Households | % Households |
| Desktop or Laptop | 842 | 94.5% |
| Smartphone | 811 | 91.0% |
| Tablet | 670 | 75.2% |
| No Computing Device | 0 | 0.0% |
| Total | 891 | 100.0% |
Internet Access in Star Valley Ranch
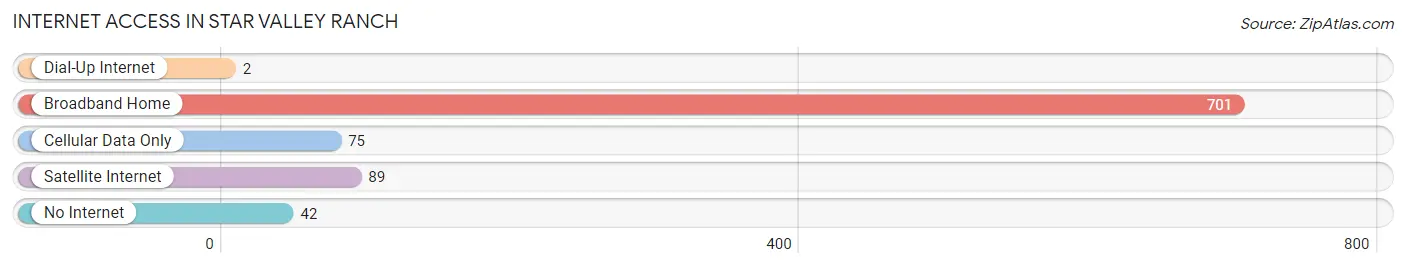
| Internet Type | # Households | % Households |
| Dial-Up Internet | 2 | 0.2% |
| Broadband Home | 701 | 78.7% |
| Cellular Data Only | 75 | 8.4% |
| Satellite Internet | 89 | 10.0% |
| No Internet | 42 | 4.7% |
| Total | 891 | 100.0% |
Star Valley Ranch Summary
Introduction
Star Valley Ranch is a small town located in the western part of Wyoming, United States. It is situated in the Star Valley, which is a narrow valley that runs along the Idaho-Wyoming border. The town is located in Lincoln County, Wyoming, and is part of the Jackson Hole area. The town was founded in the late 1800s and has a population of around 1,000 people.
History
Star Valley Ranch was founded in the late 1800s by a group of Mormon settlers. The settlers were looking for a place to settle and raise their families, and the valley provided them with the perfect opportunity. The settlers built a small community and named it Star Valley Ranch. The town was originally a farming community, but over time it has grown into a small town with a variety of businesses and services.
The town has a rich history and has been home to many famous people, including the famous outlaw Butch Cassidy. The town was also the site of the first rodeo in Wyoming, which was held in 1891.
Geography
Star Valley Ranch is located in the western part of Wyoming, in the Star Valley. The valley is a narrow valley that runs along the Idaho-Wyoming border. The town is located in Lincoln County, Wyoming, and is part of the Jackson Hole area. The town is situated at an elevation of 6,000 feet and is surrounded by the Salt River Mountains to the east and the Wyoming Range to the west.
The town is located in a semi-arid climate, with hot summers and cold winters. The average annual temperature is around 45 degrees Fahrenheit, with an average high of around 70 degrees in the summer and an average low of around 20 degrees in the winter.
Economy
Star Valley Ranch is a small town with a population of around 1,000 people. The town is primarily a tourist destination, with many people visiting the area for its natural beauty and outdoor activities. The town is also home to a variety of businesses, including restaurants, hotels, and retail stores.
The town is also home to a number of small businesses, including a local newspaper, a hardware store, and a gas station. The town is also home to a number of small manufacturing businesses, including a furniture factory and a woodworking shop.
Demographics
As of the 2010 census, the population of Star Valley Ranch was 1,000 people. The town is predominantly white, with around 95% of the population being white. The remaining 5% of the population is made up of other races, including Native American, Asian, and Hispanic.
The median household income in Star Valley Ranch is around $50,000, which is slightly lower than the national average. The town has a high rate of homeownership, with around 75% of the population owning their own homes.
Conclusion
Star Valley Ranch is a small town located in the western part of Wyoming, United States. The town was founded in the late 1800s by a group of Mormon settlers and has a population of around 1,000 people. The town is primarily a tourist destination, with many people visiting the area for its natural beauty and outdoor activities. The town is predominantly white, with around 95% of the population being white. The median household income in Star Valley Ranch is around $50,000, which is slightly lower than the national average. The town has a high rate of homeownership, with around 75% of the population owning their own homes.
Common Questions
What is Per Capita Income in Star Valley Ranch?
Per Capita income in Star Valley Ranch is $51,578.
What is the Median Family Income in Star Valley Ranch?
Median Family Income in Star Valley Ranch is $109,135.
What is the Median Household income in Star Valley Ranch?
Median Household Income in Star Valley Ranch is $92,250.
What is Income or Wage Gap in Star Valley Ranch?
Income or Wage Gap in Star Valley Ranch is 29.1%.
Women in Star Valley Ranch earn 70.9 cents for every dollar earned by a man.
What is Inequality or Gini Index in Star Valley Ranch?
Inequality or Gini Index in Star Valley Ranch is 0.36.
What is the Total Population of Star Valley Ranch?
Total Population of Star Valley Ranch is 2,231.
What is the Total Male Population of Star Valley Ranch?
Total Male Population of Star Valley Ranch is 1,223.
What is the Total Female Population of Star Valley Ranch?
Total Female Population of Star Valley Ranch is 1,008.
What is the Ratio of Males per 100 Females in Star Valley Ranch?
There are 121.33 Males per 100 Females in Star Valley Ranch.
What is the Ratio of Females per 100 Males in Star Valley Ranch?
There are 82.42 Females per 100 Males in Star Valley Ranch.
What is the Median Population Age in Star Valley Ranch?
Median Population Age in Star Valley Ranch is 51.8 Years.
What is the Average Family Size in Star Valley Ranch
Average Family Size in Star Valley Ranch is 2.7 People.
What is the Average Household Size in Star Valley Ranch
Average Household Size in Star Valley Ranch is 2.5 People.
How Large is the Labor Force in Star Valley Ranch?
There are 1,027 People in the Labor Forcein in Star Valley Ranch.
What is the Percentage of People in the Labor Force in Star Valley Ranch?
54.5% of People are in the Labor Force in Star Valley Ranch.
What is the Unemployment Rate in Star Valley Ranch?
Unemployment Rate in Star Valley Ranch is 1.2%.