Cities with the Most Immigrants from China in Mississippi
RELATED REPORTS & OPTIONS
China
Mississippi
Compare Cities
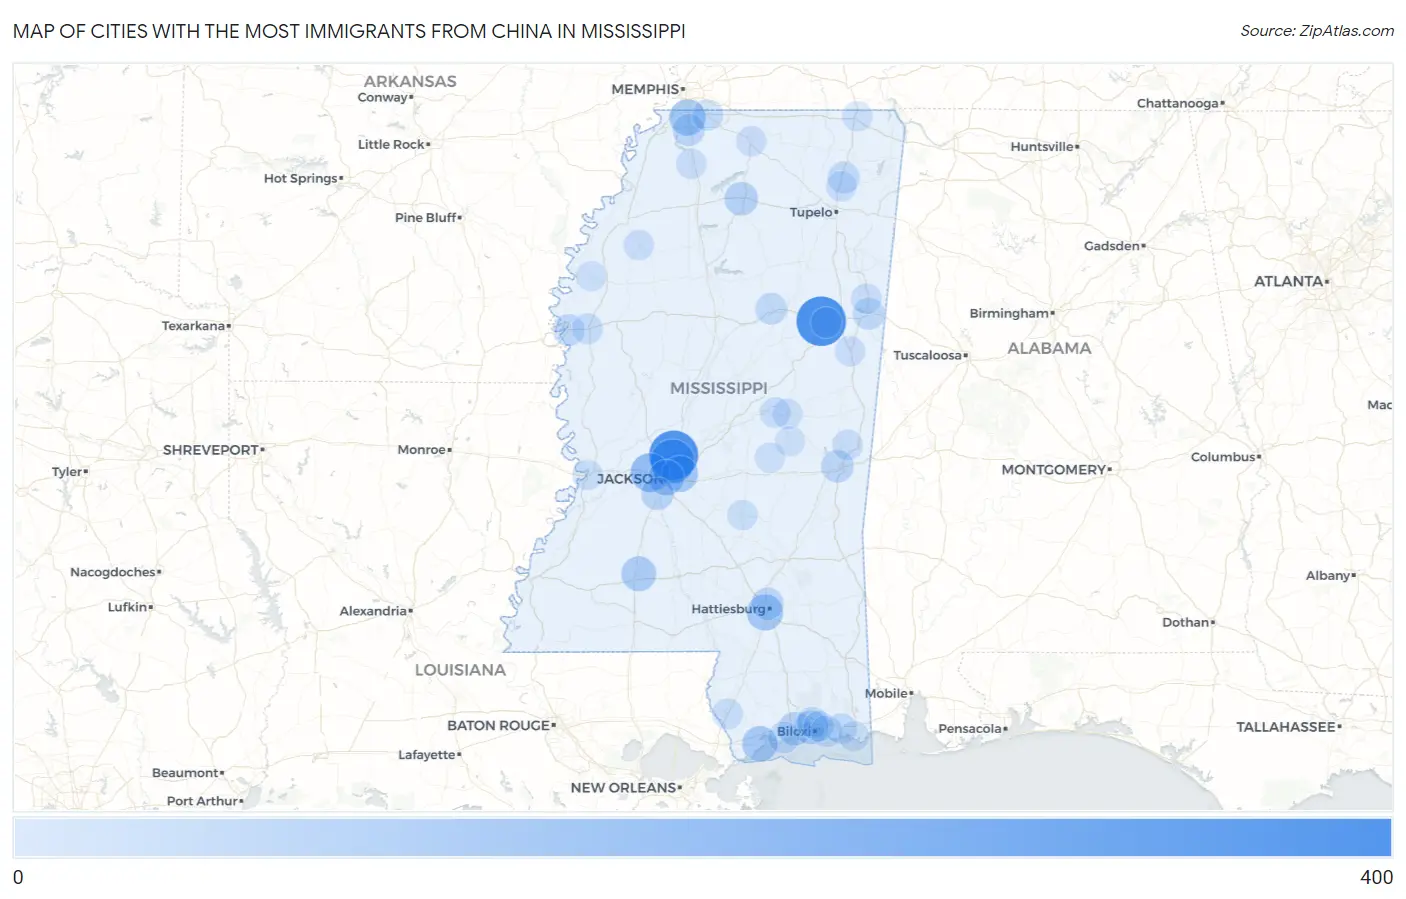
Map of Cities with the Most Immigrants from China in Mississippi
0
400
Cities with the Most Immigrants from China in Mississippi
| City | China | vs State | vs National | |
| 1. | Starkville | 378 | 3,418(11.06%)#1 | 2,829,008(0.01%)#776 |
| 2. | Madison | 364 | 3,418(10.65%)#2 | 2,829,008(0.01%)#797 |
| 3. | Ridgeland | 264 | 3,418(7.72%)#3 | 2,829,008(0.01%)#1,029 |
| 4. | Clinton | 164 | 3,418(4.80%)#4 | 2,829,008(0.01%)#1,463 |
| 5. | Southaven | 117 | 3,418(3.42%)#5 | 2,829,008(0.00%)#1,829 |
| 6. | Flowood | 115 | 3,418(3.36%)#6 | 2,829,008(0.00%)#1,843 |
| 7. | Hattiesburg | 114 | 3,418(3.34%)#7 | 2,829,008(0.00%)#1,845 |
| 8. | Jackson | 105 | 3,418(3.07%)#8 | 2,829,008(0.00%)#1,951 |
| 9. | Bay St Louis | 100 | 3,418(2.93%)#9 | 2,829,008(0.00%)#2,019 |
| 10. | Brookhaven | 89 | 3,418(2.60%)#10 | 2,829,008(0.00%)#2,164 |
| 11. | Gluckstadt | 76 | 3,418(2.22%)#11 | 2,829,008(0.00%)#2,373 |
| 12. | Biloxi | 70 | 3,418(2.05%)#12 | 2,829,008(0.00%)#2,468 |
| 13. | Gulfport | 65 | 3,418(1.90%)#13 | 2,829,008(0.00%)#2,567 |
| 14. | Oxford | 63 | 3,418(1.84%)#14 | 2,829,008(0.00%)#2,616 |
| 15. | Byram | 48 | 3,418(1.40%)#15 | 2,829,008(0.00%)#3,011 |
| 16. | Meridian | 43 | 3,418(1.26%)#16 | 2,829,008(0.00%)#3,159 |
| 17. | Glendale | 43 | 3,418(1.26%)#17 | 2,829,008(0.00%)#3,184 |
| 18. | Hernando | 35 | 3,418(1.02%)#18 | 2,829,008(0.00%)#3,475 |
| 19. | Columbus | 34 | 3,418(0.99%)#19 | 2,829,008(0.00%)#3,516 |
| 20. | Baldwyn | 33 | 3,418(0.97%)#20 | 2,829,008(0.00%)#3,594 |
| 21. | Greenville | 29 | 3,418(0.85%)#21 | 2,829,008(0.00%)#3,751 |
| 22. | Eupora | 29 | 3,418(0.85%)#22 | 2,829,008(0.00%)#3,790 |
| 23. | Long Beach | 27 | 3,418(0.79%)#23 | 2,829,008(0.00%)#3,873 |
| 24. | D Iberville | 25 | 3,418(0.73%)#24 | 2,829,008(0.00%)#3,986 |
| 25. | Ocean Springs | 23 | 3,418(0.67%)#25 | 2,829,008(0.00%)#4,101 |
| 26. | Olive Branch | 19 | 3,418(0.56%)#26 | 2,829,008(0.00%)#4,339 |
| 27. | Gautier | 16 | 3,418(0.47%)#27 | 2,829,008(0.00%)#4,596 |
| 28. | Leland | 13 | 3,418(0.38%)#28 | 2,829,008(0.00%)#4,915 |
| 29. | Picayune | 12 | 3,418(0.35%)#29 | 2,829,008(0.00%)#4,989 |
| 30. | St Martin | 11 | 3,418(0.32%)#30 | 2,829,008(0.00%)#5,096 |
| 31. | Pearl River | 10 | 3,418(0.29%)#31 | 2,829,008(0.00%)#5,225 |
| 32. | Mississippi State | 10 | 3,418(0.29%)#32 | 2,829,008(0.00%)#5,230 |
| 33. | Meridian Station | 10 | 3,418(0.29%)#33 | 2,829,008(0.00%)#5,285 |
| 34. | Senatobia | 8 | 3,418(0.23%)#34 | 2,829,008(0.00%)#5,440 |
| 35. | Guntown | 8 | 3,418(0.23%)#35 | 2,829,008(0.00%)#5,487 |
| 36. | Holly Springs | 7 | 3,418(0.20%)#36 | 2,829,008(0.00%)#5,573 |
| 37. | Tutwiler | 6 | 3,418(0.18%)#37 | 2,829,008(0.00%)#5,738 |
| 38. | Columbus Afb | 6 | 3,418(0.18%)#38 | 2,829,008(0.00%)#5,776 |
| 39. | Pascagoula | 4 | 3,418(0.12%)#39 | 2,829,008(0.00%)#5,983 |
| 40. | Vicksburg | 4 | 3,418(0.12%)#40 | 2,829,008(0.00%)#5,984 |
| 41. | Raleigh | 4 | 3,418(0.12%)#41 | 2,829,008(0.00%)#6,067 |
| 42. | Brooksville | 4 | 3,418(0.12%)#42 | 2,829,008(0.00%)#6,076 |
| 43. | Philadelphia | 3 | 3,418(0.09%)#43 | 2,829,008(0.00%)#6,132 |
| 44. | Conehatta | 3 | 3,418(0.09%)#44 | 2,829,008(0.00%)#6,196 |
| 45. | Pace | 3 | 3,418(0.09%)#45 | 2,829,008(0.00%)#6,261 |
| 46. | Corinth | 2 | 3,418(0.06%)#46 | 2,829,008(0.00%)#6,274 |
| 47. | Union | 1 | 3,418(0.03%)#47 | 2,829,008(0.00%)#6,482 |
Common Questions
What are the Top 10 Cities with the Most Immigrants from China in Mississippi?
Top 10 Cities with the Most Immigrants from China in Mississippi are:
#1
378
#2
364
#3
264
#4
164
#5
117
#6
115
#7
114
#8
105
#9
100
#10
89
What city has the Most Immigrants from China in Mississippi?
Starkville has the Most Immigrants from China in Mississippi with 378.
What is the Total Immigrants from China in the State of Mississippi?
Total Immigrants from China in Mississippi is 3,418.
What is the Total Immigrants from China in the United States?
Total Immigrants from China in the United States is 2,829,008.