Cities with the Most Immigrants from China in Texas
RELATED REPORTS & OPTIONS
China
Texas
Compare Cities
Map of Cities with the Most Immigrants from China in Texas
0
25,000
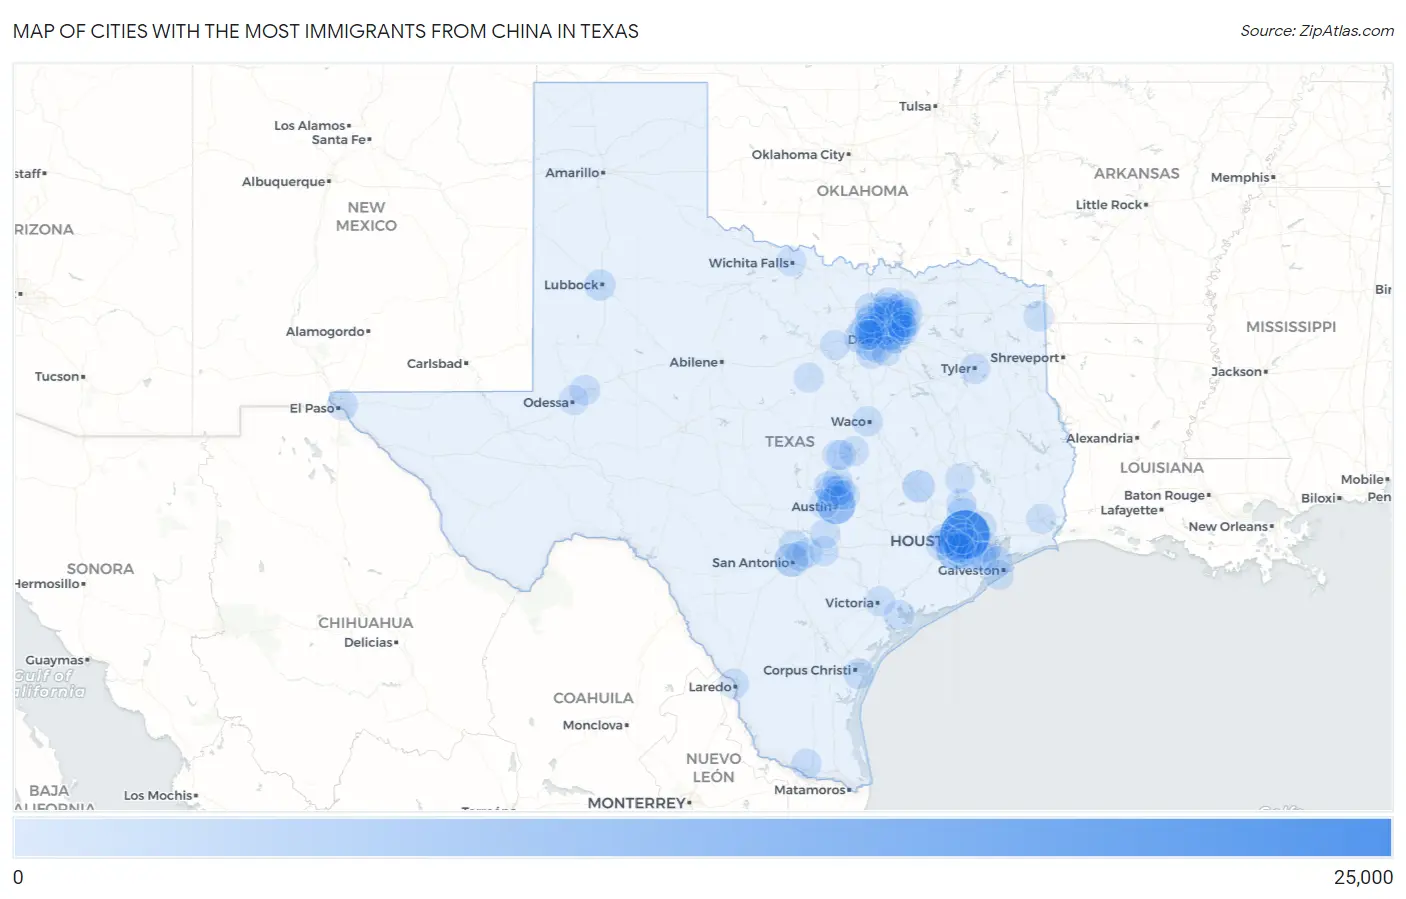
Cities with the Most Immigrants from China in Texas
| City | China | vs State | vs National | |
| 1. | Houston | 24,938 | 153,031(16.30%)#1 | 2,829,008(0.88%)#11 |
| 2. | Austin | 10,135 | 153,031(6.62%)#2 | 2,829,008(0.36%)#30 |
| 3. | Plano | 9,129 | 153,031(5.97%)#3 | 2,829,008(0.32%)#37 |
| 4. | Sugar Land | 8,516 | 153,031(5.56%)#4 | 2,829,008(0.30%)#40 |
| 5. | Dallas | 5,307 | 153,031(3.47%)#5 | 2,829,008(0.19%)#62 |
| 6. | San Antonio | 4,191 | 153,031(2.74%)#6 | 2,829,008(0.15%)#86 |
| 7. | Allen | 3,848 | 153,031(2.51%)#7 | 2,829,008(0.14%)#97 |
| 8. | Richardson | 3,329 | 153,031(2.18%)#8 | 2,829,008(0.12%)#104 |
| 9. | Frisco | 3,295 | 153,031(2.15%)#9 | 2,829,008(0.12%)#107 |
| 10. | College Station | 2,894 | 153,031(1.89%)#10 | 2,829,008(0.10%)#123 |
| 11. | Mckinney | 2,246 | 153,031(1.47%)#11 | 2,829,008(0.08%)#153 |
| 12. | Fort Worth | 2,111 | 153,031(1.38%)#12 | 2,829,008(0.07%)#160 |
| 13. | Irving | 1,943 | 153,031(1.27%)#13 | 2,829,008(0.07%)#174 |
| 14. | The Woodlands | 1,768 | 153,031(1.16%)#14 | 2,829,008(0.06%)#198 |
| 15. | Garland | 1,539 | 153,031(1.01%)#15 | 2,829,008(0.05%)#226 |
| 16. | Lubbock | 1,476 | 153,031(0.96%)#16 | 2,829,008(0.05%)#233 |
| 17. | Pearland | 1,407 | 153,031(0.92%)#17 | 2,829,008(0.05%)#250 |
| 18. | Arlington | 1,337 | 153,031(0.87%)#18 | 2,829,008(0.05%)#264 |
| 19. | Missouri City | 1,337 | 153,031(0.87%)#19 | 2,829,008(0.05%)#265 |
| 20. | Bellaire | 1,092 | 153,031(0.71%)#20 | 2,829,008(0.04%)#317 |
| 21. | Lewisville | 1,059 | 153,031(0.69%)#21 | 2,829,008(0.04%)#330 |
| 22. | Carrollton | 1,034 | 153,031(0.68%)#22 | 2,829,008(0.04%)#338 |
| 23. | Cedar Park | 1,016 | 153,031(0.66%)#23 | 2,829,008(0.04%)#343 |
| 24. | Denton | 993 | 153,031(0.65%)#24 | 2,829,008(0.04%)#347 |
| 25. | El Paso | 981 | 153,031(0.64%)#25 | 2,829,008(0.03%)#352 |
| 26. | Coppell | 944 | 153,031(0.62%)#26 | 2,829,008(0.03%)#364 |
| 27. | Flower Mound | 883 | 153,031(0.58%)#27 | 2,829,008(0.03%)#391 |
| 28. | Corpus Christi | 818 | 153,031(0.53%)#28 | 2,829,008(0.03%)#414 |
| 29. | Cinco Ranch | 657 | 153,031(0.43%)#29 | 2,829,008(0.02%)#508 |
| 30. | Grand Prairie | 629 | 153,031(0.41%)#30 | 2,829,008(0.02%)#526 |
| 31. | League City | 567 | 153,031(0.37%)#31 | 2,829,008(0.02%)#568 |
| 32. | Celina | 566 | 153,031(0.37%)#32 | 2,829,008(0.02%)#571 |
| 33. | Midland | 555 | 153,031(0.36%)#33 | 2,829,008(0.02%)#575 |
| 34. | Southlake | 524 | 153,031(0.34%)#34 | 2,829,008(0.02%)#613 |
| 35. | Pasadena | 478 | 153,031(0.31%)#35 | 2,829,008(0.02%)#654 |
| 36. | Mission Bend | 475 | 153,031(0.31%)#36 | 2,829,008(0.02%)#658 |
| 37. | Waco | 443 | 153,031(0.29%)#37 | 2,829,008(0.02%)#684 |
| 38. | Brushy Creek | 440 | 153,031(0.29%)#38 | 2,829,008(0.02%)#690 |
| 39. | West University Place | 439 | 153,031(0.29%)#39 | 2,829,008(0.02%)#691 |
| 40. | Stafford | 433 | 153,031(0.28%)#40 | 2,829,008(0.02%)#698 |
| 41. | Murphy | 395 | 153,031(0.26%)#41 | 2,829,008(0.01%)#744 |
| 42. | Round Rock | 394 | 153,031(0.26%)#42 | 2,829,008(0.01%)#747 |
| 43. | University Park | 391 | 153,031(0.26%)#43 | 2,829,008(0.01%)#754 |
| 44. | Leander | 374 | 153,031(0.24%)#44 | 2,829,008(0.01%)#785 |
| 45. | Grapevine | 321 | 153,031(0.21%)#45 | 2,829,008(0.01%)#875 |
| 46. | Port Lavaca | 321 | 153,031(0.21%)#46 | 2,829,008(0.01%)#878 |
| 47. | Timberwood Park | 274 | 153,031(0.18%)#47 | 2,829,008(0.01%)#981 |
| 48. | Fulshear | 267 | 153,031(0.17%)#48 | 2,829,008(0.01%)#1,018 |
| 49. | Steiner Ranch | 250 | 153,031(0.16%)#49 | 2,829,008(0.01%)#1,064 |
| 50. | Tyler | 248 | 153,031(0.16%)#50 | 2,829,008(0.01%)#1,070 |
| 51. | Mcallen | 243 | 153,031(0.16%)#51 | 2,829,008(0.01%)#1,083 |
| 52. | Friendswood | 239 | 153,031(0.16%)#52 | 2,829,008(0.01%)#1,106 |
| 53. | Atascocita | 235 | 153,031(0.15%)#53 | 2,829,008(0.01%)#1,123 |
| 54. | Laredo | 234 | 153,031(0.15%)#54 | 2,829,008(0.01%)#1,125 |
| 55. | Farmers Branch | 231 | 153,031(0.15%)#55 | 2,829,008(0.01%)#1,143 |
| 56. | The Colony | 229 | 153,031(0.15%)#56 | 2,829,008(0.01%)#1,149 |
| 57. | Keller | 228 | 153,031(0.15%)#57 | 2,829,008(0.01%)#1,152 |
| 58. | Meadows Place | 226 | 153,031(0.15%)#58 | 2,829,008(0.01%)#1,168 |
| 59. | Atlanta | 224 | 153,031(0.15%)#59 | 2,829,008(0.01%)#1,181 |
| 60. | Wells Branch | 222 | 153,031(0.15%)#60 | 2,829,008(0.01%)#1,186 |
| 61. | Little Elm | 205 | 153,031(0.13%)#61 | 2,829,008(0.01%)#1,257 |
| 62. | Victoria | 203 | 153,031(0.13%)#62 | 2,829,008(0.01%)#1,264 |
| 63. | Beaumont | 193 | 153,031(0.13%)#63 | 2,829,008(0.01%)#1,312 |
| 64. | Katy | 192 | 153,031(0.13%)#64 | 2,829,008(0.01%)#1,319 |
| 65. | Fairview | 189 | 153,031(0.12%)#65 | 2,829,008(0.01%)#1,331 |
| 66. | Euless | 188 | 153,031(0.12%)#66 | 2,829,008(0.01%)#1,334 |
| 67. | Bedford | 188 | 153,031(0.12%)#67 | 2,829,008(0.01%)#1,336 |
| 68. | Melissa | 182 | 153,031(0.12%)#68 | 2,829,008(0.01%)#1,370 |
| 69. | Bee Cave | 181 | 153,031(0.12%)#69 | 2,829,008(0.01%)#1,375 |
| 70. | Wichita Falls | 177 | 153,031(0.12%)#70 | 2,829,008(0.01%)#1,386 |
| 71. | Killeen | 176 | 153,031(0.12%)#71 | 2,829,008(0.01%)#1,395 |
| 72. | Pflugerville | 176 | 153,031(0.12%)#72 | 2,829,008(0.01%)#1,397 |
| 73. | Odessa | 166 | 153,031(0.11%)#73 | 2,829,008(0.01%)#1,452 |
| 74. | Schertz | 166 | 153,031(0.11%)#74 | 2,829,008(0.01%)#1,453 |
| 75. | Prosper | 164 | 153,031(0.11%)#75 | 2,829,008(0.01%)#1,462 |
| 76. | Georgetown | 163 | 153,031(0.11%)#76 | 2,829,008(0.01%)#1,468 |
| 77. | Highland Park | 163 | 153,031(0.11%)#77 | 2,829,008(0.01%)#1,478 |
| 78. | Colleyville | 162 | 153,031(0.11%)#78 | 2,829,008(0.01%)#1,484 |
| 79. | Texas City | 160 | 153,031(0.10%)#79 | 2,829,008(0.01%)#1,497 |
| 80. | Jersey Village | 158 | 153,031(0.10%)#80 | 2,829,008(0.01%)#1,511 |
| 81. | Conroe | 156 | 153,031(0.10%)#81 | 2,829,008(0.01%)#1,522 |
| 82. | Temple | 154 | 153,031(0.10%)#82 | 2,829,008(0.01%)#1,541 |
| 83. | Stephenville | 154 | 153,031(0.10%)#83 | 2,829,008(0.01%)#1,543 |
| 84. | Rowlett | 152 | 153,031(0.10%)#84 | 2,829,008(0.01%)#1,557 |
| 85. | Windcrest | 151 | 153,031(0.10%)#85 | 2,829,008(0.01%)#1,563 |
| 86. | Sachse | 147 | 153,031(0.10%)#86 | 2,829,008(0.01%)#1,592 |
| 87. | Galveston | 138 | 153,031(0.09%)#87 | 2,829,008(0.00%)#1,647 |
| 88. | Huntsville | 136 | 153,031(0.09%)#88 | 2,829,008(0.00%)#1,669 |
| 89. | Hedwig Village | 135 | 153,031(0.09%)#89 | 2,829,008(0.00%)#1,683 |
| 90. | Wylie | 131 | 153,031(0.09%)#90 | 2,829,008(0.00%)#1,706 |
| 91. | Lantana | 128 | 153,031(0.08%)#91 | 2,829,008(0.00%)#1,738 |
| 92. | Mansfield | 125 | 153,031(0.08%)#92 | 2,829,008(0.00%)#1,762 |
| 93. | Desoto | 125 | 153,031(0.08%)#93 | 2,829,008(0.00%)#1,763 |
| 94. | Weatherford | 124 | 153,031(0.08%)#94 | 2,829,008(0.00%)#1,768 |
| 95. | Hurst | 123 | 153,031(0.08%)#95 | 2,829,008(0.00%)#1,780 |
| 96. | Sienna | 121 | 153,031(0.08%)#96 | 2,829,008(0.00%)#1,794 |
| 97. | Seguin | 116 | 153,031(0.08%)#97 | 2,829,008(0.00%)#1,837 |
| 98. | Princeton | 116 | 153,031(0.08%)#98 | 2,829,008(0.00%)#1,839 |
| 99. | Harker Heights | 114 | 153,031(0.07%)#99 | 2,829,008(0.00%)#1,846 |
| 100. | San Marcos | 113 | 153,031(0.07%)#100 | 2,829,008(0.00%)#1,857 |
Common Questions
What are the Top 10 Cities with the Most Immigrants from China in Texas?
Top 10 Cities with the Most Immigrants from China in Texas are:
#1
24,938
#2
10,135
#3
9,129
#4
8,516
#5
5,307
#6
4,191
#7
3,848
#8
3,329
#9
3,295
#10
2,894
What city has the Most Immigrants from China in Texas?
Houston has the Most Immigrants from China in Texas with 24,938.
What is the Total Immigrants from China in the State of Texas?
Total Immigrants from China in Texas is 153,031.
What is the Total Immigrants from China in the United States?
Total Immigrants from China in the United States is 2,829,008.