Cities with the Most Immigrants from China in Louisiana
RELATED REPORTS & OPTIONS
China
Louisiana
Compare Cities
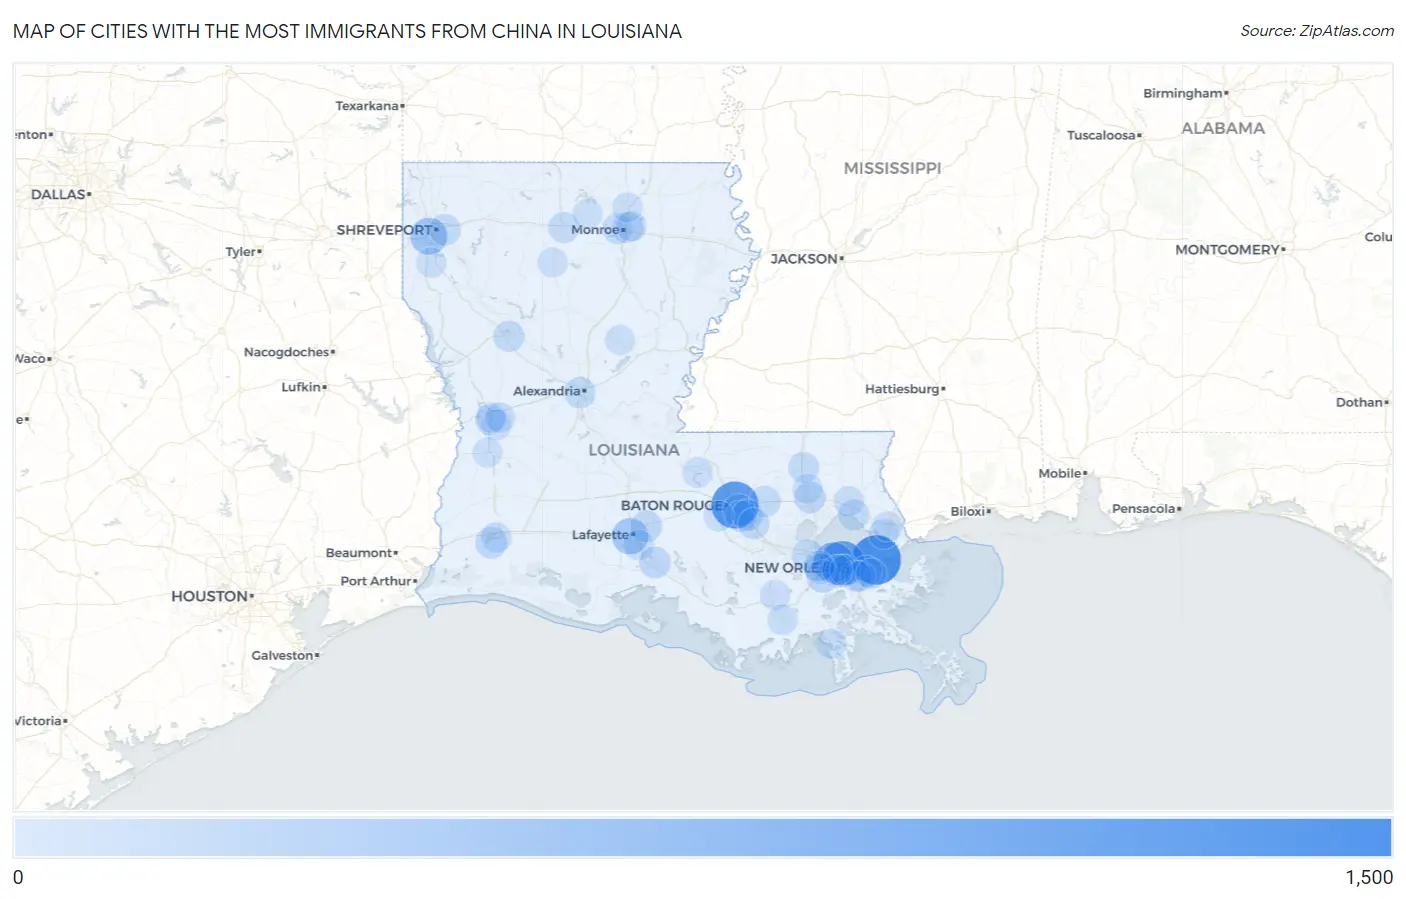
Map of Cities with the Most Immigrants from China in Louisiana
0
1,500
Cities with the Most Immigrants from China in Louisiana
| City | China | vs State | vs National | |
| 1. | New Orleans | 1,181 | 8,054(14.66%)#1 | 2,829,008(0.04%)#292 |
| 2. | Baton Rouge | 1,031 | 8,054(12.80%)#2 | 2,829,008(0.04%)#341 |
| 3. | Metairie | 931 | 8,054(11.56%)#3 | 2,829,008(0.03%)#370 |
| 4. | Kenner | 624 | 8,054(7.75%)#4 | 2,829,008(0.02%)#533 |
| 5. | Shreveport | 403 | 8,054(5.00%)#5 | 2,829,008(0.01%)#734 |
| 6. | Lafayette | 356 | 8,054(4.42%)#6 | 2,829,008(0.01%)#814 |
| 7. | Luling | 147 | 8,054(1.83%)#7 | 2,829,008(0.01%)#1,594 |
| 8. | Prien | 100 | 8,054(1.24%)#8 | 2,829,008(0.00%)#2,020 |
| 9. | Westminster | 100 | 8,054(1.24%)#9 | 2,829,008(0.00%)#2,025 |
| 10. | New Iberia | 97 | 8,054(1.20%)#10 | 2,829,008(0.00%)#2,053 |
| 11. | Breaux Bridge | 92 | 8,054(1.14%)#11 | 2,829,008(0.00%)#2,123 |
| 12. | Hammond | 90 | 8,054(1.12%)#12 | 2,829,008(0.00%)#2,148 |
| 13. | Village St George | 83 | 8,054(1.03%)#13 | 2,829,008(0.00%)#2,255 |
| 14. | Bossier City | 79 | 8,054(0.98%)#14 | 2,829,008(0.00%)#2,310 |
| 15. | Laplace | 78 | 8,054(0.97%)#15 | 2,829,008(0.00%)#2,331 |
| 16. | Alexandria | 72 | 8,054(0.89%)#16 | 2,829,008(0.00%)#2,434 |
| 17. | Walker | 68 | 8,054(0.84%)#17 | 2,829,008(0.00%)#2,521 |
| 18. | Old Jefferson | 67 | 8,054(0.83%)#18 | 2,829,008(0.00%)#2,537 |
| 19. | Prairieville | 66 | 8,054(0.82%)#19 | 2,829,008(0.00%)#2,549 |
| 20. | Mandeville | 65 | 8,054(0.81%)#20 | 2,829,008(0.00%)#2,574 |
| 21. | Natchitoches | 58 | 8,054(0.72%)#21 | 2,829,008(0.00%)#2,731 |
| 22. | Gretna | 58 | 8,054(0.72%)#22 | 2,829,008(0.00%)#2,732 |
| 23. | Ruston | 56 | 8,054(0.70%)#23 | 2,829,008(0.00%)#2,777 |
| 24. | Elmwood | 54 | 8,054(0.67%)#24 | 2,829,008(0.00%)#2,829 |
| 25. | Chalmette | 53 | 8,054(0.66%)#25 | 2,829,008(0.00%)#2,842 |
| 26. | Amite City | 52 | 8,054(0.65%)#26 | 2,829,008(0.00%)#2,880 |
| 27. | Destrehan | 47 | 8,054(0.58%)#27 | 2,829,008(0.00%)#3,046 |
| 28. | New Sarpy | 44 | 8,054(0.55%)#28 | 2,829,008(0.00%)#3,155 |
| 29. | Monroe | 43 | 8,054(0.53%)#29 | 2,829,008(0.00%)#3,157 |
| 30. | Broussard | 31 | 8,054(0.38%)#30 | 2,829,008(0.00%)#3,664 |
| 31. | West Monroe | 30 | 8,054(0.37%)#31 | 2,829,008(0.00%)#3,710 |
| 32. | New Roads | 29 | 8,054(0.36%)#32 | 2,829,008(0.00%)#3,782 |
| 33. | Terrytown | 26 | 8,054(0.32%)#33 | 2,829,008(0.00%)#3,923 |
| 34. | Jefferson | 25 | 8,054(0.31%)#34 | 2,829,008(0.00%)#3,992 |
| 35. | Lake Charles | 24 | 8,054(0.30%)#35 | 2,829,008(0.00%)#4,025 |
| 36. | Fort Polk South | 24 | 8,054(0.30%)#36 | 2,829,008(0.00%)#4,056 |
| 37. | Addis | 24 | 8,054(0.30%)#37 | 2,829,008(0.00%)#4,060 |
| 38. | Meraux | 23 | 8,054(0.29%)#38 | 2,829,008(0.00%)#4,118 |
| 39. | Lafourche Crossing | 21 | 8,054(0.26%)#39 | 2,829,008(0.00%)#4,251 |
| 40. | Houma | 15 | 8,054(0.19%)#40 | 2,829,008(0.00%)#4,686 |
| 41. | Eden Isle | 11 | 8,054(0.14%)#41 | 2,829,008(0.00%)#5,091 |
| 42. | Golden Meadow | 11 | 8,054(0.14%)#42 | 2,829,008(0.00%)#5,144 |
| 43. | Covington | 10 | 8,054(0.12%)#43 | 2,829,008(0.00%)#5,190 |
| 44. | Lakeshore | 10 | 8,054(0.12%)#44 | 2,829,008(0.00%)#5,241 |
| 45. | New Llano | 9 | 8,054(0.11%)#45 | 2,829,008(0.00%)#5,367 |
| 46. | Slidell | 7 | 8,054(0.09%)#46 | 2,829,008(0.00%)#5,537 |
| 47. | Leesville | 7 | 8,054(0.09%)#47 | 2,829,008(0.00%)#5,580 |
| 48. | Tickfaw | 6 | 8,054(0.07%)#48 | 2,829,008(0.00%)#5,799 |
| 49. | Deridder | 5 | 8,054(0.06%)#49 | 2,829,008(0.00%)#5,851 |
| 50. | Stonewall | 5 | 8,054(0.06%)#50 | 2,829,008(0.00%)#5,892 |
| 51. | Sterlington | 5 | 8,054(0.06%)#51 | 2,829,008(0.00%)#5,899 |
| 52. | Downsville | 4 | 8,054(0.05%)#52 | 2,829,008(0.00%)#6,112 |
| 53. | Fort Polk North | 3 | 8,054(0.04%)#53 | 2,829,008(0.00%)#6,160 |
| 54. | River Ridge | 2 | 8,054(0.02%)#54 | 2,829,008(0.00%)#6,277 |
| 55. | Jena | 2 | 8,054(0.02%)#55 | 2,829,008(0.00%)#6,294 |
| 56. | Hodge | 1 | 8,054(0.01%)#56 | 2,829,008(0.00%)#6,543 |
Common Questions
What are the Top 10 Cities with the Most Immigrants from China in Louisiana?
Top 10 Cities with the Most Immigrants from China in Louisiana are:
#1
1,181
#2
1,031
#3
931
#4
624
#5
403
#6
356
#7
147
#8
100
#9
100
#10
97
What city has the Most Immigrants from China in Louisiana?
New Orleans has the Most Immigrants from China in Louisiana with 1,181.
What is the Total Immigrants from China in the State of Louisiana?
Total Immigrants from China in Louisiana is 8,054.
What is the Total Immigrants from China in the United States?
Total Immigrants from China in the United States is 2,829,008.