Zip Codes with the Highest Percentage of Immigrants from Asia in Lima, OH
RELATED REPORTS & OPTIONS
Asia
Lima
Compare Zip Codes
Map of Zip Codes with the Highest Percentage of Immigrants from Asia in Lima
0.048%
1.75%
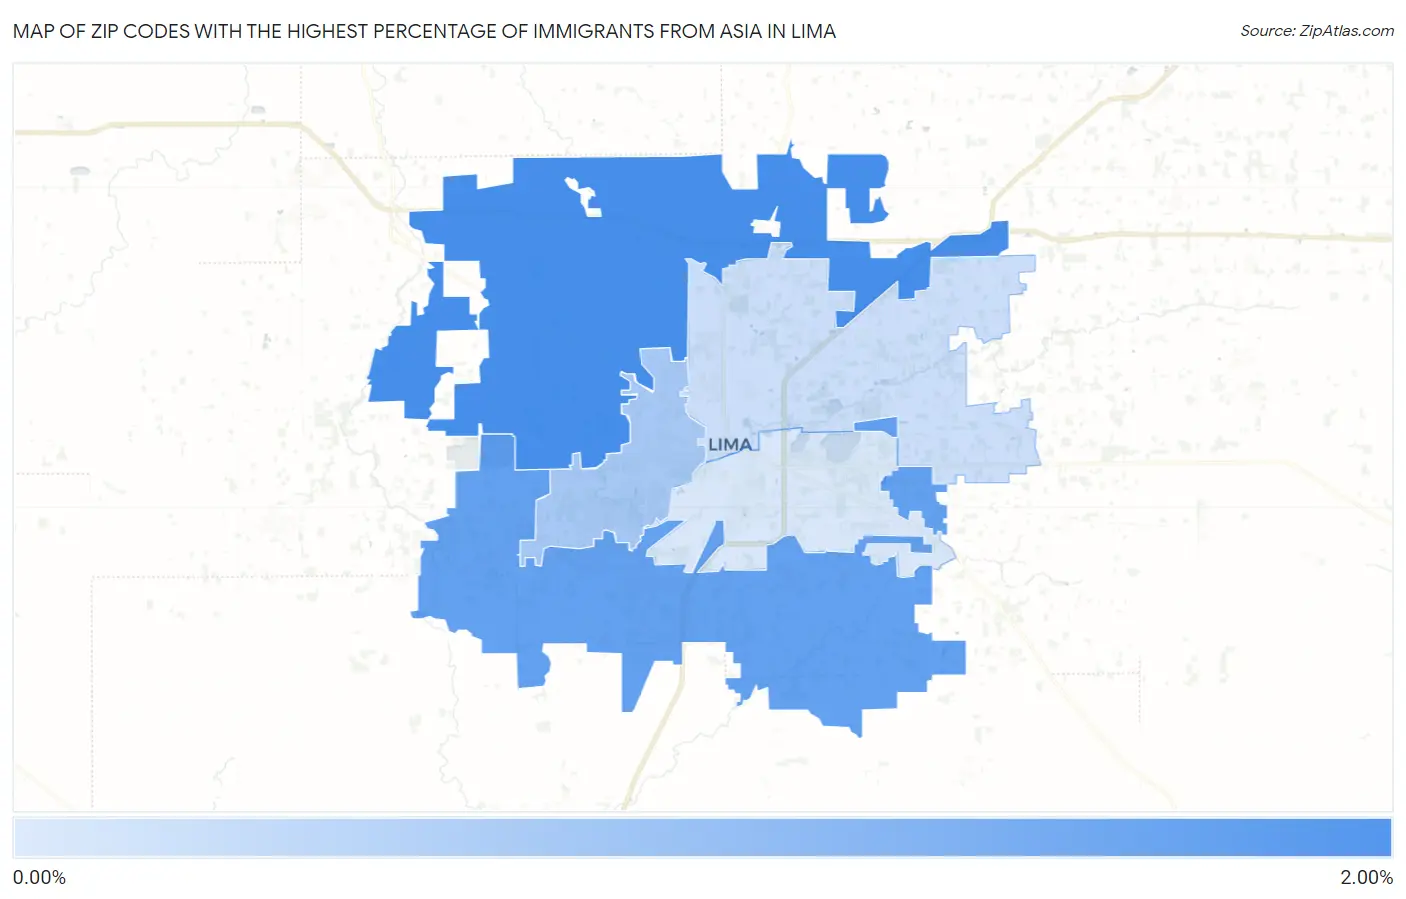
Zip Codes with the Highest Percentage of Immigrants from Asia in Lima, OH
| Zip Code | Asia | vs State | vs National | |
| 1. | 45807 | 1.75% | 2.06% (-0.313)#189 | 4.26% (-2.51)#7,504 |
| 2. | 45806 | 1.41% | 2.06% (-0.650)#228 | 4.26% (-2.85)#8,589 |
| 3. | 45805 | 0.64% | 2.06% (-1.42)#372 | 4.26% (-3.62)#12,666 |
| 4. | 45801 | 0.20% | 2.06% (-1.86)#548 | 4.26% (-4.06)#17,061 |
| 5. | 45804 | 0.048% | 2.06% (-2.01)#632 | 4.26% (-4.21)#18,994 |
1
Common Questions
What are the Top 3 Zip Codes with the Highest Percentage of Immigrants from Asia in Lima, OH?
Top 3 Zip Codes with the Highest Percentage of Immigrants from Asia in Lima, OH are:
What zip code has the Highest Percentage of Immigrants from Asia in Lima, OH?
45807 has the Highest Percentage of Immigrants from Asia in Lima, OH with 1.75%.
What is the Percentage of Immigrants from Asia in Lima, OH?
Percentage of Immigrants from Asia in Lima is 0.19%.
What is the Percentage of Immigrants from Asia in Ohio?
Percentage of Immigrants from Asia in Ohio is 2.06%.
What is the Percentage of Immigrants from Asia in the United States?
Percentage of Immigrants from Asia in the United States is 4.26%.