Zip Codes with the Highest Percentage of Population Employed in Cleaning & Maintenance in Cincinnati, OH
RELATED REPORTS & OPTIONS
Cleaning & Maintenance
Cincinnati
Compare Zip Codes
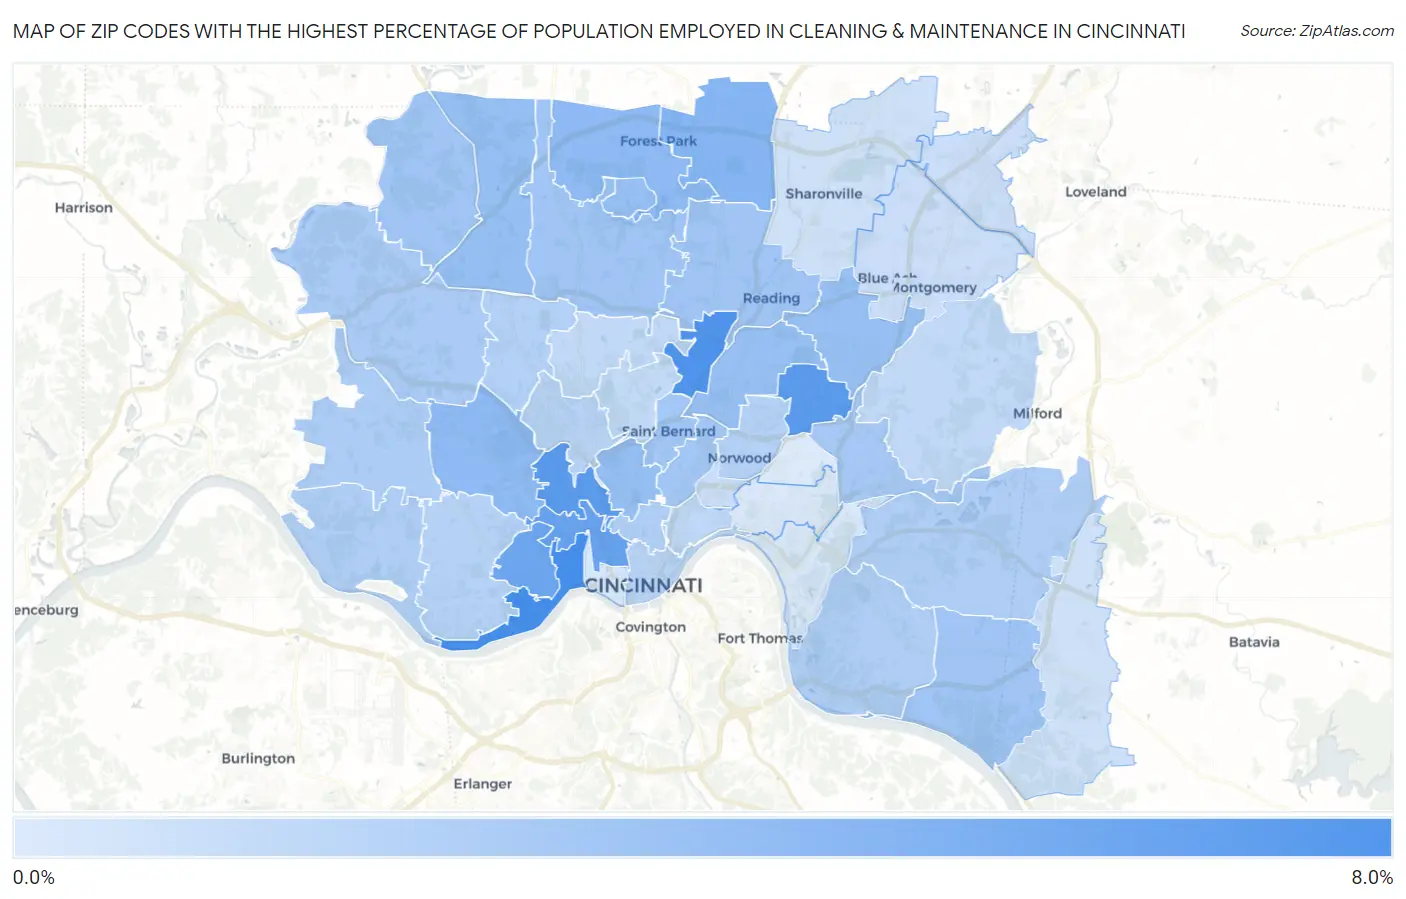
Map of Zip Codes with the Highest Percentage of Population Employed in Cleaning & Maintenance in Cincinnati
0.35%
7.7%
Zip Codes with the Highest Percentage of Population Employed in Cleaning & Maintenance in Cincinnati, OH
| Zip Code | % Employed | vs State | vs National | |
| 1. | 45204 | 7.7% | 3.2%(+4.49)#118 | 3.5%(+4.22)#3,321 |
| 2. | 45216 | 7.2% | 3.2%(+3.99)#136 | 3.5%(+3.72)#3,852 |
| 3. | 45213 | 6.8% | 3.2%(+3.60)#149 | 3.5%(+3.33)#4,317 |
| 4. | 45225 | 6.7% | 3.2%(+3.50)#160 | 3.5%(+3.23)#4,458 |
| 5. | 45214 | 6.1% | 3.2%(+2.87)#199 | 3.5%(+2.60)#5,491 |
| 6. | 45205 | 5.7% | 3.2%(+2.53)#214 | 3.5%(+2.26)#6,194 |
| 7. | 45246 | 4.6% | 3.2%(+1.41)#312 | 3.5%(+1.14)#9,068 |
| 8. | 45211 | 4.1% | 3.2%(+0.899)#389 | 3.5%(+0.631)#10,896 |
| 9. | 45240 | 4.1% | 3.2%(+0.872)#395 | 3.5%(+0.604)#10,993 |
| 10. | 45251 | 3.8% | 3.2%(+0.567)#448 | 3.5%(+0.299)#12,228 |
| 11. | 45220 | 3.8% | 3.2%(+0.546)#453 | 3.5%(+0.278)#12,319 |
| 12. | 45236 | 3.7% | 3.2%(+0.448)#473 | 3.5%(+0.180)#12,703 |
| 13. | 45218 | 3.6% | 3.2%(+0.425)#476 | 3.5%(+0.157)#12,806 |
| 14. | 45237 | 3.6% | 3.2%(+0.410)#480 | 3.5%(+0.142)#12,868 |
| 15. | 45255 | 3.2% | 3.2%(+0.011)#556 | 3.5%(-0.257)#14,738 |
| 16. | 45231 | 3.2% | 3.2%(+0.010)#561 | 3.5%(-0.258)#14,771 |
| 17. | 45252 | 3.2% | 3.2%(-0.001)#568 | 3.5%(-0.269)#14,816 |
| 18. | 45215 | 3.2% | 3.2%(-0.040)#574 | 3.5%(-0.308)#14,998 |
| 19. | 45229 | 3.1% | 3.2%(-0.092)#587 | 3.5%(-0.360)#15,262 |
| 20. | 45217 | 3.1% | 3.2%(-0.133)#595 | 3.5%(-0.401)#15,451 |
| 21. | 45227 | 3.0% | 3.2%(-0.194)#604 | 3.5%(-0.462)#15,773 |
| 22. | 45247 | 2.8% | 3.2%(-0.452)#659 | 3.5%(-0.720)#17,123 |
| 23. | 45248 | 2.7% | 3.2%(-0.511)#672 | 3.5%(-0.779)#17,432 |
| 24. | 45233 | 2.6% | 3.2%(-0.637)#702 | 3.5%(-0.905)#18,087 |
| 25. | 45230 | 2.5% | 3.2%(-0.682)#716 | 3.5%(-0.950)#18,304 |
| 26. | 45244 | 2.5% | 3.2%(-0.693)#718 | 3.5%(-0.961)#18,359 |
| 27. | 45219 | 2.5% | 3.2%(-0.731)#730 | 3.5%(-0.999)#18,570 |
| 28. | 45239 | 2.3% | 3.2%(-0.903)#776 | 3.5%(-1.17)#19,476 |
| 29. | 45212 | 2.2% | 3.2%(-1.01)#802 | 3.5%(-1.28)#20,017 |
| 30. | 45238 | 2.2% | 3.2%(-1.04)#813 | 3.5%(-1.31)#20,178 |
| 31. | 45223 | 2.1% | 3.2%(-1.11)#823 | 3.5%(-1.38)#20,546 |
| 32. | 45202 | 2.1% | 3.2%(-1.12)#825 | 3.5%(-1.39)#20,622 |
| 33. | 45206 | 1.8% | 3.2%(-1.42)#885 | 3.5%(-1.68)#22,076 |
| 34. | 45243 | 1.7% | 3.2%(-1.50)#904 | 3.5%(-1.77)#22,441 |
| 35. | 45224 | 1.7% | 3.2%(-1.52)#907 | 3.5%(-1.79)#22,563 |
| 36. | 45232 | 1.5% | 3.2%(-1.67)#936 | 3.5%(-1.94)#23,301 |
| 37. | 45207 | 1.3% | 3.2%(-1.94)#979 | 3.5%(-2.20)#24,493 |
| 38. | 45249 | 1.3% | 3.2%(-1.96)#983 | 3.5%(-2.23)#24,591 |
| 39. | 45242 | 1.2% | 3.2%(-2.00)#986 | 3.5%(-2.27)#24,735 |
| 40. | 45245 | 1.1% | 3.2%(-2.16)#1,006 | 3.5%(-2.42)#25,297 |
| 41. | 45241 | 1.0% | 3.2%(-2.19)#1,013 | 3.5%(-2.46)#25,425 |
| 42. | 45203 | 0.73% | 3.2%(-2.49)#1,041 | 3.5%(-2.75)#26,369 |
| 43. | 45226 | 0.56% | 3.2%(-2.66)#1,062 | 3.5%(-2.93)#26,850 |
| 44. | 45208 | 0.45% | 3.2%(-2.77)#1,070 | 3.5%(-3.03)#27,100 |
| 45. | 45209 | 0.35% | 3.2%(-2.86)#1,078 | 3.5%(-3.13)#27,294 |
1
Common Questions
What are the Top 10 Zip Codes with the Highest Percentage of Population Employed in Cleaning & Maintenance in Cincinnati, OH?
Top 10 Zip Codes with the Highest Percentage of Population Employed in Cleaning & Maintenance in Cincinnati, OH are:
What zip code has the Highest Percentage of Population Employed in Cleaning & Maintenance in Cincinnati, OH?
45204 has the Highest Percentage of Population Employed in Cleaning & Maintenance in Cincinnati, OH with 7.7%.
What is the Percentage of Population Employed in Cleaning & Maintenance in Cincinnati, OH?
Percentage of Population Employed in Cleaning & Maintenance in Cincinnati is 3.0%.
What is the Percentage of Population Employed in Cleaning & Maintenance in Ohio?
Percentage of Population Employed in Cleaning & Maintenance in Ohio is 3.2%.
What is the Percentage of Population Employed in Cleaning & Maintenance in the United States?
Percentage of Population Employed in Cleaning & Maintenance in the United States is 3.5%.