Cities with the Highest Percentage of Scandinavian Population in Kentucky
RELATED REPORTS & OPTIONS
Scandinavian
Kentucky
Compare Cities
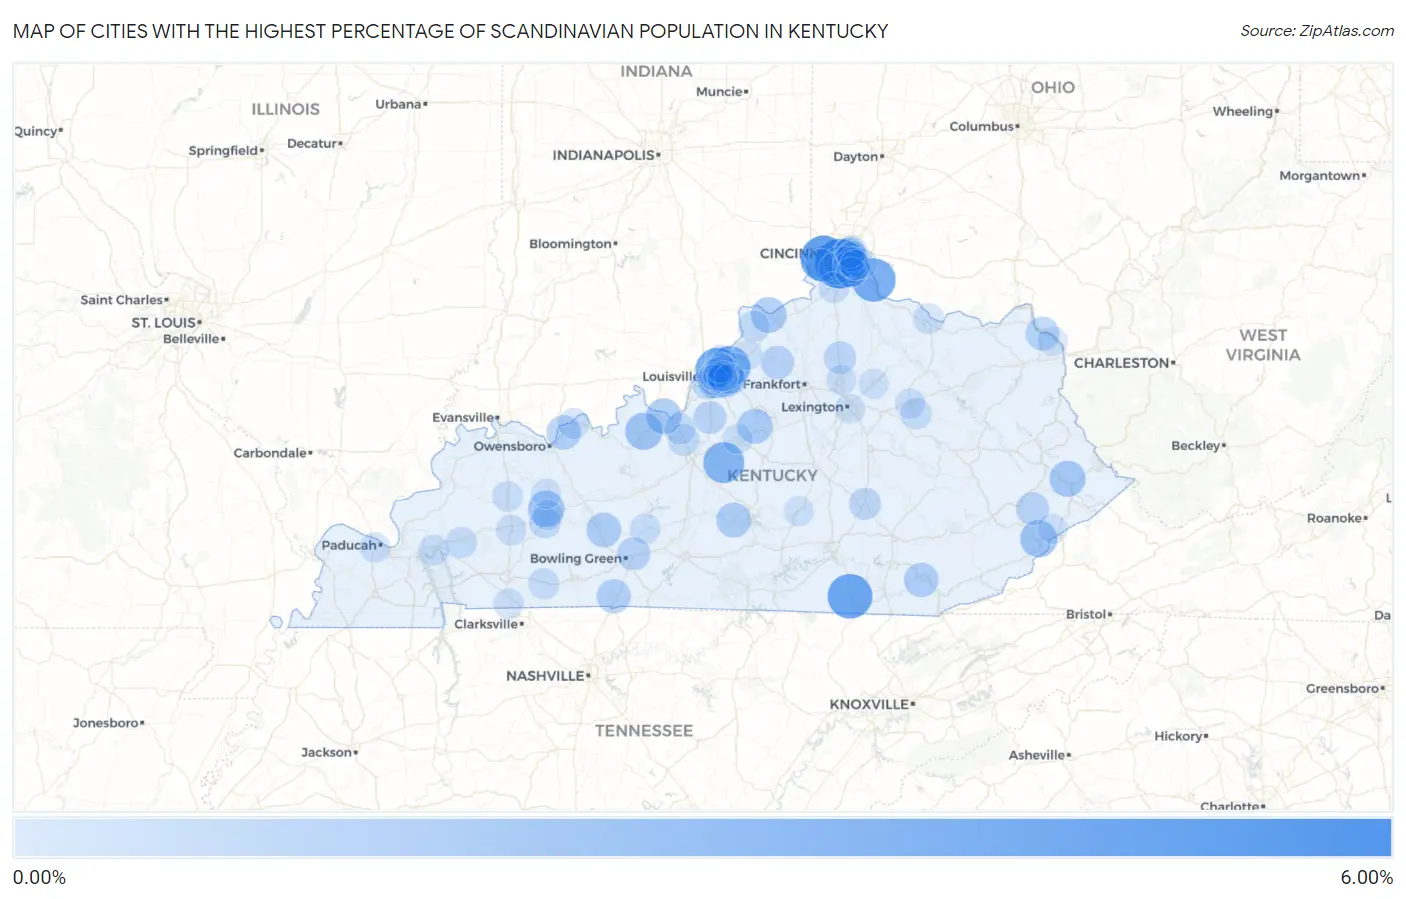
Map of Cities with the Highest Percentage of Scandinavian Population in Kentucky
0.00%
6.00%
Cities with the Highest Percentage of Scandinavian Population in Kentucky
| City | Scandinavian | vs State | vs National | |
| 1. | Crestview Hills | 5.51% | 0.22%(+5.29)#1 | 0.30%(+5.21)#292 |
| 2. | Hebron | 4.62% | 0.22%(+4.40)#2 | 0.30%(+4.31)#380 |
| 3. | Whitley City | 4.18% | 0.22%(+3.96)#3 | 0.30%(+3.88)#450 |
| 4. | Glenview Hills | 4.06% | 0.22%(+3.84)#4 | 0.30%(+3.75)#465 |
| 5. | California | 3.85% | 0.22%(+3.63)#5 | 0.30%(+3.54)#518 |
| 6. | Taylor Mill | 3.27% | 0.22%(+3.05)#6 | 0.30%(+2.97)#654 |
| 7. | New Haven | 3.17% | 0.22%(+2.95)#7 | 0.30%(+2.86)#685 |
| 8. | Orchard Grass Hills | 2.99% | 0.22%(+2.77)#8 | 0.30%(+2.69)#747 |
| 9. | Irvington | 2.16% | 0.22%(+1.94)#9 | 0.30%(+1.86)#1,174 |
| 10. | Whitesburg | 2.14% | 0.22%(+1.92)#10 | 0.30%(+1.83)#1,202 |
| 11. | South Carrollton | 1.97% | 0.22%(+1.75)#11 | 0.30%(+1.67)#1,340 |
| 12. | Coal Run Village | 1.84% | 0.22%(+1.62)#12 | 0.30%(+1.54)#1,446 |
| 13. | Doe Valley | 1.76% | 0.22%(+1.54)#13 | 0.30%(+1.46)#1,536 |
| 14. | Prestonville | 1.74% | 0.22%(+1.52)#14 | 0.30%(+1.43)#1,566 |
| 15. | Bloomfield | 1.58% | 0.22%(+1.36)#15 | 0.30%(+1.28)#1,761 |
| 16. | Greensburg | 1.56% | 0.22%(+1.34)#16 | 0.30%(+1.26)#1,777 |
| 17. | Woodbury | 1.49% | 0.22%(+1.27)#17 | 0.30%(+1.19)#1,862 |
| 18. | Artemus | 1.45% | 0.22%(+1.23)#18 | 0.30%(+1.15)#1,910 |
| 19. | Maceo | 1.44% | 0.22%(+1.22)#19 | 0.30%(+1.14)#1,926 |
| 20. | Sycamore | 1.43% | 0.22%(+1.21)#20 | 0.30%(+1.12)#1,950 |
| 21. | Franklin | 1.37% | 0.22%(+1.15)#21 | 0.30%(+1.07)#2,036 |
| 22. | Meadowview Estates | 1.34% | 0.22%(+1.12)#22 | 0.30%(+1.04)#2,085 |
| 23. | Wurtland | 1.24% | 0.22%(+1.01)#23 | 0.30%(+0.931)#2,310 |
| 24. | Pleasureville | 1.14% | 0.22%(+0.924)#24 | 0.30%(+0.840)#2,497 |
| 25. | Middletown | 1.14% | 0.22%(+0.915)#25 | 0.30%(+0.832)#2,513 |
| 26. | Pippa Passes | 1.10% | 0.22%(+0.884)#26 | 0.30%(+0.801)#2,596 |
| 27. | Plum Springs | 1.09% | 0.22%(+0.871)#27 | 0.30%(+0.787)#2,632 |
| 28. | Newport | 1.09% | 0.22%(+0.864)#28 | 0.30%(+0.781)#2,648 |
| 29. | Shepherdsville | 1.01% | 0.22%(+0.791)#29 | 0.30%(+0.707)#2,828 |
| 30. | Lakeside Park | 0.99% | 0.22%(+0.768)#30 | 0.30%(+0.685)#2,888 |
| 31. | Sadieville | 0.92% | 0.22%(+0.702)#31 | 0.30%(+0.619)#3,060 |
| 32. | Crestview | 0.82% | 0.22%(+0.599)#32 | 0.30%(+0.515)#3,420 |
| 33. | Burlington | 0.82% | 0.22%(+0.595)#33 | 0.30%(+0.512)#3,438 |
| 34. | Mount Vernon | 0.81% | 0.22%(+0.590)#34 | 0.30%(+0.507)#3,459 |
| 35. | Elsmere | 0.80% | 0.22%(+0.579)#35 | 0.30%(+0.496)#3,511 |
| 36. | Plantation | 0.79% | 0.22%(+0.565)#36 | 0.30%(+0.482)#3,563 |
| 37. | Old Brownsboro Place | 0.78% | 0.22%(+0.560)#37 | 0.30%(+0.477)#3,585 |
| 38. | Dayton | 0.74% | 0.22%(+0.519)#38 | 0.30%(+0.436)#3,747 |
| 39. | Pewee Valley | 0.73% | 0.22%(+0.505)#39 | 0.30%(+0.422)#3,810 |
| 40. | Radcliff | 0.72% | 0.22%(+0.497)#40 | 0.30%(+0.414)#3,847 |
| 41. | Southgate | 0.71% | 0.22%(+0.486)#41 | 0.30%(+0.403)#3,897 |
| 42. | Powderly | 0.71% | 0.22%(+0.486)#42 | 0.30%(+0.402)#3,898 |
| 43. | Wellington | 0.68% | 0.22%(+0.456)#43 | 0.30%(+0.373)#4,026 |
| 44. | Fairview | 0.68% | 0.22%(+0.455)#44 | 0.30%(+0.371)#4,037 |
| 45. | Bedford | 0.66% | 0.22%(+0.439)#45 | 0.30%(+0.356)#4,109 |
| 46. | Jeffersontown | 0.66% | 0.22%(+0.439)#46 | 0.30%(+0.356)#4,110 |
| 47. | Audubon Park | 0.64% | 0.22%(+0.416)#47 | 0.30%(+0.333)#4,224 |
| 48. | Princeton | 0.62% | 0.22%(+0.403)#48 | 0.30%(+0.320)#4,283 |
| 49. | Mockingbird Valley | 0.62% | 0.22%(+0.400)#49 | 0.30%(+0.317)#4,292 |
| 50. | Brownsboro Village | 0.61% | 0.22%(+0.392)#50 | 0.30%(+0.309)#4,324 |
| 51. | Camargo | 0.59% | 0.22%(+0.368)#51 | 0.30%(+0.285)#4,454 |
| 52. | Fort Knox | 0.59% | 0.22%(+0.368)#52 | 0.30%(+0.285)#4,456 |
| 53. | Barbourmeade | 0.58% | 0.22%(+0.356)#53 | 0.30%(+0.273)#4,526 |
| 54. | Elkton | 0.56% | 0.22%(+0.342)#54 | 0.30%(+0.259)#4,604 |
| 55. | Melbourne | 0.55% | 0.22%(+0.327)#55 | 0.30%(+0.244)#4,694 |
| 56. | Beechwood Village | 0.54% | 0.22%(+0.317)#56 | 0.30%(+0.233)#4,751 |
| 57. | Anchorage | 0.54% | 0.22%(+0.316)#57 | 0.30%(+0.233)#4,753 |
| 58. | Walton | 0.53% | 0.22%(+0.307)#58 | 0.30%(+0.224)#4,806 |
| 59. | Maysville | 0.52% | 0.22%(+0.300)#59 | 0.30%(+0.217)#4,845 |
| 60. | Norwood | 0.51% | 0.22%(+0.293)#60 | 0.30%(+0.210)#4,894 |
| 61. | Murray Hill | 0.51% | 0.22%(+0.292)#61 | 0.30%(+0.209)#4,901 |
| 62. | Lewisport | 0.50% | 0.22%(+0.284)#62 | 0.30%(+0.200)#4,959 |
| 63. | Hurstbourne Acres | 0.50% | 0.22%(+0.279)#63 | 0.30%(+0.196)#4,988 |
| 64. | Hanson | 0.49% | 0.22%(+0.272)#64 | 0.30%(+0.188)#5,040 |
| 65. | Kuttawa | 0.48% | 0.22%(+0.261)#65 | 0.30%(+0.178)#5,112 |
| 66. | Brownsville | 0.48% | 0.22%(+0.255)#66 | 0.30%(+0.172)#5,161 |
| 67. | Wilder | 0.48% | 0.22%(+0.255)#67 | 0.30%(+0.172)#5,165 |
| 68. | Bellevue | 0.46% | 0.22%(+0.244)#68 | 0.30%(+0.160)#5,247 |
| 69. | Fort Thomas | 0.46% | 0.22%(+0.235)#69 | 0.30%(+0.152)#5,310 |
| 70. | Windy Hills | 0.46% | 0.22%(+0.235)#70 | 0.30%(+0.152)#5,316 |
| 71. | Nortonville | 0.45% | 0.22%(+0.232)#71 | 0.30%(+0.149)#5,333 |
| 72. | Fort Campbell North | 0.43% | 0.22%(+0.212)#72 | 0.30%(+0.129)#5,514 |
| 73. | Bellewood | 0.43% | 0.22%(+0.204)#73 | 0.30%(+0.121)#5,591 |
| 74. | Mount Sterling | 0.42% | 0.22%(+0.204)#74 | 0.30%(+0.121)#5,596 |
| 75. | Thruston | 0.42% | 0.22%(+0.198)#75 | 0.30%(+0.114)#5,645 |
| 76. | Georgetown | 0.42% | 0.22%(+0.197)#76 | 0.30%(+0.114)#5,647 |
| 77. | Central City | 0.42% | 0.22%(+0.197)#77 | 0.30%(+0.114)#5,652 |
| 78. | River Bluff | 0.40% | 0.22%(+0.182)#78 | 0.30%(+0.099)#5,787 |
| 79. | Bancroft | 0.40% | 0.22%(+0.180)#79 | 0.30%(+0.096)#5,802 |
| 80. | Highland Heights | 0.40% | 0.22%(+0.175)#80 | 0.30%(+0.092)#5,836 |
| 81. | Woodlawn Park | 0.39% | 0.22%(+0.166)#81 | 0.30%(+0.082)#5,930 |
| 82. | Paducah | 0.36% | 0.22%(+0.144)#82 | 0.30%(+0.060)#6,158 |
| 83. | Northfield | 0.36% | 0.22%(+0.141)#83 | 0.30%(+0.057)#6,183 |
| 84. | Brownsboro Farm | 0.36% | 0.22%(+0.141)#84 | 0.30%(+0.057)#6,186 |
| 85. | Bardstown | 0.36% | 0.22%(+0.140)#85 | 0.30%(+0.057)#6,191 |
| 86. | Paris | 0.35% | 0.22%(+0.134)#86 | 0.30%(+0.051)#6,251 |
| 87. | Seneca Gardens | 0.35% | 0.22%(+0.130)#87 | 0.30%(+0.047)#6,288 |
| 88. | St Matthews | 0.35% | 0.22%(+0.127)#88 | 0.30%(+0.044)#6,317 |
| 89. | Fleming Neon | 0.35% | 0.22%(+0.127)#89 | 0.30%(+0.044)#6,319 |
| 90. | Green Spring | 0.35% | 0.22%(+0.124)#90 | 0.30%(+0.041)#6,347 |
| 91. | Hurstbourne | 0.34% | 0.22%(+0.123)#91 | 0.30%(+0.039)#6,366 |
| 92. | Ryland Heights | 0.34% | 0.22%(+0.117)#92 | 0.30%(+0.034)#6,428 |
| 93. | Cold Spring | 0.34% | 0.22%(+0.115)#93 | 0.30%(+0.031)#6,445 |
| 94. | Bellefonte | 0.33% | 0.22%(+0.108)#94 | 0.30%(+0.025)#6,514 |
| 95. | La Grange | 0.33% | 0.22%(+0.107)#95 | 0.30%(+0.023)#6,531 |
| 96. | Island | 0.33% | 0.22%(+0.104)#96 | 0.30%(+0.021)#6,559 |
| 97. | Liberty | 0.32% | 0.22%(+0.102)#97 | 0.30%(+0.019)#6,575 |
| 98. | Woodland Hills | 0.32% | 0.22%(+0.101)#98 | 0.30%(+0.018)#6,589 |
| 99. | Bellemeade | 0.32% | 0.22%(+0.097)#99 | 0.30%(+0.013)#6,630 |
| 100. | Lexington | 0.31% | 0.22%(+0.093)#100 | 0.30%(+0.010)#6,659 |
Common Questions
What are the Top 10 Cities with the Highest Percentage of Scandinavian Population in Kentucky?
Top 10 Cities with the Highest Percentage of Scandinavian Population in Kentucky are:
#1
5.51%
#2
4.62%
#3
4.18%
#4
4.06%
#5
3.85%
#6
3.27%
#7
3.17%
#8
2.99%
#9
2.16%
#10
2.14%
What city has the Highest Percentage of Scandinavian Population in Kentucky?
Crestview Hills has the Highest Percentage of Scandinavian Population in Kentucky with 5.51%.
What is the Percentage of Scandinavian Population in the State of Kentucky?
Percentage of Scandinavian Population in Kentucky is 0.22%.
What is the Percentage of Scandinavian Population in the United States?
Percentage of Scandinavian Population in the United States is 0.30%.