Cities with the Highest Percentage of Scandinavian Population in Missouri
RELATED REPORTS & OPTIONS
Scandinavian
Missouri
Compare Cities
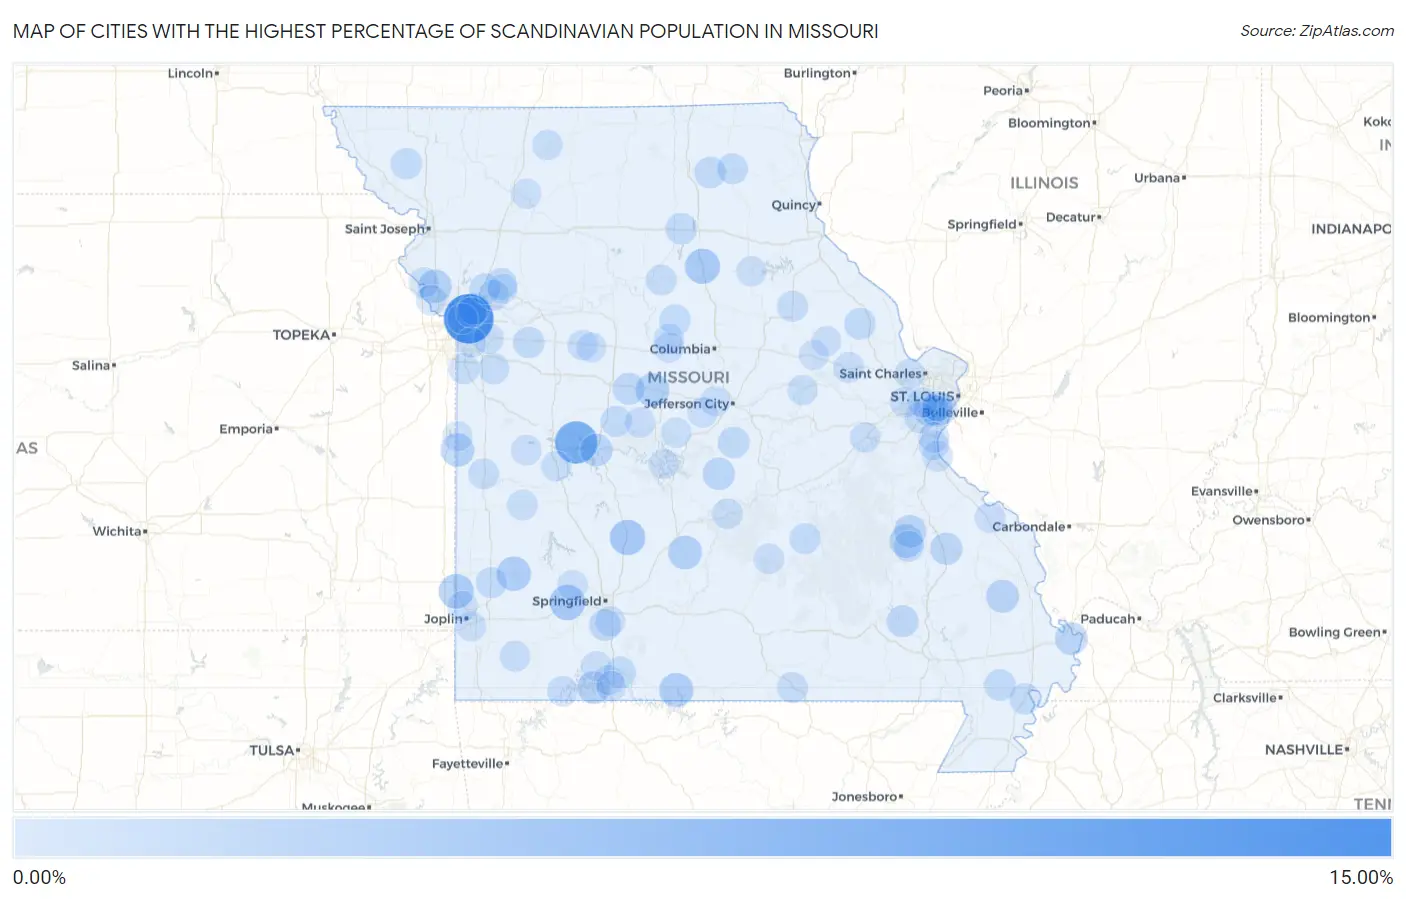
Map of Cities with the Highest Percentage of Scandinavian Population in Missouri
0.00%
15.00%
Cities with the Highest Percentage of Scandinavian Population in Missouri
| City | Scandinavian | vs State | vs National | |
| 1. | Randolph | 15.00% | 0.29%(+14.7)#1 | 0.30%(+14.7)#60 |
| 2. | Tightwad | 9.59% | 0.29%(+9.30)#2 | 0.30%(+9.28)#120 |
| 3. | Buffalo | 4.37% | 0.29%(+4.08)#3 | 0.30%(+4.06)#417 |
| 4. | Halltown | 4.35% | 0.29%(+4.06)#4 | 0.30%(+4.04)#424 |
| 5. | Cairo | 4.13% | 0.29%(+3.84)#5 | 0.30%(+3.83)#456 |
| 6. | Asbury | 3.91% | 0.29%(+3.62)#6 | 0.30%(+3.61)#497 |
| 7. | Golden City | 3.59% | 0.29%(+3.30)#7 | 0.30%(+3.29)#564 |
| 8. | Theodosia | 3.42% | 0.29%(+3.13)#8 | 0.30%(+3.12)#607 |
| 9. | Syracuse | 3.18% | 0.29%(+2.89)#9 | 0.30%(+2.88)#679 |
| 10. | Evergreen | 3.16% | 0.29%(+2.87)#10 | 0.30%(+2.85)#687 |
| 11. | Tracy | 2.97% | 0.29%(+2.68)#11 | 0.30%(+2.67)#753 |
| 12. | Amoret | 2.96% | 0.29%(+2.67)#12 | 0.30%(+2.66)#757 |
| 13. | Pilot Knob | 2.85% | 0.29%(+2.55)#13 | 0.30%(+2.54)#800 |
| 14. | Whitewater | 2.67% | 0.29%(+2.37)#14 | 0.30%(+2.36)#889 |
| 15. | Coney Island | 2.63% | 0.29%(+2.34)#15 | 0.30%(+2.33)#902 |
| 16. | Iron Mountain Lake | 2.36% | 0.29%(+2.07)#16 | 0.30%(+2.05)#1,036 |
| 17. | Wyatt | 2.34% | 0.29%(+2.05)#17 | 0.30%(+2.04)#1,046 |
| 18. | Warsaw | 2.32% | 0.29%(+2.03)#18 | 0.30%(+2.02)#1,067 |
| 19. | Fenton | 2.27% | 0.29%(+1.98)#19 | 0.30%(+1.97)#1,100 |
| 20. | Iberia | 2.07% | 0.29%(+1.78)#20 | 0.30%(+1.77)#1,257 |
| 21. | Lakeshire | 2.04% | 0.29%(+1.75)#21 | 0.30%(+1.74)#1,284 |
| 22. | Fredericktown | 2.01% | 0.29%(+1.71)#22 | 0.30%(+1.70)#1,309 |
| 23. | Smithton | 1.95% | 0.29%(+1.65)#23 | 0.30%(+1.64)#1,366 |
| 24. | Mill Spring | 1.83% | 0.29%(+1.54)#24 | 0.30%(+1.53)#1,452 |
| 25. | Glenaire | 1.83% | 0.29%(+1.54)#25 | 0.30%(+1.52)#1,462 |
| 26. | Nixa | 1.78% | 0.29%(+1.48)#26 | 0.30%(+1.47)#1,525 |
| 27. | Rockaway Beach | 1.69% | 0.29%(+1.40)#27 | 0.30%(+1.39)#1,616 |
| 28. | Callao | 1.66% | 0.29%(+1.37)#28 | 0.30%(+1.36)#1,662 |
| 29. | Parma | 1.61% | 0.29%(+1.32)#29 | 0.30%(+1.31)#1,717 |
| 30. | Brashear | 1.61% | 0.29%(+1.32)#31 | 0.30%(+1.31)#1,721 |
| 31. | Meta | 1.61% | 0.29%(+1.32)#32 | 0.30%(+1.31)#1,722 |
| 32. | Excelsior Estates | 1.60% | 0.29%(+1.31)#33 | 0.30%(+1.29)#1,739 |
| 33. | Silex | 1.59% | 0.29%(+1.30)#34 | 0.30%(+1.29)#1,746 |
| 34. | Odessa | 1.51% | 0.29%(+1.22)#35 | 0.30%(+1.21)#1,839 |
| 35. | Graham | 1.44% | 0.29%(+1.15)#36 | 0.30%(+1.13)#1,935 |
| 36. | Marston | 1.43% | 0.29%(+1.14)#37 | 0.30%(+1.12)#1,946 |
| 37. | Fayette | 1.40% | 0.29%(+1.11)#38 | 0.30%(+1.09)#1,996 |
| 38. | Sappington | 1.39% | 0.29%(+1.10)#39 | 0.30%(+1.09)#2,002 |
| 39. | Cole Camp | 1.32% | 0.29%(+1.03)#40 | 0.30%(+1.02)#2,131 |
| 40. | Jasper | 1.32% | 0.29%(+1.03)#41 | 0.30%(+1.02)#2,132 |
| 41. | Kearney | 1.26% | 0.29%(+0.966)#42 | 0.30%(+0.954)#2,253 |
| 42. | Salem | 1.24% | 0.29%(+0.949)#43 | 0.30%(+0.937)#2,295 |
| 43. | Edina | 1.23% | 0.29%(+0.941)#44 | 0.30%(+0.928)#2,317 |
| 44. | Parkdale | 1.21% | 0.29%(+0.917)#45 | 0.30%(+0.905)#2,362 |
| 45. | Pleasant Hill | 1.20% | 0.29%(+0.909)#46 | 0.30%(+0.897)#2,377 |
| 46. | Laddonia | 1.19% | 0.29%(+0.900)#47 | 0.30%(+0.888)#2,395 |
| 47. | Warrenton | 1.19% | 0.29%(+0.899)#48 | 0.30%(+0.887)#2,396 |
| 48. | Belton | 1.18% | 0.29%(+0.892)#49 | 0.30%(+0.880)#2,414 |
| 49. | Arcadia | 1.18% | 0.29%(+0.884)#50 | 0.30%(+0.872)#2,430 |
| 50. | Koshkonong | 1.15% | 0.29%(+0.857)#51 | 0.30%(+0.845)#2,490 |
| 51. | Prathersville | 1.11% | 0.29%(+0.819)#52 | 0.30%(+0.807)#2,582 |
| 52. | Salisbury | 1.05% | 0.29%(+0.757)#53 | 0.30%(+0.745)#2,727 |
| 53. | Rich Hill | 1.01% | 0.29%(+0.719)#54 | 0.30%(+0.707)#2,829 |
| 54. | Fairview | 1.01% | 0.29%(+0.713)#55 | 0.30%(+0.701)#2,842 |
| 55. | El Dorado Springs | 0.99% | 0.29%(+0.699)#56 | 0.30%(+0.687)#2,877 |
| 56. | Crystal City | 0.97% | 0.29%(+0.682)#57 | 0.30%(+0.670)#2,923 |
| 57. | Emerald Beach | 0.95% | 0.29%(+0.656)#58 | 0.30%(+0.644)#2,985 |
| 58. | Stover | 0.94% | 0.29%(+0.651)#59 | 0.30%(+0.639)#3,000 |
| 59. | Sunset Hills | 0.94% | 0.29%(+0.651)#60 | 0.30%(+0.639)#3,007 |
| 60. | Licking | 0.93% | 0.29%(+0.642)#61 | 0.30%(+0.630)#3,030 |
| 61. | Barnhart | 0.93% | 0.29%(+0.635)#62 | 0.30%(+0.623)#3,044 |
| 62. | Montrose | 0.92% | 0.29%(+0.632)#63 | 0.30%(+0.619)#3,057 |
| 63. | Weston | 0.92% | 0.29%(+0.626)#64 | 0.30%(+0.614)#3,073 |
| 64. | Carl Junction | 0.91% | 0.29%(+0.623)#65 | 0.30%(+0.611)#3,080 |
| 65. | Russellville | 0.91% | 0.29%(+0.621)#66 | 0.30%(+0.609)#3,085 |
| 66. | Boonville | 0.91% | 0.29%(+0.614)#67 | 0.30%(+0.602)#3,105 |
| 67. | Mount Moriah | 0.89% | 0.29%(+0.601)#68 | 0.30%(+0.589)#3,161 |
| 68. | Avondale | 0.87% | 0.29%(+0.582)#69 | 0.30%(+0.570)#3,221 |
| 69. | Wildwood | 0.85% | 0.29%(+0.558)#70 | 0.30%(+0.546)#3,299 |
| 70. | Brewer | 0.84% | 0.29%(+0.546)#71 | 0.30%(+0.534)#3,346 |
| 71. | Farley | 0.84% | 0.29%(+0.545)#72 | 0.30%(+0.533)#3,354 |
| 72. | Pevely | 0.83% | 0.29%(+0.539)#73 | 0.30%(+0.527)#3,375 |
| 73. | Claycomo | 0.83% | 0.29%(+0.534)#74 | 0.30%(+0.522)#3,395 |
| 74. | St Clair | 0.82% | 0.29%(+0.525)#75 | 0.30%(+0.513)#3,431 |
| 75. | Lake Tapawingo | 0.80% | 0.29%(+0.511)#76 | 0.30%(+0.499)#3,491 |
| 76. | Waynesville | 0.80% | 0.29%(+0.508)#77 | 0.30%(+0.496)#3,503 |
| 77. | Lowry City | 0.80% | 0.29%(+0.506)#78 | 0.30%(+0.494)#3,514 |
| 78. | Gasconade | 0.79% | 0.29%(+0.495)#79 | 0.30%(+0.483)#3,559 |
| 79. | Emma | 0.78% | 0.29%(+0.486)#80 | 0.30%(+0.474)#3,599 |
| 80. | New Franklin | 0.76% | 0.29%(+0.465)#81 | 0.30%(+0.453)#3,689 |
| 81. | Ash Grove | 0.74% | 0.29%(+0.450)#82 | 0.30%(+0.438)#3,741 |
| 82. | Jameson | 0.74% | 0.29%(+0.443)#83 | 0.30%(+0.431)#3,770 |
| 83. | Raytown | 0.73% | 0.29%(+0.440)#84 | 0.30%(+0.428)#3,779 |
| 84. | Barnett | 0.72% | 0.29%(+0.432)#85 | 0.30%(+0.420)#3,818 |
| 85. | Paris | 0.72% | 0.29%(+0.430)#86 | 0.30%(+0.418)#3,829 |
| 86. | Reeds Spring | 0.71% | 0.29%(+0.422)#87 | 0.30%(+0.410)#3,867 |
| 87. | Fremont Hills | 0.71% | 0.29%(+0.415)#88 | 0.30%(+0.403)#3,893 |
| 88. | Amsterdam | 0.68% | 0.29%(+0.393)#89 | 0.30%(+0.381)#4,000 |
| 89. | St Peters | 0.67% | 0.29%(+0.379)#90 | 0.30%(+0.366)#4,057 |
| 90. | New Florence | 0.67% | 0.29%(+0.374)#91 | 0.30%(+0.362)#4,074 |
| 91. | Manchester | 0.66% | 0.29%(+0.371)#92 | 0.30%(+0.359)#4,089 |
| 92. | St Martins | 0.66% | 0.29%(+0.367)#93 | 0.30%(+0.355)#4,114 |
| 93. | Branson | 0.66% | 0.29%(+0.364)#94 | 0.30%(+0.352)#4,125 |
| 94. | Bellflower | 0.66% | 0.29%(+0.363)#95 | 0.30%(+0.351)#4,129 |
| 95. | Saginaw | 0.66% | 0.29%(+0.363)#96 | 0.30%(+0.351)#4,130 |
| 96. | Hollister | 0.65% | 0.29%(+0.362)#97 | 0.30%(+0.350)#4,132 |
| 97. | Sunrise Beach | 0.65% | 0.29%(+0.356)#98 | 0.30%(+0.344)#4,168 |
| 98. | Homestead | 0.64% | 0.29%(+0.345)#99 | 0.30%(+0.333)#4,226 |
| 99. | Sweet Springs | 0.64% | 0.29%(+0.344)#100 | 0.30%(+0.332)#4,231 |
| 100. | Crestwood | 0.63% | 0.29%(+0.341)#101 | 0.30%(+0.329)#4,239 |
Common Questions
What are the Top 10 Cities with the Highest Percentage of Scandinavian Population in Missouri?
Top 10 Cities with the Highest Percentage of Scandinavian Population in Missouri are:
What city has the Highest Percentage of Scandinavian Population in Missouri?
Randolph has the Highest Percentage of Scandinavian Population in Missouri with 15.00%.
What is the Percentage of Scandinavian Population in the State of Missouri?
Percentage of Scandinavian Population in Missouri is 0.29%.
What is the Percentage of Scandinavian Population in the United States?
Percentage of Scandinavian Population in the United States is 0.30%.