Cities with the Highest Percentage of Scandinavian Population in West Virginia
RELATED REPORTS & OPTIONS
Scandinavian
West Virginia
Compare Cities
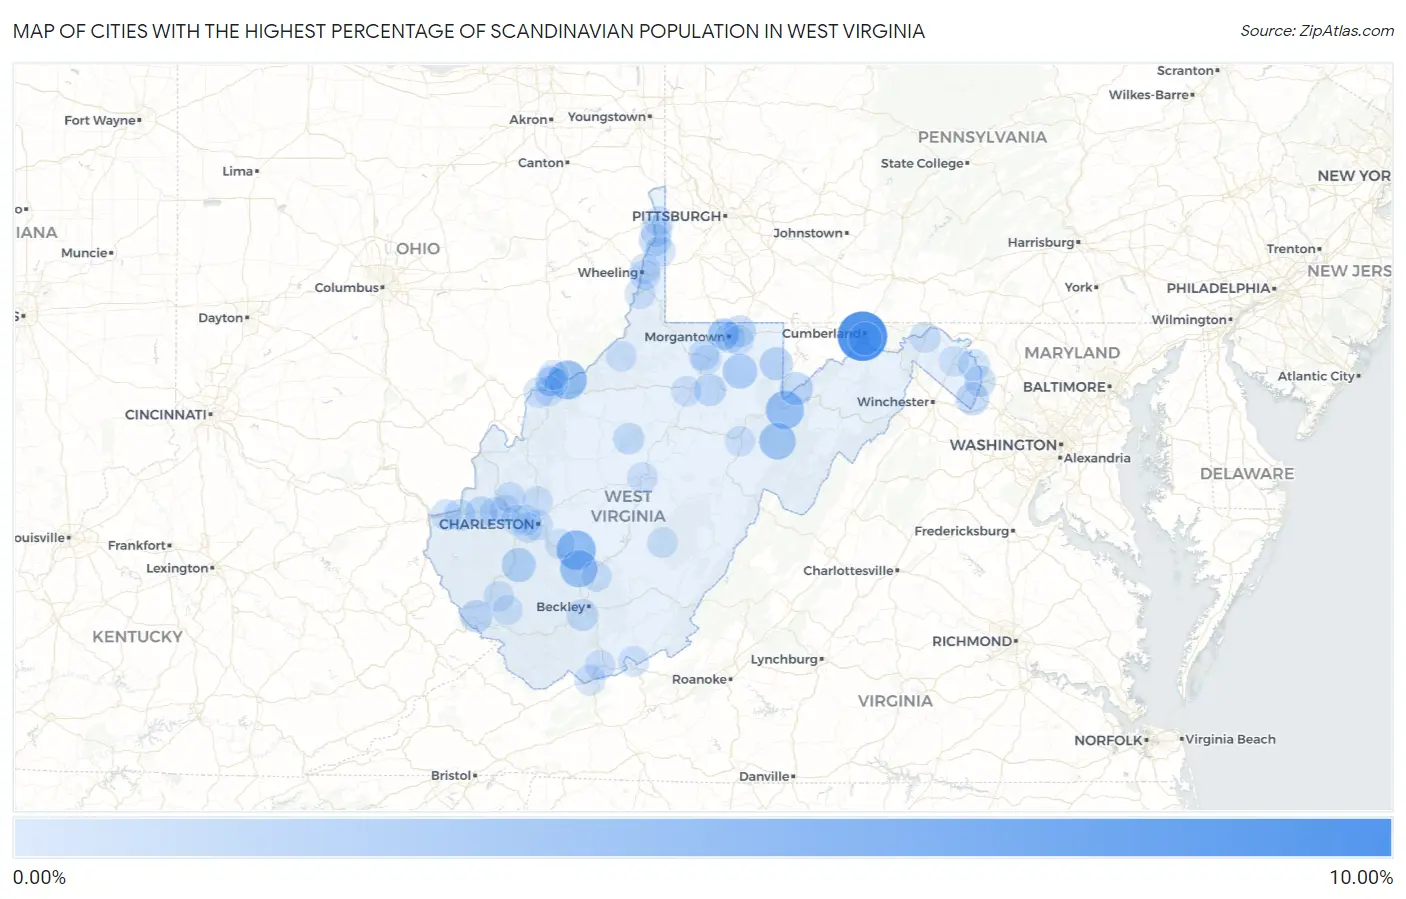
Map of Cities with the Highest Percentage of Scandinavian Population in West Virginia
0.00%
10.00%
Cities with the Highest Percentage of Scandinavian Population in West Virginia
| City | Scandinavian | vs State | vs National | |
| 1. | Carpendale | 9.63% | 0.19%(+9.44)#1 | 0.30%(+9.33)#119 |
| 2. | Arthurdale | 5.96% | 0.19%(+5.76)#2 | 0.30%(+5.65)#258 |
| 3. | Smithers | 4.42% | 0.19%(+4.22)#3 | 0.30%(+4.11)#410 |
| 4. | Waverly | 4.15% | 0.19%(+3.96)#4 | 0.30%(+3.85)#454 |
| 5. | Davis | 3.89% | 0.19%(+3.70)#5 | 0.30%(+3.59)#503 |
| 6. | Kincaid | 3.47% | 0.19%(+3.28)#6 | 0.30%(+3.17)#593 |
| 7. | Harman | 3.12% | 0.19%(+2.93)#7 | 0.30%(+2.82)#699 |
| 8. | Newburg | 2.11% | 0.19%(+1.92)#8 | 0.30%(+1.81)#1,230 |
| 9. | Madison | 1.81% | 0.19%(+1.61)#9 | 0.30%(+1.50)#1,485 |
| 10. | Bayard | 1.52% | 0.19%(+1.33)#10 | 0.30%(+1.22)#1,823 |
| 11. | Terra Alta | 1.52% | 0.19%(+1.33)#11 | 0.30%(+1.22)#1,829 |
| 12. | Wiley Ford | 1.50% | 0.19%(+1.31)#12 | 0.30%(+1.20)#1,854 |
| 13. | Shannondale | 1.34% | 0.19%(+1.14)#13 | 0.30%(+1.03)#2,104 |
| 14. | Delbarton | 1.12% | 0.19%(+0.924)#14 | 0.30%(+0.813)#2,560 |
| 15. | Flemington | 1.03% | 0.19%(+0.838)#15 | 0.30%(+0.727)#2,780 |
| 16. | Wellsburg | 0.96% | 0.19%(+0.770)#16 | 0.30%(+0.659)#2,948 |
| 17. | Milton | 0.94% | 0.19%(+0.744)#17 | 0.30%(+0.633)#3,024 |
| 18. | Sophia | 0.87% | 0.19%(+0.674)#18 | 0.30%(+0.563)#3,249 |
| 19. | Cheat Lake | 0.81% | 0.19%(+0.614)#19 | 0.30%(+0.503)#3,473 |
| 20. | Shepherdstown | 0.74% | 0.19%(+0.551)#20 | 0.30%(+0.440)#3,733 |
| 21. | Bolivar | 0.70% | 0.19%(+0.508)#21 | 0.30%(+0.397)#3,919 |
| 22. | Glenville | 0.68% | 0.19%(+0.489)#22 | 0.30%(+0.378)#4,005 |
| 23. | Pea Ridge | 0.67% | 0.19%(+0.475)#23 | 0.30%(+0.364)#4,067 |
| 24. | North Hills | 0.61% | 0.19%(+0.412)#24 | 0.30%(+0.301)#4,371 |
| 25. | Follansbee | 0.60% | 0.19%(+0.411)#25 | 0.30%(+0.300)#4,378 |
| 26. | Westover | 0.57% | 0.19%(+0.380)#26 | 0.30%(+0.269)#4,549 |
| 27. | Bethany | 0.53% | 0.19%(+0.340)#27 | 0.30%(+0.229)#4,774 |
| 28. | Granville | 0.51% | 0.19%(+0.312)#28 | 0.30%(+0.201)#4,949 |
| 29. | Huntington | 0.50% | 0.19%(+0.306)#29 | 0.30%(+0.195)#4,996 |
| 30. | Barrackville | 0.49% | 0.19%(+0.296)#30 | 0.30%(+0.185)#5,062 |
| 31. | Bath Berkeley Springs | 0.45% | 0.19%(+0.253)#31 | 0.30%(+0.142)#5,406 |
| 32. | Hurricane | 0.41% | 0.19%(+0.212)#32 | 0.30%(+0.101)#5,765 |
| 33. | Morgantown | 0.39% | 0.19%(+0.200)#33 | 0.30%(+0.089)#5,855 |
| 34. | Teays Valley | 0.38% | 0.19%(+0.183)#34 | 0.30%(+0.072)#6,032 |
| 35. | Bluefield | 0.37% | 0.19%(+0.181)#35 | 0.30%(+0.070)#6,059 |
| 36. | Moundsville | 0.37% | 0.19%(+0.179)#36 | 0.30%(+0.068)#6,081 |
| 37. | Winfield | 0.37% | 0.19%(+0.176)#37 | 0.30%(+0.065)#6,110 |
| 38. | Wheeling | 0.32% | 0.19%(+0.123)#38 | 0.30%(+0.012)#6,644 |
| 39. | Peterstown | 0.30% | 0.19%(+0.104)#39 | 0.30%(-0.007)#6,864 |
| 40. | Blennerhassett | 0.28% | 0.19%(+0.087)#40 | 0.30%(-0.024)#7,065 |
| 41. | Richwood | 0.27% | 0.19%(+0.079)#41 | 0.30%(-0.032)#7,156 |
| 42. | Bethlehem | 0.27% | 0.19%(+0.078)#42 | 0.30%(-0.033)#7,173 |
| 43. | Charleston | 0.26% | 0.19%(+0.067)#43 | 0.30%(-0.044)#7,335 |
| 44. | Oak Hill | 0.25% | 0.19%(+0.052)#44 | 0.30%(-0.059)#7,574 |
| 45. | Middlebourne | 0.24% | 0.19%(+0.048)#45 | 0.30%(-0.063)#7,641 |
| 46. | Sutton | 0.23% | 0.19%(+0.040)#46 | 0.30%(-0.071)#7,754 |
| 47. | Sissonville | 0.22% | 0.19%(+0.031)#47 | 0.30%(-0.080)#7,891 |
| 48. | Dunbar | 0.22% | 0.19%(+0.022)#48 | 0.30%(-0.089)#8,012 |
| 49. | South Charleston | 0.21% | 0.19%(+0.014)#49 | 0.30%(-0.097)#8,147 |
| 50. | Logan | 0.18% | 0.19%(-0.013)#50 | 0.30%(-0.124)#8,506 |
| 51. | Nutter Fort | 0.18% | 0.19%(-0.017)#51 | 0.30%(-0.128)#8,572 |
| 52. | Elkins | 0.17% | 0.19%(-0.020)#52 | 0.30%(-0.131)#8,620 |
| 53. | Princeton | 0.17% | 0.19%(-0.022)#53 | 0.30%(-0.133)#8,651 |
| 54. | Man | 0.17% | 0.19%(-0.025)#54 | 0.30%(-0.136)#8,695 |
| 55. | St Albans | 0.15% | 0.19%(-0.045)#55 | 0.30%(-0.156)#9,023 |
| 56. | Weirton | 0.13% | 0.19%(-0.067)#56 | 0.30%(-0.178)#9,319 |
| 57. | East Bank | 0.12% | 0.19%(-0.070)#57 | 0.30%(-0.181)#9,367 |
| 58. | Fairmont | 0.11% | 0.19%(-0.079)#58 | 0.30%(-0.190)#9,486 |
| 59. | Martinsburg | 0.11% | 0.19%(-0.081)#59 | 0.30%(-0.192)#9,508 |
| 60. | Parkersburg | 0.088% | 0.19%(-0.106)#60 | 0.30%(-0.217)#9,851 |
| 61. | Brookhaven | 0.077% | 0.19%(-0.116)#61 | 0.30%(-0.227)#9,983 |
| 62. | Vienna | 0.075% | 0.19%(-0.118)#62 | 0.30%(-0.229)#10,015 |
| 63. | Boaz | 0.071% | 0.19%(-0.122)#63 | 0.30%(-0.233)#10,063 |
Common Questions
What are the Top 10 Cities with the Highest Percentage of Scandinavian Population in West Virginia?
Top 10 Cities with the Highest Percentage of Scandinavian Population in West Virginia are:
#1
9.63%
#2
4.42%
#3
4.15%
#4
3.89%
#5
3.47%
#6
3.12%
#7
2.11%
#8
1.81%
#9
1.52%
#10
1.52%
What city has the Highest Percentage of Scandinavian Population in West Virginia?
Carpendale has the Highest Percentage of Scandinavian Population in West Virginia with 9.63%.
What is the Percentage of Scandinavian Population in the State of West Virginia?
Percentage of Scandinavian Population in West Virginia is 0.19%.
What is the Percentage of Scandinavian Population in the United States?
Percentage of Scandinavian Population in the United States is 0.30%.