Cities with the Highest Percentage of Scandinavian Population in Tennessee
RELATED REPORTS & OPTIONS
Scandinavian
Tennessee
Compare Cities
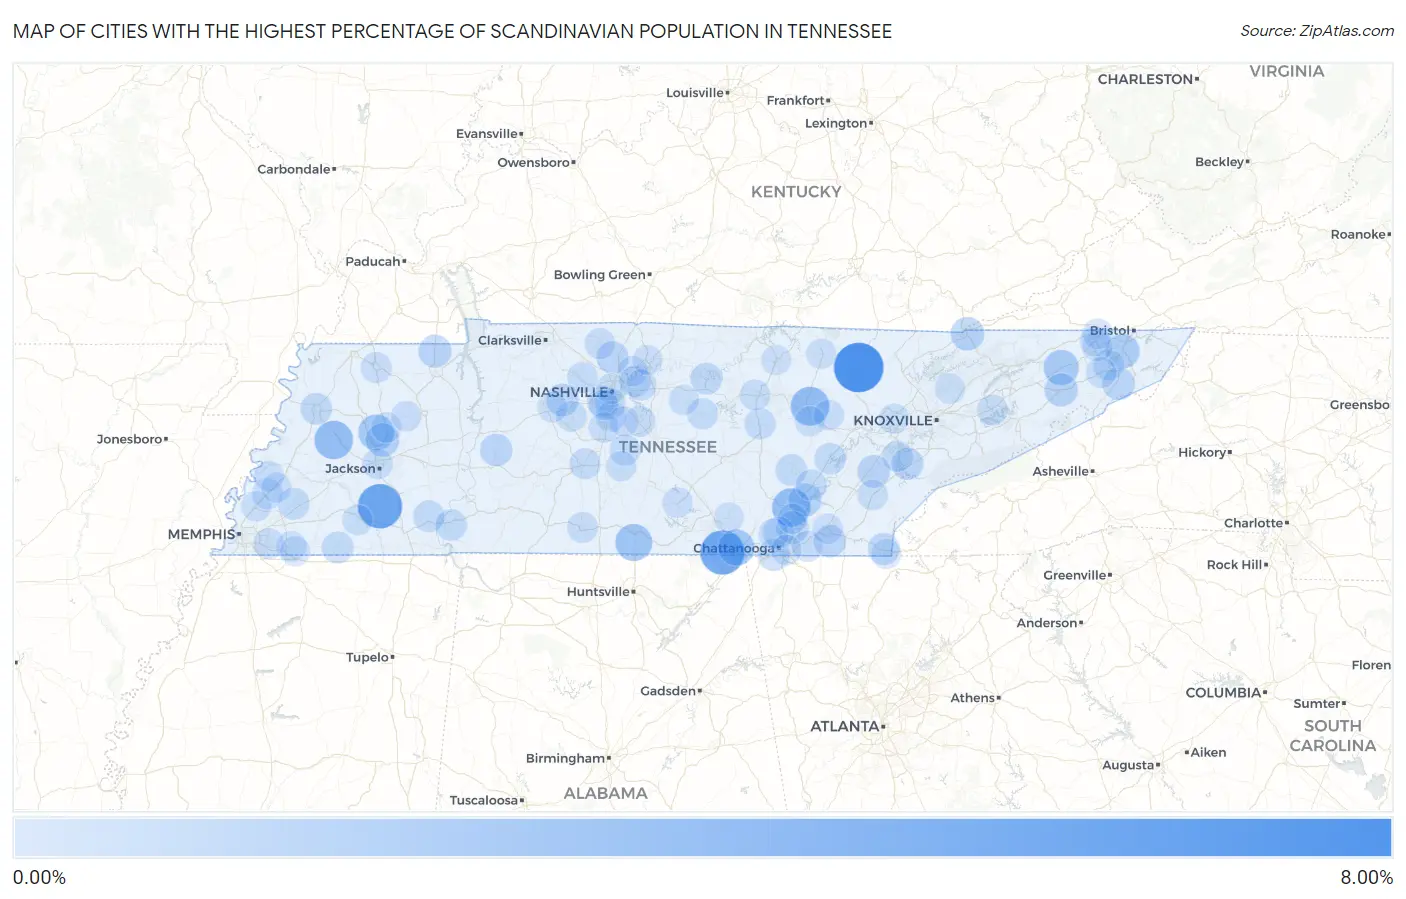
Map of Cities with the Highest Percentage of Scandinavian Population in Tennessee
0.00%
8.00%
Cities with the Highest Percentage of Scandinavian Population in Tennessee
| City | Scandinavian | vs State | vs National | |
| 1. | Elgin | 6.37% | 0.22%(+6.15)#1 | 0.30%(+6.07)#236 |
| 2. | Silerton | 4.71% | 0.22%(+4.48)#2 | 0.30%(+4.40)#369 |
| 3. | Orme | 4.65% | 0.22%(+4.43)#3 | 0.30%(+4.35)#378 |
| 4. | Bowman | 2.92% | 0.22%(+2.70)#4 | 0.30%(+2.62)#772 |
| 5. | Maury City | 2.84% | 0.22%(+2.62)#5 | 0.30%(+2.54)#802 |
| 6. | Flat Top Mountain | 2.81% | 0.22%(+2.58)#6 | 0.30%(+2.50)#826 |
| 7. | Park City | 2.30% | 0.22%(+2.08)#7 | 0.30%(+2.00)#1,075 |
| 8. | Kimball | 2.09% | 0.22%(+1.86)#8 | 0.30%(+1.78)#1,251 |
| 9. | Gibson | 1.99% | 0.22%(+1.76)#9 | 0.30%(+1.68)#1,322 |
| 10. | Rarity Bay | 1.91% | 0.22%(+1.68)#10 | 0.30%(+1.60)#1,394 |
| 11. | Baileyton | 1.80% | 0.22%(+1.58)#11 | 0.30%(+1.50)#1,490 |
| 12. | Bluff City | 1.55% | 0.22%(+1.32)#12 | 0.30%(+1.24)#1,793 |
| 13. | Karns | 1.51% | 0.22%(+1.28)#13 | 0.30%(+1.20)#1,850 |
| 14. | Medina | 1.27% | 0.22%(+1.04)#14 | 0.30%(+0.965)#2,229 |
| 15. | Harrogate | 1.24% | 0.22%(+1.01)#15 | 0.30%(+0.931)#2,312 |
| 16. | Sale Creek | 1.21% | 0.22%(+0.983)#16 | 0.30%(+0.903)#2,368 |
| 17. | Greeneville | 1.18% | 0.22%(+0.953)#17 | 0.30%(+0.873)#2,425 |
| 18. | Fowlkes | 1.11% | 0.22%(+0.890)#18 | 0.30%(+0.811)#2,566 |
| 19. | Puryear | 1.10% | 0.22%(+0.873)#19 | 0.30%(+0.793)#2,615 |
| 20. | Sweetwater | 1.03% | 0.22%(+0.806)#20 | 0.30%(+0.726)#2,784 |
| 21. | Middle Valley | 0.98% | 0.22%(+0.757)#21 | 0.30%(+0.677)#2,907 |
| 22. | White Bluff | 0.98% | 0.22%(+0.755)#22 | 0.30%(+0.675)#2,910 |
| 23. | Lobelville | 0.95% | 0.22%(+0.724)#23 | 0.30%(+0.644)#2,984 |
| 24. | Unicoi | 0.92% | 0.22%(+0.696)#24 | 0.30%(+0.616)#3,069 |
| 25. | Wildwood Lake | 0.90% | 0.22%(+0.680)#25 | 0.30%(+0.600)#3,112 |
| 26. | Ridgetop | 0.88% | 0.22%(+0.659)#26 | 0.30%(+0.580)#3,187 |
| 27. | Greenback | 0.82% | 0.22%(+0.591)#27 | 0.30%(+0.511)#3,442 |
| 28. | Powell | 0.81% | 0.22%(+0.590)#28 | 0.30%(+0.511)#3,444 |
| 29. | Ducktown | 0.78% | 0.22%(+0.558)#29 | 0.30%(+0.478)#3,578 |
| 30. | Lookout Mountain | 0.75% | 0.22%(+0.527)#30 | 0.30%(+0.448)#3,702 |
| 31. | Dyersburg | 0.75% | 0.22%(+0.524)#31 | 0.30%(+0.444)#3,721 |
| 32. | Carthage | 0.73% | 0.22%(+0.509)#32 | 0.30%(+0.429)#3,773 |
| 33. | Pikeville | 0.71% | 0.22%(+0.484)#33 | 0.30%(+0.404)#3,891 |
| 34. | Grand Junction | 0.70% | 0.22%(+0.473)#34 | 0.30%(+0.393)#3,945 |
| 35. | Adamsville | 0.69% | 0.22%(+0.461)#35 | 0.30%(+0.381)#3,995 |
| 36. | Olivet | 0.68% | 0.22%(+0.461)#36 | 0.30%(+0.381)#3,997 |
| 37. | Braden | 0.68% | 0.22%(+0.458)#37 | 0.30%(+0.378)#4,006 |
| 38. | Spring City | 0.65% | 0.22%(+0.429)#38 | 0.30%(+0.350)#4,133 |
| 39. | Walden | 0.61% | 0.22%(+0.386)#39 | 0.30%(+0.306)#4,346 |
| 40. | Belle Meade | 0.58% | 0.22%(+0.355)#40 | 0.30%(+0.275)#4,512 |
| 41. | Sparta | 0.57% | 0.22%(+0.341)#41 | 0.30%(+0.261)#4,588 |
| 42. | Dayton | 0.56% | 0.22%(+0.336)#42 | 0.30%(+0.256)#4,616 |
| 43. | Columbia | 0.53% | 0.22%(+0.303)#43 | 0.30%(+0.223)#4,809 |
| 44. | Liberty | 0.53% | 0.22%(+0.302)#44 | 0.30%(+0.222)#4,815 |
| 45. | Johnson City | 0.52% | 0.22%(+0.295)#45 | 0.30%(+0.215)#4,859 |
| 46. | Tellico Village | 0.51% | 0.22%(+0.290)#46 | 0.30%(+0.210)#4,890 |
| 47. | Eagleville | 0.51% | 0.22%(+0.285)#47 | 0.30%(+0.205)#4,928 |
| 48. | Fairview | 0.50% | 0.22%(+0.280)#48 | 0.30%(+0.200)#4,962 |
| 49. | Springfield | 0.50% | 0.22%(+0.276)#49 | 0.30%(+0.196)#4,987 |
| 50. | Hampton | 0.49% | 0.22%(+0.269)#50 | 0.30%(+0.189)#5,036 |
| 51. | Martin | 0.49% | 0.22%(+0.265)#51 | 0.30%(+0.185)#5,060 |
| 52. | Green Hill | 0.49% | 0.22%(+0.263)#52 | 0.30%(+0.183)#5,075 |
| 53. | Germantown | 0.49% | 0.22%(+0.262)#53 | 0.30%(+0.182)#5,083 |
| 54. | Pulaski | 0.47% | 0.22%(+0.245)#54 | 0.30%(+0.166)#5,210 |
| 55. | Biltmore | 0.47% | 0.22%(+0.245)#55 | 0.30%(+0.165)#5,212 |
| 56. | Smyrna | 0.47% | 0.22%(+0.242)#56 | 0.30%(+0.163)#5,235 |
| 57. | Collegedale | 0.46% | 0.22%(+0.239)#57 | 0.30%(+0.159)#5,255 |
| 58. | Mount Juliet | 0.46% | 0.22%(+0.239)#58 | 0.30%(+0.159)#5,260 |
| 59. | Ashland City | 0.46% | 0.22%(+0.236)#59 | 0.30%(+0.156)#5,286 |
| 60. | Dandridge | 0.45% | 0.22%(+0.223)#60 | 0.30%(+0.143)#5,388 |
| 61. | Cookeville | 0.45% | 0.22%(+0.222)#61 | 0.30%(+0.142)#5,402 |
| 62. | Jonesborough | 0.44% | 0.22%(+0.217)#62 | 0.30%(+0.137)#5,441 |
| 63. | Oak Hill | 0.44% | 0.22%(+0.216)#63 | 0.30%(+0.136)#5,446 |
| 64. | Jackson | 0.41% | 0.22%(+0.187)#64 | 0.30%(+0.107)#5,710 |
| 65. | Cleveland | 0.40% | 0.22%(+0.176)#65 | 0.30%(+0.096)#5,807 |
| 66. | Atoka | 0.40% | 0.22%(+0.173)#66 | 0.30%(+0.093)#5,829 |
| 67. | Fairfield Glade | 0.39% | 0.22%(+0.164)#67 | 0.30%(+0.085)#5,902 |
| 68. | Hendersonville | 0.38% | 0.22%(+0.151)#68 | 0.30%(+0.071)#6,048 |
| 69. | Bolivar | 0.37% | 0.22%(+0.141)#69 | 0.30%(+0.061)#6,147 |
| 70. | Tullahoma | 0.36% | 0.22%(+0.140)#70 | 0.30%(+0.060)#6,156 |
| 71. | Englewood | 0.36% | 0.22%(+0.140)#71 | 0.30%(+0.060)#6,157 |
| 72. | Brentwood | 0.36% | 0.22%(+0.137)#72 | 0.30%(+0.057)#6,188 |
| 73. | Signal Mountain | 0.35% | 0.22%(+0.127)#73 | 0.30%(+0.047)#6,283 |
| 74. | Franklin | 0.35% | 0.22%(+0.121)#74 | 0.30%(+0.041)#6,346 |
| 75. | Milan | 0.34% | 0.22%(+0.119)#75 | 0.30%(+0.039)#6,379 |
| 76. | Colonial Heights | 0.34% | 0.22%(+0.113)#76 | 0.30%(+0.033)#6,430 |
| 77. | Bloomingdale | 0.34% | 0.22%(+0.111)#77 | 0.30%(+0.031)#6,451 |
| 78. | Mclemoresville | 0.33% | 0.22%(+0.108)#78 | 0.30%(+0.028)#6,483 |
| 79. | Nashville | 0.33% | 0.22%(+0.106)#79 | 0.30%(+0.026)#6,503 |
| 80. | Ridgeside | 0.33% | 0.22%(+0.102)#80 | 0.30%(+0.022)#6,545 |
| 81. | Millington | 0.31% | 0.22%(+0.088)#81 | 0.30%(+0.008)#6,674 |
| 82. | Burlison | 0.31% | 0.22%(+0.087)#82 | 0.30%(+0.007)#6,685 |
| 83. | Chapel Hill | 0.31% | 0.22%(+0.083)#83 | 0.30%(+0.003)#6,728 |
| 84. | Watertown | 0.31% | 0.22%(+0.081)#84 | 0.30%(+0.001)#6,758 |
| 85. | Tracy City | 0.30% | 0.22%(+0.074)#85 | 0.30%(-0.006)#6,847 |
| 86. | Piperton | 0.30% | 0.22%(+0.073)#86 | 0.30%(-0.006)#6,854 |
| 87. | Plainview | 0.30% | 0.22%(+0.073)#87 | 0.30%(-0.007)#6,868 |
| 88. | Burns | 0.29% | 0.22%(+0.069)#88 | 0.30%(-0.011)#6,904 |
| 89. | Oak Ridge | 0.29% | 0.22%(+0.067)#89 | 0.30%(-0.013)#6,929 |
| 90. | Jamestown | 0.28% | 0.22%(+0.058)#90 | 0.30%(-0.022)#7,041 |
| 91. | Brighton | 0.28% | 0.22%(+0.054)#91 | 0.30%(-0.026)#7,083 |
| 92. | Crossville | 0.27% | 0.22%(+0.048)#92 | 0.30%(-0.032)#7,153 |
| 93. | Soddy Daisy | 0.27% | 0.22%(+0.043)#93 | 0.30%(-0.037)#7,234 |
| 94. | Forest Hills | 0.26% | 0.22%(+0.040)#94 | 0.30%(-0.040)#7,272 |
| 95. | Gallatin | 0.26% | 0.22%(+0.038)#95 | 0.30%(-0.042)#7,298 |
| 96. | Kingsport | 0.26% | 0.22%(+0.037)#96 | 0.30%(-0.043)#7,314 |
| 97. | Nolensville | 0.26% | 0.22%(+0.032)#97 | 0.30%(-0.048)#7,404 |
| 98. | Livingston | 0.26% | 0.22%(+0.031)#98 | 0.30%(-0.049)#7,419 |
| 99. | Rossville | 0.25% | 0.22%(+0.029)#99 | 0.30%(-0.051)#7,457 |
| 100. | Copperhill | 0.25% | 0.22%(+0.025)#100 | 0.30%(-0.055)#7,506 |
Common Questions
What are the Top 10 Cities with the Highest Percentage of Scandinavian Population in Tennessee?
Top 10 Cities with the Highest Percentage of Scandinavian Population in Tennessee are:
#1
6.37%
#2
4.71%
#3
4.65%
#4
2.92%
#5
2.84%
#6
2.81%
#7
2.30%
#8
2.09%
#9
1.99%
#10
1.80%
What city has the Highest Percentage of Scandinavian Population in Tennessee?
Elgin has the Highest Percentage of Scandinavian Population in Tennessee with 6.37%.
What is the Percentage of Scandinavian Population in the State of Tennessee?
Percentage of Scandinavian Population in Tennessee is 0.22%.
What is the Percentage of Scandinavian Population in the United States?
Percentage of Scandinavian Population in the United States is 0.30%.