Cities with the Highest Percentage of Scandinavian Population in North Carolina
RELATED REPORTS & OPTIONS
Scandinavian
North Carolina
Compare Cities
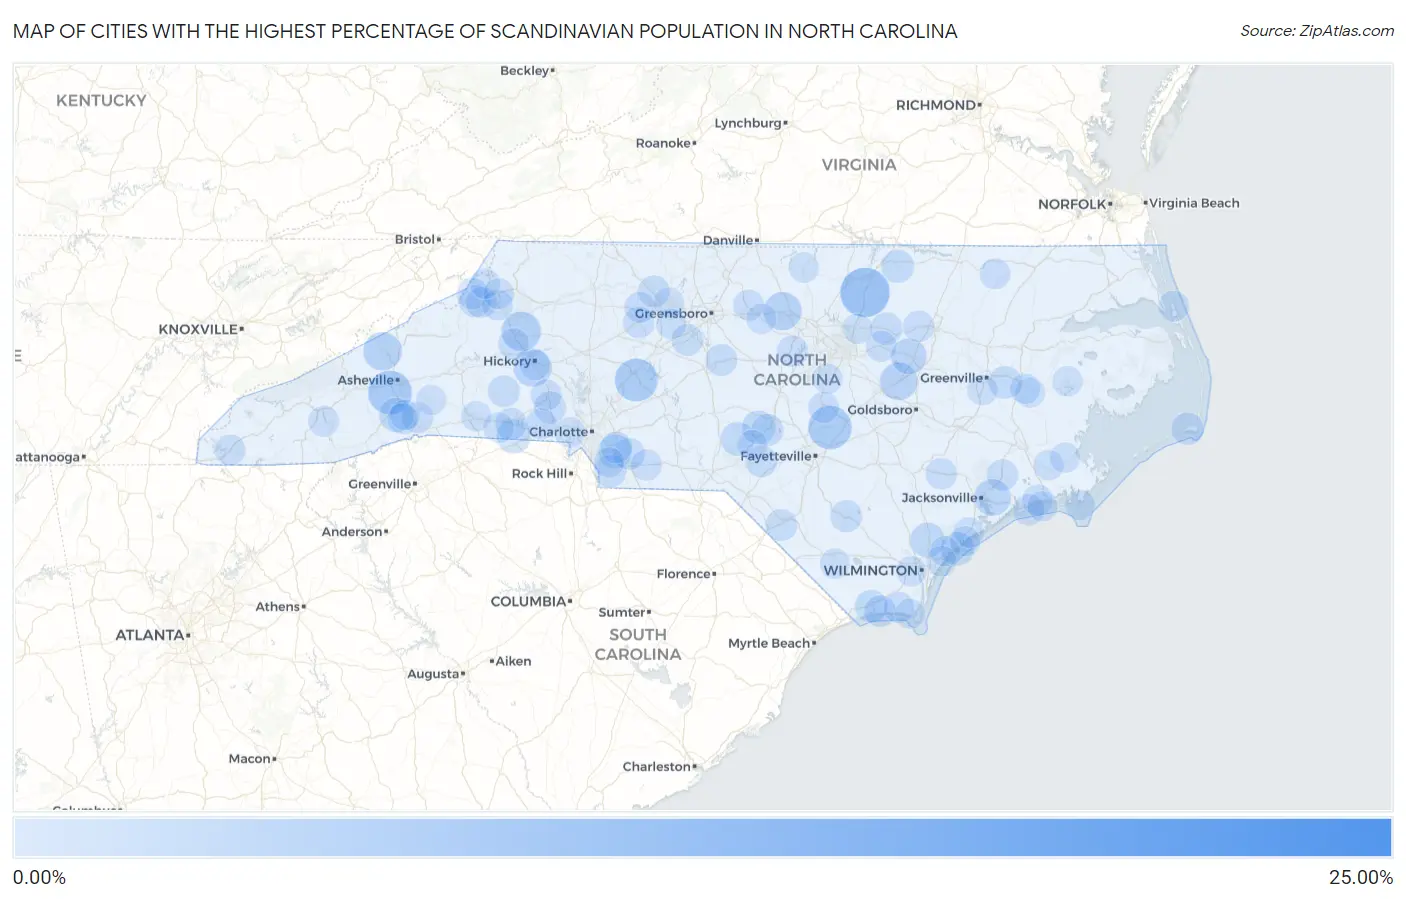
Map of Cities with the Highest Percentage of Scandinavian Population in North Carolina
0.00%
25.00%
Cities with the Highest Percentage of Scandinavian Population in North Carolina
| City | Scandinavian | vs State | vs National | |
| 1. | Glenwood | 22.14% | 0.21%(+21.9)#1 | 0.30%(+21.8)#28 |
| 2. | Kittrell | 7.89% | 0.21%(+7.69)#2 | 0.30%(+7.59)#170 |
| 3. | Bent Creek | 5.66% | 0.21%(+5.46)#3 | 0.30%(+5.36)#279 |
| 4. | Linden | 5.56% | 0.21%(+5.35)#4 | 0.30%(+5.25)#287 |
| 5. | Faith | 5.29% | 0.21%(+5.08)#5 | 0.30%(+4.99)#315 |
| 6. | Cedar Rock | 3.91% | 0.21%(+3.70)#6 | 0.30%(+3.61)#498 |
| 7. | Marshall | 3.57% | 0.21%(+3.36)#7 | 0.30%(+3.27)#570 |
| 8. | Efland | 3.52% | 0.21%(+3.31)#8 | 0.30%(+3.21)#584 |
| 9. | Mountain View | 3.40% | 0.21%(+3.19)#9 | 0.30%(+3.10)#613 |
| 10. | Kenly | 3.28% | 0.21%(+3.08)#10 | 0.30%(+2.98)#643 |
| 11. | Piney Green | 2.86% | 0.21%(+2.65)#11 | 0.30%(+2.55)#792 |
| 12. | Sims | 2.46% | 0.21%(+2.25)#12 | 0.30%(+2.16)#982 |
| 13. | Briar Chapel | 2.23% | 0.21%(+2.02)#13 | 0.30%(+1.93)#1,127 |
| 14. | Rocky Point | 2.13% | 0.21%(+1.92)#14 | 0.30%(+1.82)#1,207 |
| 15. | Horse Shoe | 2.00% | 0.21%(+1.79)#15 | 0.30%(+1.69)#1,317 |
| 16. | Earl | 1.96% | 0.21%(+1.75)#16 | 0.30%(+1.65)#1,355 |
| 17. | Lake Park | 1.89% | 0.21%(+1.68)#17 | 0.30%(+1.58)#1,412 |
| 18. | Foxfire | 1.76% | 0.21%(+1.55)#18 | 0.30%(+1.46)#1,537 |
| 19. | Whispering Pines | 1.72% | 0.21%(+1.51)#19 | 0.30%(+1.42)#1,584 |
| 20. | Topsail Beach | 1.70% | 0.21%(+1.49)#20 | 0.30%(+1.39)#1,612 |
| 21. | Warrenton | 1.50% | 0.21%(+1.29)#21 | 0.30%(+1.20)#1,861 |
| 22. | Shallotte | 1.40% | 0.21%(+1.19)#22 | 0.30%(+1.10)#1,993 |
| 23. | Grimesland | 1.36% | 0.21%(+1.15)#23 | 0.30%(+1.05)#2,051 |
| 24. | Mineral Springs | 1.26% | 0.21%(+1.05)#24 | 0.30%(+0.952)#2,256 |
| 25. | Bunn | 1.26% | 0.21%(+1.05)#25 | 0.30%(+0.951)#2,261 |
| 26. | Frisco | 1.21% | 0.21%(+1.01)#26 | 0.30%(+0.910)#2,353 |
| 27. | High Shoals | 1.19% | 0.21%(+0.976)#27 | 0.30%(+0.881)#2,412 |
| 28. | Vass | 1.18% | 0.21%(+0.967)#28 | 0.30%(+0.871)#2,434 |
| 29. | Banner Elk | 1.13% | 0.21%(+0.926)#29 | 0.30%(+0.830)#2,516 |
| 30. | Franklinville | 1.04% | 0.21%(+0.835)#30 | 0.30%(+0.740)#2,737 |
| 31. | Shelby | 1.04% | 0.21%(+0.832)#31 | 0.30%(+0.737)#2,750 |
| 32. | Mcdonald | 1.03% | 0.21%(+0.822)#32 | 0.30%(+0.727)#2,783 |
| 33. | Elizabethtown | 1.03% | 0.21%(+0.820)#33 | 0.30%(+0.725)#2,787 |
| 34. | Casar | 1.02% | 0.21%(+0.814)#34 | 0.30%(+0.719)#2,799 |
| 35. | Holden Beach | 1.00% | 0.21%(+0.794)#35 | 0.30%(+0.699)#2,846 |
| 36. | Unionville | 0.99% | 0.21%(+0.777)#36 | 0.30%(+0.682)#2,894 |
| 37. | Rural Hall | 0.98% | 0.21%(+0.769)#37 | 0.30%(+0.673)#2,915 |
| 38. | Trinity | 0.97% | 0.21%(+0.761)#38 | 0.30%(+0.665)#2,931 |
| 39. | Five Points | 0.97% | 0.21%(+0.760)#39 | 0.30%(+0.664)#2,936 |
| 40. | Maysville | 0.90% | 0.21%(+0.687)#40 | 0.30%(+0.592)#3,151 |
| 41. | Hemby Bridge | 0.88% | 0.21%(+0.675)#41 | 0.30%(+0.579)#3,190 |
| 42. | Bermuda Run | 0.87% | 0.21%(+0.657)#42 | 0.30%(+0.562)#3,252 |
| 43. | Cypress Landing | 0.86% | 0.21%(+0.647)#43 | 0.30%(+0.551)#3,279 |
| 44. | Dana | 0.85% | 0.21%(+0.645)#44 | 0.30%(+0.550)#3,289 |
| 45. | Nashville | 0.85% | 0.21%(+0.645)#45 | 0.30%(+0.549)#3,291 |
| 46. | Beulaville | 0.83% | 0.21%(+0.625)#46 | 0.30%(+0.530)#3,368 |
| 47. | Marshville | 0.82% | 0.21%(+0.610)#47 | 0.30%(+0.514)#3,425 |
| 48. | Fearrington Village | 0.81% | 0.21%(+0.605)#48 | 0.30%(+0.509)#3,447 |
| 49. | Emerald Isle | 0.80% | 0.21%(+0.592)#49 | 0.30%(+0.497)#3,500 |
| 50. | Zebulon | 0.77% | 0.21%(+0.559)#50 | 0.30%(+0.464)#3,649 |
| 51. | Beech Mountain | 0.75% | 0.21%(+0.543)#51 | 0.30%(+0.448)#3,704 |
| 52. | Lincolnton | 0.72% | 0.21%(+0.513)#52 | 0.30%(+0.417)#3,832 |
| 53. | Bessemer City | 0.71% | 0.21%(+0.504)#53 | 0.30%(+0.408)#3,877 |
| 54. | Seven Devils | 0.71% | 0.21%(+0.502)#54 | 0.30%(+0.407)#3,884 |
| 55. | Lewisville | 0.71% | 0.21%(+0.502)#55 | 0.30%(+0.406)#3,887 |
| 56. | Lillington | 0.70% | 0.21%(+0.492)#56 | 0.30%(+0.397)#3,924 |
| 57. | Governors Club | 0.70% | 0.21%(+0.492)#57 | 0.30%(+0.396)#3,928 |
| 58. | Cajah S Mountain | 0.70% | 0.21%(+0.491)#58 | 0.30%(+0.396)#3,931 |
| 59. | Oak Island | 0.69% | 0.21%(+0.480)#59 | 0.30%(+0.385)#3,978 |
| 60. | Blowing Rock | 0.67% | 0.21%(+0.458)#60 | 0.30%(+0.362)#4,073 |
| 61. | Glen Raven | 0.65% | 0.21%(+0.438)#61 | 0.30%(+0.343)#4,174 |
| 62. | Murphy | 0.65% | 0.21%(+0.437)#62 | 0.30%(+0.341)#4,180 |
| 63. | Laurel Park | 0.61% | 0.21%(+0.403)#63 | 0.30%(+0.308)#4,333 |
| 64. | Spout Springs | 0.61% | 0.21%(+0.398)#64 | 0.30%(+0.302)#4,363 |
| 65. | Broad Creek | 0.60% | 0.21%(+0.387)#65 | 0.30%(+0.292)#4,423 |
| 66. | Boone | 0.58% | 0.21%(+0.375)#66 | 0.30%(+0.279)#4,494 |
| 67. | Forest Hills | 0.58% | 0.21%(+0.373)#67 | 0.30%(+0.277)#4,504 |
| 68. | Lasker | 0.58% | 0.21%(+0.373)#68 | 0.30%(+0.277)#4,505 |
| 69. | Southern Shores | 0.58% | 0.21%(+0.372)#69 | 0.30%(+0.277)#4,509 |
| 70. | Boiling Springs | 0.54% | 0.21%(+0.332)#70 | 0.30%(+0.237)#4,730 |
| 71. | Belmont | 0.54% | 0.21%(+0.330)#71 | 0.30%(+0.235)#4,743 |
| 72. | Walkertown | 0.53% | 0.21%(+0.317)#72 | 0.30%(+0.221)#4,816 |
| 73. | Balfour | 0.53% | 0.21%(+0.317)#73 | 0.30%(+0.221)#4,818 |
| 74. | Holly Ridge | 0.52% | 0.21%(+0.311)#74 | 0.30%(+0.215)#4,857 |
| 75. | Wallburg | 0.52% | 0.21%(+0.311)#75 | 0.30%(+0.215)#4,858 |
| 76. | Winterville | 0.50% | 0.21%(+0.296)#76 | 0.30%(+0.200)#4,961 |
| 77. | Forest City | 0.48% | 0.21%(+0.267)#77 | 0.30%(+0.171)#5,167 |
| 78. | Porters Neck | 0.46% | 0.21%(+0.252)#78 | 0.30%(+0.156)#5,284 |
| 79. | Brookford | 0.46% | 0.21%(+0.251)#79 | 0.30%(+0.155)#5,293 |
| 80. | Chimney Rock Village | 0.45% | 0.21%(+0.246)#80 | 0.30%(+0.150)#5,325 |
| 81. | Pantego | 0.45% | 0.21%(+0.245)#81 | 0.30%(+0.149)#5,336 |
| 82. | Harkers Island | 0.45% | 0.21%(+0.244)#82 | 0.30%(+0.149)#5,338 |
| 83. | Swepsonville | 0.45% | 0.21%(+0.238)#83 | 0.30%(+0.142)#5,392 |
| 84. | Fuquay Varina | 0.45% | 0.21%(+0.237)#84 | 0.30%(+0.142)#5,404 |
| 85. | Wesley Chapel | 0.45% | 0.21%(+0.236)#85 | 0.30%(+0.141)#5,413 |
| 86. | Indian Beach | 0.44% | 0.21%(+0.236)#86 | 0.30%(+0.140)#5,418 |
| 87. | Cove Creek | 0.44% | 0.21%(+0.234)#87 | 0.30%(+0.139)#5,425 |
| 88. | Surf City | 0.44% | 0.21%(+0.228)#88 | 0.30%(+0.133)#5,478 |
| 89. | Hampstead | 0.43% | 0.21%(+0.223)#89 | 0.30%(+0.127)#5,531 |
| 90. | River Road | 0.43% | 0.21%(+0.219)#90 | 0.30%(+0.123)#5,568 |
| 91. | Washington Park | 0.42% | 0.21%(+0.212)#91 | 0.30%(+0.117)#5,625 |
| 92. | Roxboro | 0.42% | 0.21%(+0.209)#92 | 0.30%(+0.114)#5,651 |
| 93. | Aberdeen | 0.42% | 0.21%(+0.206)#93 | 0.30%(+0.111)#5,674 |
| 94. | Oriental | 0.41% | 0.21%(+0.204)#94 | 0.30%(+0.109)#5,693 |
| 95. | Minnesott Beach | 0.41% | 0.21%(+0.203)#95 | 0.30%(+0.107)#5,713 |
| 96. | Grandy | 0.41% | 0.21%(+0.201)#96 | 0.30%(+0.106)#5,724 |
| 97. | Caswell Beach | 0.41% | 0.21%(+0.200)#97 | 0.30%(+0.105)#5,735 |
| 98. | Brunswick | 0.41% | 0.21%(+0.197)#98 | 0.30%(+0.101)#5,762 |
| 99. | Leland | 0.40% | 0.21%(+0.192)#99 | 0.30%(+0.096)#5,805 |
| 100. | Wake Forest | 0.40% | 0.21%(+0.189)#100 | 0.30%(+0.093)#5,828 |
Common Questions
What are the Top 10 Cities with the Highest Percentage of Scandinavian Population in North Carolina?
Top 10 Cities with the Highest Percentage of Scandinavian Population in North Carolina are:
#1
7.89%
#2
5.66%
#3
5.56%
#4
5.29%
#5
3.91%
#6
3.57%
#7
3.52%
#8
3.40%
#9
3.28%
#10
2.86%
What city has the Highest Percentage of Scandinavian Population in North Carolina?
Kittrell has the Highest Percentage of Scandinavian Population in North Carolina with 7.89%.
What is the Percentage of Scandinavian Population in the State of North Carolina?
Percentage of Scandinavian Population in North Carolina is 0.21%.
What is the Percentage of Scandinavian Population in the United States?
Percentage of Scandinavian Population in the United States is 0.30%.