Cities with the Highest Percentage of Scandinavian Population in Kansas
RELATED REPORTS & OPTIONS
Scandinavian
Kansas
Compare Cities
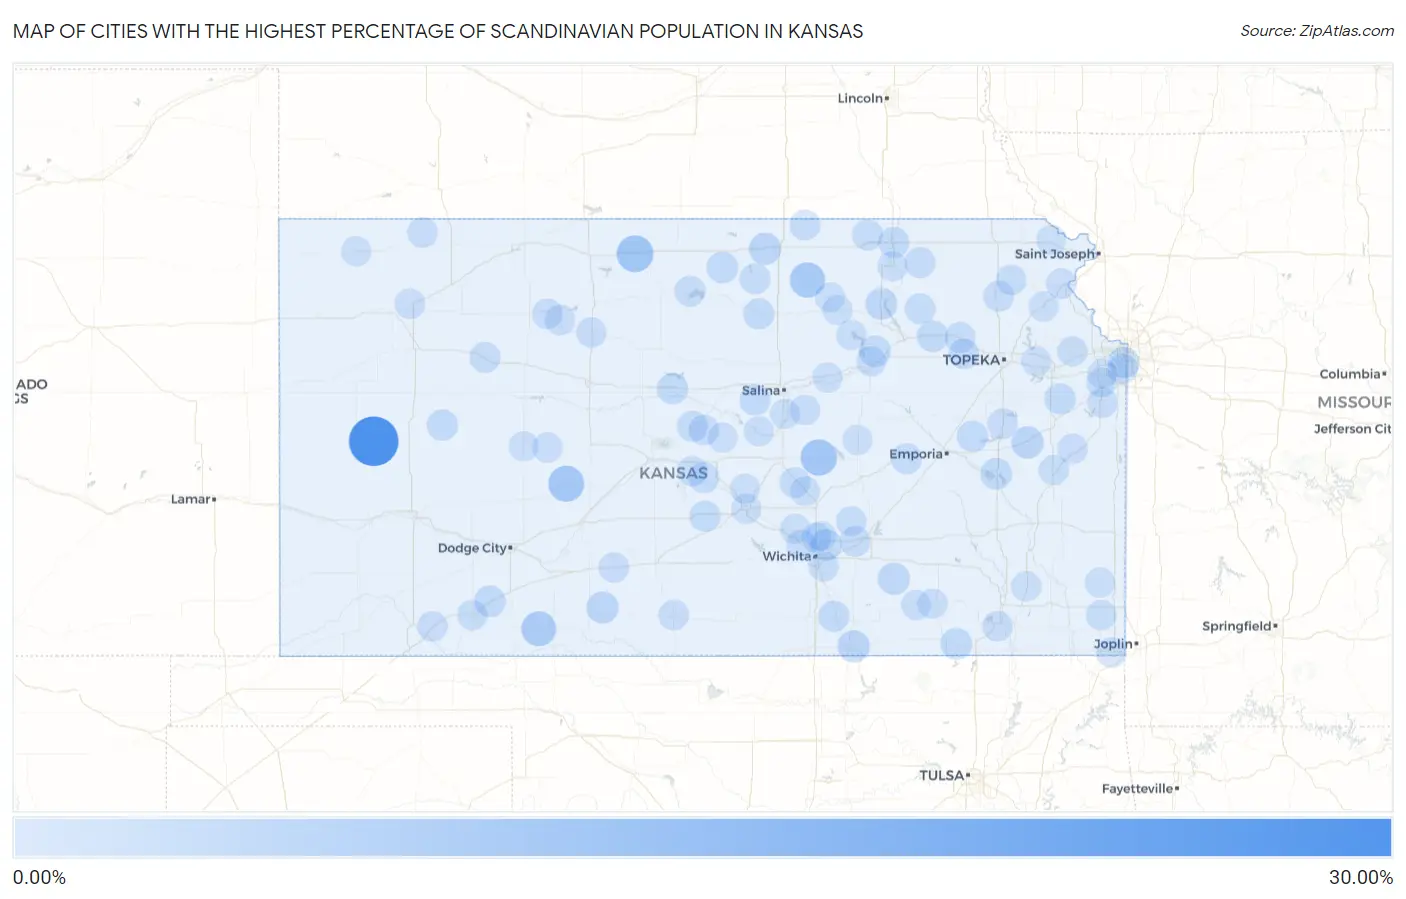
Map of Cities with the Highest Percentage of Scandinavian Population in Kansas
0.00%
30.00%
Cities with the Highest Percentage of Scandinavian Population in Kansas
| City | Scandinavian | vs State | vs National | |
| 1. | Marienthal | 27.91% | 0.32%(+27.6)#1 | 0.30%(+27.6)#17 |
| 2. | Radley | 11.61% | 0.32%(+11.3)#2 | 0.30%(+11.3)#91 |
| 3. | Athol | 9.38% | 0.32%(+9.06)#3 | 0.30%(+9.07)#124 |
| 4. | Lehigh | 8.67% | 0.32%(+8.36)#4 | 0.30%(+8.37)#142 |
| 5. | Burdett | 8.33% | 0.32%(+8.02)#5 | 0.30%(+8.03)#154 |
| 6. | Rock | 8.25% | 0.32%(+7.93)#6 | 0.30%(+7.94)#157 |
| 7. | Clyde | 7.42% | 0.32%(+7.11)#7 | 0.30%(+7.12)#184 |
| 8. | Ashland | 6.86% | 0.32%(+6.54)#8 | 0.30%(+6.55)#203 |
| 9. | Williamsburg | 3.26% | 0.32%(+2.95)#9 | 0.30%(+2.96)#658 |
| 10. | Parkerfield | 3.19% | 0.32%(+2.88)#10 | 0.30%(+2.89)#677 |
| 11. | Scandia | 3.19% | 0.32%(+2.87)#11 | 0.30%(+2.88)#678 |
| 12. | Wilmore | 3.03% | 0.32%(+2.71)#12 | 0.30%(+2.73)#731 |
| 13. | Latham | 2.94% | 0.32%(+2.63)#13 | 0.30%(+2.64)#765 |
| 14. | Randolph | 2.75% | 0.32%(+2.43)#14 | 0.30%(+2.44)#853 |
| 15. | Peru | 2.47% | 0.32%(+2.15)#15 | 0.30%(+2.16)#979 |
| 16. | Jewell | 2.43% | 0.32%(+2.12)#16 | 0.30%(+2.13)#1,003 |
| 17. | Fort Riley | 2.42% | 0.32%(+2.11)#17 | 0.30%(+2.12)#1,007 |
| 18. | New Strawn | 2.35% | 0.32%(+2.04)#18 | 0.30%(+2.05)#1,039 |
| 19. | Fairway | 2.28% | 0.32%(+1.97)#19 | 0.30%(+1.98)#1,091 |
| 20. | Wamego | 2.12% | 0.32%(+1.81)#20 | 0.30%(+1.82)#1,216 |
| 21. | Bel Aire | 2.12% | 0.32%(+1.81)#21 | 0.30%(+1.82)#1,219 |
| 22. | Fowler | 2.09% | 0.32%(+1.77)#22 | 0.30%(+1.78)#1,248 |
| 23. | Baldwin City | 1.96% | 0.32%(+1.65)#23 | 0.30%(+1.66)#1,349 |
| 24. | Dorrance | 1.95% | 0.32%(+1.64)#24 | 0.30%(+1.65)#1,361 |
| 25. | Reading | 1.91% | 0.32%(+1.60)#25 | 0.30%(+1.61)#1,388 |
| 26. | Healy | 1.91% | 0.32%(+1.59)#26 | 0.30%(+1.60)#1,392 |
| 27. | Glasco | 1.75% | 0.32%(+1.44)#27 | 0.30%(+1.45)#1,547 |
| 28. | Plevna | 1.75% | 0.32%(+1.44)#28 | 0.30%(+1.45)#1,549 |
| 29. | Brookville | 1.63% | 0.32%(+1.32)#29 | 0.30%(+1.33)#1,690 |
| 30. | Marysville | 1.61% | 0.32%(+1.30)#30 | 0.30%(+1.31)#1,722 |
| 31. | Oxford | 1.60% | 0.32%(+1.29)#31 | 0.30%(+1.30)#1,732 |
| 32. | Frankfort | 1.59% | 0.32%(+1.27)#32 | 0.30%(+1.29)#1,749 |
| 33. | Cottonwood Falls | 1.58% | 0.32%(+1.26)#33 | 0.30%(+1.27)#1,766 |
| 34. | Alden | 1.57% | 0.32%(+1.26)#34 | 0.30%(+1.27)#1,769 |
| 35. | Hanover | 1.45% | 0.32%(+1.13)#35 | 0.30%(+1.14)#1,923 |
| 36. | Holyrood | 1.44% | 0.32%(+1.13)#36 | 0.30%(+1.14)#1,930 |
| 37. | Quinter | 1.44% | 0.32%(+1.13)#37 | 0.30%(+1.14)#1,931 |
| 38. | St Marys | 1.43% | 0.32%(+1.11)#38 | 0.30%(+1.12)#1,951 |
| 39. | Cawker City | 1.41% | 0.32%(+1.10)#39 | 0.30%(+1.11)#1,976 |
| 40. | Jamestown | 1.36% | 0.32%(+1.04)#40 | 0.30%(+1.05)#2,055 |
| 41. | Moundridge | 1.35% | 0.32%(+1.03)#41 | 0.30%(+1.04)#2,072 |
| 42. | Holton | 1.30% | 0.32%(+0.984)#42 | 0.30%(+0.995)#2,172 |
| 43. | Towanda | 1.26% | 0.32%(+0.940)#43 | 0.30%(+0.951)#2,259 |
| 44. | Westmoreland | 1.25% | 0.32%(+0.932)#44 | 0.30%(+0.944)#2,279 |
| 45. | Maple Hill | 1.22% | 0.32%(+0.908)#45 | 0.30%(+0.919)#2,329 |
| 46. | Narka | 1.16% | 0.32%(+0.847)#46 | 0.30%(+0.858)#2,457 |
| 47. | Damar | 1.14% | 0.32%(+0.821)#47 | 0.30%(+0.832)#2,511 |
| 48. | Bogue | 1.14% | 0.32%(+0.821)#48 | 0.30%(+0.832)#2,512 |
| 49. | Lorraine | 1.13% | 0.32%(+0.814)#49 | 0.30%(+0.826)#2,531 |
| 50. | Kismet | 1.05% | 0.32%(+0.737)#50 | 0.30%(+0.748)#2,719 |
| 51. | Meade | 1.04% | 0.32%(+0.723)#51 | 0.30%(+0.734)#2,758 |
| 52. | Prairie Village | 1.03% | 0.32%(+0.718)#52 | 0.30%(+0.730)#2,770 |
| 53. | Atchison | 1.03% | 0.32%(+0.718)#53 | 0.30%(+0.729)#2,772 |
| 54. | Medicine Lodge | 1.02% | 0.32%(+0.701)#54 | 0.30%(+0.712)#2,815 |
| 55. | Independence | 0.99% | 0.32%(+0.678)#55 | 0.30%(+0.689)#2,873 |
| 56. | Haviland | 0.98% | 0.32%(+0.669)#56 | 0.30%(+0.680)#2,897 |
| 57. | Maize | 0.97% | 0.32%(+0.656)#57 | 0.30%(+0.668)#2,928 |
| 58. | Raymond | 0.92% | 0.32%(+0.602)#58 | 0.30%(+0.613)#3,076 |
| 59. | Gypsum | 0.89% | 0.32%(+0.577)#59 | 0.30%(+0.589)#3,158 |
| 60. | Gem | 0.88% | 0.32%(+0.569)#60 | 0.30%(+0.581)#3,185 |
| 61. | Lane | 0.88% | 0.32%(+0.565)#61 | 0.30%(+0.577)#3,196 |
| 62. | Herndon | 0.85% | 0.32%(+0.539)#62 | 0.30%(+0.550)#3,285 |
| 63. | Plainville | 0.85% | 0.32%(+0.531)#63 | 0.30%(+0.543)#3,315 |
| 64. | Spring Hill | 0.81% | 0.32%(+0.494)#64 | 0.30%(+0.505)#3,468 |
| 65. | Scammon | 0.80% | 0.32%(+0.487)#65 | 0.30%(+0.498)#3,497 |
| 66. | Baxter Springs | 0.79% | 0.32%(+0.479)#66 | 0.30%(+0.490)#3,530 |
| 67. | Lyndon | 0.78% | 0.32%(+0.468)#67 | 0.30%(+0.479)#3,576 |
| 68. | Whiting | 0.78% | 0.32%(+0.463)#68 | 0.30%(+0.474)#3,598 |
| 69. | Garnett | 0.75% | 0.32%(+0.430)#69 | 0.30%(+0.441)#3,731 |
| 70. | Potwin | 0.70% | 0.32%(+0.385)#70 | 0.30%(+0.396)#3,927 |
| 71. | Tonganoxie | 0.69% | 0.32%(+0.377)#71 | 0.30%(+0.389)#3,962 |
| 72. | Mcconnell Afb | 0.69% | 0.32%(+0.373)#72 | 0.30%(+0.385)#3,977 |
| 73. | Bazine | 0.68% | 0.32%(+0.369)#73 | 0.30%(+0.381)#3,998 |
| 74. | Girard | 0.68% | 0.32%(+0.366)#74 | 0.30%(+0.378)#4,008 |
| 75. | Thayer | 0.68% | 0.32%(+0.363)#75 | 0.30%(+0.374)#4,021 |
| 76. | Bentley | 0.66% | 0.32%(+0.348)#76 | 0.30%(+0.359)#4,087 |
| 77. | Blue Rapids | 0.65% | 0.32%(+0.335)#77 | 0.30%(+0.346)#4,154 |
| 78. | Kechi | 0.64% | 0.32%(+0.329)#78 | 0.30%(+0.340)#4,186 |
| 79. | Nortonville | 0.63% | 0.32%(+0.314)#79 | 0.30%(+0.325)#4,254 |
| 80. | Wakefield | 0.60% | 0.32%(+0.287)#80 | 0.30%(+0.299)#4,386 |
| 81. | South Hutchinson | 0.60% | 0.32%(+0.287)#81 | 0.30%(+0.299)#4,388 |
| 82. | Moline | 0.60% | 0.32%(+0.283)#82 | 0.30%(+0.294)#4,408 |
| 83. | The Highlands | 0.58% | 0.32%(+0.266)#83 | 0.30%(+0.277)#4,503 |
| 84. | Junction City | 0.58% | 0.32%(+0.261)#84 | 0.30%(+0.272)#4,531 |
| 85. | Marquette | 0.57% | 0.32%(+0.253)#85 | 0.30%(+0.265)#4,572 |
| 86. | Highland | 0.54% | 0.32%(+0.227)#86 | 0.30%(+0.238)#4,722 |
| 87. | Grenola | 0.54% | 0.32%(+0.225)#87 | 0.30%(+0.236)#4,735 |
| 88. | Abilene | 0.54% | 0.32%(+0.224)#88 | 0.30%(+0.235)#4,740 |
| 89. | Lincolnville | 0.54% | 0.32%(+0.222)#89 | 0.30%(+0.233)#4,752 |
| 90. | Mcdonald | 0.52% | 0.32%(+0.205)#90 | 0.30%(+0.217)#4,847 |
| 91. | Clay Center | 0.51% | 0.32%(+0.190)#91 | 0.30%(+0.201)#4,951 |
| 92. | Morganville | 0.50% | 0.32%(+0.184)#92 | 0.30%(+0.196)#4,993 |
| 93. | Assaria | 0.49% | 0.32%(+0.175)#93 | 0.30%(+0.186)#5,059 |
| 94. | Ness City | 0.48% | 0.32%(+0.167)#94 | 0.30%(+0.178)#5,110 |
| 95. | Lenexa | 0.47% | 0.32%(+0.159)#95 | 0.30%(+0.170)#5,178 |
| 96. | Olathe | 0.47% | 0.32%(+0.152)#96 | 0.30%(+0.164)#5,226 |
| 97. | Park City | 0.47% | 0.32%(+0.152)#97 | 0.30%(+0.163)#5,230 |
| 98. | Geneseo | 0.47% | 0.32%(+0.152)#98 | 0.30%(+0.163)#5,233 |
| 99. | Lecompton | 0.46% | 0.32%(+0.147)#99 | 0.30%(+0.159)#5,262 |
| 100. | Hesston | 0.46% | 0.32%(+0.143)#100 | 0.30%(+0.155)#5,297 |
Common Questions
What are the Top 10 Cities with the Highest Percentage of Scandinavian Population in Kansas?
Top 10 Cities with the Highest Percentage of Scandinavian Population in Kansas are:
#1
27.91%
#2
9.38%
#3
8.67%
#4
8.33%
#5
7.42%
#6
6.86%
#7
3.26%
#8
3.19%
#9
3.19%
#10
3.03%
What city has the Highest Percentage of Scandinavian Population in Kansas?
Marienthal has the Highest Percentage of Scandinavian Population in Kansas with 27.91%.
What is the Percentage of Scandinavian Population in the State of Kansas?
Percentage of Scandinavian Population in Kansas is 0.32%.
What is the Percentage of Scandinavian Population in the United States?
Percentage of Scandinavian Population in the United States is 0.30%.