Cities with the Highest Percentage of French Canadian Population in Texas
RELATED REPORTS & OPTIONS
French Canadian
Texas
Compare Cities
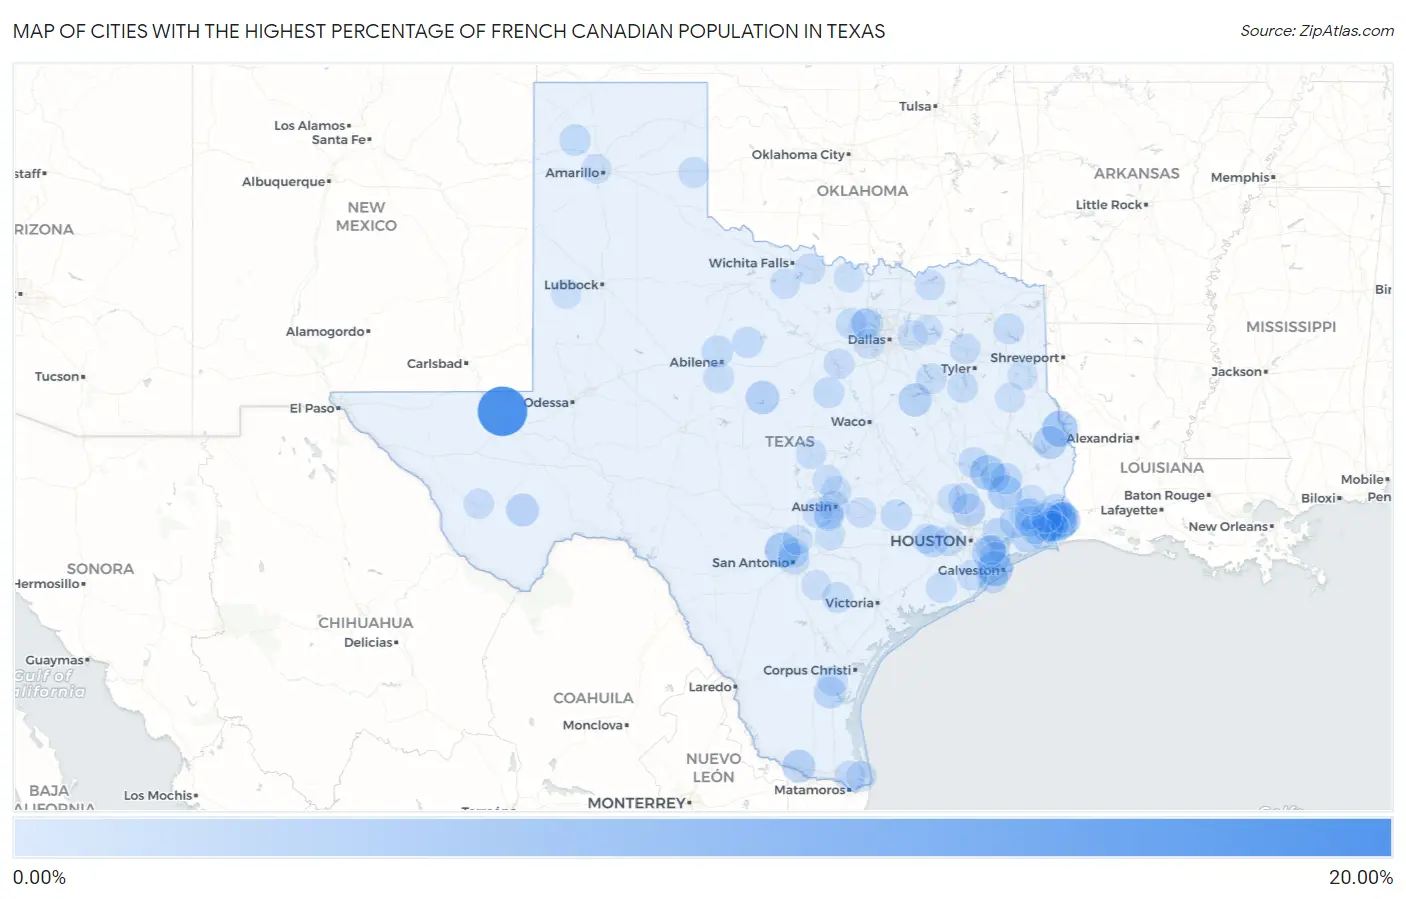
Map of Cities with the Highest Percentage of French Canadian Population in Texas
0.00%
20.00%
Cities with the Highest Percentage of French Canadian Population in Texas
| City | French Canadian | vs State | vs National | |
| 1. | Mentone | 20.00% | 0.21%(+19.8)#1 | 0.54%(+19.5)#58 |
| 2. | Neches | 9.14% | 0.21%(+8.93)#2 | 0.54%(+8.60)#305 |
| 3. | Milam | 6.32% | 0.21%(+6.10)#3 | 0.54%(+5.77)#550 |
| 4. | Bridge City | 6.26% | 0.21%(+6.04)#4 | 0.54%(+5.71)#561 |
| 5. | West Orange | 5.66% | 0.21%(+5.45)#5 | 0.54%(+5.12)#633 |
| 6. | Bayou Vista | 5.58% | 0.21%(+5.37)#6 | 0.54%(+5.04)#646 |
| 7. | Grey Forest | 5.50% | 0.21%(+5.29)#7 | 0.54%(+4.96)#654 |
| 8. | Cedar Point | 5.32% | 0.21%(+5.10)#8 | 0.54%(+4.77)#691 |
| 9. | Gause | 5.22% | 0.21%(+5.00)#9 | 0.54%(+4.67)#707 |
| 10. | Big Thicket Lake Estates | 4.71% | 0.21%(+4.49)#10 | 0.54%(+4.16)#800 |
| 11. | El Lago | 4.24% | 0.21%(+4.03)#11 | 0.54%(+3.70)#910 |
| 12. | Thunderbird Bay | 3.92% | 0.21%(+3.70)#12 | 0.54%(+3.37)#1,015 |
| 13. | Streetman | 3.67% | 0.21%(+3.46)#13 | 0.54%(+3.13)#1,078 |
| 14. | Perezville | 3.63% | 0.21%(+3.41)#14 | 0.54%(+3.08)#1,090 |
| 15. | Pineland | 3.61% | 0.21%(+3.39)#15 | 0.54%(+3.06)#1,097 |
| 16. | Marathon | 3.27% | 0.21%(+3.06)#16 | 0.54%(+2.73)#1,203 |
| 17. | Woodloch | 3.27% | 0.21%(+3.06)#17 | 0.54%(+2.72)#1,205 |
| 18. | Central Gardens | 3.25% | 0.21%(+3.04)#18 | 0.54%(+2.71)#1,212 |
| 19. | Belterra | 3.20% | 0.21%(+2.99)#19 | 0.54%(+2.66)#1,230 |
| 20. | Winnie | 2.81% | 0.21%(+2.60)#20 | 0.54%(+2.27)#1,404 |
| 21. | Mauriceville | 2.77% | 0.21%(+2.55)#21 | 0.54%(+2.22)#1,429 |
| 22. | New Ulm | 2.75% | 0.21%(+2.53)#22 | 0.54%(+2.20)#1,440 |
| 23. | Brazos Country | 2.58% | 0.21%(+2.37)#23 | 0.54%(+2.04)#1,539 |
| 24. | Nederland | 2.58% | 0.21%(+2.37)#24 | 0.54%(+2.04)#1,544 |
| 25. | Ricardo | 2.56% | 0.21%(+2.35)#25 | 0.54%(+2.02)#1,557 |
| 26. | Mont Belvieu | 2.48% | 0.21%(+2.27)#26 | 0.54%(+1.93)#1,621 |
| 27. | Orange | 2.19% | 0.21%(+1.98)#27 | 0.54%(+1.65)#1,845 |
| 28. | Indian Springs | 2.19% | 0.21%(+1.97)#28 | 0.54%(+1.64)#1,850 |
| 29. | Alamo Heights | 2.17% | 0.21%(+1.96)#29 | 0.54%(+1.63)#1,866 |
| 30. | Hawley | 2.07% | 0.21%(+1.86)#30 | 0.54%(+1.53)#1,942 |
| 31. | Sour Lake | 2.06% | 0.21%(+1.85)#31 | 0.54%(+1.52)#1,950 |
| 32. | Channing | 2.05% | 0.21%(+1.84)#32 | 0.54%(+1.50)#1,965 |
| 33. | Groves | 1.99% | 0.21%(+1.77)#33 | 0.54%(+1.44)#2,016 |
| 34. | Plum | 1.94% | 0.21%(+1.73)#34 | 0.54%(+1.40)#2,066 |
| 35. | Jamaica Beach | 1.90% | 0.21%(+1.69)#35 | 0.54%(+1.36)#2,102 |
| 36. | Taylor Landing | 1.78% | 0.21%(+1.57)#36 | 0.54%(+1.23)#2,248 |
| 37. | Albany | 1.76% | 0.21%(+1.55)#37 | 0.54%(+1.22)#2,263 |
| 38. | Carmine | 1.73% | 0.21%(+1.52)#38 | 0.54%(+1.19)#2,308 |
| 39. | Iredell | 1.72% | 0.21%(+1.51)#39 | 0.54%(+1.18)#2,320 |
| 40. | Devers | 1.71% | 0.21%(+1.49)#40 | 0.54%(+1.16)#2,344 |
| 41. | Newark | 1.70% | 0.21%(+1.49)#41 | 0.54%(+1.16)#2,347 |
| 42. | Pinewood Estates | 1.70% | 0.21%(+1.48)#42 | 0.54%(+1.15)#2,354 |
| 43. | Stockton Bend | 1.69% | 0.21%(+1.48)#43 | 0.54%(+1.14)#2,370 |
| 44. | Trophy Club | 1.68% | 0.21%(+1.46)#44 | 0.54%(+1.13)#2,385 |
| 45. | San Leon | 1.59% | 0.21%(+1.38)#45 | 0.54%(+1.05)#2,490 |
| 46. | Westwood Shores | 1.56% | 0.21%(+1.35)#46 | 0.54%(+1.02)#2,535 |
| 47. | Panorama Village | 1.55% | 0.21%(+1.34)#47 | 0.54%(+1.01)#2,553 |
| 48. | Sargent | 1.53% | 0.21%(+1.32)#48 | 0.54%(+0.988)#2,582 |
| 49. | Pinehurst | 1.52% | 0.21%(+1.31)#49 | 0.54%(+0.975)#2,599 |
| 50. | Lone Star | 1.51% | 0.21%(+1.30)#50 | 0.54%(+0.968)#2,619 |
| 51. | Shamrock | 1.50% | 0.21%(+1.29)#51 | 0.54%(+0.956)#2,636 |
| 52. | Port Neches | 1.49% | 0.21%(+1.28)#52 | 0.54%(+0.944)#2,653 |
| 53. | Frankston | 1.48% | 0.21%(+1.27)#53 | 0.54%(+0.938)#2,658 |
| 54. | China | 1.47% | 0.21%(+1.25)#54 | 0.54%(+0.923)#2,680 |
| 55. | Indian Lake | 1.46% | 0.21%(+1.25)#55 | 0.54%(+0.918)#2,687 |
| 56. | Tuscola | 1.43% | 0.21%(+1.22)#56 | 0.54%(+0.890)#2,730 |
| 57. | Fannett | 1.38% | 0.21%(+1.17)#57 | 0.54%(+0.835)#2,823 |
| 58. | Star Harbor | 1.38% | 0.21%(+1.17)#58 | 0.54%(+0.833)#2,826 |
| 59. | Van Vleck | 1.33% | 0.21%(+1.12)#59 | 0.54%(+0.790)#2,903 |
| 60. | Runge | 1.33% | 0.21%(+1.12)#60 | 0.54%(+0.788)#2,908 |
| 61. | Henrietta | 1.32% | 0.21%(+1.10)#61 | 0.54%(+0.772)#2,942 |
| 62. | Mineola | 1.31% | 0.21%(+1.10)#62 | 0.54%(+0.767)#2,956 |
| 63. | Danbury | 1.30% | 0.21%(+1.08)#63 | 0.54%(+0.752)#2,989 |
| 64. | Rollingwood | 1.25% | 0.21%(+1.04)#64 | 0.54%(+0.710)#3,090 |
| 65. | Rose City | 1.20% | 0.21%(+0.988)#65 | 0.54%(+0.657)#3,210 |
| 66. | Lampasas | 1.14% | 0.21%(+0.926)#66 | 0.54%(+0.594)#3,367 |
| 67. | Dodd City | 1.10% | 0.21%(+0.888)#67 | 0.54%(+0.557)#3,463 |
| 68. | Hamshire | 1.08% | 0.21%(+0.871)#68 | 0.54%(+0.540)#3,514 |
| 69. | Laguna Vista | 1.04% | 0.21%(+0.828)#69 | 0.54%(+0.496)#3,630 |
| 70. | Decordova | 1.02% | 0.21%(+0.808)#70 | 0.54%(+0.477)#3,682 |
| 71. | Dripping Springs | 0.98% | 0.21%(+0.770)#71 | 0.54%(+0.438)#3,801 |
| 72. | Marfa | 0.98% | 0.21%(+0.768)#72 | 0.54%(+0.436)#3,810 |
| 73. | Bishop | 0.98% | 0.21%(+0.767)#73 | 0.54%(+0.436)#3,811 |
| 74. | Roanoke | 0.97% | 0.21%(+0.759)#74 | 0.54%(+0.428)#3,839 |
| 75. | Camp Swift | 0.94% | 0.21%(+0.728)#75 | 0.54%(+0.396)#3,938 |
| 76. | Brushy Creek | 0.91% | 0.21%(+0.694)#76 | 0.54%(+0.362)#4,047 |
| 77. | Archer City | 0.90% | 0.21%(+0.691)#77 | 0.54%(+0.359)#4,055 |
| 78. | St Jo | 0.88% | 0.21%(+0.672)#78 | 0.54%(+0.340)#4,126 |
| 79. | Poth | 0.88% | 0.21%(+0.665)#79 | 0.54%(+0.333)#4,163 |
| 80. | Hill Country Village | 0.87% | 0.21%(+0.660)#80 | 0.54%(+0.328)#4,186 |
| 81. | Sundown | 0.87% | 0.21%(+0.659)#81 | 0.54%(+0.327)#4,192 |
| 82. | Shady Hollow | 0.87% | 0.21%(+0.655)#82 | 0.54%(+0.323)#4,207 |
| 83. | Montgomery | 0.86% | 0.21%(+0.651)#83 | 0.54%(+0.320)#4,229 |
| 84. | Mclendon Chisholm | 0.85% | 0.21%(+0.639)#84 | 0.54%(+0.308)#4,272 |
| 85. | Sienna | 0.85% | 0.21%(+0.638)#85 | 0.54%(+0.306)#4,279 |
| 86. | Martindale | 0.84% | 0.21%(+0.626)#86 | 0.54%(+0.295)#4,321 |
| 87. | Kountze | 0.83% | 0.21%(+0.620)#87 | 0.54%(+0.288)#4,351 |
| 88. | Pantego | 0.83% | 0.21%(+0.617)#88 | 0.54%(+0.286)#4,367 |
| 89. | Bishop Hills | 0.83% | 0.21%(+0.614)#89 | 0.54%(+0.282)#4,386 |
| 90. | Mount Enterprise | 0.82% | 0.21%(+0.610)#90 | 0.54%(+0.279)#4,400 |
| 91. | Livingston | 0.81% | 0.21%(+0.598)#91 | 0.54%(+0.267)#4,458 |
| 92. | Sealy | 0.80% | 0.21%(+0.592)#92 | 0.54%(+0.260)#4,483 |
| 93. | Bulverde | 0.79% | 0.21%(+0.576)#93 | 0.54%(+0.245)#4,548 |
| 94. | Liberty Hill | 0.78% | 0.21%(+0.566)#94 | 0.54%(+0.234)#4,585 |
| 95. | Little Cypress | 0.78% | 0.21%(+0.564)#95 | 0.54%(+0.232)#4,592 |
| 96. | Shoreacres | 0.75% | 0.21%(+0.541)#96 | 0.54%(+0.210)#4,704 |
| 97. | Cinco Ranch | 0.75% | 0.21%(+0.540)#97 | 0.54%(+0.209)#4,708 |
| 98. | Quinlan | 0.75% | 0.21%(+0.535)#98 | 0.54%(+0.204)#4,741 |
| 99. | Beckville | 0.74% | 0.21%(+0.527)#99 | 0.54%(+0.195)#4,784 |
| 100. | Hays | 0.72% | 0.21%(+0.512)#100 | 0.54%(+0.180)#4,867 |
Common Questions
What are the Top 10 Cities with the Highest Percentage of French Canadian Population in Texas?
Top 10 Cities with the Highest Percentage of French Canadian Population in Texas are:
#1
20.00%
#2
6.32%
#3
6.26%
#4
5.66%
#5
5.58%
#6
5.50%
#7
5.32%
#8
4.71%
#9
4.24%
#10
3.92%
What city has the Highest Percentage of French Canadian Population in Texas?
Mentone has the Highest Percentage of French Canadian Population in Texas with 20.00%.
What is the Percentage of French Canadian Population in the State of Texas?
Percentage of French Canadian Population in Texas is 0.21%.
What is the Percentage of French Canadian Population in the United States?
Percentage of French Canadian Population in the United States is 0.54%.