Cities with the Highest Percentage of French Canadian Population in Vermont
RELATED REPORTS & OPTIONS
French Canadian
Vermont
Compare Cities
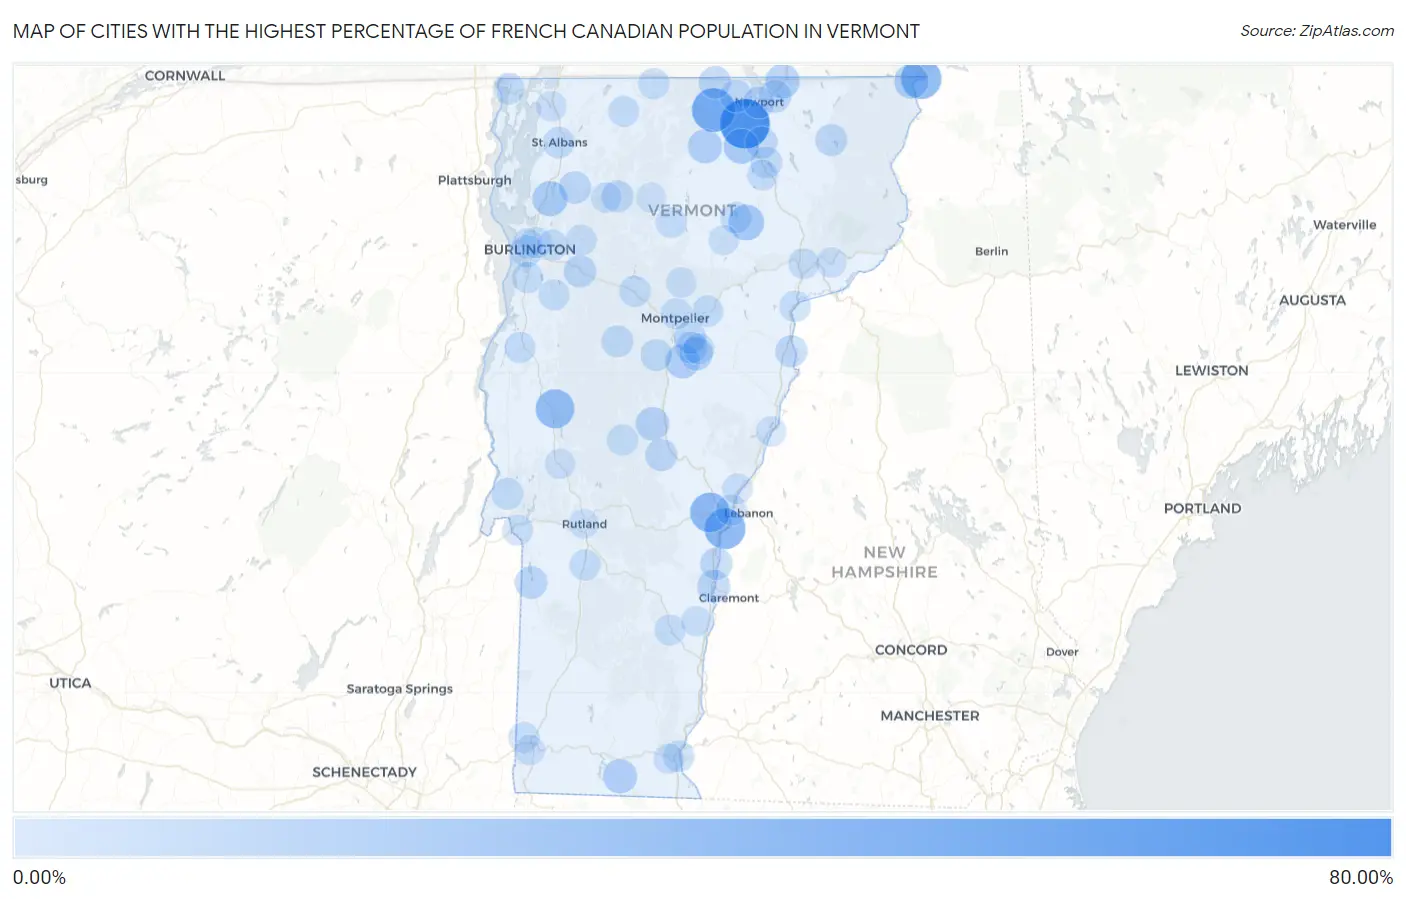
Map of Cities with the Highest Percentage of French Canadian Population in Vermont
0.00%
80.00%
Cities with the Highest Percentage of French Canadian Population in Vermont
| City | French Canadian | vs State | vs National | |
| 1. | Coventry | 71.43% | 7.55%(+63.9)#1 | 0.54%(+70.9)#2 |
| 2. | Troy | 50.36% | 7.55%(+42.8)#2 | 0.54%(+49.8)#4 |
| 3. | North Hartland | 40.38% | 7.55%(+32.8)#3 | 0.54%(+39.8)#9 |
| 4. | Beecher Falls | 38.61% | 7.55%(+31.1)#4 | 0.54%(+38.1)#12 |
| 5. | Quechee | 36.47% | 7.55%(+28.9)#5 | 0.54%(+35.9)#18 |
| 6. | Stratton Mountain | 33.33% | 7.55%(+25.8)#6 | 0.54%(+32.8)#21 |
| 7. | East Middlebury | 33.13% | 7.55%(+25.6)#7 | 0.54%(+32.6)#22 |
| 8. | Sutton | 30.32% | 7.55%(+22.8)#8 | 0.54%(+29.8)#27 |
| 9. | Greensboro Bend | 23.02% | 7.55%(+15.5)#9 | 0.54%(+22.5)#44 |
| 10. | Chittenden | 21.79% | 7.55%(+14.2)#10 | 0.54%(+21.3)#46 |
| 11. | Irasburg | 20.63% | 7.55%(+13.1)#11 | 0.54%(+20.1)#50 |
| 12. | Milton | 20.45% | 7.55%(+12.9)#12 | 0.54%(+19.9)#52 |
| 13. | Canaan | 19.23% | 7.55%(+11.7)#13 | 0.54%(+18.7)#66 |
| 14. | Derby Line | 18.35% | 7.55%(+10.8)#14 | 0.54%(+17.8)#74 |
| 15. | Williamstown | 18.10% | 7.55%(+10.6)#15 | 0.54%(+17.6)#75 |
| 16. | Underhill Flats | 17.85% | 7.55%(+10.3)#16 | 0.54%(+17.3)#76 |
| 17. | Lincoln | 17.76% | 7.55%(+10.2)#17 | 0.54%(+17.2)#78 |
| 18. | Lowell | 17.62% | 7.55%(+10.1)#18 | 0.54%(+17.1)#82 |
| 19. | Gilman | 17.29% | 7.55%(+9.74)#19 | 0.54%(+16.7)#86 |
| 20. | Jacksonville | 17.24% | 7.55%(+9.69)#20 | 0.54%(+16.7)#87 |
| 21. | Randolph | 15.82% | 7.55%(+8.27)#21 | 0.54%(+15.3)#105 |
| 22. | Graniteville | 15.20% | 7.55%(+7.65)#22 | 0.54%(+14.7)#118 |
| 23. | Westford | 14.78% | 7.55%(+7.23)#23 | 0.54%(+14.2)#119 |
| 24. | Wolcott | 14.04% | 7.55%(+6.49)#24 | 0.54%(+13.5)#132 |
| 25. | Ascutney | 12.82% | 7.55%(+5.27)#25 | 0.54%(+12.3)#149 |
| 26. | Fairfax | 12.50% | 7.55%(+4.95)#26 | 0.54%(+12.0)#157 |
| 27. | Derby Center | 12.34% | 7.55%(+4.79)#27 | 0.54%(+11.8)#160 |
| 28. | Newport Center | 12.06% | 7.55%(+4.51)#28 | 0.54%(+11.5)#169 |
| 29. | Richmond | 12.05% | 7.55%(+4.50)#29 | 0.54%(+11.5)#170 |
| 30. | Wells | 11.92% | 7.55%(+4.37)#30 | 0.54%(+11.4)#178 |
| 31. | St. George | 11.91% | 7.55%(+4.36)#31 | 0.54%(+11.4)#180 |
| 32. | North Troy | 11.82% | 7.55%(+4.27)#32 | 0.54%(+11.3)#183 |
| 33. | Barre | 11.43% | 7.55%(+3.88)#33 | 0.54%(+10.9)#195 |
| 34. | Bethel | 10.81% | 7.55%(+3.26)#34 | 0.54%(+10.3)#217 |
| 35. | Orleans | 10.78% | 7.55%(+3.23)#35 | 0.54%(+10.2)#219 |
| 36. | Wells River | 10.74% | 7.55%(+3.19)#36 | 0.54%(+10.2)#223 |
| 37. | Windsor | 10.71% | 7.55%(+3.16)#37 | 0.54%(+10.2)#227 |
| 38. | South Barre | 10.43% | 7.55%(+2.88)#38 | 0.54%(+9.88)#234 |
| 39. | Jeffersonville | 10.42% | 7.55%(+2.87)#39 | 0.54%(+9.88)#235 |
| 40. | Island Pond | 10.28% | 7.55%(+2.73)#40 | 0.54%(+9.73)#242 |
| 41. | Northfield | 10.09% | 7.55%(+2.54)#41 | 0.54%(+9.55)#254 |
| 42. | Waitsfield | 10.09% | 7.55%(+2.54)#42 | 0.54%(+9.54)#255 |
| 43. | Newport | 9.88% | 7.55%(+2.33)#43 | 0.54%(+9.34)#263 |
| 44. | South Burlington | 9.58% | 7.55%(+2.03)#44 | 0.54%(+9.04)#272 |
| 45. | Lunenburg | 9.36% | 7.55%(+1.81)#45 | 0.54%(+8.81)#286 |
| 46. | Huntington | 9.34% | 7.55%(+1.79)#46 | 0.54%(+8.79)#287 |
| 47. | Barton | 9.29% | 7.55%(+1.74)#47 | 0.54%(+8.74)#293 |
| 48. | Castleton Four Corners | 9.23% | 7.55%(+1.68)#48 | 0.54%(+8.69)#299 |
| 49. | Highgate Center | 9.13% | 7.55%(+1.58)#49 | 0.54%(+8.58)#306 |
| 50. | Benson | 9.05% | 7.55%(+1.50)#50 | 0.54%(+8.51)#311 |
| 51. | Waterbury | 8.84% | 7.55%(+1.29)#51 | 0.54%(+8.29)#323 |
| 52. | Greensboro | 8.82% | 7.55%(+1.27)#52 | 0.54%(+8.28)#324 |
| 53. | Alburgh | 8.80% | 7.55%(+1.25)#53 | 0.54%(+8.26)#326 |
| 54. | Bakersfield | 8.58% | 7.55%(+1.03)#54 | 0.54%(+8.03)#341 |
| 55. | Plainfield | 8.37% | 7.55%(+0.822)#55 | 0.54%(+7.83)#355 |
| 56. | St Albans | 8.21% | 7.55%(+0.664)#56 | 0.54%(+7.67)#365 |
| 57. | Brattleboro | 8.17% | 7.55%(+0.617)#57 | 0.54%(+7.62)#369 |
| 58. | Richford | 8.01% | 7.55%(+0.457)#58 | 0.54%(+7.46)#381 |
| 59. | Middletown Springs | 7.84% | 7.55%(+0.293)#59 | 0.54%(+7.30)#390 |
| 60. | Rochester | 7.77% | 7.55%(+0.220)#60 | 0.54%(+7.23)#394 |
| 61. | Vergennes | 7.73% | 7.55%(+0.181)#61 | 0.54%(+7.19)#396 |
| 62. | Shelburne | 7.68% | 7.55%(+0.134)#62 | 0.54%(+7.14)#399 |
| 63. | Barnet | 7.63% | 7.55%(+0.084)#63 | 0.54%(+7.09)#403 |
| 64. | Websterville | 7.63% | 7.55%(+0.081)#64 | 0.54%(+7.09)#404 |
| 65. | Montpelier | 7.61% | 7.55%(+0.059)#65 | 0.54%(+7.06)#405 |
| 66. | Wallingford | 7.51% | 7.55%(-0.044)#66 | 0.54%(+6.96)#414 |
| 67. | Enosburg Falls | 7.40% | 7.55%(-0.150)#67 | 0.54%(+6.86)#431 |
| 68. | Morrisville | 7.38% | 7.55%(-0.174)#68 | 0.54%(+6.83)#435 |
| 69. | Winooski | 7.17% | 7.55%(-0.384)#69 | 0.54%(+6.62)#456 |
| 70. | Chester | 7.02% | 7.55%(-0.531)#70 | 0.54%(+6.47)#468 |
| 71. | Hinesburg | 6.96% | 7.55%(-0.588)#71 | 0.54%(+6.42)#476 |
| 72. | Stamford | 6.94% | 7.55%(-0.608)#72 | 0.54%(+6.40)#477 |
| 73. | White River Junction | 6.91% | 7.55%(-0.645)#73 | 0.54%(+6.36)#480 |
| 74. | Essex Junction | 6.86% | 7.55%(-0.693)#74 | 0.54%(+6.31)#483 |
| 75. | North Bennington | 6.69% | 7.55%(-0.860)#75 | 0.54%(+6.15)#502 |
| 76. | Fair Haven | 6.40% | 7.55%(-1.15)#76 | 0.54%(+5.86)#531 |
| 77. | St Johnsbury | 6.36% | 7.55%(-1.19)#77 | 0.54%(+5.81)#537 |
| 78. | Jericho | 6.35% | 7.55%(-1.20)#78 | 0.54%(+5.80)#541 |
| 79. | Glover | 6.28% | 7.55%(-1.27)#79 | 0.54%(+5.73)#557 |
| 80. | Pawlet | 6.27% | 7.55%(-1.28)#80 | 0.54%(+5.73)#560 |
| 81. | Waterbury Center | 6.13% | 7.55%(-1.42)#81 | 0.54%(+5.59)#575 |
| 82. | Burlington | 6.11% | 7.55%(-1.44)#82 | 0.54%(+5.56)#579 |
| 83. | Cambridge | 6.06% | 7.55%(-1.49)#83 | 0.54%(+5.52)#585 |
| 84. | New Haven | 5.95% | 7.55%(-1.60)#84 | 0.54%(+5.41)#593 |
| 85. | Killington | 5.77% | 7.55%(-1.78)#85 | 0.54%(+5.22)#616 |
| 86. | Norwich | 5.48% | 7.55%(-2.07)#86 | 0.54%(+4.94)#657 |
| 87. | Swanton | 5.40% | 7.55%(-2.15)#87 | 0.54%(+4.85)#681 |
| 88. | Brandon | 5.22% | 7.55%(-2.33)#88 | 0.54%(+4.68)#706 |
| 89. | Worcester | 5.22% | 7.55%(-2.33)#89 | 0.54%(+4.67)#708 |
| 90. | Sheffield | 5.15% | 7.55%(-2.40)#90 | 0.54%(+4.61)#719 |
| 91. | North Hyde Park | 5.06% | 7.55%(-2.49)#91 | 0.54%(+4.52)#736 |
| 92. | Fairlee | 5.04% | 7.55%(-2.51)#92 | 0.54%(+4.50)#744 |
| 93. | Concord | 4.97% | 7.55%(-2.58)#93 | 0.54%(+4.43)#754 |
| 94. | Hardwick | 4.97% | 7.55%(-2.58)#94 | 0.54%(+4.43)#755 |
| 95. | Old Bennington | 4.97% | 7.55%(-2.58)#95 | 0.54%(+4.42)#756 |
| 96. | Springfield | 4.92% | 7.55%(-2.63)#96 | 0.54%(+4.37)#764 |
| 97. | West Brattleboro | 4.86% | 7.55%(-2.69)#97 | 0.54%(+4.32)#770 |
| 98. | Johnson | 4.38% | 7.55%(-3.17)#98 | 0.54%(+3.84)#871 |
| 99. | Bolton Valley | 4.24% | 7.55%(-3.31)#99 | 0.54%(+3.70)#912 |
| 100. | Rutland | 4.10% | 7.55%(-3.45)#100 | 0.54%(+3.56)#949 |
1
2Common Questions
What are the Top 10 Cities with the Highest Percentage of French Canadian Population in Vermont?
Top 10 Cities with the Highest Percentage of French Canadian Population in Vermont are:
#1
71.43%
#2
50.36%
#3
40.38%
#4
38.61%
#5
36.47%
#6
33.13%
#7
23.02%
#8
20.63%
#9
20.45%
#10
19.23%
What city has the Highest Percentage of French Canadian Population in Vermont?
Coventry has the Highest Percentage of French Canadian Population in Vermont with 71.43%.
What is the Percentage of French Canadian Population in the State of Vermont?
Percentage of French Canadian Population in Vermont is 7.55%.
What is the Percentage of French Canadian Population in the United States?
Percentage of French Canadian Population in the United States is 0.54%.