Cities with the Highest Percentage of French Canadian Population in North Carolina
RELATED REPORTS & OPTIONS
French Canadian
North Carolina
Compare Cities
Map of Cities with the Highest Percentage of French Canadian Population in North Carolina
0.00%
6.00%
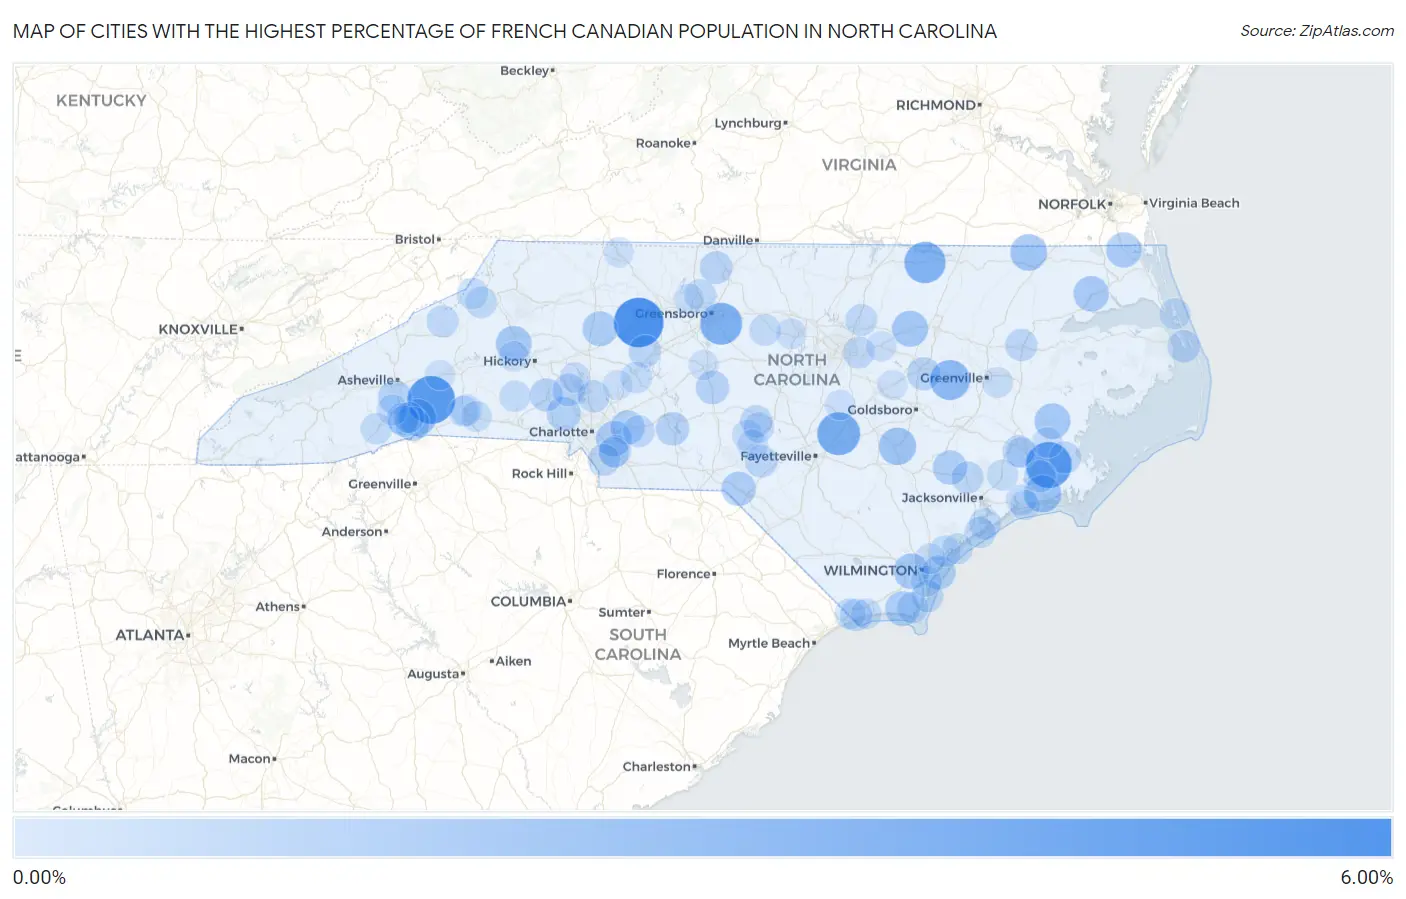
Cities with the Highest Percentage of French Canadian Population in North Carolina
| City | French Canadian | vs State | vs National | |
| 1. | Bermuda Run | 5.97% | 0.32% (+5.64)#1 | 0.54% (+5.42)#591 |
| 2. | Chimney Rock Village | 5.45% | 0.32% (+5.13)#2 | 0.54% (+4.91)#664 |
| 3. | Minnesott Beach | 4.94% | 0.32% (+4.61)#3 | 0.54% (+4.39)#759 |
| 4. | Godwin | 4.08% | 0.32% (+3.76)#4 | 0.54% (+3.54)#953 |
| 5. | Forest Oaks | 3.81% | 0.32% (+3.49)#5 | 0.54% (+3.27)#1,035 |
| 6. | Littleton | 3.62% | 0.32% (+3.29)#6 | 0.54% (+3.07)#1,092 |
| 7. | Walstonburg | 3.24% | 0.32% (+2.91)#7 | 0.54% (+2.69)#1,218 |
| 8. | Newport | 2.54% | 0.32% (+2.22)#8 | 0.54% (+2.00)#1,575 |
| 9. | Faison | 2.53% | 0.32% (+2.20)#9 | 0.54% (+1.98)#1,584 |
| 10. | Dana | 2.45% | 0.32% (+2.13)#10 | 0.54% (+1.91)#1,634 |
| 11. | Como | 2.35% | 0.32% (+2.03)#11 | 0.54% (+1.81)#1,708 |
| 12. | Momeyer | 2.18% | 0.32% (+1.86)#12 | 0.54% (+1.64)#1,852 |
| 13. | Aurora | 2.11% | 0.32% (+1.78)#13 | 0.54% (+1.56)#1,914 |
| 14. | Cajah S Mountain | 2.10% | 0.32% (+1.77)#14 | 0.54% (+1.55)#1,922 |
| 15. | Leland | 2.04% | 0.32% (+1.71)#15 | 0.54% (+1.49)#1,973 |
| 16. | Mint Hill | 2.01% | 0.32% (+1.69)#16 | 0.54% (+1.47)#1,997 |
| 17. | Winfall | 2.00% | 0.32% (+1.68)#17 | 0.54% (+1.46)#2,009 |
| 18. | Moyock | 1.92% | 0.32% (+1.60)#18 | 0.54% (+1.38)#2,087 |
| 19. | Harmony | 1.88% | 0.32% (+1.56)#19 | 0.54% (+1.34)#2,125 |
| 20. | St James | 1.86% | 0.32% (+1.53)#20 | 0.54% (+1.31)#2,153 |
| 21. | Potters Hill | 1.74% | 0.32% (+1.41)#21 | 0.54% (+1.19)#2,300 |
| 22. | Carolina Meadows | 1.74% | 0.32% (+1.41)#22 | 0.54% (+1.19)#2,304 |
| 23. | Laurel Hill | 1.73% | 0.32% (+1.40)#23 | 0.54% (+1.18)#2,316 |
| 24. | Midland | 1.69% | 0.32% (+1.37)#24 | 0.54% (+1.15)#2,369 |
| 25. | East Flat Rock | 1.69% | 0.32% (+1.36)#25 | 0.54% (+1.14)#2,377 |
| 26. | Wrightsville Beach | 1.65% | 0.32% (+1.33)#26 | 0.54% (+1.11)#2,422 |
| 27. | Avery Creek | 1.62% | 0.32% (+1.29)#27 | 0.54% (+1.07)#2,464 |
| 28. | Stanley | 1.59% | 0.32% (+1.26)#28 | 0.54% (+1.04)#2,497 |
| 29. | Norwood | 1.51% | 0.32% (+1.19)#29 | 0.54% (+0.970)#2,615 |
| 30. | Seagrove | 1.48% | 0.32% (+1.16)#30 | 0.54% (+0.937)#2,659 |
| 31. | Black Creek | 1.45% | 0.32% (+1.13)#31 | 0.54% (+0.907)#2,702 |
| 32. | Lincolnton | 1.42% | 0.32% (+1.09)#32 | 0.54% (+0.872)#2,766 |
| 33. | Governors Club | 1.35% | 0.32% (+1.02)#33 | 0.54% (+0.803)#2,879 |
| 34. | Wentworth | 1.31% | 0.32% (+0.989)#34 | 0.54% (+0.769)#2,951 |
| 35. | Denver | 1.28% | 0.32% (+0.953)#35 | 0.54% (+0.733)#3,031 |
| 36. | Tyro | 1.24% | 0.32% (+0.918)#36 | 0.54% (+0.698)#3,114 |
| 37. | Five Points | 1.23% | 0.32% (+0.908)#37 | 0.54% (+0.688)#3,137 |
| 38. | Wanchese | 1.20% | 0.32% (+0.872)#38 | 0.54% (+0.653)#3,218 |
| 39. | Sunset Beach | 1.17% | 0.32% (+0.845)#39 | 0.54% (+0.625)#3,293 |
| 40. | Williamston | 1.17% | 0.32% (+0.843)#40 | 0.54% (+0.623)#3,301 |
| 41. | Lake Park | 1.17% | 0.32% (+0.842)#41 | 0.54% (+0.622)#3,303 |
| 42. | Davidson | 1.14% | 0.32% (+0.820)#42 | 0.54% (+0.600)#3,348 |
| 43. | Oriental | 1.14% | 0.32% (+0.812)#43 | 0.54% (+0.592)#3,374 |
| 44. | Richlands | 1.13% | 0.32% (+0.801)#44 | 0.54% (+0.581)#3,402 |
| 45. | Havelock | 1.12% | 0.32% (+0.791)#45 | 0.54% (+0.571)#3,420 |
| 46. | Carthage | 1.12% | 0.32% (+0.791)#46 | 0.54% (+0.571)#3,421 |
| 47. | Laurel Park | 1.11% | 0.32% (+0.784)#47 | 0.54% (+0.565)#3,436 |
| 48. | Carolina Beach | 1.11% | 0.32% (+0.784)#48 | 0.54% (+0.564)#3,437 |
| 49. | Trent Woods | 1.10% | 0.32% (+0.777)#49 | 0.54% (+0.557)#3,462 |
| 50. | Weddington | 1.10% | 0.32% (+0.776)#50 | 0.54% (+0.556)#3,464 |
| 51. | Bakersville | 1.10% | 0.32% (+0.774)#51 | 0.54% (+0.554)#3,470 |
| 52. | Stanfield | 1.09% | 0.32% (+0.769)#52 | 0.54% (+0.549)#3,488 |
| 53. | Knightdale | 1.08% | 0.32% (+0.758)#53 | 0.54% (+0.538)#3,521 |
| 54. | Youngsville | 1.07% | 0.32% (+0.749)#54 | 0.54% (+0.529)#3,547 |
| 55. | Sneads Ferry | 1.03% | 0.32% (+0.704)#55 | 0.54% (+0.484)#3,662 |
| 56. | Summerfield | 1.01% | 0.32% (+0.686)#56 | 0.54% (+0.466)#3,713 |
| 57. | Saxapahaw | 1.00% | 0.32% (+0.675)#57 | 0.54% (+0.456)#3,743 |
| 58. | Southport | 0.97% | 0.32% (+0.647)#58 | 0.54% (+0.427)#3,841 |
| 59. | Granite Quarry | 0.97% | 0.32% (+0.646)#59 | 0.54% (+0.426)#3,846 |
| 60. | Ruth | 0.97% | 0.32% (+0.642)#60 | 0.54% (+0.422)#3,859 |
| 61. | Brevard | 0.95% | 0.32% (+0.627)#61 | 0.54% (+0.407)#3,908 |
| 62. | Seven Devils | 0.95% | 0.32% (+0.623)#62 | 0.54% (+0.403)#3,918 |
| 63. | Hampstead | 0.92% | 0.32% (+0.599)#63 | 0.54% (+0.379)#3,992 |
| 64. | Valley Hill | 0.91% | 0.32% (+0.586)#64 | 0.54% (+0.366)#4,028 |
| 65. | Belwood | 0.91% | 0.32% (+0.582)#65 | 0.54% (+0.362)#4,046 |
| 66. | North Topsail Beach | 0.90% | 0.32% (+0.579)#66 | 0.54% (+0.359)#4,062 |
| 67. | Maysville | 0.90% | 0.32% (+0.571)#67 | 0.54% (+0.351)#4,085 |
| 68. | Carolina Shores | 0.88% | 0.32% (+0.559)#68 | 0.54% (+0.339)#4,137 |
| 69. | Briar Chapel | 0.88% | 0.32% (+0.557)#69 | 0.54% (+0.337)#4,147 |
| 70. | Beech Mountain | 0.88% | 0.32% (+0.553)#70 | 0.54% (+0.333)#4,169 |
| 71. | Topsail Beach | 0.85% | 0.32% (+0.525)#71 | 0.54% (+0.305)#4,284 |
| 72. | Mills River | 0.85% | 0.32% (+0.521)#72 | 0.54% (+0.301)#4,298 |
| 73. | Kitty Hawk | 0.84% | 0.32% (+0.516)#73 | 0.54% (+0.296)#4,317 |
| 74. | Silver Lake | 0.84% | 0.32% (+0.512)#74 | 0.54% (+0.292)#4,330 |
| 75. | Hendersonville | 0.83% | 0.32% (+0.510)#75 | 0.54% (+0.290)#4,339 |
| 76. | Rutherfordton | 0.82% | 0.32% (+0.493)#76 | 0.54% (+0.273)#4,435 |
| 77. | Pinehurst | 0.82% | 0.32% (+0.491)#77 | 0.54% (+0.271)#4,442 |
| 78. | Peletier | 0.80% | 0.32% (+0.477)#78 | 0.54% (+0.257)#4,499 |
| 79. | New Bern | 0.79% | 0.32% (+0.466)#79 | 0.54% (+0.246)#4,544 |
| 80. | Aberdeen | 0.78% | 0.32% (+0.459)#80 | 0.54% (+0.239)#4,570 |
| 81. | Simpson | 0.78% | 0.32% (+0.453)#81 | 0.54% (+0.233)#4,591 |
| 82. | Northchase | 0.78% | 0.32% (+0.451)#82 | 0.54% (+0.231)#4,595 |
| 83. | Forest City | 0.77% | 0.32% (+0.450)#83 | 0.54% (+0.230)#4,601 |
| 84. | Whispering Pines | 0.77% | 0.32% (+0.445)#84 | 0.54% (+0.225)#4,621 |
| 85. | Grantsboro | 0.76% | 0.32% (+0.433)#85 | 0.54% (+0.213)#4,685 |
| 86. | Ocean Isle Beach | 0.74% | 0.32% (+0.417)#86 | 0.54% (+0.197)#4,772 |
| 87. | Carrboro | 0.74% | 0.32% (+0.415)#87 | 0.54% (+0.195)#4,788 |
| 88. | Lake Norman Of Catawba | 0.72% | 0.32% (+0.394)#88 | 0.54% (+0.174)#4,897 |
| 89. | Rutherford College | 0.71% | 0.32% (+0.390)#89 | 0.54% (+0.170)#4,914 |
| 90. | Governors | 0.70% | 0.32% (+0.371)#90 | 0.54% (+0.151)#5,033 |
| 91. | Coats | 0.69% | 0.32% (+0.364)#91 | 0.54% (+0.144)#5,072 |
| 92. | Zebulon | 0.69% | 0.32% (+0.363)#92 | 0.54% (+0.143)#5,079 |
| 93. | Indian Trail | 0.68% | 0.32% (+0.357)#93 | 0.54% (+0.137)#5,101 |
| 94. | Oak Ridge | 0.67% | 0.32% (+0.343)#94 | 0.54% (+0.123)#5,178 |
| 95. | Mount Airy | 0.64% | 0.32% (+0.316)#95 | 0.54% (+0.096)#5,328 |
| 96. | Micro | 0.63% | 0.32% (+0.304)#96 | 0.54% (+0.084)#5,384 |
| 97. | Landis | 0.63% | 0.32% (+0.303)#97 | 0.54% (+0.083)#5,391 |
| 98. | Asheboro | 0.62% | 0.32% (+0.295)#98 | 0.54% (+0.075)#5,436 |
| 99. | Bogue | 0.61% | 0.32% (+0.289)#99 | 0.54% (+0.069)#5,472 |
| 100. | Old Fort | 0.61% | 0.32% (+0.283)#100 | 0.54% (+0.063)#5,506 |
Common Questions
What are the Top 10 Cities with the Highest Percentage of French Canadian Population in North Carolina?
Top 10 Cities with the Highest Percentage of French Canadian Population in North Carolina are:
#1
5.97%
#2
5.45%
#3
4.94%
#4
4.08%
#5
3.81%
#6
3.62%
#7
3.24%
#8
2.54%
#9
2.53%
#10
2.45%
What city has the Highest Percentage of French Canadian Population in North Carolina?
Bermuda Run has the Highest Percentage of French Canadian Population in North Carolina with 5.97%.
What is the Percentage of French Canadian Population in the State of North Carolina?
Percentage of French Canadian Population in North Carolina is 0.32%.
What is the Percentage of French Canadian Population in the United States?
Percentage of French Canadian Population in the United States is 0.54%.