Cities with the Lowest Population Density in Tennessee
RELATED REPORTS & OPTIONS
Lowest Population Density
Tennessee
Compare Cities
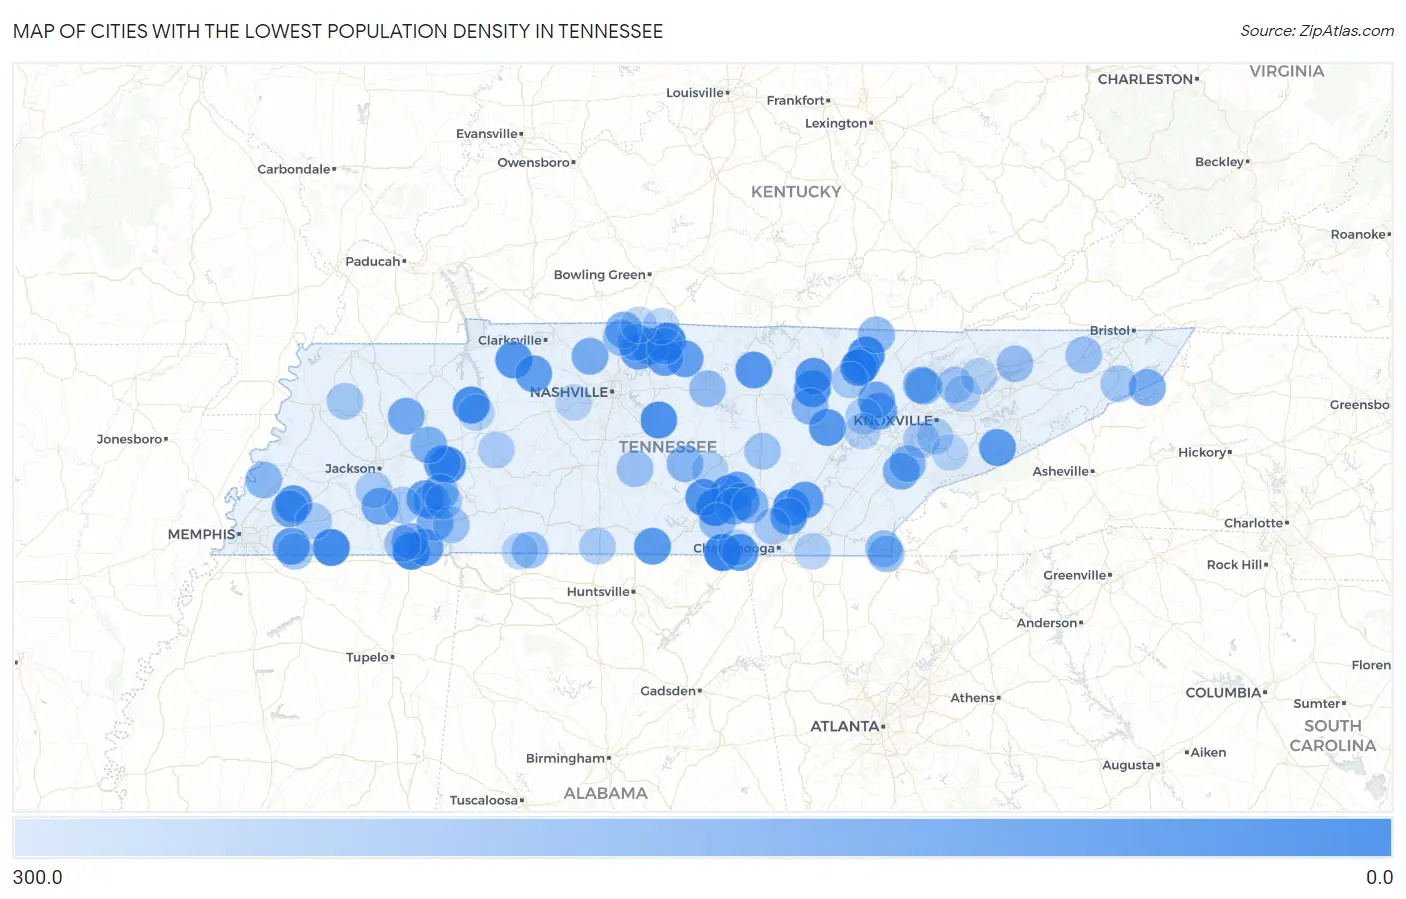
Map of Cities with the Lowest Population Density in Tennessee
300.0
0.0
Cities with the Lowest Population Density in Tennessee
| City | People / Sq Mi | vs State | vs National | |
| 1. | Orme | 10.4 | 167.9(-157)#1 | 0.0(+10.4)#370 |
| 2. | Pelham | 25.2 | 167.9(-143)#2 | 0.0(+25.2)#858 |
| 3. | Bransford | 32.5 | 167.9(-135)#3 | 0.0(+32.5)#1,089 |
| 4. | Guys | 33.7 | 167.9(-134)#4 | 0.0(+33.7)#1,122 |
| 5. | La Grange | 33.9 | 167.9(-134)#5 | 0.0(+33.9)#1,127 |
| 6. | Helenwood | 40.4 | 167.9(-128)#6 | 0.0(+40.4)#1,304 |
| 7. | Altamont | 43.9 | 167.9(-124)#7 | 0.0(+43.9)#1,418 |
| 8. | Eva | 47.7 | 167.9(-120)#8 | 0.0(+47.7)#1,530 |
| 9. | Darden | 49.6 | 167.9(-118)#9 | 0.0(+49.6)#1,579 |
| 10. | Flat Top Mountain | 51.4 | 167.9(-116)#10 | 0.0(+51.4)#1,625 |
| 11. | Walterhill | 56.7 | 167.9(-111)#11 | 0.0(+56.7)#1,777 |
| 12. | Robbins | 62.7 | 167.9(-105)#12 | 0.0(+62.7)#1,934 |
| 13. | Clarkrange | 65.4 | 167.9(-103)#13 | 0.0(+65.4)#2,002 |
| 14. | Cumberland City | 69.0 | 167.9(-98.9)#14 | 0.0(+69.0)#2,108 |
| 15. | Graball | 70.8 | 167.9(-97.1)#15 | 0.0(+70.8)#2,162 |
| 16. | Dodson Branch | 72.9 | 167.9(-95.1)#16 | 0.0(+72.9)#2,218 |
| 17. | Grimsley | 73.0 | 167.9(-94.9)#17 | 0.0(+73.0)#2,222 |
| 18. | Hillsboro | 75.5 | 167.9(-92.4)#18 | 0.0(+75.5)#2,303 |
| 19. | Crab Orchard | 79.4 | 167.9(-88.5)#19 | 0.0(+79.4)#2,418 |
| 20. | Braden | 79.9 | 167.9(-88.0)#20 | 0.0(+79.9)#2,432 |
| 21. | Elgin | 80.6 | 167.9(-87.3)#21 | 0.0(+80.6)#2,459 |
| 22. | Flintville | 80.8 | 167.9(-87.1)#22 | 0.0(+80.8)#2,463 |
| 23. | New Hope | 80.8 | 167.9(-87.1)#23 | 0.0(+80.8)#2,465 |
| 24. | Piperton | 86.0 | 167.9(-81.9)#24 | 0.0(+86.0)#2,600 |
| 25. | Pittman Center | 86.5 | 167.9(-81.5)#25 | 0.0(+86.5)#2,612 |
| 26. | Sale Creek | 93.7 | 167.9(-74.2)#26 | 0.0(+93.7)#2,803 |
| 27. | Mowbray Mountain | 94.1 | 167.9(-73.9)#27 | 0.0(+94.1)#2,811 |
| 28. | Michie | 94.3 | 167.9(-73.6)#28 | 0.0(+94.3)#2,816 |
| 29. | Cottontown | 98.4 | 167.9(-69.5)#29 | 0.0(+98.4)#2,905 |
| 30. | Hartsville Trousdale County | 99.4 | 167.9(-68.5)#30 | 0.0(+99.4)#2,940 |
| 31. | Slayden | 102.5 | 167.9(-65.4)#31 | 0.0(+102)#3,015 |
| 32. | Castalian Springs | 106.6 | 167.9(-61.3)#32 | 0.0(+107)#3,128 |
| 33. | Chesterfield | 108.4 | 167.9(-59.5)#33 | 0.0(+108)#3,178 |
| 34. | Enville | 108.8 | 167.9(-59.1)#34 | 0.0(+109)#3,191 |
| 35. | Beersheba Springs | 112.5 | 167.9(-55.5)#35 | 0.0(+112)#3,285 |
| 36. | Coalfield | 117.5 | 167.9(-50.4)#36 | 0.0(+117)#3,396 |
| 37. | Gruetli Laager | 125.1 | 167.9(-42.8)#37 | 0.0(+125)#3,563 |
| 38. | Gallaway | 125.4 | 167.9(-42.6)#38 | 0.0(+125)#3,568 |
| 39. | Silerton | 126.8 | 167.9(-41.1)#39 | 0.0(+127)#3,607 |
| 40. | Petros | 127.5 | 167.9(-40.4)#40 | 0.0(+128)#3,627 |
| 41. | Mclemoresville | 136.3 | 167.9(-31.6)#41 | 0.0(+136)#3,834 |
| 42. | New Deal | 139.3 | 167.9(-28.6)#42 | 0.0(+139)#3,894 |
| 43. | Coopertown | 143.5 | 167.9(-24.4)#43 | 0.0(+144)#3,994 |
| 44. | Vonore | 147.3 | 167.9(-20.6)#44 | 0.0(+147)#4,084 |
| 45. | Roan Mountain | 148.6 | 167.9(-19.3)#45 | 0.0(+149)#4,121 |
| 46. | Coalmont | 150.7 | 167.9(-17.2)#46 | 0.0(+151)#4,170 |
| 47. | Crump | 153.3 | 167.9(-14.6)#47 | 0.0(+153)#4,219 |
| 48. | Milledgeville | 157.1 | 167.9(-10.8)#48 | 0.0(+157)#4,311 |
| 49. | Parker S Crossroads | 158.1 | 167.9(-9.77)#49 | 0.0(+158)#4,334 |
| 50. | Orlinda | 160.2 | 167.9(-7.72)#50 | 0.0(+160)#4,376 |
| 51. | Eastview | 163.2 | 167.9(-4.70)#51 | 0.0(+163)#4,434 |
| 52. | Andersonville | 169.3 | 167.9(+1.40)#52 | 0.0(+169)#4,601 |
| 53. | Sardis | 173.2 | 167.9(+5.30)#53 | 0.0(+173)#4,687 |
| 54. | Greenback | 174.2 | 167.9(+6.29)#54 | 0.0(+174)#4,710 |
| 55. | Palmer | 179.5 | 167.9(+11.6)#55 | 0.0(+179)#4,827 |
| 56. | Bowman | 180.8 | 167.9(+12.9)#56 | 0.0(+181)#4,866 |
| 57. | Lakewood Park | 182.8 | 167.9(+14.9)#57 | 0.0(+183)#4,917 |
| 58. | Gilt Edge | 186.5 | 167.9(+18.5)#58 | 0.0(+186)#4,998 |
| 59. | Norris | 192.6 | 167.9(+24.6)#59 | 0.0(+193)#5,125 |
| 60. | Ducktown | 193.4 | 167.9(+25.5)#60 | 0.0(+193)#5,147 |
| 61. | Winfield | 194.9 | 167.9(+27.0)#61 | 0.0(+195)#5,183 |
| 62. | Gordonsville | 205.2 | 167.9(+37.3)#62 | 0.0(+205)#5,397 |
| 63. | Bethpage | 207.8 | 167.9(+39.9)#63 | 0.0(+208)#5,443 |
| 64. | St Joseph | 208.8 | 167.9(+40.9)#64 | 0.0(+209)#5,465 |
| 65. | Copperhill | 209.7 | 167.9(+41.8)#65 | 0.0(+210)#5,487 |
| 66. | Monteagle | 209.7 | 167.9(+41.8)#66 | 0.0(+210)#5,489 |
| 67. | Cross Plains | 210.1 | 167.9(+42.1)#67 | 0.0(+210)#5,497 |
| 68. | Mooresburg | 213.6 | 167.9(+45.7)#68 | 0.0(+214)#5,576 |
| 69. | Unionville | 215.2 | 167.9(+47.3)#69 | 0.0(+215)#5,614 |
| 70. | Ramer | 215.5 | 167.9(+47.6)#70 | 0.0(+216)#5,617 |
| 71. | Fall Branch | 217.8 | 167.9(+49.9)#71 | 0.0(+218)#5,657 |
| 72. | Olivet | 220.4 | 167.9(+52.5)#72 | 0.0(+220)#5,712 |
| 73. | Spencer | 224.3 | 167.9(+56.4)#73 | 0.0(+224)#5,787 |
| 74. | Rossville | 226.0 | 167.9(+58.1)#74 | 0.0(+226)#5,815 |
| 75. | Luttrell | 233.4 | 167.9(+65.5)#75 | 0.0(+233)#5,960 |
| 76. | Unicoi | 235.0 | 167.9(+67.0)#76 | 0.0(+235)#5,987 |
| 77. | Yorkville | 238.7 | 167.9(+70.8)#77 | 0.0(+239)#6,068 |
| 78. | Saltillo | 242.0 | 167.9(+74.1)#78 | 0.0(+242)#6,127 |
| 79. | Lone Oak | 244.9 | 167.9(+77.0)#79 | 0.0(+245)#6,181 |
| 80. | Finger | 245.1 | 167.9(+77.2)#80 | 0.0(+245)#6,185 |
| 81. | Somerville | 246.4 | 167.9(+78.4)#81 | 0.0(+246)#6,209 |
| 82. | Medon | 248.3 | 167.9(+80.4)#82 | 0.0(+248)#6,252 |
| 83. | Elkton | 248.8 | 167.9(+80.9)#83 | 0.0(+249)#6,258 |
| 84. | Sunbright | 249.4 | 167.9(+81.5)#84 | 0.0(+249)#6,277 |
| 85. | Lobelville | 251.7 | 167.9(+83.8)#85 | 0.0(+252)#6,318 |
| 86. | Louisville | 254.2 | 167.9(+86.3)#86 | 0.0(+254)#6,361 |
| 87. | Oakdale | 257.8 | 167.9(+89.9)#87 | 0.0(+258)#6,434 |
| 88. | Apison | 259.4 | 167.9(+91.5)#88 | 0.0(+259)#6,474 |
| 89. | Blaine | 261.8 | 167.9(+93.9)#89 | 0.0(+262)#6,524 |
| 90. | Rockford | 264.2 | 167.9(+96.3)#90 | 0.0(+264)#6,570 |
| 91. | Morrison | 266.4 | 167.9(+98.5)#91 | 0.0(+266)#6,608 |
| 92. | New Johnsonville | 268.2 | 167.9(+100)#92 | 0.0(+268)#6,648 |
| 93. | Fairfield | 269.3 | 167.9(+101)#93 | 0.0(+269)#6,676 |
| 94. | Iron City | 270.4 | 167.9(+103)#94 | 0.0(+270)#6,697 |
| 95. | Kimball | 271.8 | 167.9(+104)#95 | 0.0(+272)#6,722 |
| 96. | Mitchellville | 276.6 | 167.9(+109)#96 | 0.0(+277)#6,797 |
| 97. | Walland | 277.0 | 167.9(+109)#97 | 0.0(+277)#6,804 |
| 98. | Kingston Springs | 278.3 | 167.9(+110)#98 | 0.0(+278)#6,839 |
| 99. | Rutledge | 280.0 | 167.9(+112)#99 | 0.0(+280)#6,870 |
| 100. | Midtown | 280.3 | 167.9(+112)#100 | 0.0(+280)#6,882 |
Common Questions
What are the Top 10 Cities with the Lowest Population Density in Tennessee?
Top 10 Cities with the Lowest Population Density in Tennessee are:
What city has the Lowest Population Density in Tennessee?
Orme has the Lowest Population Density in Tennessee with 10.4.
What is the Population Density in the State of Tennessee?
Population Density in Tennessee is 167.9.