Cities with the Lowest Population Density in Texas
RELATED REPORTS & OPTIONS
Lowest Population Density
Texas
Compare Cities
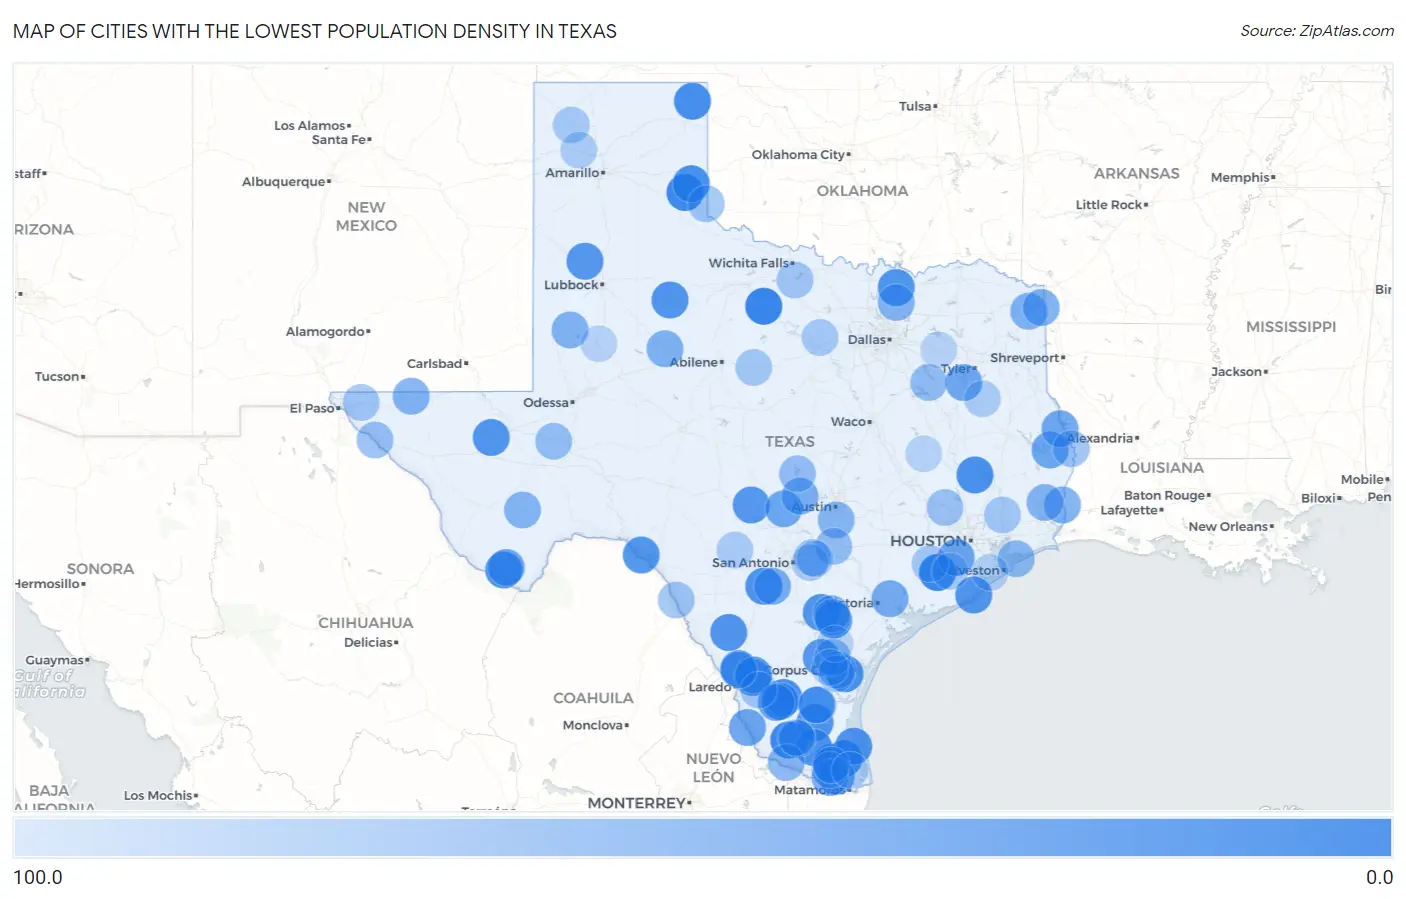
Map of Cities with the Lowest Population Density in Texas
100.0
0.0
Cities with the Lowest Population Density in Texas
| City | People / Sq Mi | vs State | vs National | |
| 1. | Elbert | 1.5 | 111.9(-110)#1 | 0.0(+1.50)#91 |
| 2. | Iago | 2.6 | 111.9(-109)#2 | 0.0(+2.61)#120 |
| 3. | Santa Anna | 4.3 | 111.9(-108)#3 | 0.0(+4.25)#174 |
| 4. | Quail | 6.3 | 111.9(-106)#4 | 0.0(+6.28)#241 |
| 5. | Botines | 6.8 | 111.9(-105)#5 | 0.0(+6.83)#251 |
| 6. | Yznaga | 8.0 | 111.9(-104)#6 | 0.0(+8.04)#304 |
| 7. | Santa Monica | 8.0 | 111.9(-104)#7 | 0.0(+8.04)#305 |
| 8. | Lipscomb | 11.2 | 111.9(-101)#8 | 0.0(+11.2)#396 |
| 9. | Tierra Grande | 12.9 | 111.9(-99.0)#9 | 0.0(+12.9)#437 |
| 10. | Oakhurst | 13.5 | 111.9(-98.4)#10 | 0.0(+13.5)#457 |
| 11. | Terlingua | 13.9 | 111.9(-98.0)#11 | 0.0(+13.9)#470 |
| 12. | Samnorwood | 14.1 | 111.9(-97.9)#12 | 0.0(+14.1)#476 |
| 13. | Las Lomitas | 14.2 | 111.9(-97.8)#13 | 0.0(+14.2)#477 |
| 14. | Encino | 15.2 | 111.9(-96.8)#14 | 0.0(+15.2)#512 |
| 15. | Moore | 15.2 | 111.9(-96.7)#15 | 0.0(+15.2)#515 |
| 16. | Linn | 15.6 | 111.9(-96.4)#16 | 0.0(+15.6)#530 |
| 17. | South Fork Estates | 16.4 | 111.9(-95.5)#17 | 0.0(+16.4)#556 |
| 18. | Port Mansfield | 16.9 | 111.9(-95.0)#18 | 0.0(+16.9)#577 |
| 19. | Quintana | 17.1 | 111.9(-94.8)#19 | 0.0(+17.1)#582 |
| 20. | Catarina | 17.2 | 111.9(-94.8)#20 | 0.0(+17.2)#584 |
| 21. | Girard | 17.3 | 111.9(-94.6)#21 | 0.0(+17.3)#589 |
| 22. | Dorchester | 17.6 | 111.9(-94.4)#22 | 0.0(+17.6)#596 |
| 23. | Pawnee | 18.5 | 111.9(-93.5)#23 | 0.0(+18.5)#626 |
| 24. | Toyah | 18.5 | 111.9(-93.5)#24 | 0.0(+18.5)#628 |
| 25. | Normanna | 18.6 | 111.9(-93.4)#25 | 0.0(+18.6)#633 |
| 26. | Spade | 20.7 | 111.9(-91.2)#26 | 0.0(+20.7)#702 |
| 27. | Westdale | 20.8 | 111.9(-91.1)#27 | 0.0(+20.8)#706 |
| 28. | Harper | 21.4 | 111.9(-90.5)#28 | 0.0(+21.4)#724 |
| 29. | Flowella | 25.0 | 111.9(-86.9)#29 | 0.0(+25.0)#850 |
| 30. | Colorado Acres | 25.1 | 111.9(-86.8)#30 | 0.0(+25.1)#855 |
| 31. | Hillside Acres | 29.4 | 111.9(-82.5)#31 | 0.0(+29.4)#994 |
| 32. | Rangerville | 29.9 | 111.9(-82.1)#32 | 0.0(+29.9)#1,012 |
| 33. | Thompsons | 34.0 | 111.9(-78.0)#33 | 0.0(+34.0)#1,131 |
| 34. | Falcon Mesa | 34.0 | 111.9(-77.9)#34 | 0.0(+34.0)#1,132 |
| 35. | Browndell | 36.0 | 111.9(-76.0)#35 | 0.0(+36.0)#1,192 |
| 36. | Stonewall | 36.8 | 111.9(-75.1)#36 | 0.0(+36.8)#1,219 |
| 37. | Study Butte | 37.3 | 111.9(-74.6)#37 | 0.0(+37.3)#1,233 |
| 38. | Thompsonville | 37.8 | 111.9(-74.1)#38 | 0.0(+37.8)#1,242 |
| 39. | Coffee City | 37.9 | 111.9(-74.1)#39 | 0.0(+37.9)#1,246 |
| 40. | Milam | 38.5 | 111.9(-73.5)#40 | 0.0(+38.5)#1,257 |
| 41. | Inez | 40.8 | 111.9(-71.2)#41 | 0.0(+40.8)#1,316 |
| 42. | Iglesia Antigua | 42.0 | 111.9(-70.0)#42 | 0.0(+42.0)#1,355 |
| 43. | Bigfoot | 42.2 | 111.9(-69.7)#43 | 0.0(+42.2)#1,365 |
| 44. | Round Mountain | 45.0 | 111.9(-66.9)#44 | 0.0(+45.0)#1,450 |
| 45. | Deweyville | 45.8 | 111.9(-66.2)#45 | 0.0(+45.8)#1,473 |
| 46. | Douglassville | 45.8 | 111.9(-66.1)#46 | 0.0(+45.8)#1,474 |
| 47. | Domino | 46.2 | 111.9(-65.8)#47 | 0.0(+46.2)#1,482 |
| 48. | Hermleigh | 47.4 | 111.9(-64.6)#48 | 0.0(+47.4)#1,521 |
| 49. | Loop | 48.5 | 111.9(-63.4)#49 | 0.0(+48.5)#1,554 |
| 50. | Dell City | 49.2 | 111.9(-62.7)#50 | 0.0(+49.2)#1,569 |
| 51. | Evadale | 49.9 | 111.9(-62.0)#51 | 0.0(+49.9)#1,589 |
| 52. | Weston | 51.2 | 111.9(-60.8)#52 | 0.0(+51.2)#1,619 |
| 53. | Marathon | 52.2 | 111.9(-59.8)#53 | 0.0(+52.2)#1,636 |
| 54. | Amistad | 52.4 | 111.9(-59.6)#54 | 0.0(+52.4)#1,640 |
| 55. | Delmita | 52.4 | 111.9(-59.5)#55 | 0.0(+52.4)#1,648 |
| 56. | Creedmoor | 53.3 | 111.9(-58.7)#56 | 0.0(+53.3)#1,673 |
| 57. | La Paloma Ranchettes | 53.4 | 111.9(-58.6)#57 | 0.0(+53.4)#1,675 |
| 58. | Bolivar Peninsula | 54.5 | 111.9(-57.5)#58 | 0.0(+54.5)#1,713 |
| 59. | Tulsita | 54.9 | 111.9(-57.0)#59 | 0.0(+54.9)#1,730 |
| 60. | Box Canyon | 55.7 | 111.9(-56.3)#60 | 0.0(+55.7)#1,749 |
| 61. | Tierra Verde | 55.9 | 111.9(-56.0)#61 | 0.0(+55.9)#1,753 |
| 62. | Imperial | 61.1 | 111.9(-50.8)#62 | 0.0(+61.1)#1,883 |
| 63. | Trinidad | 61.7 | 111.9(-50.3)#63 | 0.0(+61.7)#1,896 |
| 64. | Kingsbury | 61.9 | 111.9(-50.0)#64 | 0.0(+61.9)#1,907 |
| 65. | Sandy Hollow Escondidas | 62.1 | 111.9(-49.8)#65 | 0.0(+62.1)#1,910 |
| 66. | Zuehl | 62.3 | 111.9(-49.7)#66 | 0.0(+62.3)#1,920 |
| 67. | Buchanan Dam | 62.9 | 111.9(-49.0)#67 | 0.0(+62.9)#1,944 |
| 68. | Fort Hancock | 63.1 | 111.9(-48.8)#68 | 0.0(+63.1)#1,948 |
| 69. | South Toledo Bend | 65.2 | 111.9(-46.8)#69 | 0.0(+65.2)#1,997 |
| 70. | Todd Mission | 66.1 | 111.9(-45.9)#70 | 0.0(+66.1)#2,023 |
| 71. | Ratamosa | 66.3 | 111.9(-45.7)#71 | 0.0(+66.3)#2,029 |
| 72. | Radar Base | 66.5 | 111.9(-45.5)#72 | 0.0(+66.5)#2,035 |
| 73. | Tuleta | 66.5 | 111.9(-45.4)#73 | 0.0(+66.5)#2,039 |
| 74. | Dodson | 67.3 | 111.9(-44.6)#74 | 0.0(+67.3)#2,069 |
| 75. | Aguilares | 69.6 | 111.9(-42.3)#75 | 0.0(+69.6)#2,120 |
| 76. | Scotland | 70.0 | 111.9(-41.9)#76 | 0.0(+70.0)#2,132 |
| 77. | Butterfield | 70.1 | 111.9(-41.9)#77 | 0.0(+70.1)#2,133 |
| 78. | Tierra Bonita | 70.4 | 111.9(-41.5)#78 | 0.0(+70.4)#2,147 |
| 79. | Dayton Lakes | 71.1 | 111.9(-40.8)#79 | 0.0(+71.1)#2,172 |
| 80. | Airport Road Addition | 71.4 | 111.9(-40.5)#80 | 0.0(+71.4)#2,179 |
| 81. | Putnam | 72.0 | 111.9(-39.9)#81 | 0.0(+72.0)#2,198 |
| 82. | Hungerford | 72.7 | 111.9(-39.2)#82 | 0.0(+72.7)#2,214 |
| 83. | La Paloma Lost Creek | 73.7 | 111.9(-38.2)#83 | 0.0(+73.7)#2,243 |
| 84. | Hartley | 73.8 | 111.9(-38.2)#84 | 0.0(+73.8)#2,244 |
| 85. | Cool | 73.9 | 111.9(-38.1)#85 | 0.0(+73.9)#2,248 |
| 86. | St Hedwig | 75.3 | 111.9(-36.6)#86 | 0.0(+75.3)#2,297 |
| 87. | Utopia | 77.0 | 111.9(-34.9)#87 | 0.0(+77.0)#2,358 |
| 88. | Damon | 77.4 | 111.9(-34.6)#88 | 0.0(+77.4)#2,363 |
| 89. | Gallatin | 77.8 | 111.9(-34.2)#89 | 0.0(+77.8)#2,374 |
| 90. | Boys Ranch | 78.4 | 111.9(-33.5)#90 | 0.0(+78.4)#2,393 |
| 91. | Arroyo Gardens | 79.2 | 111.9(-32.7)#91 | 0.0(+79.2)#2,410 |
| 92. | New Berlin | 79.3 | 111.9(-32.7)#92 | 0.0(+79.3)#2,412 |
| 93. | Hitchcock | 80.8 | 111.9(-31.1)#93 | 0.0(+80.8)#2,464 |
| 94. | Los Veteranos Ii | 81.5 | 111.9(-30.4)#94 | 0.0(+81.5)#2,479 |
| 95. | San Isidro | 81.9 | 111.9(-30.0)#95 | 0.0(+81.9)#2,489 |
| 96. | Tynan | 83.5 | 111.9(-28.4)#96 | 0.0(+83.5)#2,521 |
| 97. | Hilltop Lakes | 84.2 | 111.9(-27.8)#97 | 0.0(+84.2)#2,538 |
| 98. | Rancho Banquete | 84.5 | 111.9(-27.4)#98 | 0.0(+84.5)#2,556 |
| 99. | Los Ybanez | 84.9 | 111.9(-27.1)#99 | 0.0(+84.9)#2,561 |
| 100. | Myrtle Springs | 85.2 | 111.9(-26.8)#100 | 0.0(+85.2)#2,570 |
Common Questions
What are the Top 10 Cities with the Lowest Population Density in Texas?
Top 10 Cities with the Lowest Population Density in Texas are:
#1
1.5
#2
2.6
#3
4.3
#4
6.3
#5
6.8
#6
8.0
#7
8.0
#8
11.2
#9
12.9
#10
13.5
What city has the Lowest Population Density in Texas?
Elbert has the Lowest Population Density in Texas with 1.5.
What is the Population Density in the State of Texas?
Population Density in Texas is 111.9.