Cities with the Lowest Population Density in South Carolina
RELATED REPORTS & OPTIONS
Lowest Population Density
South Carolina
Compare Cities
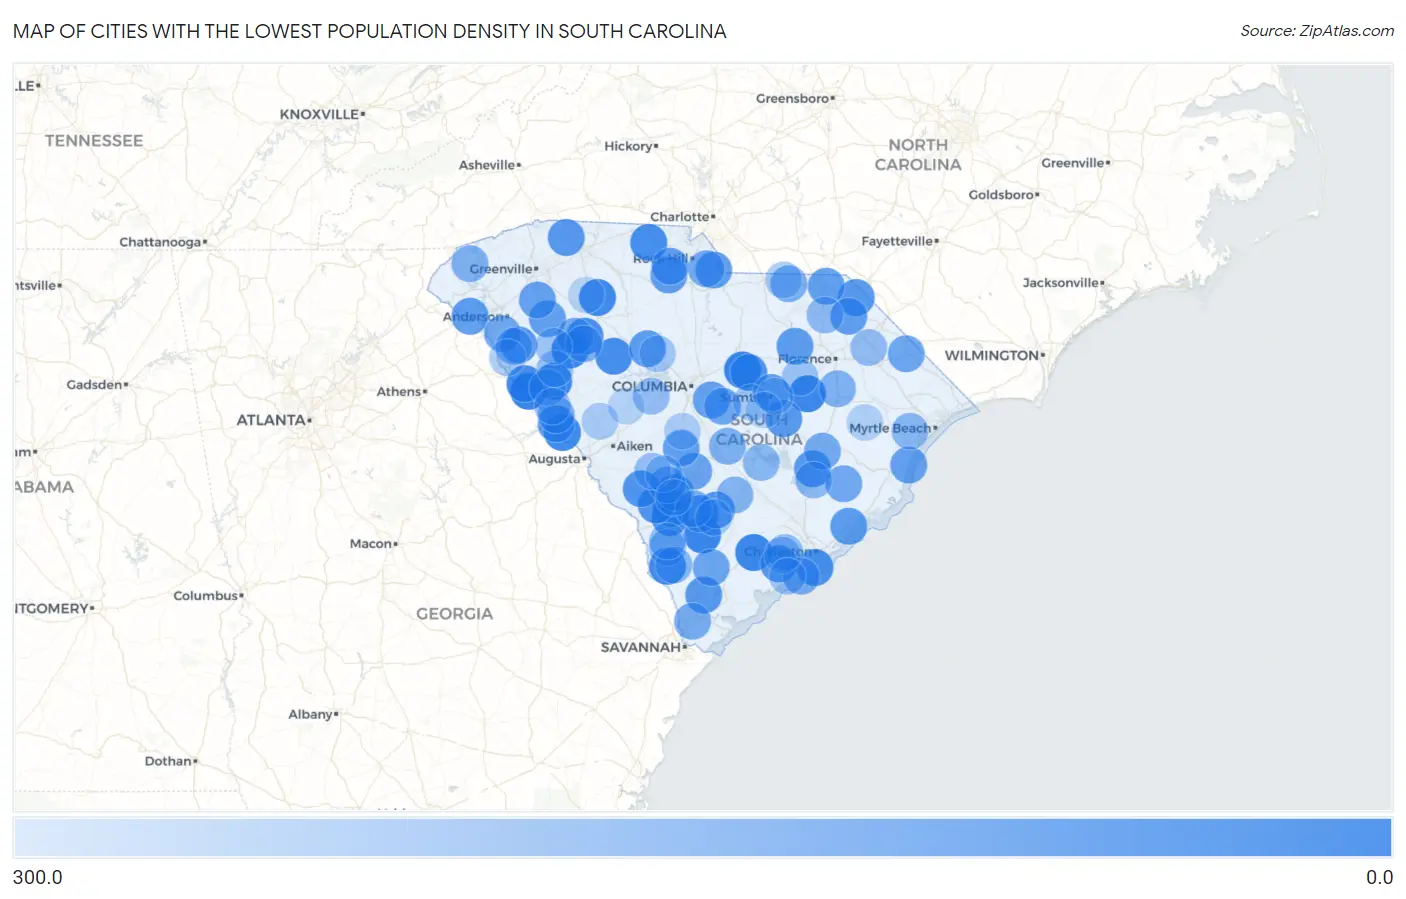
Map of Cities with the Lowest Population Density in South Carolina
300.0
0.0
Cities with the Lowest Population Density in South Carolina
| City | People / Sq Mi | vs State | vs National | |
| 1. | Willington | 13.3 | 171.0(-158)#1 | 0.0(+13.3)#448 |
| 2. | Islandton | 14.4 | 171.0(-157)#2 | 0.0(+14.4)#488 |
| 3. | Boykin | 15.4 | 171.0(-156)#3 | 0.0(+15.4)#523 |
| 4. | Jacksonboro | 18.7 | 171.0(-152)#4 | 0.0(+18.7)#635 |
| 5. | Coronaca | 19.1 | 171.0(-152)#5 | 0.0(+19.1)#648 |
| 6. | Shiloh | 19.9 | 171.0(-151)#6 | 0.0(+19.9)#676 |
| 7. | Bradley | 20.7 | 171.0(-150)#7 | 0.0(+20.7)#700 |
| 8. | Clarks Hill | 24.5 | 171.0(-147)#8 | 0.0(+24.5)#834 |
| 9. | Sycamore | 29.5 | 171.0(-141)#9 | 0.0(+29.5)#998 |
| 10. | Cross Anchor | 32.1 | 171.0(-139)#10 | 0.0(+32.1)#1,077 |
| 11. | Ulmer | 33.4 | 171.0(-138)#11 | 0.0(+33.4)#1,111 |
| 12. | Scotia | 35.1 | 171.0(-136)#12 | 0.0(+35.1)#1,165 |
| 13. | Smyrna | 39.7 | 171.0(-131)#13 | 0.0(+39.7)#1,286 |
| 14. | Mount Carmel | 41.3 | 171.0(-130)#14 | 0.0(+41.3)#1,333 |
| 15. | Silverstreet | 43.9 | 171.0(-127)#15 | 0.0(+43.9)#1,417 |
| 16. | Mountville | 47.0 | 171.0(-124)#16 | 0.0(+47.0)#1,508 |
| 17. | Lodge | 54.0 | 171.0(-117)#17 | 0.0(+54.0)#1,700 |
| 18. | Folly Beach | 54.1 | 171.0(-117)#18 | 0.0(+54.1)#1,705 |
| 19. | Kline | 62.2 | 171.0(-109)#19 | 0.0(+62.2)#1,919 |
| 20. | Snelling | 64.1 | 171.0(-107)#20 | 0.0(+64.1)#1,973 |
| 21. | Rembert | 66.5 | 171.0(-105)#21 | 0.0(+66.5)#2,038 |
| 22. | Meggett | 71.9 | 171.0(-99.2)#22 | 0.0(+71.9)#2,191 |
| 23. | Antreville | 73.4 | 171.0(-97.6)#23 | 0.0(+73.4)#2,234 |
| 24. | Govan | 74.5 | 171.0(-96.6)#24 | 0.0(+74.5)#2,266 |
| 25. | Russellville | 74.8 | 171.0(-96.3)#25 | 0.0(+74.8)#2,278 |
| 26. | Ridgeland | 76.5 | 171.0(-94.5)#26 | 0.0(+76.5)#2,338 |
| 27. | Smoaks | 76.6 | 171.0(-94.4)#27 | 0.0(+76.6)#2,346 |
| 28. | Gramling | 77.9 | 171.0(-93.1)#28 | 0.0(+77.9)#2,380 |
| 29. | Tatum | 79.3 | 171.0(-91.7)#29 | 0.0(+79.3)#2,413 |
| 30. | Modoc | 83.9 | 171.0(-87.1)#30 | 0.0(+83.9)#2,534 |
| 31. | Alcolu | 84.3 | 171.0(-86.8)#31 | 0.0(+84.3)#2,544 |
| 32. | Fair Play | 84.6 | 171.0(-86.4)#32 | 0.0(+84.6)#2,558 |
| 33. | Lydia | 85.9 | 171.0(-85.1)#33 | 0.0(+85.9)#2,595 |
| 34. | Van Wyck | 86.1 | 171.0(-85.0)#34 | 0.0(+86.1)#2,602 |
| 35. | Pomaria | 86.5 | 171.0(-84.5)#35 | 0.0(+86.5)#2,614 |
| 36. | Awendaw | 88.1 | 171.0(-82.9)#36 | 0.0(+88.1)#2,660 |
| 37. | Mulberry | 92.9 | 171.0(-78.1)#37 | 0.0(+92.9)#2,772 |
| 38. | Lowrys | 94.0 | 171.0(-77.1)#38 | 0.0(+94.0)#2,809 |
| 39. | Mcconnells | 94.4 | 171.0(-76.7)#39 | 0.0(+94.4)#2,817 |
| 40. | Blenheim | 96.6 | 171.0(-74.5)#40 | 0.0(+96.6)#2,870 |
| 41. | Wallace | 98.9 | 171.0(-72.2)#41 | 0.0(+98.9)#2,920 |
| 42. | Princeton | 100.0 | 171.0(-71.0)#42 | 0.0(+100.0)#2,954 |
| 43. | Pawleys Island | 104.9 | 171.0(-66.2)#43 | 0.0(+105)#3,082 |
| 44. | Ware Place | 105.0 | 171.0(-66.1)#44 | 0.0(+105)#3,083 |
| 45. | Hopkins | 105.1 | 171.0(-65.9)#45 | 0.0(+105)#3,084 |
| 46. | Cope | 112.1 | 171.0(-59.0)#46 | 0.0(+112)#3,274 |
| 47. | Gadsden | 119.5 | 171.0(-51.5)#47 | 0.0(+119)#3,443 |
| 48. | Nichols | 119.8 | 171.0(-51.2)#48 | 0.0(+120)#3,449 |
| 49. | Yemassee | 119.9 | 171.0(-51.1)#49 | 0.0(+120)#3,451 |
| 50. | Jamestown | 128.5 | 171.0(-42.5)#50 | 0.0(+128)#3,657 |
| 51. | Starr | 129.3 | 171.0(-41.7)#51 | 0.0(+129)#3,677 |
| 52. | Lane | 136.4 | 171.0(-34.6)#52 | 0.0(+136)#3,838 |
| 53. | Waterloo | 136.9 | 171.0(-34.1)#53 | 0.0(+137)#3,849 |
| 54. | Hilda | 138.3 | 171.0(-32.7)#54 | 0.0(+138)#3,876 |
| 55. | Catawba | 138.8 | 171.0(-32.2)#55 | 0.0(+139)#3,887 |
| 56. | Kiawah Island | 140.3 | 171.0(-30.7)#56 | 0.0(+140)#3,917 |
| 57. | Hardeeville | 141.5 | 171.0(-29.5)#57 | 0.0(+142)#3,950 |
| 58. | Parksville | 142.8 | 171.0(-28.3)#58 | 0.0(+143)#3,973 |
| 59. | Ruby | 145.4 | 171.0(-25.6)#59 | 0.0(+145)#4,032 |
| 60. | Ehrhardt | 148.4 | 171.0(-22.6)#60 | 0.0(+148)#4,115 |
| 61. | Cameron | 155.5 | 171.0(-15.5)#61 | 0.0(+155)#4,267 |
| 62. | Salem | 158.6 | 171.0(-12.5)#62 | 0.0(+159)#4,345 |
| 63. | Coward | 160.8 | 171.0(-10.2)#63 | 0.0(+161)#4,392 |
| 64. | Cross Hill | 163.8 | 171.0(-7.19)#64 | 0.0(+164)#4,465 |
| 65. | Reevesville | 166.8 | 171.0(-4.25)#65 | 0.0(+167)#4,549 |
| 66. | Lake Secession | 169.0 | 171.0(-2.01)#66 | 0.0(+169)#4,595 |
| 67. | Luray | 170.3 | 171.0(-0.689)#67 | 0.0(+170)#4,628 |
| 68. | Bucksport | 176.0 | 171.0(+4.95)#68 | 0.0(+176)#4,749 |
| 69. | Furman | 179.2 | 171.0(+8.18)#69 | 0.0(+179)#4,820 |
| 70. | Vance | 183.6 | 171.0(+12.5)#70 | 0.0(+184)#4,941 |
| 71. | Bonneau | 186.8 | 171.0(+15.8)#71 | 0.0(+187)#5,007 |
| 72. | Society Hill | 189.7 | 171.0(+18.7)#72 | 0.0(+190)#5,068 |
| 73. | Ravenel | 194.9 | 171.0(+23.9)#73 | 0.0(+195)#5,182 |
| 74. | Livingston | 195.8 | 171.0(+24.8)#74 | 0.0(+196)#5,199 |
| 75. | Sellers | 198.5 | 171.0(+27.5)#75 | 0.0(+199)#5,252 |
| 76. | Elko | 203.0 | 171.0(+32.0)#76 | 0.0(+203)#5,351 |
| 77. | Gilbert | 203.1 | 171.0(+32.0)#77 | 0.0(+203)#5,355 |
| 78. | Troy | 206.4 | 171.0(+35.3)#78 | 0.0(+206)#5,422 |
| 79. | Gifford | 207.9 | 171.0(+36.9)#79 | 0.0(+208)#5,446 |
| 80. | Plum Branch | 211.6 | 171.0(+40.6)#80 | 0.0(+212)#5,529 |
| 81. | Promised Land | 214.0 | 171.0(+43.0)#81 | 0.0(+214)#5,594 |
| 82. | Neeses | 214.1 | 171.0(+43.0)#82 | 0.0(+214)#5,596 |
| 83. | Hollywood | 216.2 | 171.0(+45.2)#83 | 0.0(+216)#5,634 |
| 84. | Lynchburg | 218.2 | 171.0(+47.2)#84 | 0.0(+218)#5,668 |
| 85. | Hodges | 221.0 | 171.0(+49.9)#85 | 0.0(+221)#5,726 |
| 86. | Rockville | 221.3 | 171.0(+50.3)#86 | 0.0(+221)#5,732 |
| 87. | Blackville | 224.9 | 171.0(+53.9)#87 | 0.0(+225)#5,802 |
| 88. | Olar | 227.9 | 171.0(+56.8)#88 | 0.0(+228)#5,853 |
| 89. | Peak | 229.8 | 171.0(+58.7)#89 | 0.0(+230)#5,887 |
| 90. | Mount Croghan | 233.2 | 171.0(+62.2)#90 | 0.0(+233)#5,956 |
| 91. | Wedgefield | 237.1 | 171.0(+66.1)#91 | 0.0(+237)#6,028 |
| 92. | Lowndesville | 237.6 | 171.0(+66.5)#92 | 0.0(+238)#6,038 |
| 93. | East Sumter | 238.0 | 171.0(+66.9)#93 | 0.0(+238)#6,049 |
| 94. | Williams | 239.6 | 171.0(+68.6)#94 | 0.0(+240)#6,086 |
| 95. | Trenton | 242.2 | 171.0(+71.2)#95 | 0.0(+242)#6,135 |
| 96. | Woodford | 249.1 | 171.0(+78.1)#96 | 0.0(+249)#6,269 |
| 97. | Stuckey | 259.9 | 171.0(+88.9)#97 | 0.0(+260)#6,481 |
| 98. | Privateer | 266.1 | 171.0(+95.0)#98 | 0.0(+266)#6,598 |
| 99. | Monetta | 267.0 | 171.0(+96.0)#99 | 0.0(+267)#6,624 |
| 100. | Enoree | 272.3 | 171.0(+101)#100 | 0.0(+272)#6,731 |
Common Questions
What are the Top 10 Cities with the Lowest Population Density in South Carolina?
Top 10 Cities with the Lowest Population Density in South Carolina are:
#1
13.3
#2
14.4
#3
15.4
#4
18.7
#5
19.1
#6
19.9
#7
20.7
#8
24.5
#9
29.5
#10
32.1
What city has the Lowest Population Density in South Carolina?
Willington has the Lowest Population Density in South Carolina with 13.3.
What is the Population Density in the State of South Carolina?
Population Density in South Carolina is 171.0.