States with the Lowest Population Density
RELATED REPORTS & OPTIONS
Lowest Population Density
United States
Compare States
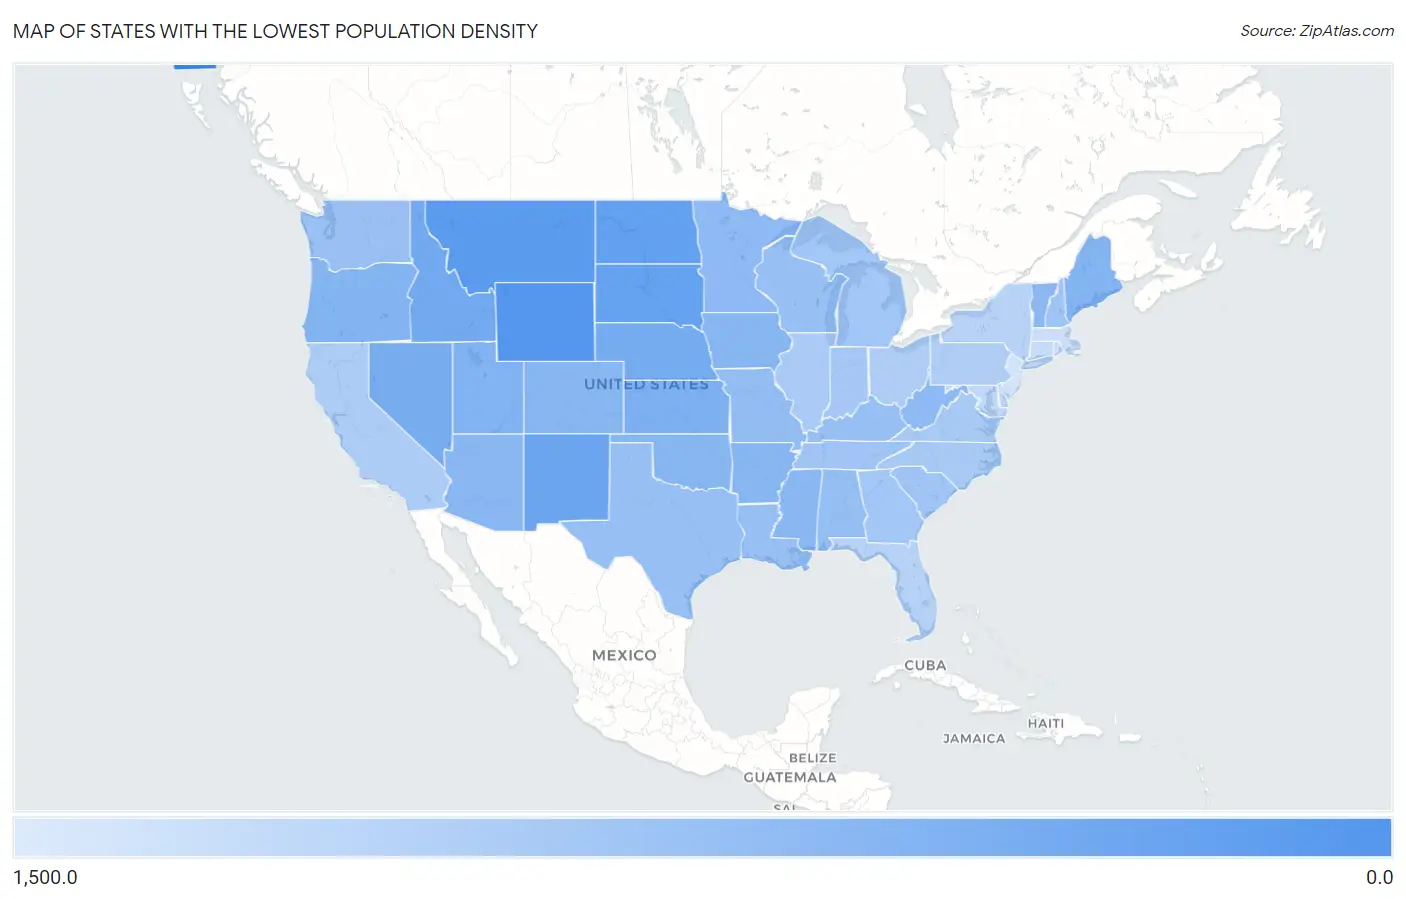
Map of States with the Lowest Population Density
1,500.0
0.0
States with the Lowest Population Density in the United States
| State | People / Sq Mi | vs State Median | vs National | |
| 1. | Alaska | 1.3 | 108.0 (-107) | 0.0(+1.29) |
| 2. | Wyoming | 6.0 | 108.0 (-102) | 0.0(+5.95) |
| 3. | Montana | 7.5 | 108.0 (-101) | 0.0(+7.50) |
| 4. | North Dakota | 11.3 | 108.0 (-96.8) | 0.0(+11.3) |
| 5. | South Dakota | 11.7 | 108.0 (-96.3) | 0.0(+11.7) |
| 6. | New Mexico | 17.4 | 108.0 (-90.6) | 0.0(+17.4) |
| 7. | Idaho | 22.4 | 108.0 (-85.6) | 0.0(+22.4) |
| 8. | Nebraska | 25.5 | 108.0 (-82.5) | 0.0(+25.5) |
| 9. | Nevada | 28.3 | 108.0 (-79.7) | 0.0(+28.3) |
| 10. | Kansas | 35.9 | 108.0 (-72.1) | 0.0(+35.9) |
| 11. | Utah | 40.0 | 108.0 (-68.1) | 0.0(+40.0) |
| 12. | Oregon | 44.1 | 108.0 (-64.0) | 0.0(+44.1) |
| 13. | Maine | 44.3 | 108.0 (-63.7) | 0.0(+44.3) |
| 14. | Colorado | 55.7 | 108.0 (-52.3) | 0.0(+55.7) |
| 15. | Iowa | 57.1 | 108.0 (-50.9) | 0.0(+57.1) |
| 16. | Oklahoma | 57.9 | 108.0 (-50.1) | 0.0(+57.9) |
| 17. | Arkansas | 58.0 | 108.0 (-50.0) | 0.0(+58.0) |
| 18. | Mississippi | 63.1 | 108.0 (-45.0) | 0.0(+63.1) |
| 19. | Arizona | 63.1 | 108.0 (-44.9) | 0.0(+63.1) |
| 20. | Vermont | 69.9 | 108.0 (-38.2) | 0.0(+69.9) |
| 21. | Minnesota | 71.5 | 108.0 (-36.5) | 0.0(+71.5) |
| 22. | West Virginia | 74.6 | 108.0 (-33.4) | 0.0(+74.6) |
| 23. | Missouri | 89.6 | 108.0 (-18.5) | 0.0(+89.6) |
| 24. | Alabama | 99.3 | 108.0 (-8.74) | 0.0(+99.3) |
| 25. | Louisiana | 107.4 | 108.0 (-0.598) | 0.0(+107) |
| 26. | Wisconsin | 108.6 | 108.0 (+0.598) | 0.0(+109) |
| 27. | Texas | 111.9 | 108.0 (+3.93) | 0.0(+112) |
| 28. | Kentucky | 114.0 | 108.0 (+6.00) | 0.0(+114) |
| 29. | Washington | 115.7 | 108.0 (+7.69) | 0.0(+116) |
| 30. | New Hampshire | 154.1 | 108.0 (+46.1) | 0.0(+154) |
| 31. | Tennessee | 167.9 | 108.0 (+59.9) | 0.0(+168) |
| 32. | South Carolina | 171.0 | 108.0 (+63.0) | 0.0(+171) |
| 33. | Michigan | 177.9 | 108.0 (+69.9) | 0.0(+178) |
| 34. | Georgia | 186.5 | 108.0 (+78.5) | 0.0(+186) |
| 35. | Indiana | 189.4 | 108.0 (+81.4) | 0.0(+189) |
| 36. | North Carolina | 215.4 | 108.0 (+107) | 0.0(+215) |
| 37. | Virginia | 218.4 | 108.0 (+110) | 0.0(+218) |
| 38. | Hawaii | 225.7 | 108.0 (+118) | 0.0(+226) |
| 39. | Illinois | 229.8 | 108.0 (+122) | 0.0(+230) |
| 40. | California | 252.7 | 108.0 (+145) | 0.0(+253) |
| 41. | Ohio | 288.2 | 108.0 (+180) | 0.0(+288) |
| 42. | Pennsylvania | 290.3 | 108.0 (+182) | 0.0(+290) |
| 43. | Florida | 403.6 | 108.0 (+296) | 0.0(+404) |
| 44. | New York | 424.3 | 108.0 (+316) | 0.0(+424) |
| 45. | Delaware | 509.8 | 108.0 (+402) | 0.0(+510) |
| 46. | Maryland | 634.9 | 108.0 (+527) | 0.0(+635) |
| 47. | Connecticut | 746.1 | 108.0 (+638) | 0.0(+746) |
| 48. | Massachusetts | 895.3 | 108.0 (+787) | 0.0(+895) |
| 49. | Rhode Island | 1,058.3 | 108.0 (+950) | 0.0(+1.06k) |
| 50. | New Jersey | 1,257.7 | 108.0 (+1.15k) | 0.0(+1.26k) |
1
Common Questions
What are the Top 10 States with the Lowest Population Density in the United States?
Top 10 States with the Lowest Population Density in the United States are:
#1
1.3
#2
6.0
#3
7.5
#4
11.3
#5
11.7
#6
17.4
#7
22.4
#8
25.5
#9
28.3
#10
35.9
What state has the Lowest Population Density in the United States?
Alaska has the Lowest Population Density in the United States with 1.3.