Zip Codes with the Highest Percentage of Population with a Degree in Visual and Performing Arts in West Hartford, CT
RELATED REPORTS & OPTIONS
Visual and Performing Arts
West Hartford
Compare Zip Codes
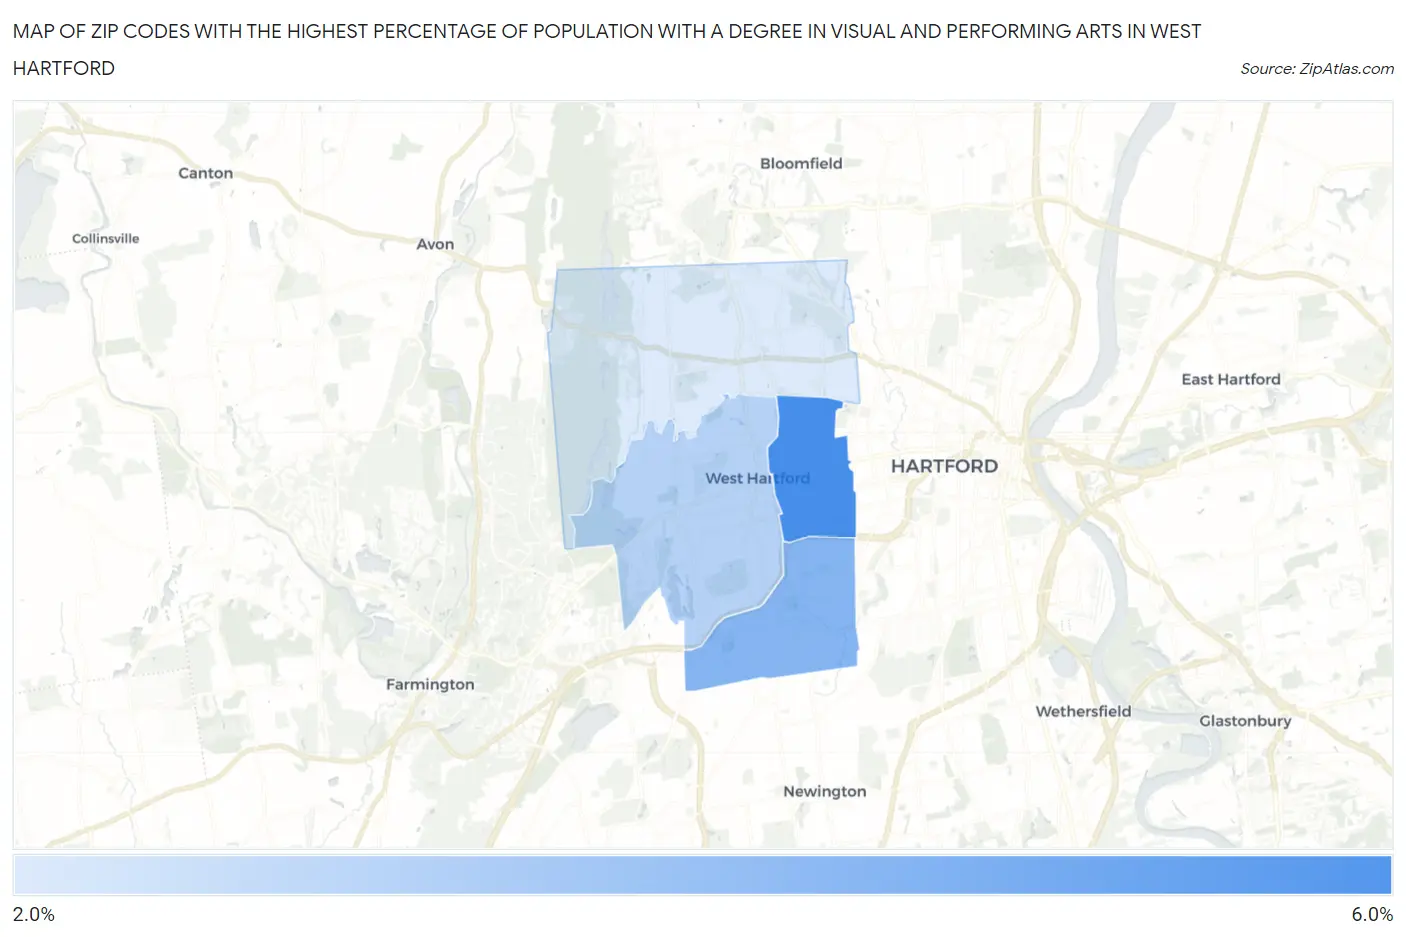
Map of Zip Codes with the Highest Percentage of Population with a Degree in Visual and Performing Arts in West Hartford
2.5%
5.6%
Zip Codes with the Highest Percentage of Population with a Degree in Visual and Performing Arts in West Hartford, CT
| Zip Code | % Graduates | vs State | vs National | |
| 1. | 06119 | 5.6% | 4.7%(+0.884)#92 | 4.3%(+1.35)#5,500 |
| 2. | 06110 | 4.3% | 4.7%(-0.404)#145 | 4.3%(+0.062)#8,312 |
| 3. | 06107 | 3.3% | 4.7%(-1.43)#184 | 4.3%(-0.961)#11,648 |
| 4. | 06117 | 2.5% | 4.7%(-2.23)#211 | 4.3%(-1.77)#14,683 |
1
Common Questions
What are the Top 3 Zip Codes with the Highest Percentage of Population with a Degree in Visual and Performing Arts in West Hartford, CT?
Top 3 Zip Codes with the Highest Percentage of Population with a Degree in Visual and Performing Arts in West Hartford, CT are:
What zip code has the Highest Percentage of Population with a Degree in Visual and Performing Arts in West Hartford, CT?
06119 has the Highest Percentage of Population with a Degree in Visual and Performing Arts in West Hartford, CT with 5.6%.
What is the Percentage of Population with a Degree in Visual and Performing Arts in West Hartford, CT?
Percentage of Population with a Degree in Visual and Performing Arts in West Hartford is 3.9%.
What is the Percentage of Population with a Degree in Visual and Performing Arts in Connecticut?
Percentage of Population with a Degree in Visual and Performing Arts in Connecticut is 4.7%.
What is the Percentage of Population with a Degree in Visual and Performing Arts in the United States?
Percentage of Population with a Degree in Visual and Performing Arts in the United States is 4.3%.