Zip Codes with the Highest Percentage of Population with a Degree in Visual and Performing Arts in Greenwich, CT
RELATED REPORTS & OPTIONS
Visual and Performing Arts
Greenwich
Compare Zip Codes
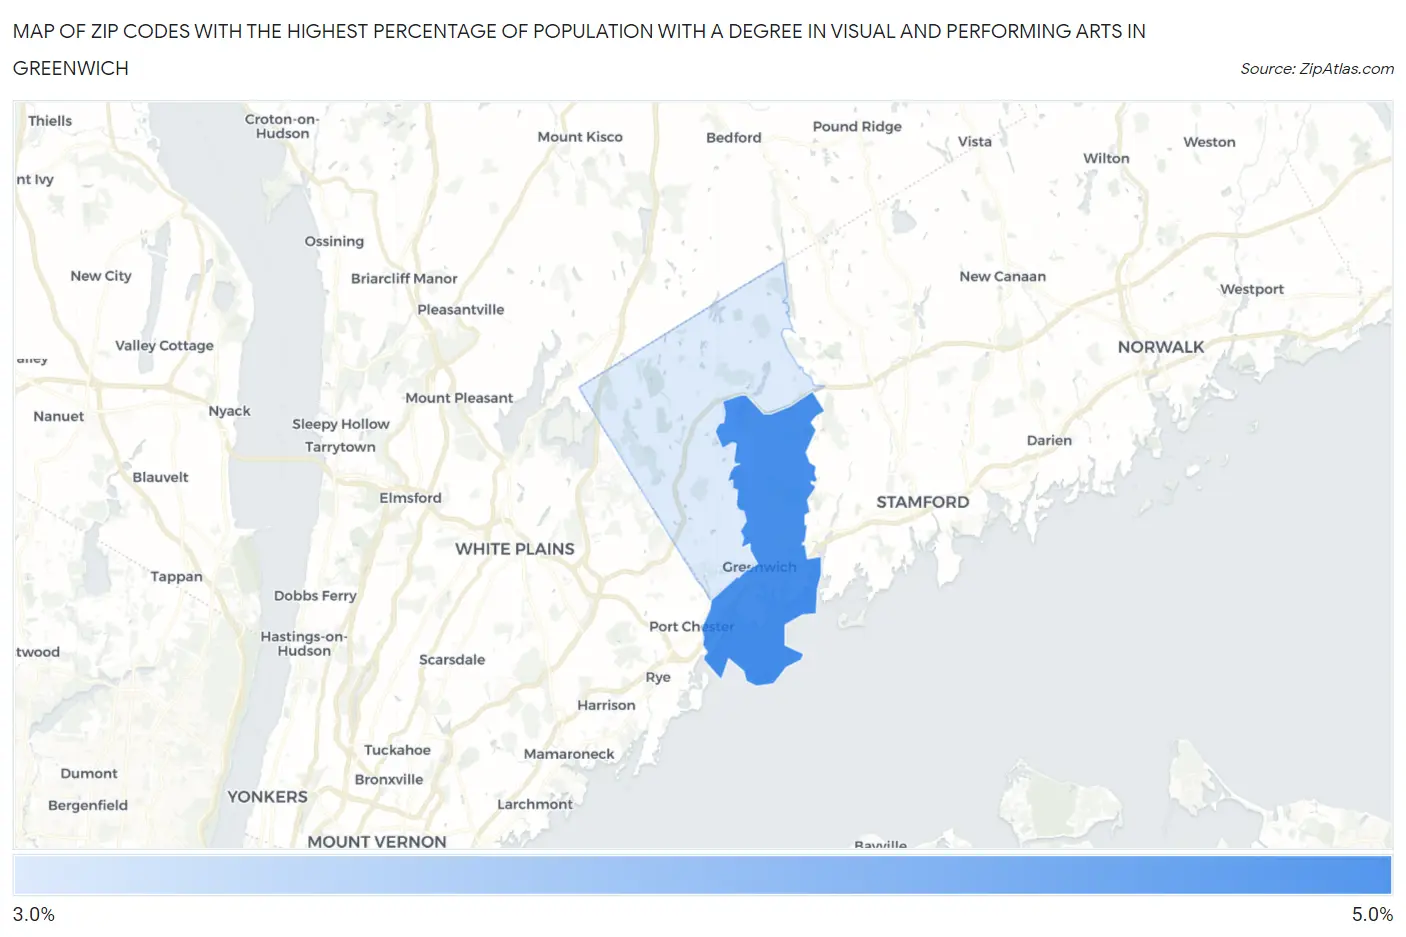
Map of Zip Codes with the Highest Percentage of Population with a Degree in Visual and Performing Arts in Greenwich
3.6%
4.3%
Zip Codes with the Highest Percentage of Population with a Degree in Visual and Performing Arts in Greenwich, CT
| Zip Code | % Graduates | vs State | vs National | |
| 1. | 06830 | 4.3% | 4.7%(-0.368)#143 | 4.3%(+0.098)#8,208 |
| 2. | 06831 | 3.6% | 4.7%(-1.14)#175 | 4.3%(-0.671)#10,557 |
1
Common Questions
What are the Top Zip Codes with the Highest Percentage of Population with a Degree in Visual and Performing Arts in Greenwich, CT?
Top Zip Codes with the Highest Percentage of Population with a Degree in Visual and Performing Arts in Greenwich, CT are:
What zip code has the Highest Percentage of Population with a Degree in Visual and Performing Arts in Greenwich, CT?
06830 has the Highest Percentage of Population with a Degree in Visual and Performing Arts in Greenwich, CT with 4.3%.
What is the Percentage of Population with a Degree in Visual and Performing Arts in Greenwich, CT?
Percentage of Population with a Degree in Visual and Performing Arts in Greenwich is 5.3%.
What is the Percentage of Population with a Degree in Visual and Performing Arts in Connecticut?
Percentage of Population with a Degree in Visual and Performing Arts in Connecticut is 4.7%.
What is the Percentage of Population with a Degree in Visual and Performing Arts in the United States?
Percentage of Population with a Degree in Visual and Performing Arts in the United States is 4.3%.