Zip Codes with the Highest Percentage of Population with a Degree in Visual and Performing Arts in Stratford, CT
RELATED REPORTS & OPTIONS
Visual and Performing Arts
Stratford
Compare Zip Codes
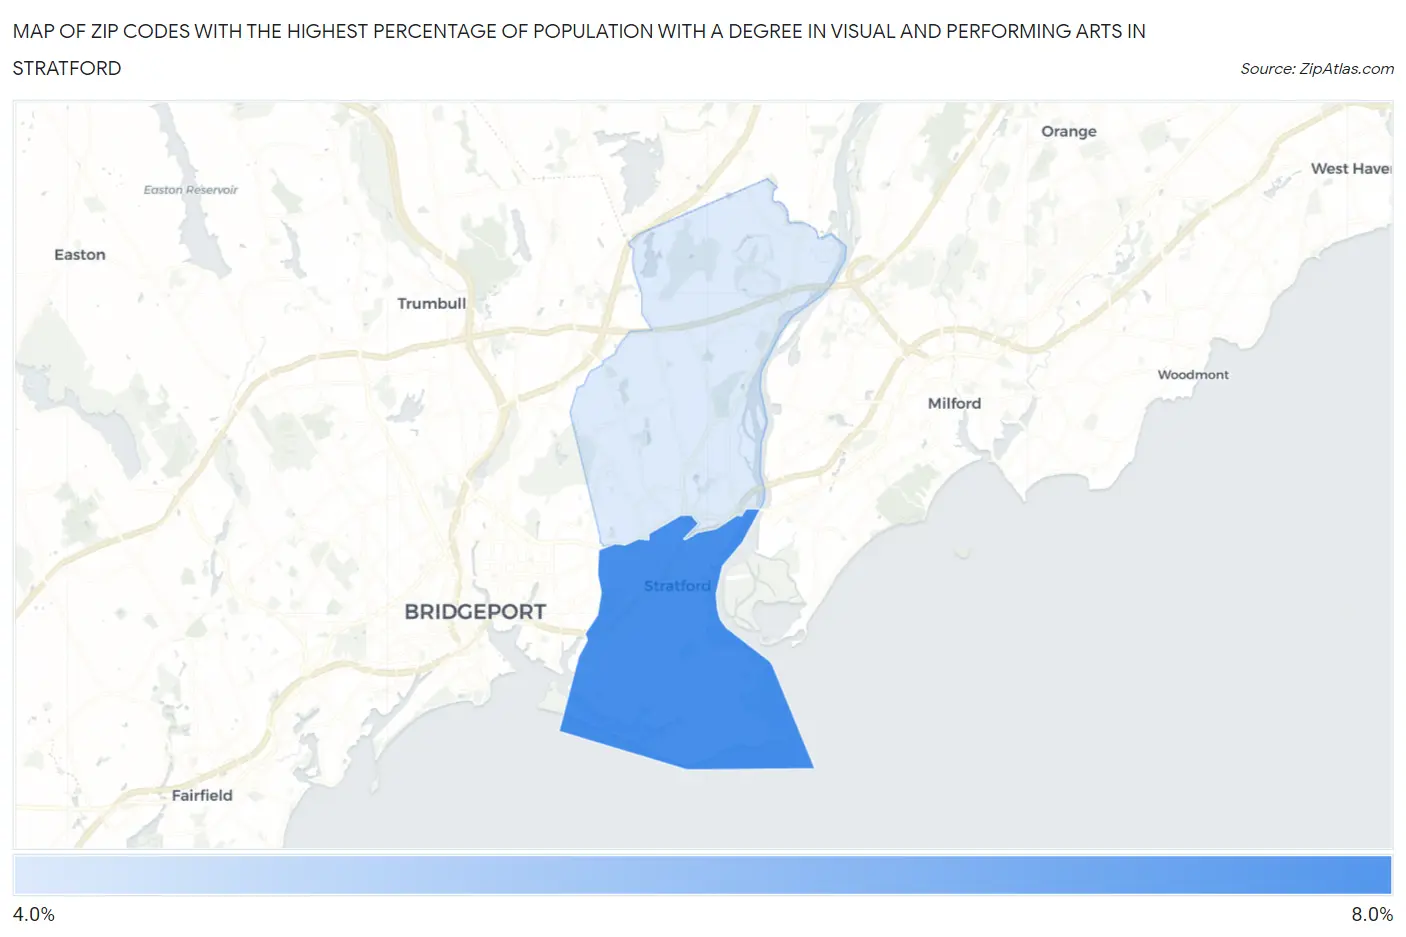
Map of Zip Codes with the Highest Percentage of Population with a Degree in Visual and Performing Arts in Stratford
5.0%
7.1%
Zip Codes with the Highest Percentage of Population with a Degree in Visual and Performing Arts in Stratford, CT
| Zip Code | % Graduates | vs State | vs National | |
| 1. | 06615 | 7.1% | 4.7%(+2.37)#49 | 4.3%(+2.84)#3,572 |
| 2. | 06614 | 5.0% | 4.7%(+0.254)#116 | 4.3%(+0.720)#6,712 |
1
Common Questions
What are the Top Zip Codes with the Highest Percentage of Population with a Degree in Visual and Performing Arts in Stratford, CT?
Top Zip Codes with the Highest Percentage of Population with a Degree in Visual and Performing Arts in Stratford, CT are:
What zip code has the Highest Percentage of Population with a Degree in Visual and Performing Arts in Stratford, CT?
06615 has the Highest Percentage of Population with a Degree in Visual and Performing Arts in Stratford, CT with 7.1%.
What is the Percentage of Population with a Degree in Visual and Performing Arts in Connecticut?
Percentage of Population with a Degree in Visual and Performing Arts in Connecticut is 4.7%.
What is the Percentage of Population with a Degree in Visual and Performing Arts in the United States?
Percentage of Population with a Degree in Visual and Performing Arts in the United States is 4.3%.