Waipahu, HI Map & Demographics
Waipahu Map
Waipahu Overview
$28,426
PER CAPITA INCOME
$94,742
AVG FAMILY INCOME
$87,961
AVG HOUSEHOLD INCOME
17.1%
WAGE / INCOME GAP [ % ]
82.9¢/ $1
WAGE / INCOME GAP [ $ ]
$9,762
FAMILY INCOME DEFICIT
0.46
INEQUALITY / GINI INDEX
39,873
TOTAL POPULATION
19,297
MALE POPULATION
20,576
FEMALE POPULATION
93.78
MALES / 100 FEMALES
106.63
FEMALES / 100 MALES
39.6
MEDIAN AGE
4.7
AVG FAMILY SIZE
4.4
AVG HOUSEHOLD SIZE
19,389
LABOR FORCE [ PEOPLE ]
60.2%
PERCENT IN LABOR FORCE
4.8%
UNEMPLOYMENT RATE
Waipahu Zip Codes
Waipahu Area Codes
Income in Waipahu
Income Overview in Waipahu
Per Capita Income in Waipahu is $28,426, while median incomes of families and households are $94,742 and $87,961 respectively.
| Characteristic | Number | Measure |
| Per Capita Income | 39,873 | $28,426 |
| Median Family Income | 7,093 | $94,742 |
| Mean Family Income | 7,093 | $123,400 |
| Median Household Income | 8,782 | $87,961 |
| Mean Household Income | 8,782 | $118,706 |
| Income Deficit | 7,093 | $9,762 |
| Wage / Income Gap (%) | 39,873 | 17.12% |
| Wage / Income Gap ($) | 39,873 | 82.88¢ per $1 |
| Gini / Inequality Index | 39,873 | 0.46 |
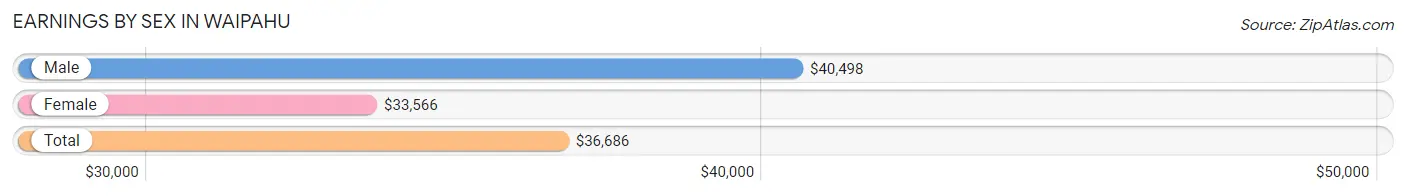
Earnings by Sex in Waipahu
Average Earnings in Waipahu are $36,686, $40,498 for men and $33,566 for women, a difference of 17.1%.
| Sex | Number | Average Earnings |
| Male | 10,110 (51.3%) | $40,498 |
| Female | 9,590 (48.7%) | $33,566 |
| Total | 19,700 (100.0%) | $36,686 |
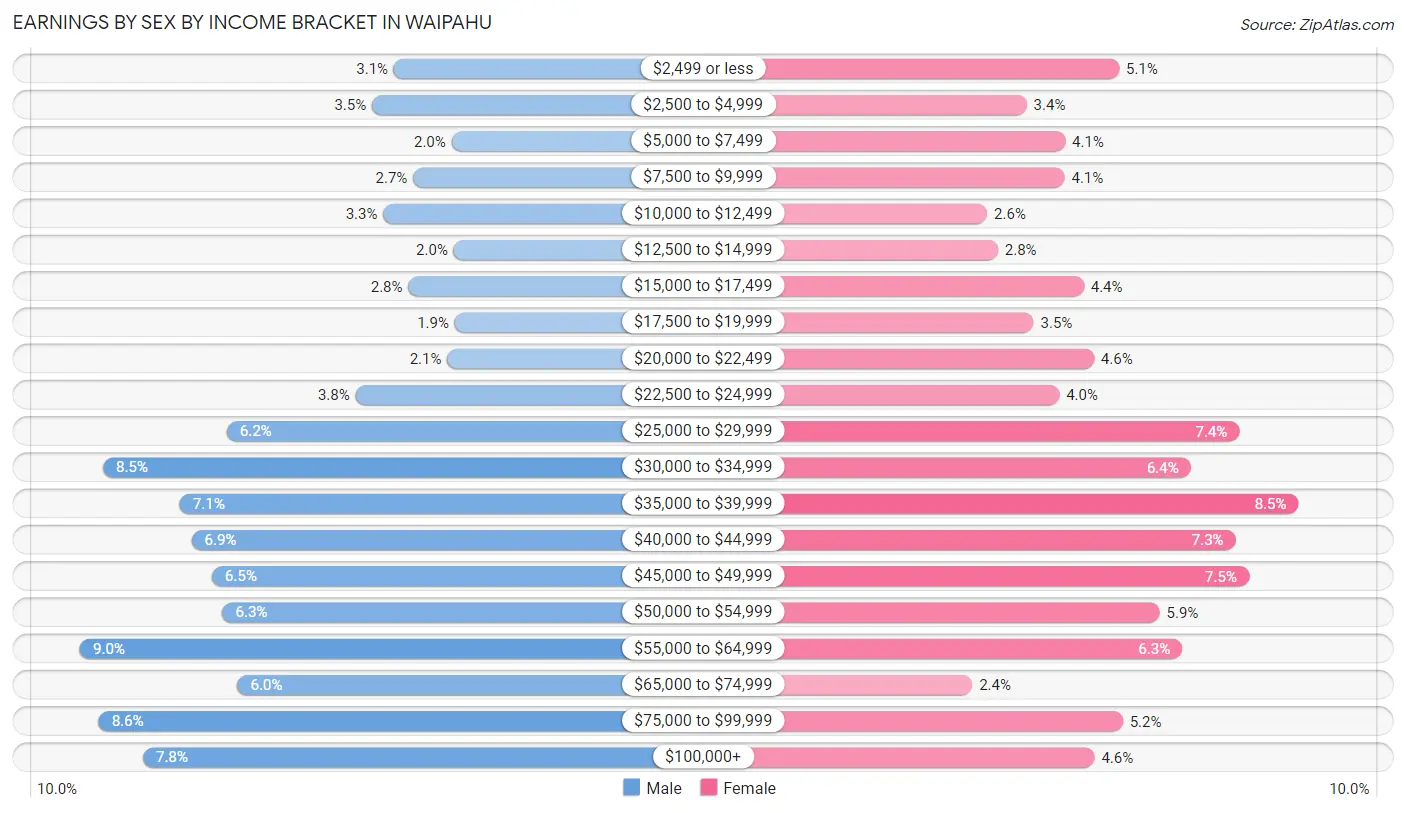
Earnings by Sex by Income Bracket in Waipahu
The most common earnings brackets in Waipahu are $55,000 to $64,999 for men (906 | 9.0%) and $35,000 to $39,999 for women (811 | 8.5%).
| Income | Male | Female |
| $2,499 or less | 311 (3.1%) | 489 (5.1%) |
| $2,500 to $4,999 | 353 (3.5%) | 323 (3.4%) |
| $5,000 to $7,499 | 202 (2.0%) | 392 (4.1%) |
| $7,500 to $9,999 | 275 (2.7%) | 391 (4.1%) |
| $10,000 to $12,499 | 332 (3.3%) | 252 (2.6%) |
| $12,500 to $14,999 | 198 (2.0%) | 271 (2.8%) |
| $15,000 to $17,499 | 284 (2.8%) | 426 (4.4%) |
| $17,500 to $19,999 | 196 (1.9%) | 336 (3.5%) |
| $20,000 to $22,499 | 210 (2.1%) | 444 (4.6%) |
| $22,500 to $24,999 | 384 (3.8%) | 382 (4.0%) |
| $25,000 to $29,999 | 628 (6.2%) | 705 (7.3%) |
| $30,000 to $34,999 | 862 (8.5%) | 618 (6.4%) |
| $35,000 to $39,999 | 717 (7.1%) | 811 (8.5%) |
| $40,000 to $44,999 | 695 (6.9%) | 698 (7.3%) |
| $45,000 to $49,999 | 656 (6.5%) | 722 (7.5%) |
| $50,000 to $54,999 | 636 (6.3%) | 562 (5.9%) |
| $55,000 to $64,999 | 906 (9.0%) | 602 (6.3%) |
| $65,000 to $74,999 | 608 (6.0%) | 225 (2.4%) |
| $75,000 to $99,999 | 870 (8.6%) | 496 (5.2%) |
| $100,000+ | 787 (7.8%) | 445 (4.6%) |
| Total | 10,110 (100.0%) | 9,590 (100.0%) |
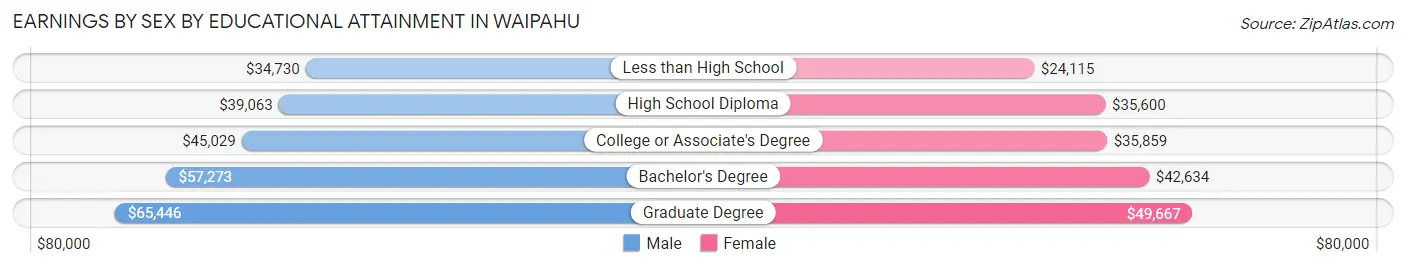
Earnings by Sex by Educational Attainment in Waipahu
Average earnings in Waipahu are $45,113 for men and $36,746 for women, a difference of 18.5%. Men with an educational attainment of graduate degree enjoy the highest average annual earnings of $65,446, while those with less than high school education earn the least with $34,730. Women with an educational attainment of graduate degree earn the most with the average annual earnings of $49,667, while those with less than high school education have the smallest earnings of $24,115.
| Educational Attainment | Male Income | Female Income |
| Less than High School | $34,730 | $24,115 |
| High School Diploma | $39,063 | $35,600 |
| College or Associate's Degree | $45,029 | $35,859 |
| Bachelor's Degree | $57,273 | $42,634 |
| Graduate Degree | $65,446 | $49,667 |
| Total | $45,113 | $36,746 |
Family Income in Waipahu
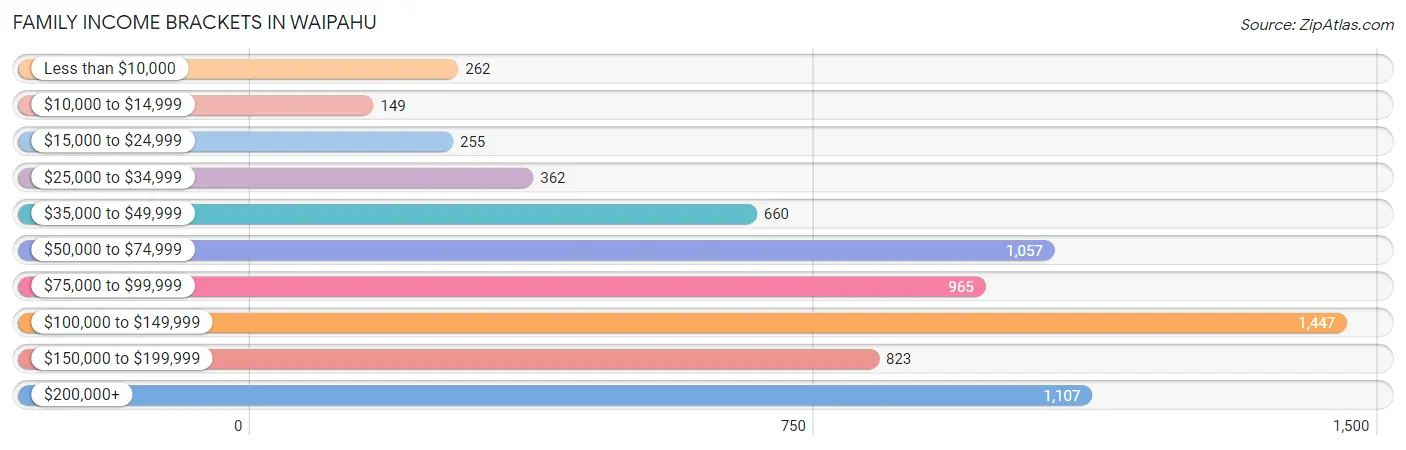
Family Income Brackets in Waipahu
According to the Waipahu family income data, there are 1,447 families falling into the $100,000 to $149,999 income range, which is the most common income bracket and makes up 20.4% of all families. Conversely, the $10,000 to $14,999 income bracket is the least frequent group with only 149 families (2.1%) belonging to this category.
| Income Bracket | # Families | % Families |
| Less than $10,000 | 262 | 3.7% |
| $10,000 to $14,999 | 149 | 2.1% |
| $15,000 to $24,999 | 255 | 3.6% |
| $25,000 to $34,999 | 362 | 5.1% |
| $35,000 to $49,999 | 660 | 9.3% |
| $50,000 to $74,999 | 1,057 | 14.9% |
| $75,000 to $99,999 | 965 | 13.6% |
| $100,000 to $149,999 | 1,447 | 20.4% |
| $150,000 to $199,999 | 823 | 11.6% |
| $200,000+ | 1,107 | 15.6% |
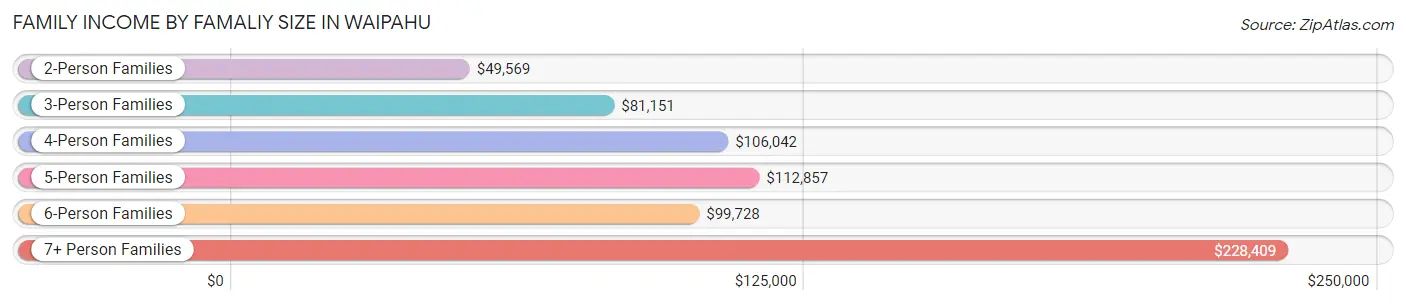
Family Income by Famaliy Size in Waipahu
7+ person families (1,018 | 14.3%) account for the highest median family income in Waipahu with $228,409 per family, while 7+ person families (1,018 | 14.3%) have the highest median income of $32,630 per family member.
| Income Bracket | # Families | Median Income |
| 2-Person Families | 1,486 (20.9%) | $49,569 |
| 3-Person Families | 1,671 (23.6%) | $81,151 |
| 4-Person Families | 1,346 (19.0%) | $106,042 |
| 5-Person Families | 904 (12.7%) | $112,857 |
| 6-Person Families | 668 (9.4%) | $99,728 |
| 7+ Person Families | 1,018 (14.3%) | $228,409 |
| Total | 7,093 (100.0%) | $94,742 |
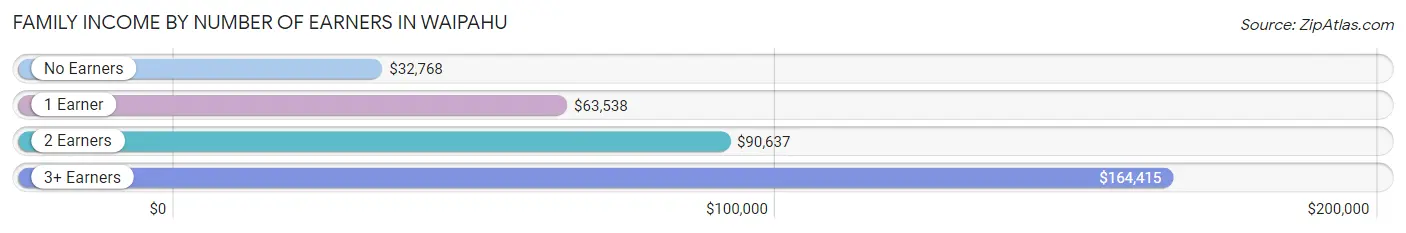
Family Income by Number of Earners in Waipahu
The median family income in Waipahu is $94,742, with families comprising 3+ earners (2,373) having the highest median family income of $164,415, while families with no earners (933) have the lowest median family income of $32,768, accounting for 33.5% and 13.2% of families, respectively.
| Number of Earners | # Families | Median Income |
| No Earners | 933 (13.2%) | $32,768 |
| 1 Earner | 1,593 (22.5%) | $63,538 |
| 2 Earners | 2,194 (30.9%) | $90,637 |
| 3+ Earners | 2,373 (33.5%) | $164,415 |
| Total | 7,093 (100.0%) | $94,742 |
Household Income in Waipahu
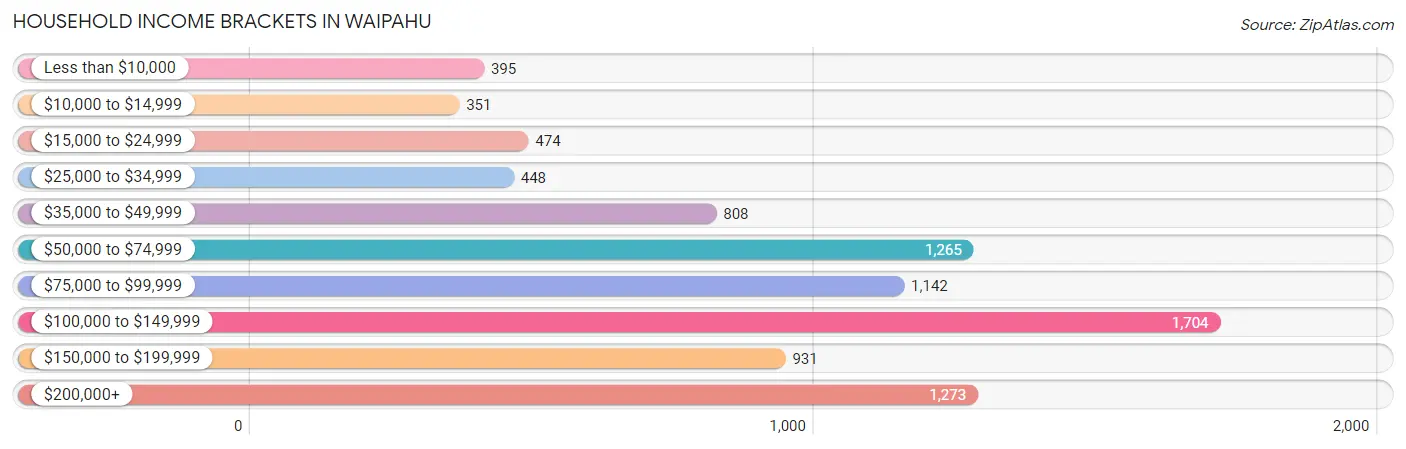
Household Income Brackets in Waipahu
With 1,704 households falling in the category, the $100,000 to $149,999 income range is the most frequent in Waipahu, accounting for 19.4% of all households. In contrast, only 351 households (4.0%) fall into the $10,000 to $14,999 income bracket, making it the least populous group.
| Income Bracket | # Households | % Households |
| Less than $10,000 | 395 | 4.5% |
| $10,000 to $14,999 | 351 | 4.0% |
| $15,000 to $24,999 | 474 | 5.4% |
| $25,000 to $34,999 | 448 | 5.1% |
| $35,000 to $49,999 | 808 | 9.2% |
| $50,000 to $74,999 | 1,265 | 14.4% |
| $75,000 to $99,999 | 1,142 | 13.0% |
| $100,000 to $149,999 | 1,704 | 19.4% |
| $150,000 to $199,999 | 931 | 10.6% |
| $200,000+ | 1,273 | 14.5% |
Household Income by Householder Age in Waipahu
The median household income in Waipahu is $87,961, with the highest median household income of $109,537 found in the 45 to 64 years age bracket for the primary householder. A total of 2,966 households (33.8%) fall into this category. Meanwhile, the 15 to 24 years age bracket for the primary householder has the lowest median household income of $60,556, with 238 households (2.7%) in this group.
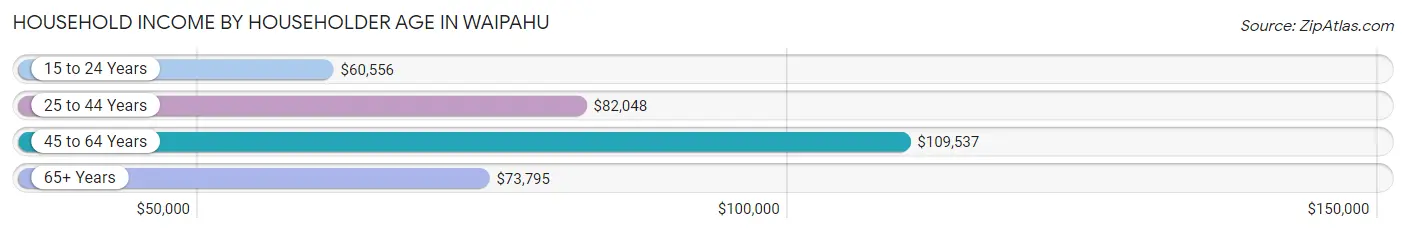
| Income Bracket | # Households | Median Income |
| 15 to 24 Years | 238 (2.7%) | $60,556 |
| 25 to 44 Years | 2,597 (29.6%) | $82,048 |
| 45 to 64 Years | 2,966 (33.8%) | $109,537 |
| 65+ Years | 2,981 (33.9%) | $73,795 |
| Total | 8,782 (100.0%) | $87,961 |
Poverty in Waipahu
Income Below Poverty by Sex and Age in Waipahu
With 10.3% poverty level for males and 12.8% for females among the residents of Waipahu, under 5 year old males and 5 year old females are the most vulnerable to poverty, with 175 males (16.7%) and 53 females (21.5%) in their respective age groups living below the poverty level.
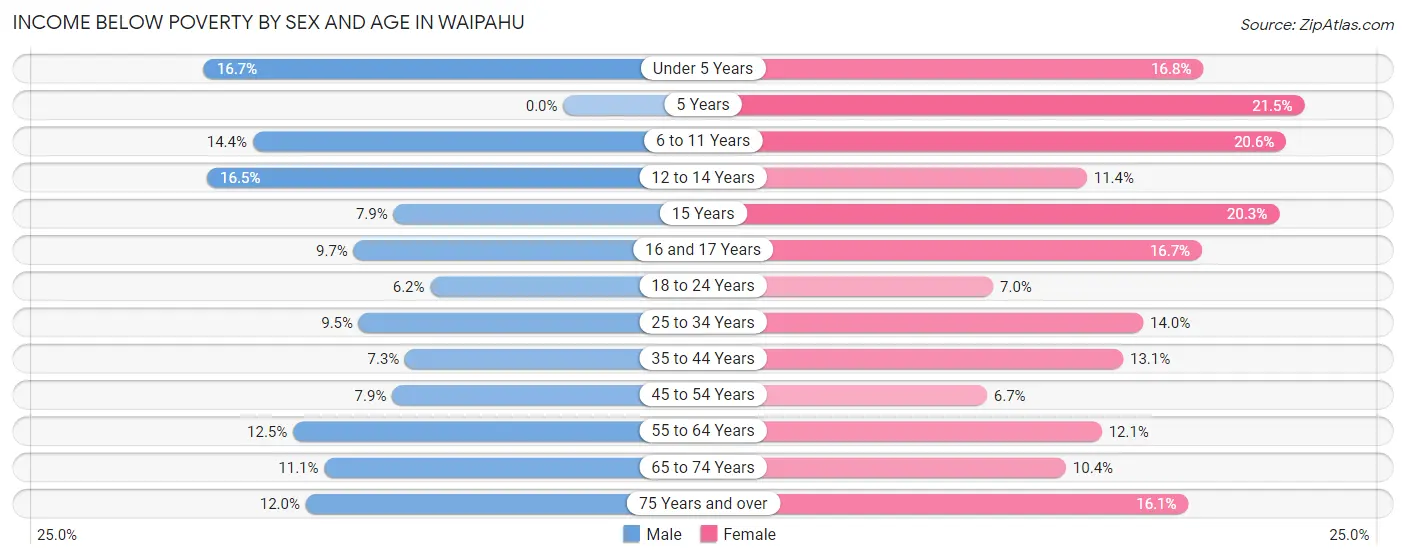
| Age Bracket | Male | Female |
| Under 5 Years | 175 (16.7%) | 244 (16.8%) |
| 5 Years | 0 (0.0%) | 53 (21.5%) |
| 6 to 11 Years | 207 (14.4%) | 198 (20.6%) |
| 12 to 14 Years | 122 (16.5%) | 97 (11.4%) |
| 15 Years | 26 (7.9%) | 56 (20.3%) |
| 16 and 17 Years | 51 (9.7%) | 60 (16.7%) |
| 18 to 24 Years | 108 (6.2%) | 116 (7.0%) |
| 25 to 34 Years | 300 (9.5%) | 384 (14.0%) |
| 35 to 44 Years | 166 (7.3%) | 278 (13.1%) |
| 45 to 54 Years | 185 (7.9%) | 168 (6.7%) |
| 55 to 64 Years | 261 (12.5%) | 252 (12.1%) |
| 65 to 74 Years | 197 (11.1%) | 206 (10.4%) |
| 75 Years and over | 162 (11.9%) | 474 (16.1%) |
| Total | 1,960 (10.3%) | 2,586 (12.8%) |
Income Above Poverty by Sex and Age in Waipahu
According to the poverty statistics in Waipahu, males aged 5 years and females aged 45 to 54 years are the age groups that are most secure financially, with 100.0% of males and 93.3% of females in these age groups living above the poverty line.
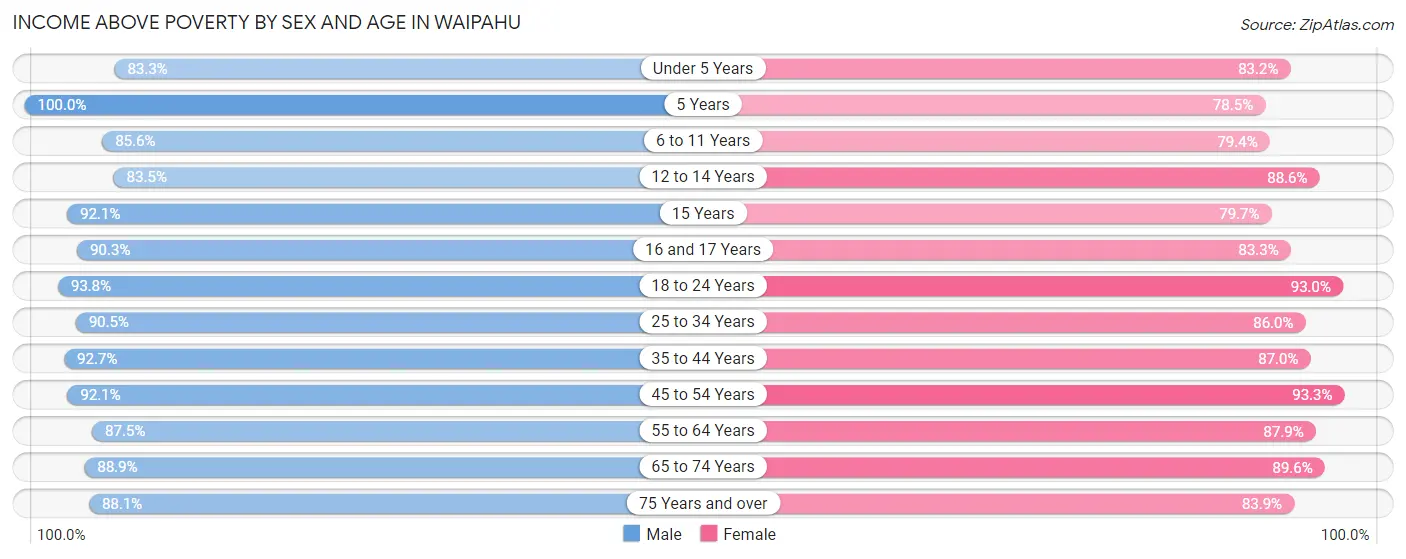
| Age Bracket | Male | Female |
| Under 5 Years | 874 (83.3%) | 1,211 (83.2%) |
| 5 Years | 168 (100.0%) | 194 (78.5%) |
| 6 to 11 Years | 1,230 (85.6%) | 762 (79.4%) |
| 12 to 14 Years | 616 (83.5%) | 756 (88.6%) |
| 15 Years | 304 (92.1%) | 220 (79.7%) |
| 16 and 17 Years | 473 (90.3%) | 299 (83.3%) |
| 18 to 24 Years | 1,641 (93.8%) | 1,536 (93.0%) |
| 25 to 34 Years | 2,861 (90.5%) | 2,362 (86.0%) |
| 35 to 44 Years | 2,097 (92.7%) | 1,853 (87.0%) |
| 45 to 54 Years | 2,144 (92.1%) | 2,327 (93.3%) |
| 55 to 64 Years | 1,821 (87.5%) | 1,838 (87.9%) |
| 65 to 74 Years | 1,580 (88.9%) | 1,775 (89.6%) |
| 75 Years and over | 1,194 (88.0%) | 2,474 (83.9%) |
| Total | 17,003 (89.7%) | 17,607 (87.2%) |
Income Below Poverty Among Married-Couple Families in Waipahu
The poverty statistics for married-couple families in Waipahu show that 7.9% or 363 of the total 4,604 families live below the poverty line. Families with 3 or 4 children have the highest poverty rate of 17.1%, comprising of 102 families. On the other hand, families with 5 or more children have the lowest poverty rate of 0.0%, which includes 0 families.
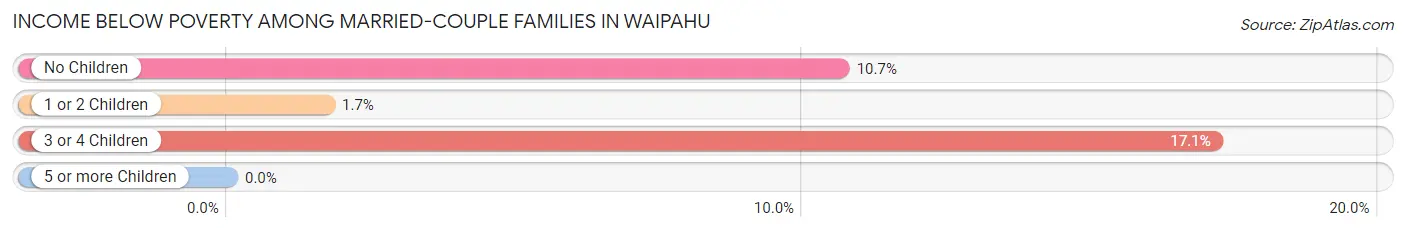
| Children | Above Poverty | Below Poverty |
| No Children | 1,947 (89.3%) | 232 (10.6%) |
| 1 or 2 Children | 1,688 (98.3%) | 29 (1.7%) |
| 3 or 4 Children | 493 (82.9%) | 102 (17.1%) |
| 5 or more Children | 113 (100.0%) | 0 (0.0%) |
| Total | 4,241 (92.1%) | 363 (7.9%) |
Income Below Poverty Among Single-Parent Households in Waipahu
According to the poverty data in Waipahu, 8.6% or 57 single-father households and 18.8% or 343 single-mother households are living below the poverty line. Among single-father households, those with no children have the highest poverty rate, with 44 households (11.3%) experiencing poverty. Likewise, among single-mother households, those with 3 or 4 children have the highest poverty rate, with 89 households (41.0%) falling below the poverty line.
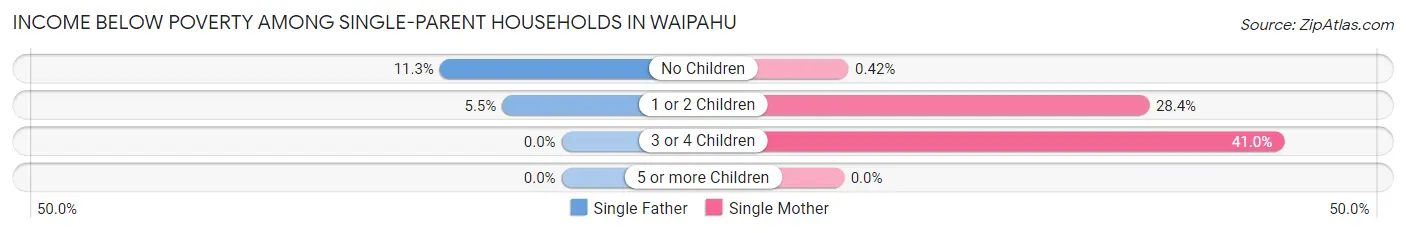
| Children | Single Father | Single Mother |
| No Children | 44 (11.3%) | 3 (0.4%) |
| 1 or 2 Children | 13 (5.5%) | 251 (28.4%) |
| 3 or 4 Children | 0 (0.0%) | 89 (41.0%) |
| 5 or more Children | 0 (0.0%) | 0 (0.0%) |
| Total | 57 (8.6%) | 343 (18.8%) |
Income Below Poverty Among Married-Couple vs Single-Parent Households in Waipahu
The poverty data for Waipahu shows that 363 of the married-couple family households (7.9%) and 400 of the single-parent households (16.1%) are living below the poverty level. Within the married-couple family households, those with 3 or 4 children have the highest poverty rate, with 102 households (17.1%) falling below the poverty line. Among the single-parent households, those with 3 or 4 children have the highest poverty rate, with 89 household (34.4%) living below poverty.
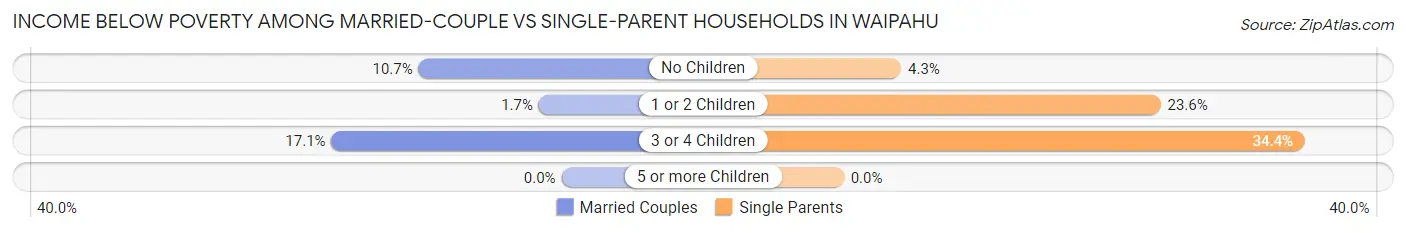
| Children | Married-Couple Families | Single-Parent Households |
| No Children | 232 (10.6%) | 47 (4.3%) |
| 1 or 2 Children | 29 (1.7%) | 264 (23.6%) |
| 3 or 4 Children | 102 (17.1%) | 89 (34.4%) |
| 5 or more Children | 0 (0.0%) | 0 (0.0%) |
| Total | 363 (7.9%) | 400 (16.1%) |
Race in Waipahu
The most populous races in Waipahu are Asian (26,807 | 67.2%), Two or more Races (5,826 | 14.6%), and Hawaiian / Pacific (5,041 | 12.6%).
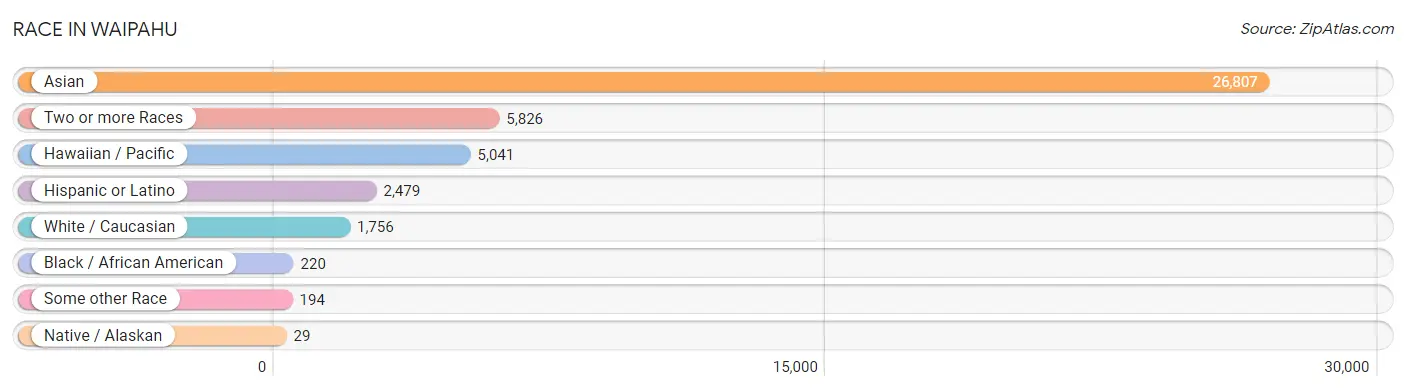
| Race | # Population | % Population |
| Asian | 26,807 | 67.2% |
| Black / African American | 220 | 0.5% |
| Hawaiian / Pacific | 5,041 | 12.6% |
| Hispanic or Latino | 2,479 | 6.2% |
| Native / Alaskan | 29 | 0.1% |
| White / Caucasian | 1,756 | 4.4% |
| Two or more Races | 5,826 | 14.6% |
| Some other Race | 194 | 0.5% |
| Total | 39,873 | 100.0% |
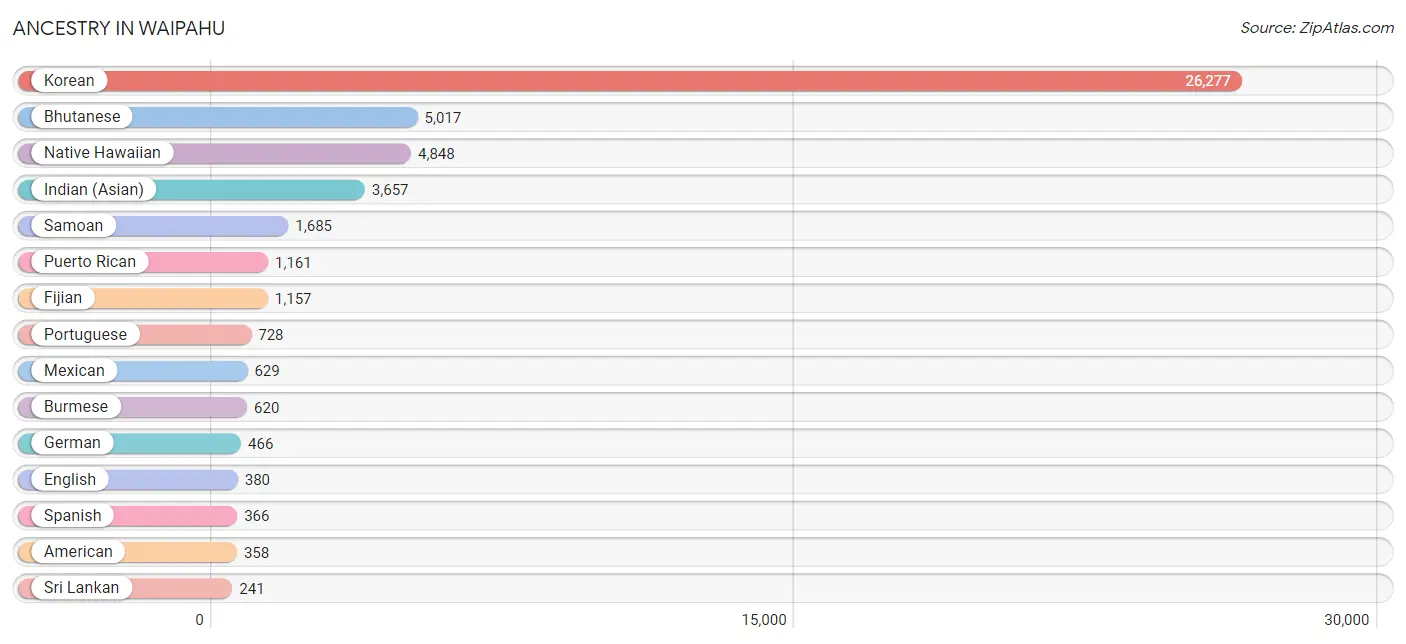
Ancestry in Waipahu
The most populous ancestries reported in Waipahu are Korean (26,277 | 65.9%), Bhutanese (5,017 | 12.6%), Native Hawaiian (4,848 | 12.2%), Indian (Asian) (3,657 | 9.2%), and Samoan (1,685 | 4.2%), together accounting for 104.0% of all Waipahu residents.
| Ancestry | # Population | % Population |
| African | 49 | 0.1% |
| American | 358 | 0.9% |
| Apache | 6 | 0.0% |
| Arab | 146 | 0.4% |
| Austrian | 9 | 0.0% |
| Bhutanese | 5,017 | 12.6% |
| Blackfeet | 10 | 0.0% |
| Burmese | 620 | 1.5% |
| Central American | 5 | 0.0% |
| Central American Indian | 1 | 0.0% |
| Cherokee | 56 | 0.1% |
| Chilean | 6 | 0.0% |
| Chinese | 126 | 0.3% |
| Cuban | 8 | 0.0% |
| Dutch | 10 | 0.0% |
| English | 380 | 0.9% |
| European | 23 | 0.1% |
| Fijian | 1,157 | 2.9% |
| French | 96 | 0.2% |
| German | 466 | 1.2% |
| Guamanian / Chamorro | 13 | 0.0% |
| Indian (Asian) | 3,657 | 9.2% |
| Irish | 219 | 0.5% |
| Italian | 68 | 0.2% |
| Japanese | 8 | 0.0% |
| Korean | 26,277 | 65.9% |
| Laotian | 8 | 0.0% |
| Malaysian | 222 | 0.6% |
| Marshallese | 63 | 0.2% |
| Mexican | 629 | 1.6% |
| Native Hawaiian | 4,848 | 12.2% |
| Northern European | 10 | 0.0% |
| Norwegian | 7 | 0.0% |
| Pakistani | 93 | 0.2% |
| Panamanian | 5 | 0.0% |
| Polish | 13 | 0.0% |
| Portuguese | 728 | 1.8% |
| Pueblo | 46 | 0.1% |
| Puerto Rican | 1,161 | 2.9% |
| Samoan | 1,685 | 4.2% |
| Scotch-Irish | 18 | 0.1% |
| Scottish | 7 | 0.0% |
| Sioux | 14 | 0.0% |
| South American | 6 | 0.0% |
| Spaniard | 110 | 0.3% |
| Spanish | 366 | 0.9% |
| Sri Lankan | 241 | 0.6% |
| Subsaharan African | 49 | 0.1% |
| Swedish | 46 | 0.1% |
| Thai | 149 | 0.4% |
| Tongan | 152 | 0.4% |
| Ukrainian | 15 | 0.0% | View All 52 Rows |
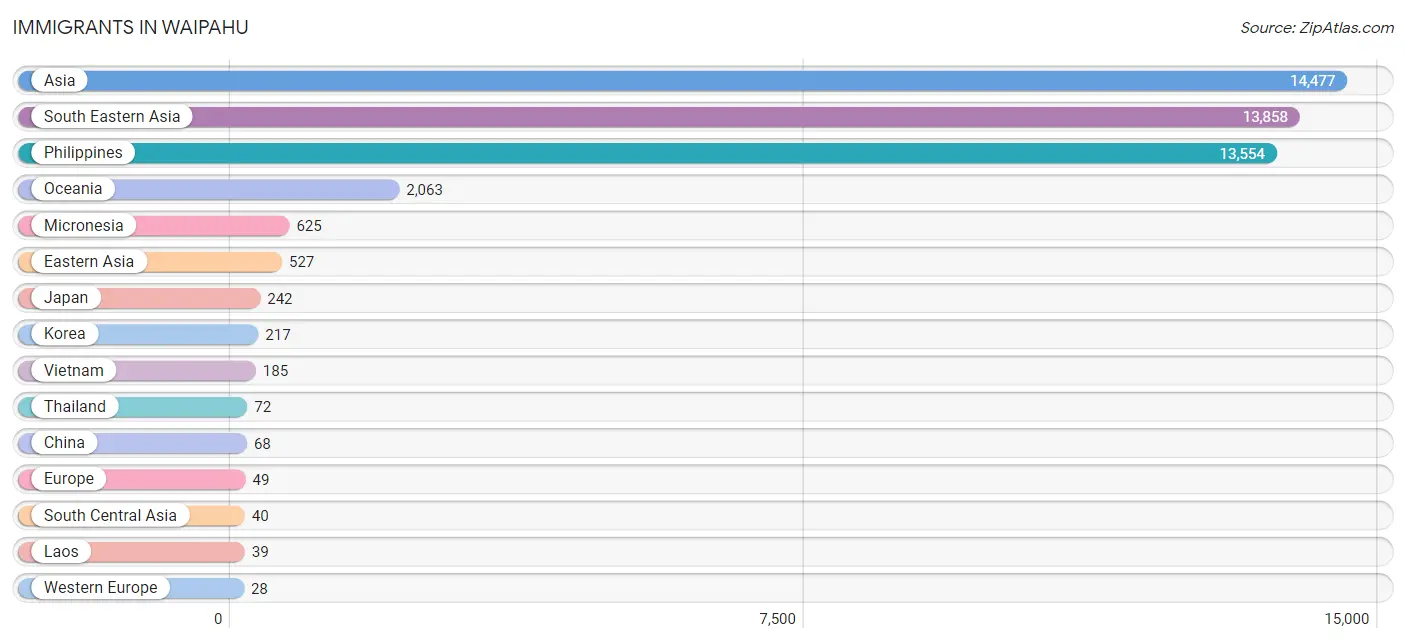
Immigrants in Waipahu
The most numerous immigrant groups reported in Waipahu came from Asia (14,477 | 36.3%), South Eastern Asia (13,858 | 34.8%), Philippines (13,554 | 34.0%), Oceania (2,063 | 5.2%), and Micronesia (625 | 1.6%), together accounting for 111.8% of all Waipahu residents.
| Immigration Origin | # Population | % Population |
| Asia | 14,477 | 36.3% |
| Brazil | 7 | 0.0% |
| Cambodia | 8 | 0.0% |
| Canada | 8 | 0.0% |
| Central America | 13 | 0.0% |
| Chile | 6 | 0.0% |
| China | 68 | 0.2% |
| Eastern Asia | 527 | 1.3% |
| Europe | 49 | 0.1% |
| France | 14 | 0.0% |
| Germany | 14 | 0.0% |
| Hong Kong | 9 | 0.0% |
| India | 20 | 0.1% |
| Italy | 9 | 0.0% |
| Japan | 242 | 0.6% |
| Korea | 217 | 0.5% |
| Laos | 39 | 0.1% |
| Latin America | 26 | 0.1% |
| Mexico | 13 | 0.0% |
| Micronesia | 625 | 1.6% |
| Nepal | 20 | 0.1% |
| Northern Europe | 12 | 0.0% |
| Oceania | 2,063 | 5.2% |
| Philippines | 13,554 | 34.0% |
| South America | 13 | 0.0% |
| South Central Asia | 40 | 0.1% |
| South Eastern Asia | 13,858 | 34.8% |
| Southern Europe | 9 | 0.0% |
| Thailand | 72 | 0.2% |
| Vietnam | 185 | 0.5% |
| Western Europe | 28 | 0.1% | View All 31 Rows |
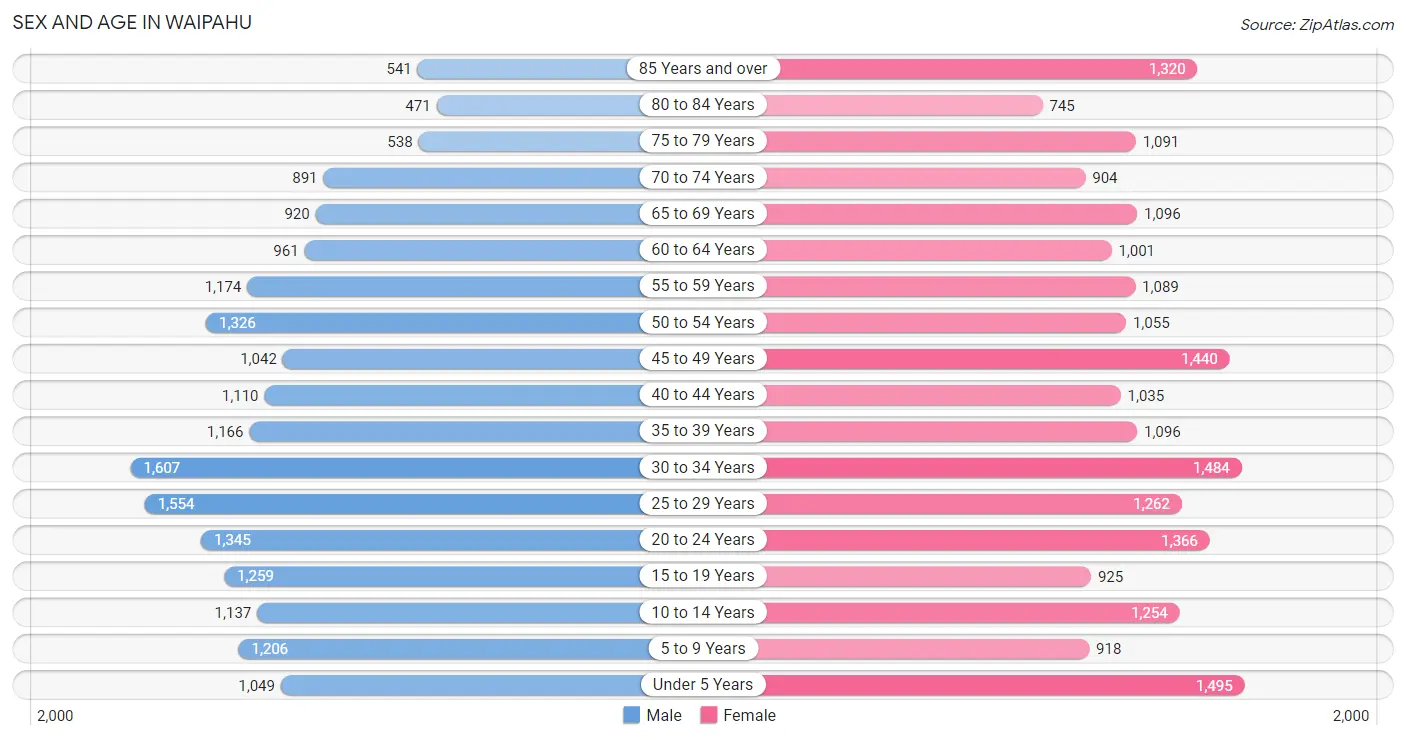
Sex and Age in Waipahu
Sex and Age in Waipahu
The most populous age groups in Waipahu are 30 to 34 Years (1,607 | 8.3%) for men and Under 5 Years (1,495 | 7.3%) for women.
| Age Bracket | Male | Female |
| Under 5 Years | 1,049 (5.4%) | 1,495 (7.3%) |
| 5 to 9 Years | 1,206 (6.2%) | 918 (4.5%) |
| 10 to 14 Years | 1,137 (5.9%) | 1,254 (6.1%) |
| 15 to 19 Years | 1,259 (6.5%) | 925 (4.5%) |
| 20 to 24 Years | 1,345 (7.0%) | 1,366 (6.6%) |
| 25 to 29 Years | 1,554 (8.1%) | 1,262 (6.1%) |
| 30 to 34 Years | 1,607 (8.3%) | 1,484 (7.2%) |
| 35 to 39 Years | 1,166 (6.0%) | 1,096 (5.3%) |
| 40 to 44 Years | 1,110 (5.8%) | 1,035 (5.0%) |
| 45 to 49 Years | 1,042 (5.4%) | 1,440 (7.0%) |
| 50 to 54 Years | 1,326 (6.9%) | 1,055 (5.1%) |
| 55 to 59 Years | 1,174 (6.1%) | 1,089 (5.3%) |
| 60 to 64 Years | 961 (5.0%) | 1,001 (4.9%) |
| 65 to 69 Years | 920 (4.8%) | 1,096 (5.3%) |
| 70 to 74 Years | 891 (4.6%) | 904 (4.4%) |
| 75 to 79 Years | 538 (2.8%) | 1,091 (5.3%) |
| 80 to 84 Years | 471 (2.4%) | 745 (3.6%) |
| 85 Years and over | 541 (2.8%) | 1,320 (6.4%) |
| Total | 19,297 (100.0%) | 20,576 (100.0%) |
Families and Households in Waipahu
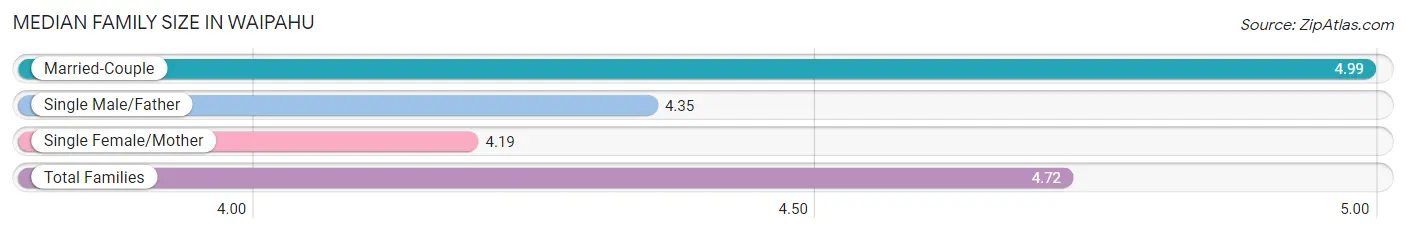
Median Family Size in Waipahu
The median family size in Waipahu is 4.72 persons per family, with married-couple families (4,604 | 64.9%) accounting for the largest median family size of 4.99 persons per family. On the other hand, single female/mother families (1,824 | 25.7%) represent the smallest median family size with 4.19 persons per family.
| Family Type | # Families | Family Size |
| Married-Couple | 4,604 (64.9%) | 4.99 |
| Single Male/Father | 665 (9.4%) | 4.35 |
| Single Female/Mother | 1,824 (25.7%) | 4.19 |
| Total Families | 7,093 (100.0%) | 4.72 |
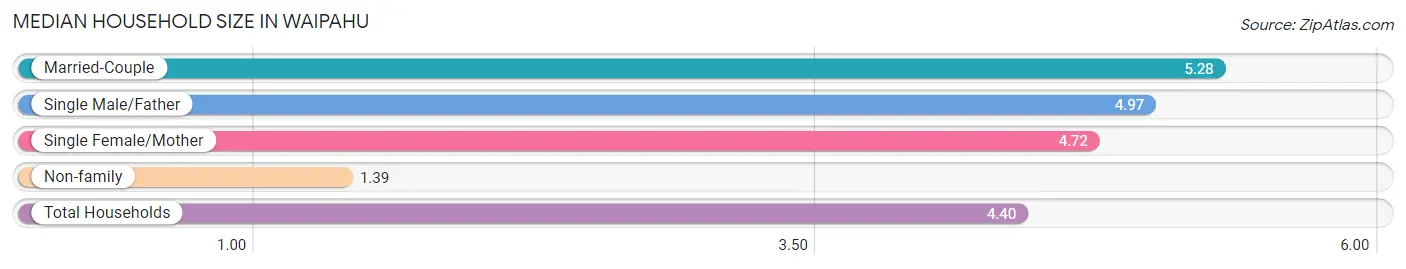
Median Household Size in Waipahu
The median household size in Waipahu is 4.40 persons per household, with married-couple households (4,604 | 52.4%) accounting for the largest median household size of 5.28 persons per household. non-family households (1,689 | 19.2%) represent the smallest median household size with 1.39 persons per household.
| Household Type | # Households | Household Size |
| Married-Couple | 4,604 (52.4%) | 5.28 |
| Single Male/Father | 665 (7.6%) | 4.97 |
| Single Female/Mother | 1,824 (20.8%) | 4.72 |
| Non-family | 1,689 (19.2%) | 1.39 |
| Total Households | 8,782 (100.0%) | 4.40 |
Household Size by Marriage Status in Waipahu
Out of a total of 8,782 households in Waipahu, 7,093 (80.8%) are family households, while 1,689 (19.2%) are nonfamily households. The most numerous type of family households are 3-person households, comprising 1,551, and the most common type of nonfamily households are 1-person households, comprising 1,320.
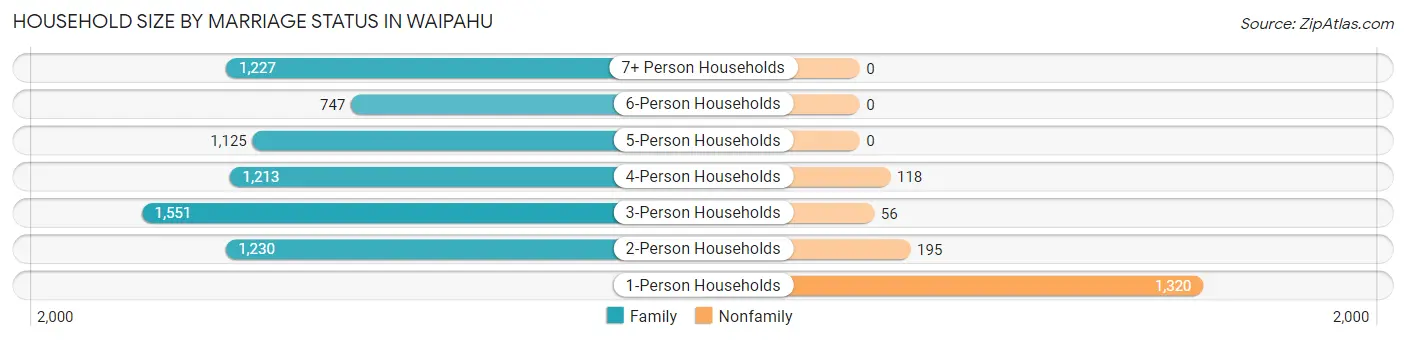
| Household Size | Family Households | Nonfamily Households |
| 1-Person Households | - | 1,320 (15.0%) |
| 2-Person Households | 1,230 (14.0%) | 195 (2.2%) |
| 3-Person Households | 1,551 (17.7%) | 56 (0.6%) |
| 4-Person Households | 1,213 (13.8%) | 118 (1.3%) |
| 5-Person Households | 1,125 (12.8%) | 0 (0.0%) |
| 6-Person Households | 747 (8.5%) | 0 (0.0%) |
| 7+ Person Households | 1,227 (14.0%) | 0 (0.0%) |
| Total | 7,093 (80.8%) | 1,689 (19.2%) |
Female Fertility in Waipahu
Fertility by Age in Waipahu
Average fertility rate in Waipahu is 70.0 births per 1,000 women. Women in the age bracket of 20 to 34 years have the highest fertility rate with 111.0 births per 1,000 women. Women in the age bracket of 20 to 34 years acount for 74.2% of all women with births.
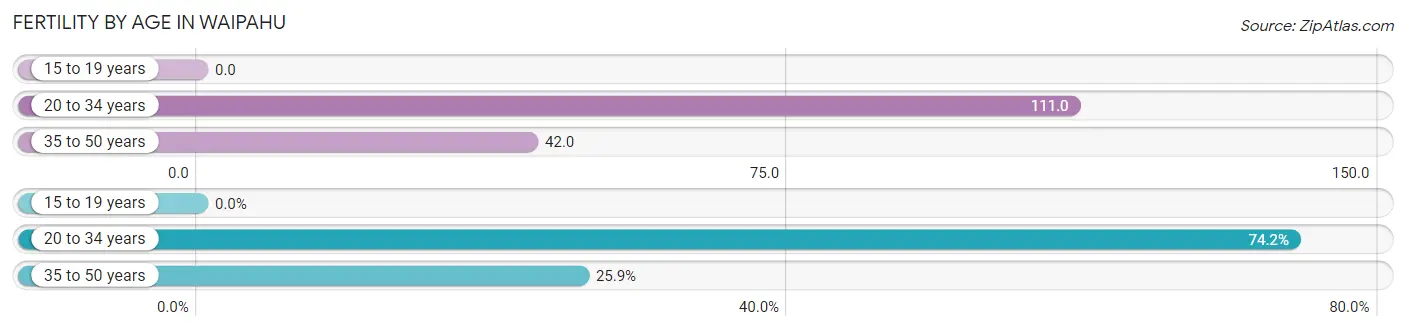
| Age Bracket | Women with Births | Births / 1,000 Women |
| 15 to 19 years | 0 (0.0%) | 0.0 |
| 20 to 34 years | 456 (74.2%) | 111.0 |
| 35 to 50 years | 159 (25.9%) | 42.0 |
| Total | 615 (100.0%) | 70.0 |
Fertility by Age by Marriage Status in Waipahu
68.5% of women with births (615) in Waipahu are married. The highest percentage of unmarried women with births falls into 20 to 34 years age bracket with 41.0% of them unmarried at the time of birth, while the lowest percentage of unmarried women with births belong to 35 to 50 years age bracket with 4.4% of them unmarried.
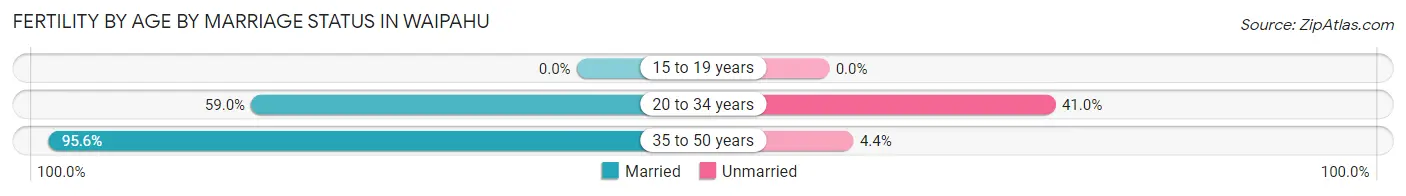
| Age Bracket | Married | Unmarried |
| 15 to 19 years | 0 (0.0%) | 0 (0.0%) |
| 20 to 34 years | 269 (59.0%) | 187 (41.0%) |
| 35 to 50 years | 152 (95.6%) | 7 (4.4%) |
| Total | 421 (68.5%) | 194 (31.5%) |
Fertility by Education in Waipahu
Average fertility rate in Waipahu is 70.0 births per 1,000 women. Women with the education attainment of bachelor's degree have the highest fertility rate of 112.0 births per 1,000 women, while women with the education attainment of less than high school have the lowest fertility at 26.0 births per 1,000 women. Women with the education attainment of high school diploma represent 35.1% of all women with births.
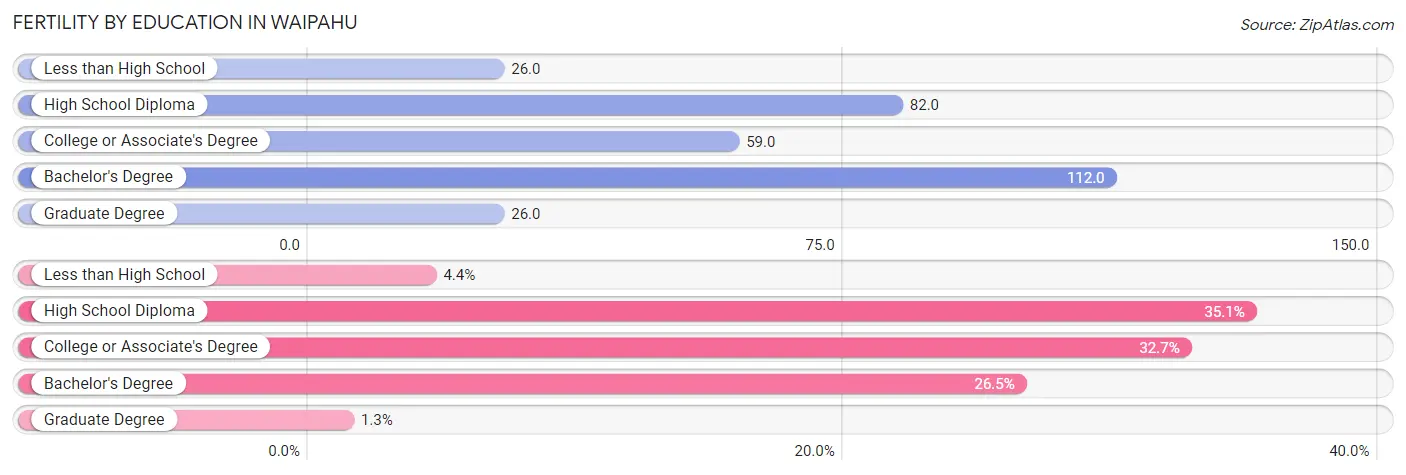
| Educational Attainment | Women with Births | Births / 1,000 Women |
| Less than High School | 27 (4.4%) | 26.0 |
| High School Diploma | 216 (35.1%) | 82.0 |
| College or Associate's Degree | 201 (32.7%) | 59.0 |
| Bachelor's Degree | 163 (26.5%) | 112.0 |
| Graduate Degree | 8 (1.3%) | 26.0 |
| Total | 615 (100.0%) | 70.0 |
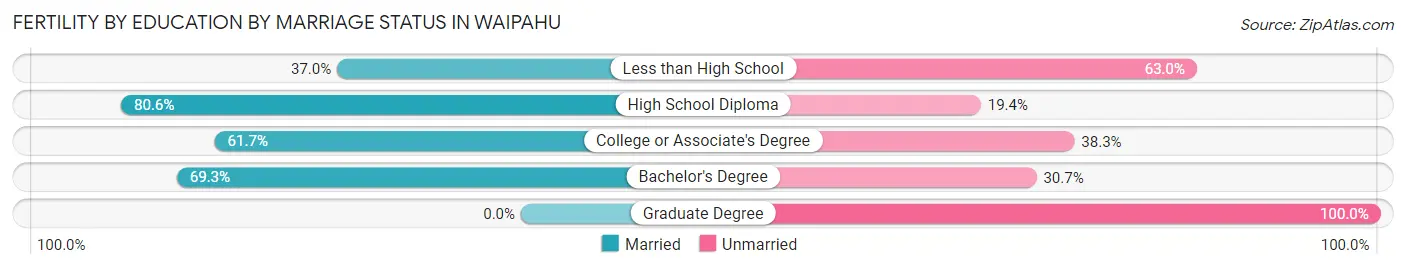
Fertility by Education by Marriage Status in Waipahu
31.5% of women with births in Waipahu are unmarried. Women with the educational attainment of high school diploma are most likely to be married with 80.6% of them married at childbirth, while women with the educational attainment of graduate degree are least likely to be married with 100.0% of them unmarried at childbirth.
| Educational Attainment | Married | Unmarried |
| Less than High School | 10 (37.0%) | 17 (63.0%) |
| High School Diploma | 174 (80.6%) | 42 (19.4%) |
| College or Associate's Degree | 124 (61.7%) | 77 (38.3%) |
| Bachelor's Degree | 113 (69.3%) | 50 (30.7%) |
| Graduate Degree | 0 (0.0%) | 8 (100.0%) |
| Total | 421 (68.5%) | 194 (31.5%) |
Employment Characteristics in Waipahu
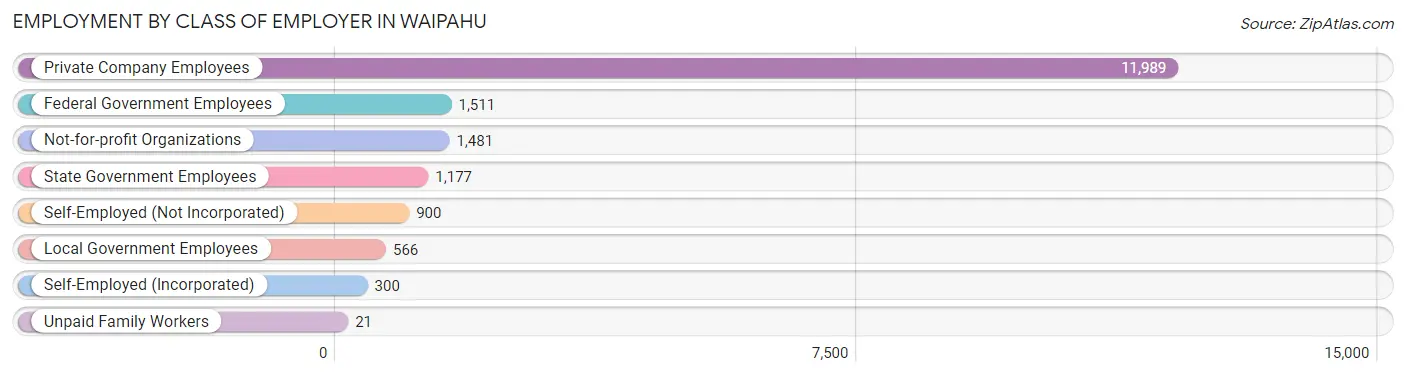
Employment by Class of Employer in Waipahu
Among the 17,945 employed individuals in Waipahu, private company employees (11,989 | 66.8%), federal government employees (1,511 | 8.4%), and not-for-profit organizations (1,481 | 8.3%) make up the most common classes of employment.
| Employer Class | # Employees | % Employees |
| Private Company Employees | 11,989 | 66.8% |
| Self-Employed (Incorporated) | 300 | 1.7% |
| Self-Employed (Not Incorporated) | 900 | 5.0% |
| Not-for-profit Organizations | 1,481 | 8.3% |
| Local Government Employees | 566 | 3.2% |
| State Government Employees | 1,177 | 6.6% |
| Federal Government Employees | 1,511 | 8.4% |
| Unpaid Family Workers | 21 | 0.1% |
| Total | 17,945 | 100.0% |
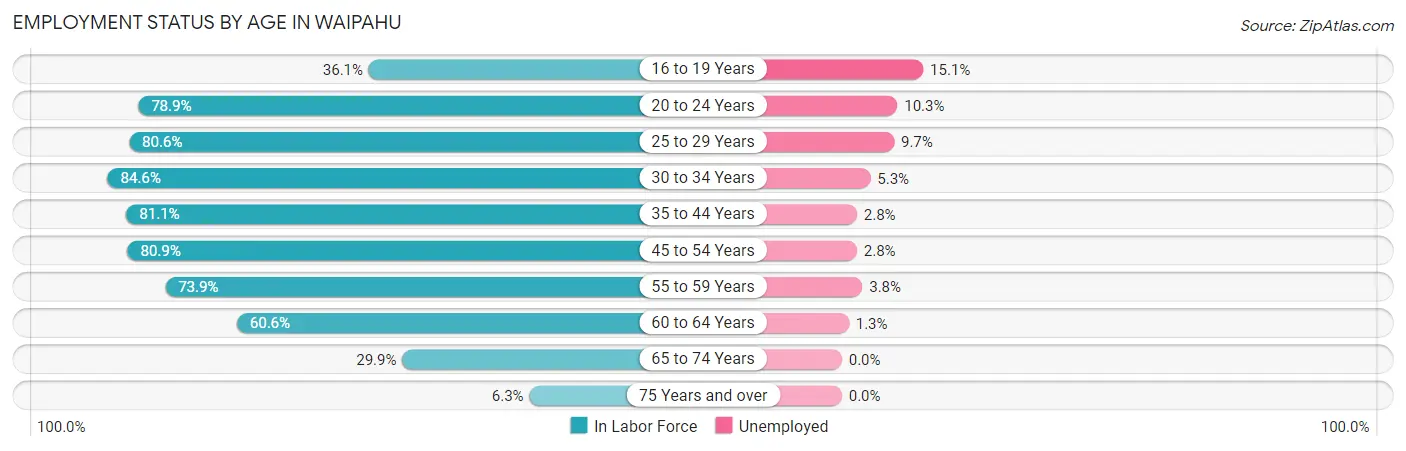
Employment Status by Age in Waipahu
According to the labor force statistics for Waipahu, out of the total population over 16 years of age (32,207), 60.2% or 19,389 individuals are in the labor force, with 4.8% or 931 of them unemployed. The age group with the highest labor force participation rate is 30 to 34 years, with 84.6% or 2,615 individuals in the labor force. Within the labor force, the 16 to 19 years age range has the highest percentage of unemployed individuals, with 15.1% or 86 of them being unemployed.
| Age Bracket | In Labor Force | Unemployed |
| 16 to 19 Years | 569 (36.1%) | 86 (15.1%) |
| 20 to 24 Years | 2,139 (78.9%) | 220 (10.3%) |
| 25 to 29 Years | 2,270 (80.6%) | 220 (9.7%) |
| 30 to 34 Years | 2,615 (84.6%) | 139 (5.3%) |
| 35 to 44 Years | 3,574 (81.1%) | 100 (2.8%) |
| 45 to 54 Years | 3,934 (80.9%) | 110 (2.8%) |
| 55 to 59 Years | 1,672 (73.9%) | 64 (3.8%) |
| 60 to 64 Years | 1,189 (60.6%) | 15 (1.3%) |
| 65 to 74 Years | 1,139 (29.9%) | 0 (0.0%) |
| 75 Years and over | 296 (6.3%) | 0 (0.0%) |
| Total | 19,389 (60.2%) | 931 (4.8%) |
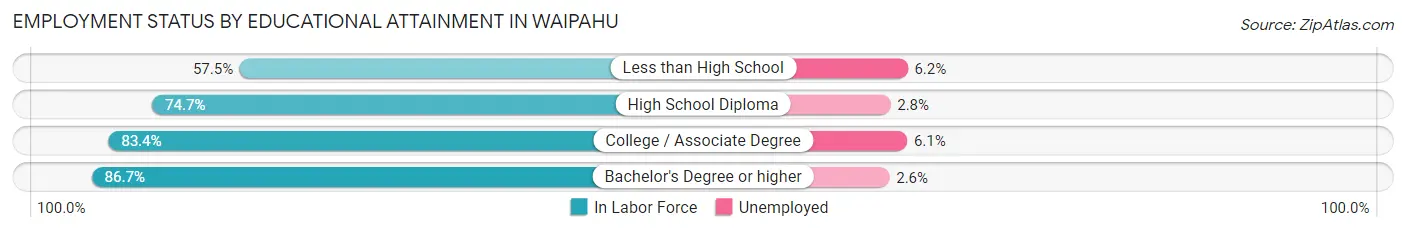
Employment Status by Educational Attainment in Waipahu
According to labor force statistics for Waipahu, 78.6% of individuals (15,250) out of the total population between 25 and 64 years of age (19,402) are in the labor force, with 4.2% or 640 of them being unemployed. The group with the highest labor force participation rate are those with the educational attainment of bachelor's degree or higher, with 86.7% or 3,520 individuals in the labor force. Within the labor force, individuals with less than high school education have the highest percentage of unemployment, with 6.2% or 64 of them being unemployed.
| Educational Attainment | In Labor Force | Unemployed |
| Less than High School | 1,031 (57.5%) | 111 (6.2%) |
| High School Diploma | 5,166 (74.7%) | 194 (2.8%) |
| College / Associate Degree | 5,532 (83.4%) | 405 (6.1%) |
| Bachelor's Degree or higher | 3,520 (86.7%) | 106 (2.6%) |
| Total | 15,250 (78.6%) | 815 (4.2%) |
Employment Occupations by Sex in Waipahu
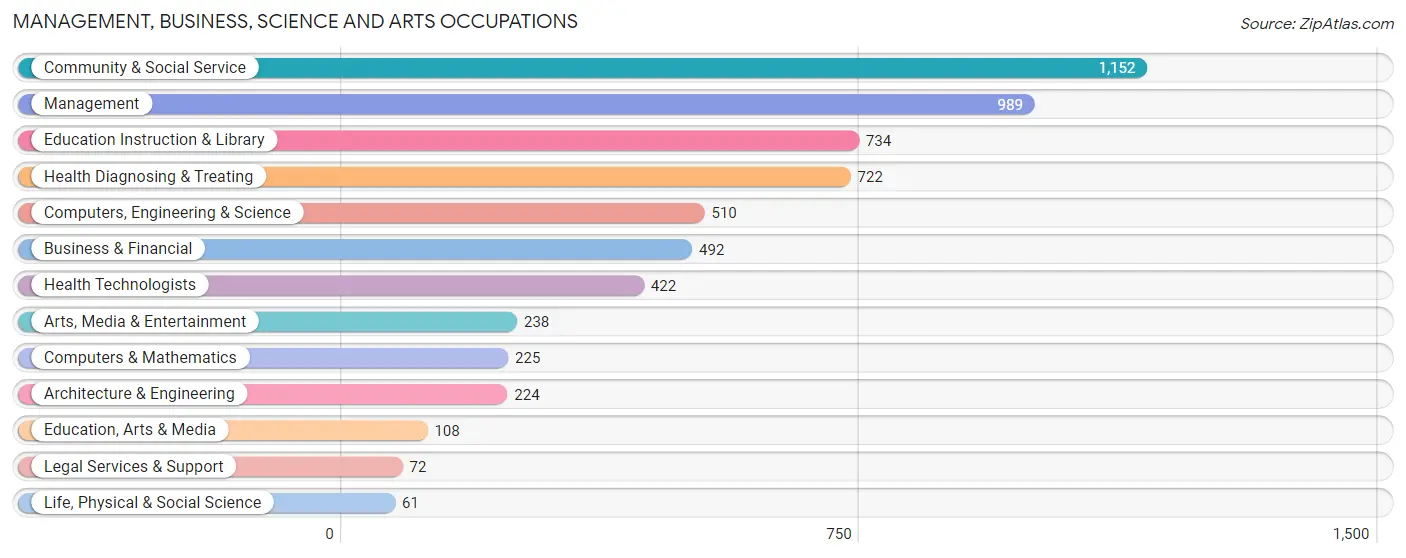
Management, Business, Science and Arts Occupations
The most common Management, Business, Science and Arts occupations in Waipahu are Community & Social Service (1,152 | 6.4%), Management (989 | 5.5%), Education Instruction & Library (734 | 4.1%), Health Diagnosing & Treating (722 | 4.0%), and Computers, Engineering & Science (510 | 2.8%).
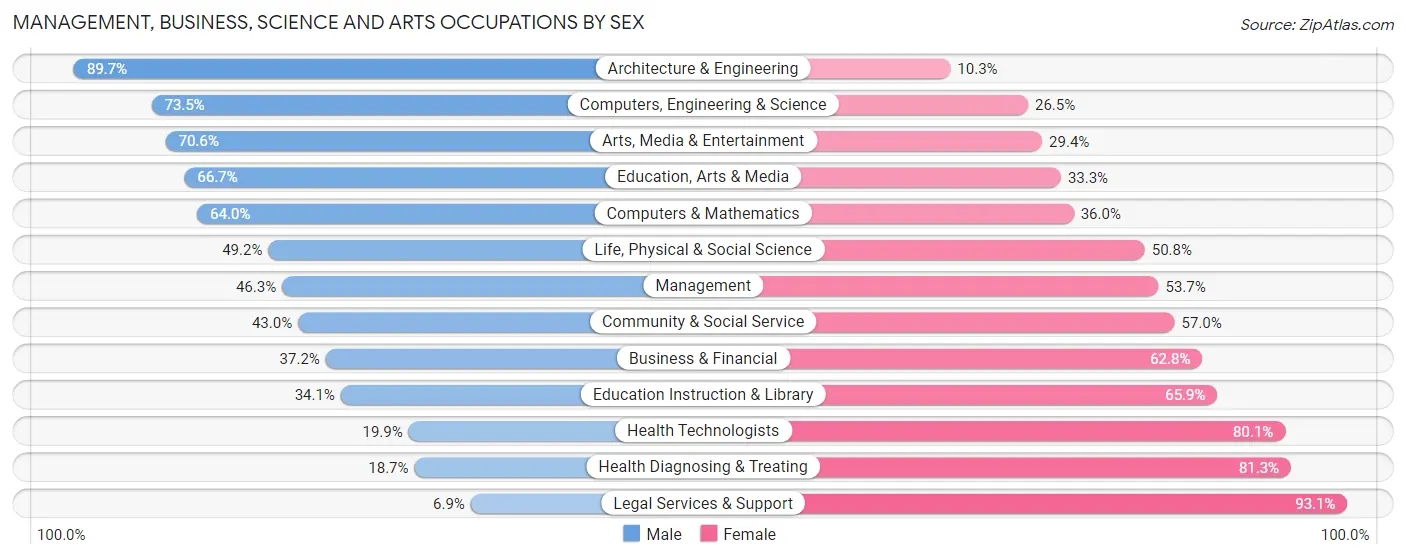
Management, Business, Science and Arts Occupations by Sex
Within the Management, Business, Science and Arts occupations in Waipahu, the most male-oriented occupations are Architecture & Engineering (89.7%), Computers, Engineering & Science (73.5%), and Arts, Media & Entertainment (70.6%), while the most female-oriented occupations are Legal Services & Support (93.1%), Health Diagnosing & Treating (81.3%), and Health Technologists (80.1%).
| Occupation | Male | Female |
| Management | 458 (46.3%) | 531 (53.7%) |
| Business & Financial | 183 (37.2%) | 309 (62.8%) |
| Computers, Engineering & Science | 375 (73.5%) | 135 (26.5%) |
| Computers & Mathematics | 144 (64.0%) | 81 (36.0%) |
| Architecture & Engineering | 201 (89.7%) | 23 (10.3%) |
| Life, Physical & Social Science | 30 (49.2%) | 31 (50.8%) |
| Community & Social Service | 495 (43.0%) | 657 (57.0%) |
| Education, Arts & Media | 72 (66.7%) | 36 (33.3%) |
| Legal Services & Support | 5 (6.9%) | 67 (93.1%) |
| Education Instruction & Library | 250 (34.1%) | 484 (65.9%) |
| Arts, Media & Entertainment | 168 (70.6%) | 70 (29.4%) |
| Health Diagnosing & Treating | 135 (18.7%) | 587 (81.3%) |
| Health Technologists | 84 (19.9%) | 338 (80.1%) |
| Total (Category) | 1,646 (42.6%) | 2,219 (57.4%) |
| Total (Overall) | 9,268 (51.2%) | 8,840 (48.8%) |
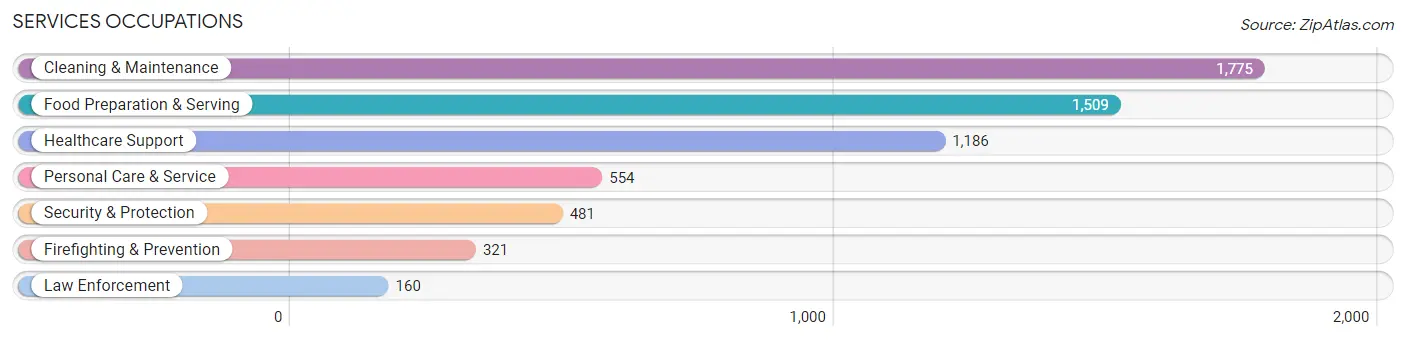
Services Occupations
The most common Services occupations in Waipahu are Cleaning & Maintenance (1,775 | 9.8%), Food Preparation & Serving (1,509 | 8.3%), Healthcare Support (1,186 | 6.6%), Personal Care & Service (554 | 3.1%), and Security & Protection (481 | 2.7%).
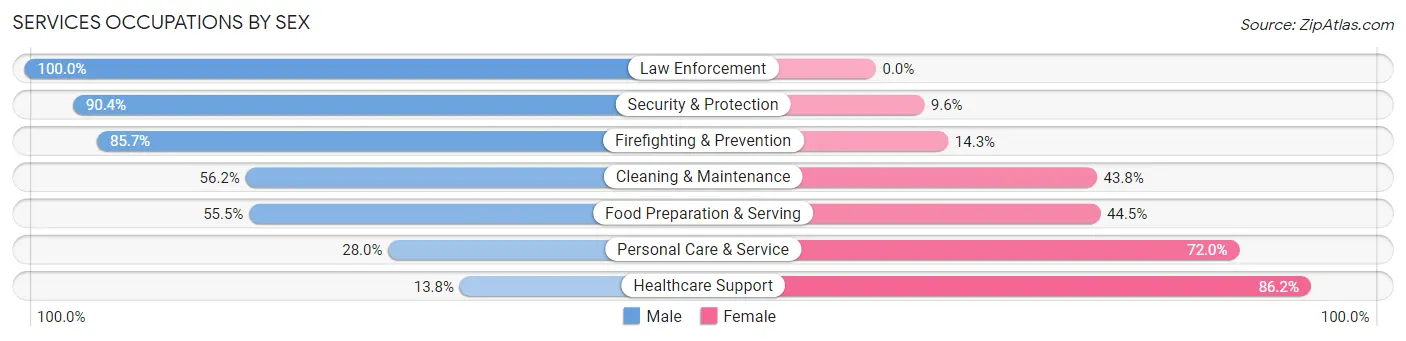
Services Occupations by Sex
Within the Services occupations in Waipahu, the most male-oriented occupations are Law Enforcement (100.0%), Security & Protection (90.4%), and Firefighting & Prevention (85.7%), while the most female-oriented occupations are Healthcare Support (86.2%), Personal Care & Service (72.0%), and Food Preparation & Serving (44.5%).
| Occupation | Male | Female |
| Healthcare Support | 164 (13.8%) | 1,022 (86.2%) |
| Security & Protection | 435 (90.4%) | 46 (9.6%) |
| Firefighting & Prevention | 275 (85.7%) | 46 (14.3%) |
| Law Enforcement | 160 (100.0%) | 0 (0.0%) |
| Food Preparation & Serving | 838 (55.5%) | 671 (44.5%) |
| Cleaning & Maintenance | 998 (56.2%) | 777 (43.8%) |
| Personal Care & Service | 155 (28.0%) | 399 (72.0%) |
| Total (Category) | 2,590 (47.0%) | 2,915 (52.9%) |
| Total (Overall) | 9,268 (51.2%) | 8,840 (48.8%) |
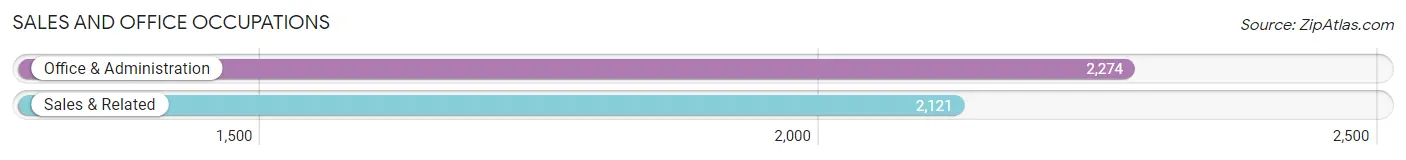
Sales and Office Occupations
The most common Sales and Office occupations in Waipahu are Office & Administration (2,274 | 12.6%), and Sales & Related (2,121 | 11.7%).
Sales and Office Occupations by Sex
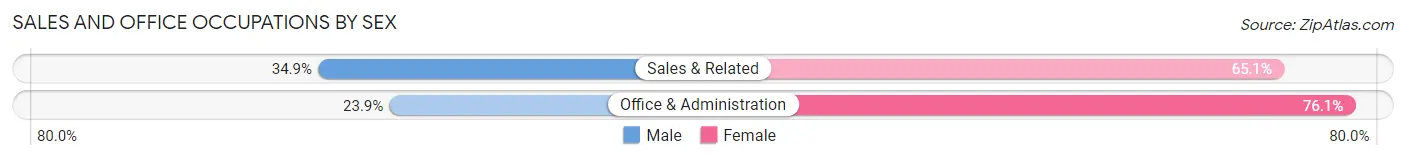
| Occupation | Male | Female |
| Sales & Related | 740 (34.9%) | 1,381 (65.1%) |
| Office & Administration | 544 (23.9%) | 1,730 (76.1%) |
| Total (Category) | 1,284 (29.2%) | 3,111 (70.8%) |
| Total (Overall) | 9,268 (51.2%) | 8,840 (48.8%) |
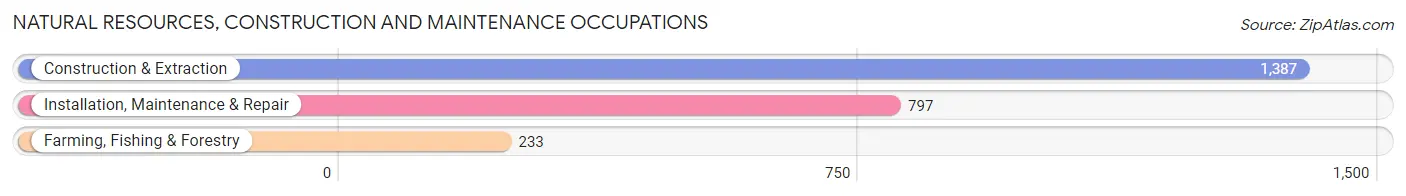
Natural Resources, Construction and Maintenance Occupations
The most common Natural Resources, Construction and Maintenance occupations in Waipahu are Construction & Extraction (1,387 | 7.7%), Installation, Maintenance & Repair (797 | 4.4%), and Farming, Fishing & Forestry (233 | 1.3%).
Natural Resources, Construction and Maintenance Occupations by Sex
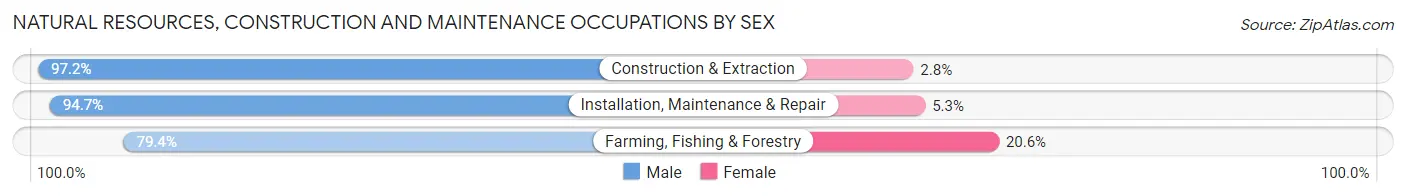
| Occupation | Male | Female |
| Farming, Fishing & Forestry | 185 (79.4%) | 48 (20.6%) |
| Construction & Extraction | 1,348 (97.2%) | 39 (2.8%) |
| Installation, Maintenance & Repair | 755 (94.7%) | 42 (5.3%) |
| Total (Category) | 2,288 (94.7%) | 129 (5.3%) |
| Total (Overall) | 9,268 (51.2%) | 8,840 (48.8%) |
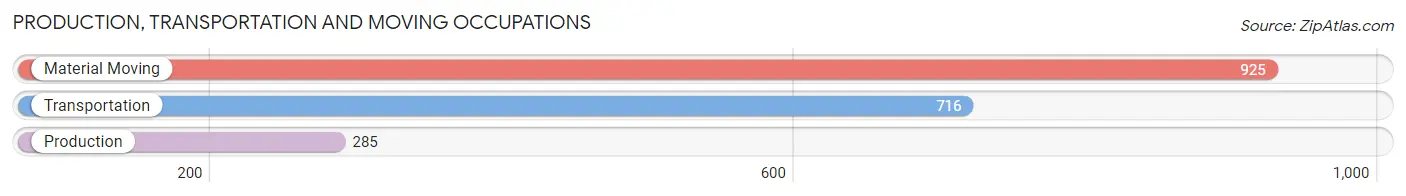
Production, Transportation and Moving Occupations
The most common Production, Transportation and Moving occupations in Waipahu are Material Moving (925 | 5.1%), Transportation (716 | 4.0%), and Production (285 | 1.6%).
Production, Transportation and Moving Occupations by Sex
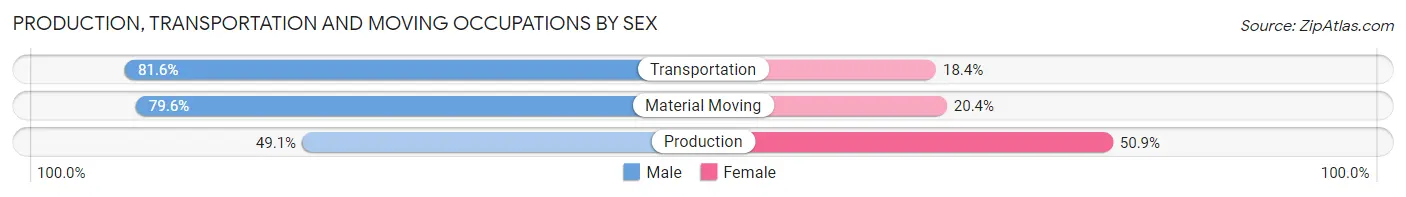
| Occupation | Male | Female |
| Production | 140 (49.1%) | 145 (50.9%) |
| Transportation | 584 (81.6%) | 132 (18.4%) |
| Material Moving | 736 (79.6%) | 189 (20.4%) |
| Total (Category) | 1,460 (75.8%) | 466 (24.2%) |
| Total (Overall) | 9,268 (51.2%) | 8,840 (48.8%) |
Employment Industries by Sex in Waipahu
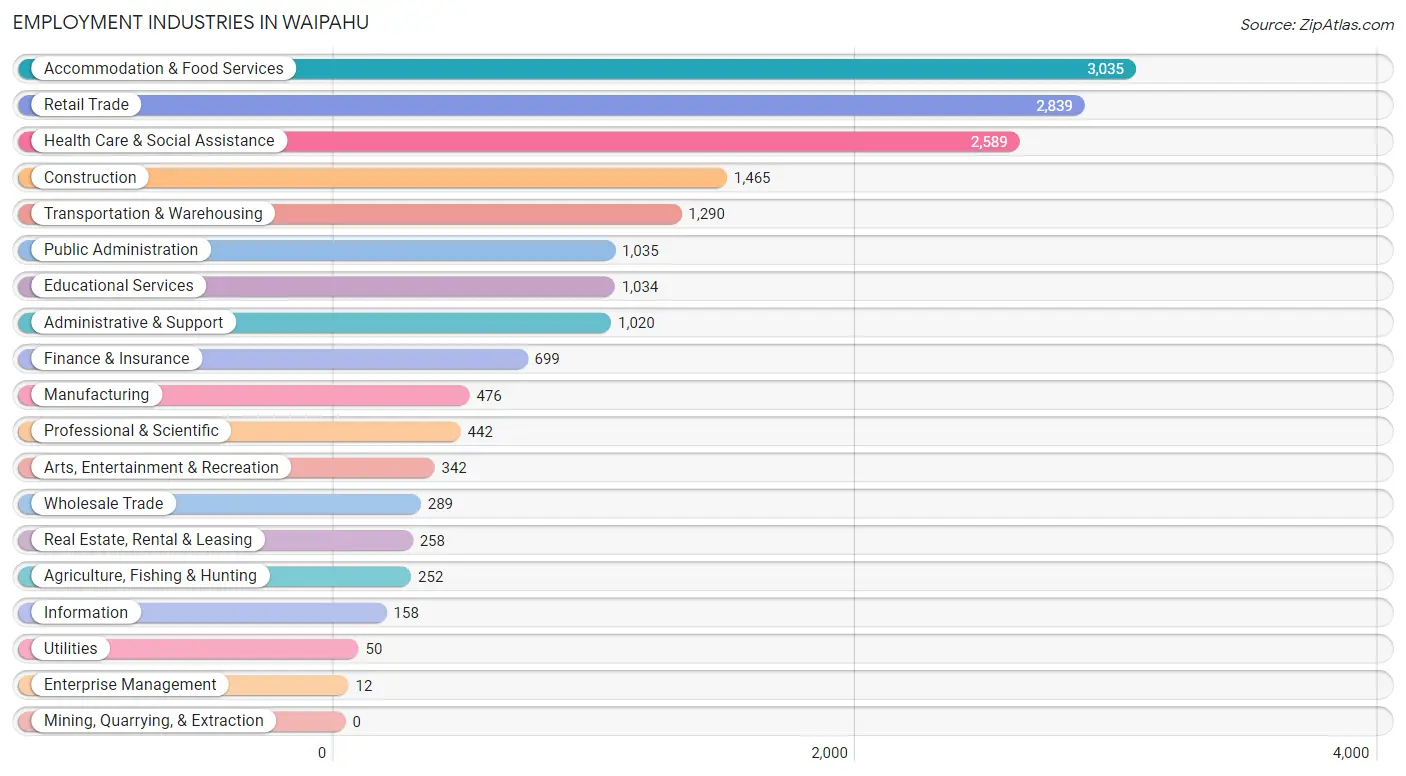
Employment Industries in Waipahu
The major employment industries in Waipahu include Accommodation & Food Services (3,035 | 16.8%), Retail Trade (2,839 | 15.7%), Health Care & Social Assistance (2,589 | 14.3%), Construction (1,465 | 8.1%), and Transportation & Warehousing (1,290 | 7.1%).
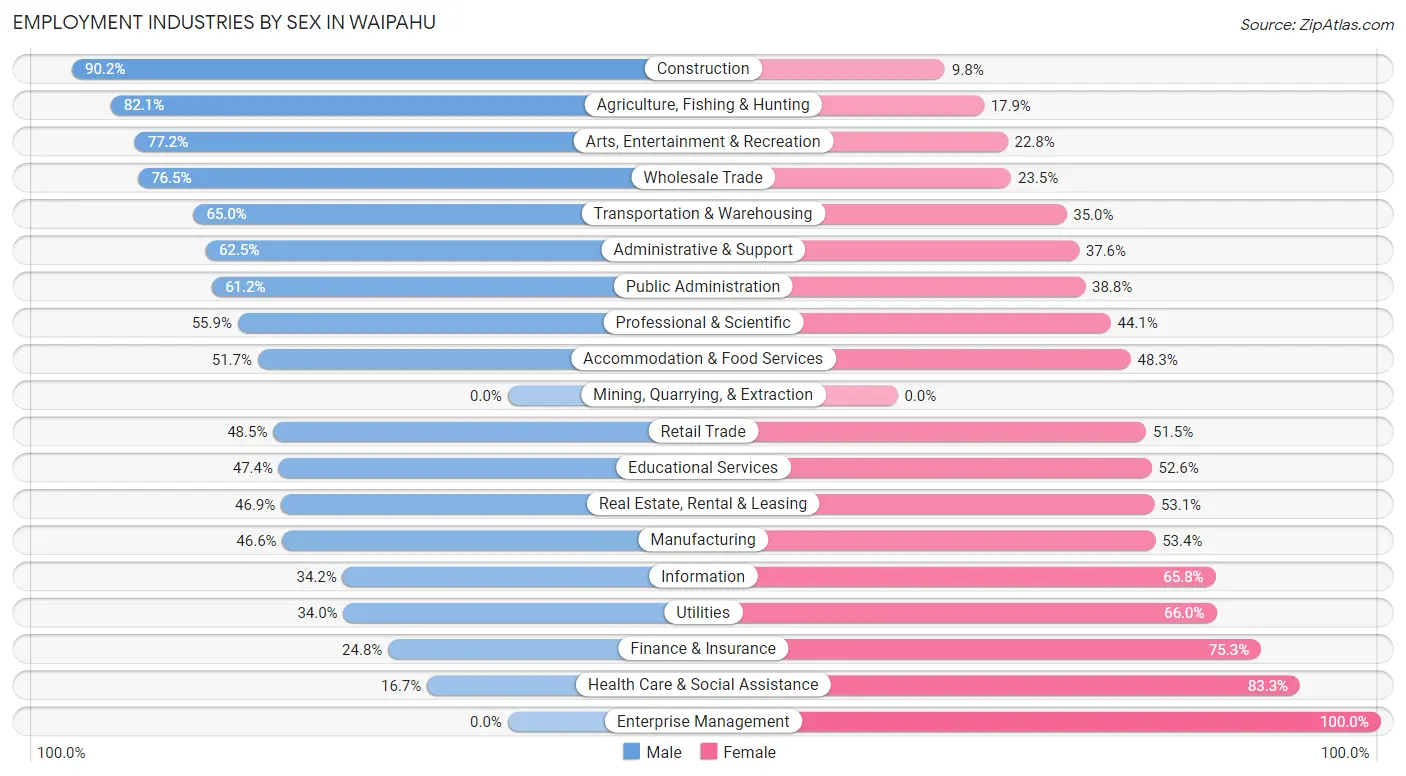
Employment Industries by Sex in Waipahu
The Waipahu industries that see more men than women are Construction (90.2%), Agriculture, Fishing & Hunting (82.1%), and Arts, Entertainment & Recreation (77.2%), whereas the industries that tend to have a higher number of women are Enterprise Management (100.0%), Health Care & Social Assistance (83.3%), and Finance & Insurance (75.2%).
| Industry | Male | Female |
| Agriculture, Fishing & Hunting | 207 (82.1%) | 45 (17.9%) |
| Mining, Quarrying, & Extraction | 0 (0.0%) | 0 (0.0%) |
| Construction | 1,321 (90.2%) | 144 (9.8%) |
| Manufacturing | 222 (46.6%) | 254 (53.4%) |
| Wholesale Trade | 221 (76.5%) | 68 (23.5%) |
| Retail Trade | 1,378 (48.5%) | 1,461 (51.5%) |
| Transportation & Warehousing | 839 (65.0%) | 451 (35.0%) |
| Utilities | 17 (34.0%) | 33 (66.0%) |
| Information | 54 (34.2%) | 104 (65.8%) |
| Finance & Insurance | 173 (24.7%) | 526 (75.2%) |
| Real Estate, Rental & Leasing | 121 (46.9%) | 137 (53.1%) |
| Professional & Scientific | 247 (55.9%) | 195 (44.1%) |
| Enterprise Management | 0 (0.0%) | 12 (100.0%) |
| Administrative & Support | 637 (62.5%) | 383 (37.6%) |
| Educational Services | 490 (47.4%) | 544 (52.6%) |
| Health Care & Social Assistance | 432 (16.7%) | 2,157 (83.3%) |
| Arts, Entertainment & Recreation | 264 (77.2%) | 78 (22.8%) |
| Accommodation & Food Services | 1,570 (51.7%) | 1,465 (48.3%) |
| Public Administration | 633 (61.2%) | 402 (38.8%) |
| Total | 9,268 (51.2%) | 8,840 (48.8%) |
Education in Waipahu
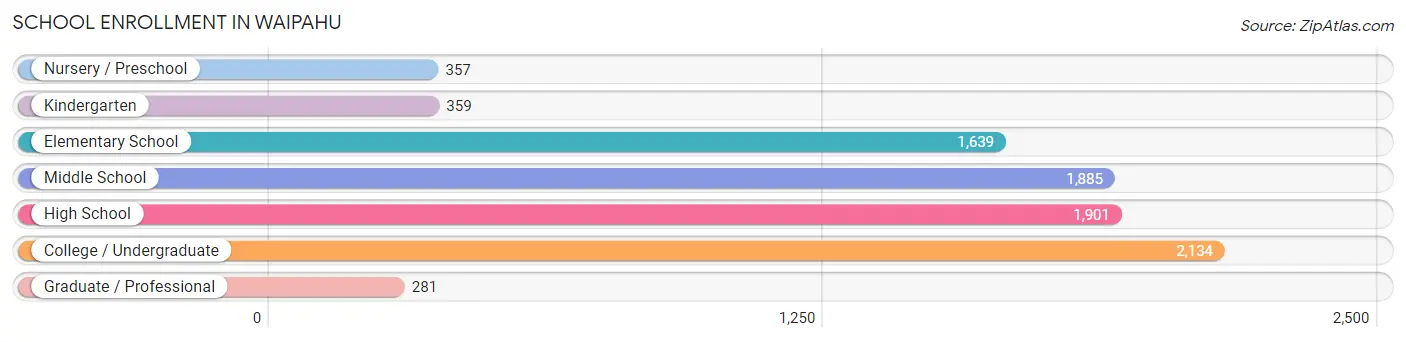
School Enrollment in Waipahu
The most common levels of schooling among the 8,556 students in Waipahu are college / undergraduate (2,134 | 24.9%), high school (1,901 | 22.2%), and middle school (1,885 | 22.0%).
| School Level | # Students | % Students |
| Nursery / Preschool | 357 | 4.2% |
| Kindergarten | 359 | 4.2% |
| Elementary School | 1,639 | 19.2% |
| Middle School | 1,885 | 22.0% |
| High School | 1,901 | 22.2% |
| College / Undergraduate | 2,134 | 24.9% |
| Graduate / Professional | 281 | 3.3% |
| Total | 8,556 | 100.0% |
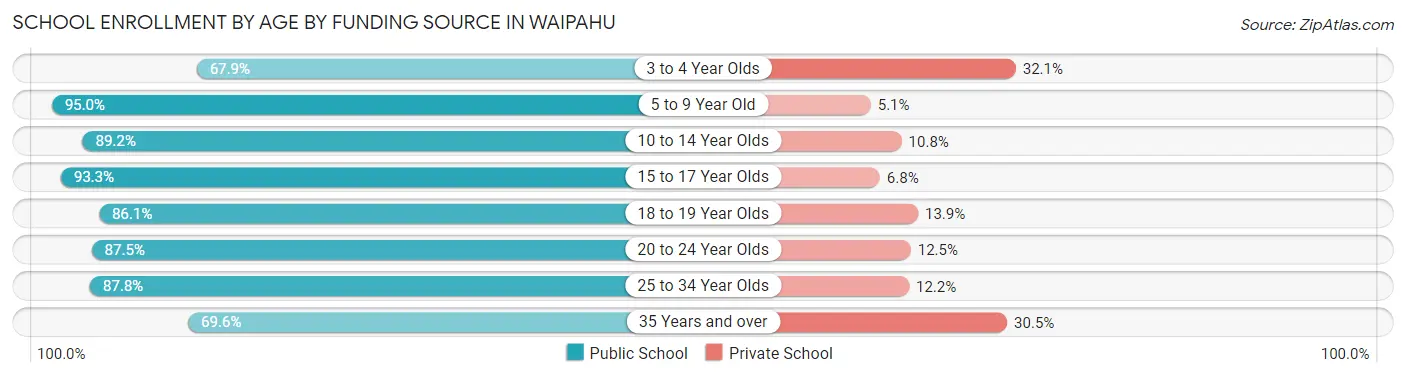
School Enrollment by Age by Funding Source in Waipahu
Out of a total of 8,556 students who are enrolled in schools in Waipahu, 941 (11.0%) attend a private institution, while the remaining 7,615 (89.0%) are enrolled in public schools. The age group of 3 to 4 year olds has the highest likelihood of being enrolled in private schools, with 84 (32.1% in the age bracket) enrolled. Conversely, the age group of 5 to 9 year old has the lowest likelihood of being enrolled in a private school, with 1,860 (95.0% in the age bracket) attending a public institution.
| Age Bracket | Public School | Private School |
| 3 to 4 Year Olds | 178 (67.9%) | 84 (32.1%) |
| 5 to 9 Year Old | 1,860 (95.0%) | 99 (5.1%) |
| 10 to 14 Year Olds | 2,073 (89.2%) | 251 (10.8%) |
| 15 to 17 Year Olds | 1,326 (93.2%) | 96 (6.8%) |
| 18 to 19 Year Olds | 379 (86.1%) | 61 (13.9%) |
| 20 to 24 Year Olds | 952 (87.5%) | 136 (12.5%) |
| 25 to 34 Year Olds | 505 (87.8%) | 70 (12.2%) |
| 35 Years and over | 338 (69.6%) | 148 (30.4%) |
| Total | 7,615 (89.0%) | 941 (11.0%) |
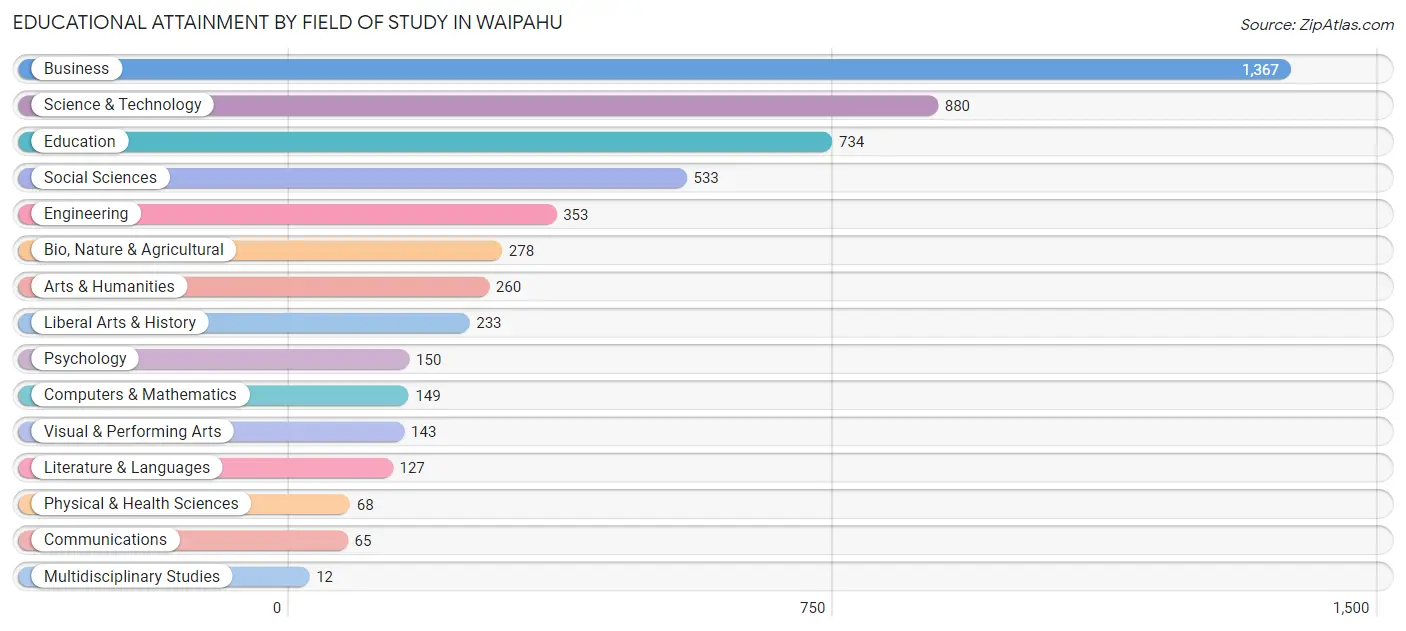
Educational Attainment by Field of Study in Waipahu
Business (1,367 | 25.5%), science & technology (880 | 16.4%), education (734 | 13.7%), social sciences (533 | 10.0%), and engineering (353 | 6.6%) are the most common fields of study among 5,352 individuals in Waipahu who have obtained a bachelor's degree or higher.
| Field of Study | # Graduates | % Graduates |
| Computers & Mathematics | 149 | 2.8% |
| Bio, Nature & Agricultural | 278 | 5.2% |
| Physical & Health Sciences | 68 | 1.3% |
| Psychology | 150 | 2.8% |
| Social Sciences | 533 | 10.0% |
| Engineering | 353 | 6.6% |
| Multidisciplinary Studies | 12 | 0.2% |
| Science & Technology | 880 | 16.4% |
| Business | 1,367 | 25.5% |
| Education | 734 | 13.7% |
| Literature & Languages | 127 | 2.4% |
| Liberal Arts & History | 233 | 4.3% |
| Visual & Performing Arts | 143 | 2.7% |
| Communications | 65 | 1.2% |
| Arts & Humanities | 260 | 4.9% |
| Total | 5,352 | 100.0% |
Transportation & Commute in Waipahu
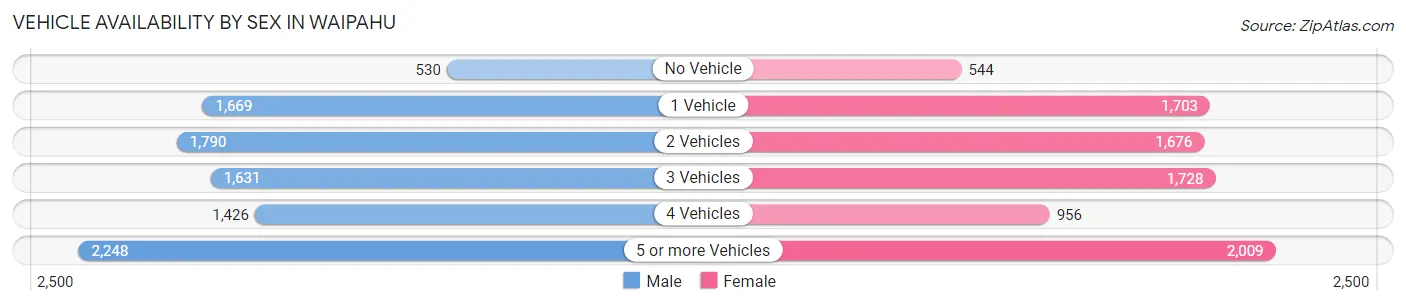
Vehicle Availability by Sex in Waipahu
The most prevalent vehicle ownership categories in Waipahu are males with 5 or more vehicles (2,248, accounting for 24.2%) and females with 5 or more vehicles (2,009, making up 26.1%).
| Vehicles Available | Male | Female |
| No Vehicle | 530 (5.7%) | 544 (6.3%) |
| 1 Vehicle | 1,669 (18.0%) | 1,703 (19.8%) |
| 2 Vehicles | 1,790 (19.3%) | 1,676 (19.5%) |
| 3 Vehicles | 1,631 (17.5%) | 1,728 (20.1%) |
| 4 Vehicles | 1,426 (15.3%) | 956 (11.1%) |
| 5 or more Vehicles | 2,248 (24.2%) | 2,009 (23.3%) |
| Total | 9,294 (100.0%) | 8,616 (100.0%) |
Commute Time in Waipahu
The most frequently occuring commute durations in Waipahu are 30 to 34 minutes (3,446 commuters, 20.1%), 45 to 59 minutes (2,372 commuters, 13.8%), and 20 to 24 minutes (2,300 commuters, 13.4%).
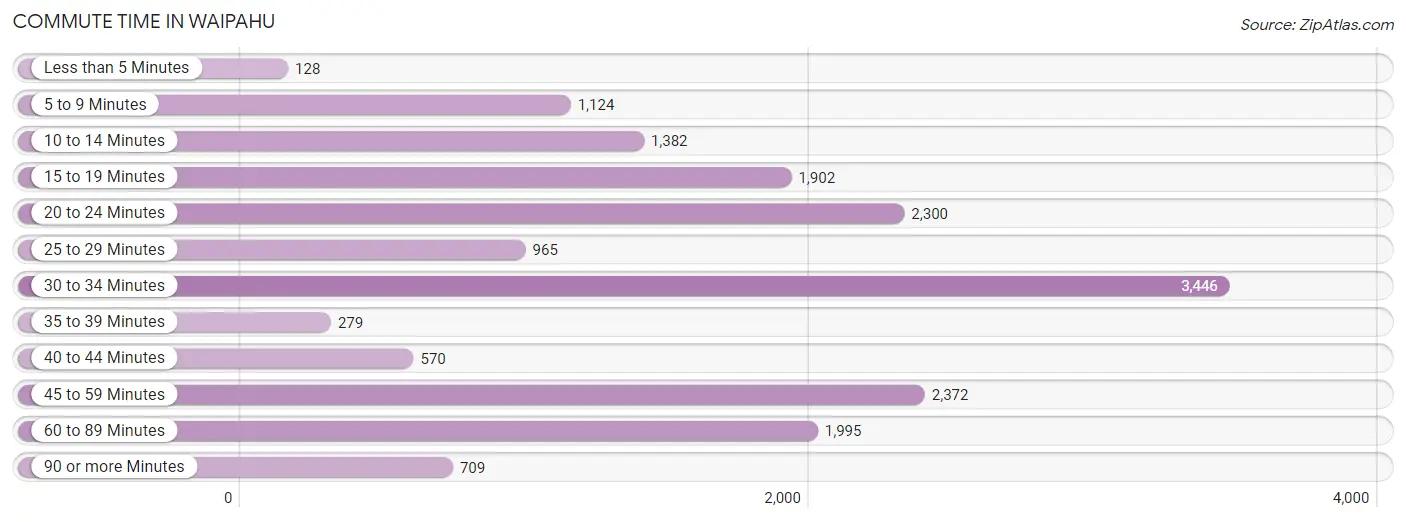
| Commute Time | # Commuters | % Commuters |
| Less than 5 Minutes | 128 | 0.7% |
| 5 to 9 Minutes | 1,124 | 6.6% |
| 10 to 14 Minutes | 1,382 | 8.1% |
| 15 to 19 Minutes | 1,902 | 11.1% |
| 20 to 24 Minutes | 2,300 | 13.4% |
| 25 to 29 Minutes | 965 | 5.6% |
| 30 to 34 Minutes | 3,446 | 20.1% |
| 35 to 39 Minutes | 279 | 1.6% |
| 40 to 44 Minutes | 570 | 3.3% |
| 45 to 59 Minutes | 2,372 | 13.8% |
| 60 to 89 Minutes | 1,995 | 11.6% |
| 90 or more Minutes | 709 | 4.1% |
Commute Time by Sex in Waipahu
The most common commute times in Waipahu are 30 to 34 minutes (2,198 commuters, 24.0%) for males and 30 to 34 minutes (1,248 commuters, 15.6%) for females.
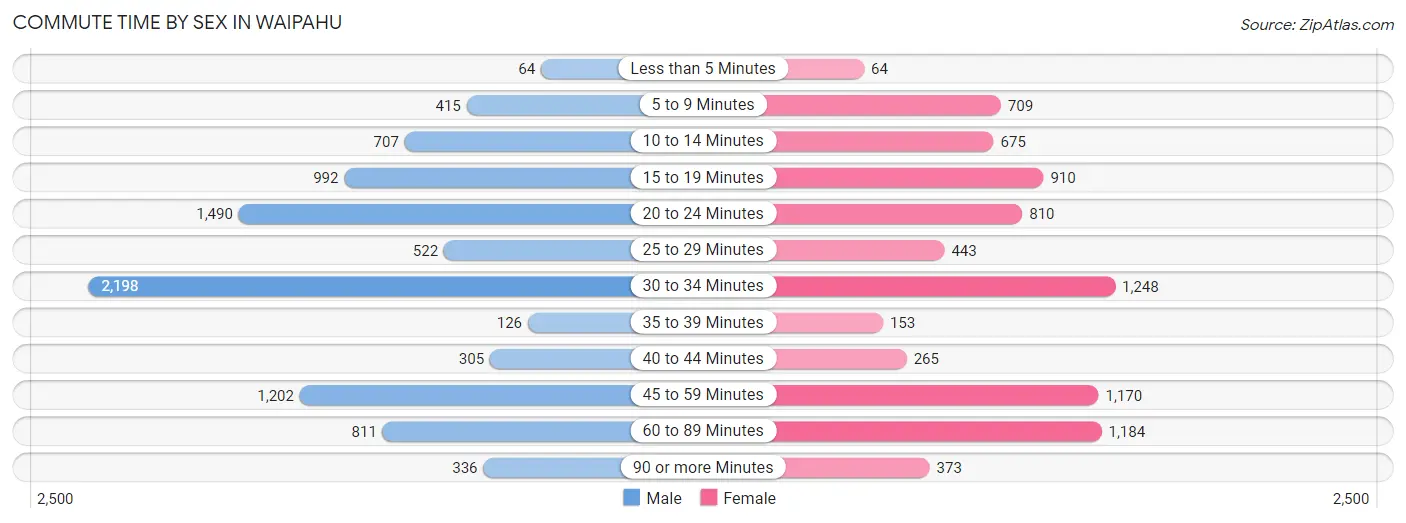
| Commute Time | Male | Female |
| Less than 5 Minutes | 64 (0.7%) | 64 (0.8%) |
| 5 to 9 Minutes | 415 (4.5%) | 709 (8.9%) |
| 10 to 14 Minutes | 707 (7.7%) | 675 (8.4%) |
| 15 to 19 Minutes | 992 (10.8%) | 910 (11.4%) |
| 20 to 24 Minutes | 1,490 (16.3%) | 810 (10.1%) |
| 25 to 29 Minutes | 522 (5.7%) | 443 (5.5%) |
| 30 to 34 Minutes | 2,198 (24.0%) | 1,248 (15.6%) |
| 35 to 39 Minutes | 126 (1.4%) | 153 (1.9%) |
| 40 to 44 Minutes | 305 (3.3%) | 265 (3.3%) |
| 45 to 59 Minutes | 1,202 (13.1%) | 1,170 (14.6%) |
| 60 to 89 Minutes | 811 (8.8%) | 1,184 (14.8%) |
| 90 or more Minutes | 336 (3.7%) | 373 (4.7%) |
Time of Departure to Work by Sex in Waipahu
The most frequent times of departure to work in Waipahu are 12:00 AM to 4:59 AM (1,157, 12.6%) for males and 6:00 AM to 6:29 AM (1,322, 16.5%) for females.
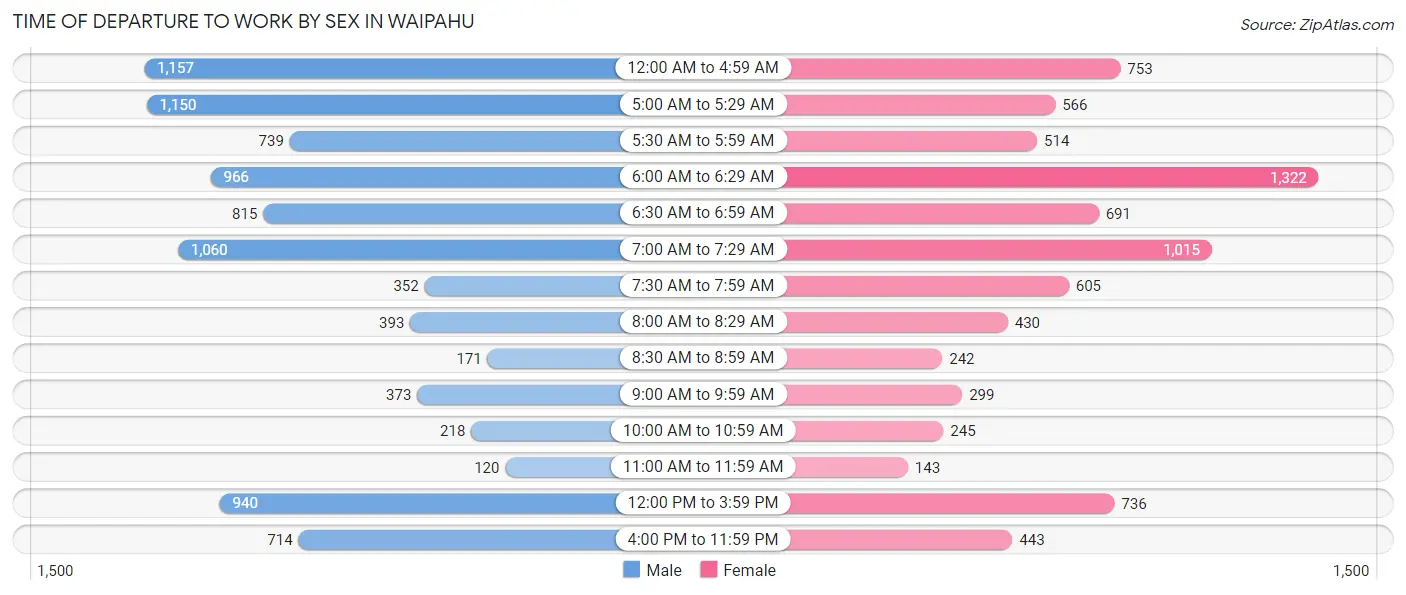
| Time of Departure | Male | Female |
| 12:00 AM to 4:59 AM | 1,157 (12.6%) | 753 (9.4%) |
| 5:00 AM to 5:29 AM | 1,150 (12.5%) | 566 (7.1%) |
| 5:30 AM to 5:59 AM | 739 (8.1%) | 514 (6.4%) |
| 6:00 AM to 6:29 AM | 966 (10.5%) | 1,322 (16.5%) |
| 6:30 AM to 6:59 AM | 815 (8.9%) | 691 (8.6%) |
| 7:00 AM to 7:29 AM | 1,060 (11.6%) | 1,015 (12.7%) |
| 7:30 AM to 7:59 AM | 352 (3.8%) | 605 (7.6%) |
| 8:00 AM to 8:29 AM | 393 (4.3%) | 430 (5.4%) |
| 8:30 AM to 8:59 AM | 171 (1.9%) | 242 (3.0%) |
| 9:00 AM to 9:59 AM | 373 (4.1%) | 299 (3.7%) |
| 10:00 AM to 10:59 AM | 218 (2.4%) | 245 (3.1%) |
| 11:00 AM to 11:59 AM | 120 (1.3%) | 143 (1.8%) |
| 12:00 PM to 3:59 PM | 940 (10.2%) | 736 (9.2%) |
| 4:00 PM to 11:59 PM | 714 (7.8%) | 443 (5.5%) |
| Total | 9,168 (100.0%) | 8,004 (100.0%) |
Housing Occupancy in Waipahu
Occupancy by Ownership in Waipahu
Of the total 8,782 dwellings in Waipahu, owner-occupied units account for 5,053 (57.5%), while renter-occupied units make up 3,729 (42.5%).
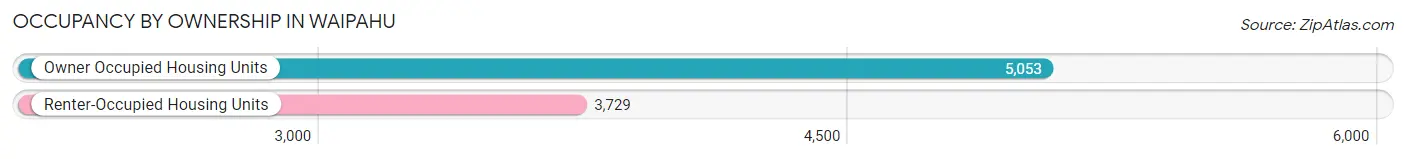
| Occupancy | # Housing Units | % Housing Units |
| Owner Occupied Housing Units | 5,053 | 57.5% |
| Renter-Occupied Housing Units | 3,729 | 42.5% |
| Total Occupied Housing Units | 8,782 | 100.0% |
Occupancy by Household Size in Waipahu
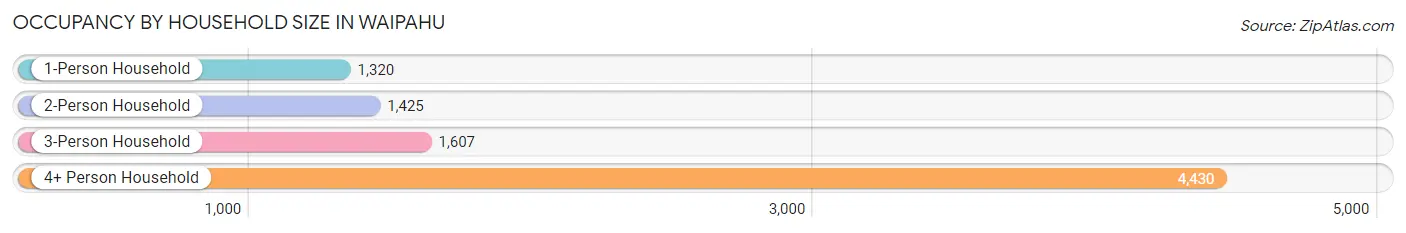
| Household Size | # Housing Units | % Housing Units |
| 1-Person Household | 1,320 | 15.0% |
| 2-Person Household | 1,425 | 16.2% |
| 3-Person Household | 1,607 | 18.3% |
| 4+ Person Household | 4,430 | 50.4% |
| Total Housing Units | 8,782 | 100.0% |
Occupancy by Ownership by Household Size in Waipahu
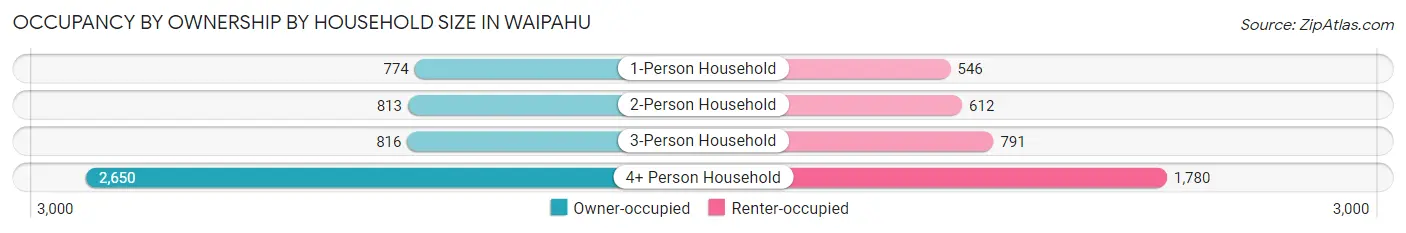
| Household Size | Owner-occupied | Renter-occupied |
| 1-Person Household | 774 (58.6%) | 546 (41.4%) |
| 2-Person Household | 813 (57.1%) | 612 (42.9%) |
| 3-Person Household | 816 (50.8%) | 791 (49.2%) |
| 4+ Person Household | 2,650 (59.8%) | 1,780 (40.2%) |
| Total Housing Units | 5,053 (57.5%) | 3,729 (42.5%) |
Occupancy by Educational Attainment in Waipahu
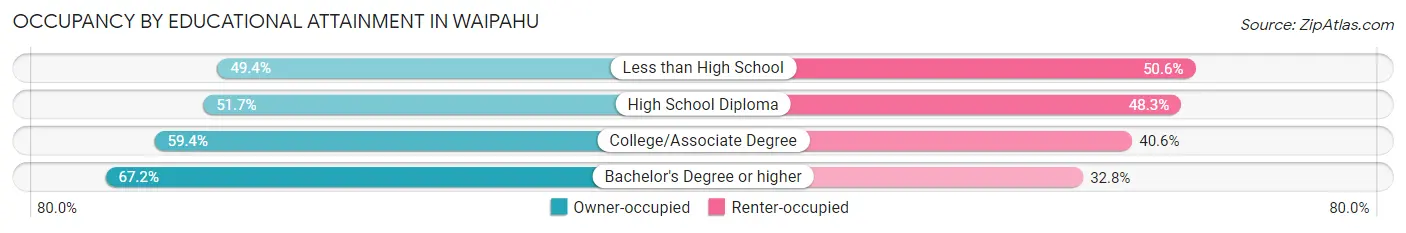
| Household Size | Owner-occupied | Renter-occupied |
| Less than High School | 493 (49.4%) | 505 (50.6%) |
| High School Diploma | 1,322 (51.7%) | 1,237 (48.3%) |
| College/Associate Degree | 2,068 (59.4%) | 1,415 (40.6%) |
| Bachelor's Degree or higher | 1,170 (67.2%) | 572 (32.8%) |
Occupancy by Age of Householder in Waipahu
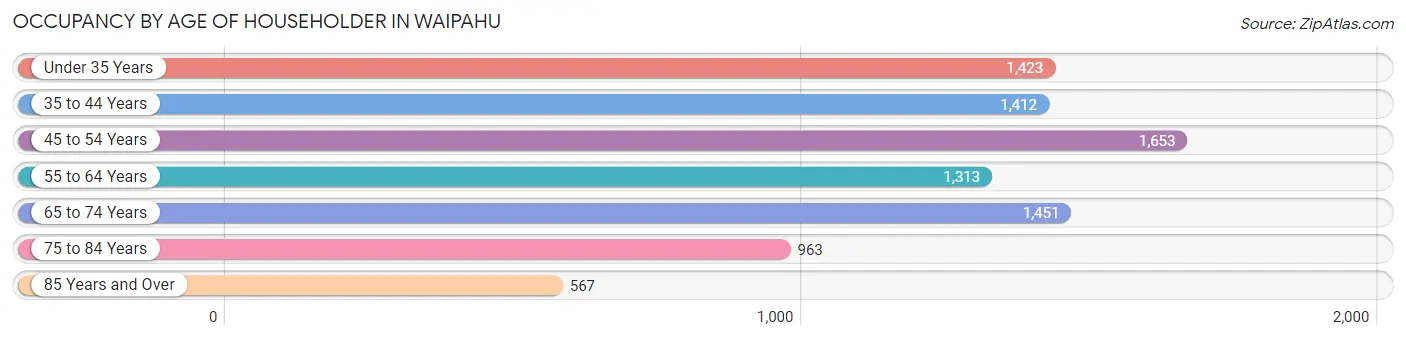
| Age Bracket | # Households | % Households |
| Under 35 Years | 1,423 | 16.2% |
| 35 to 44 Years | 1,412 | 16.1% |
| 45 to 54 Years | 1,653 | 18.8% |
| 55 to 64 Years | 1,313 | 14.9% |
| 65 to 74 Years | 1,451 | 16.5% |
| 75 to 84 Years | 963 | 11.0% |
| 85 Years and Over | 567 | 6.5% |
| Total | 8,782 | 100.0% |
Housing Finances in Waipahu
Median Income by Occupancy in Waipahu
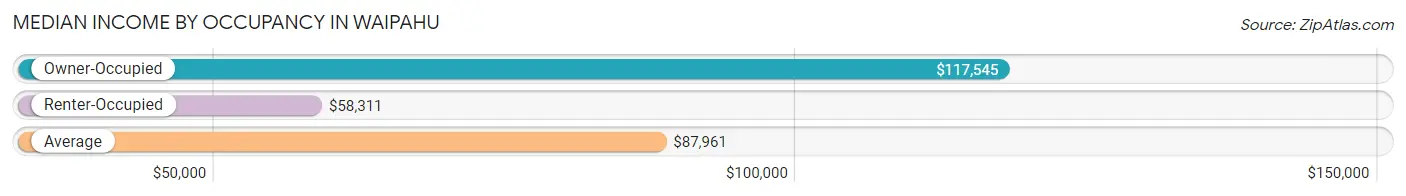
| Occupancy Type | # Households | Median Income |
| Owner-Occupied | 5,053 (57.5%) | $117,545 |
| Renter-Occupied | 3,729 (42.5%) | $58,311 |
| Average | 8,782 (100.0%) | $87,961 |
Occupancy by Householder Income Bracket in Waipahu
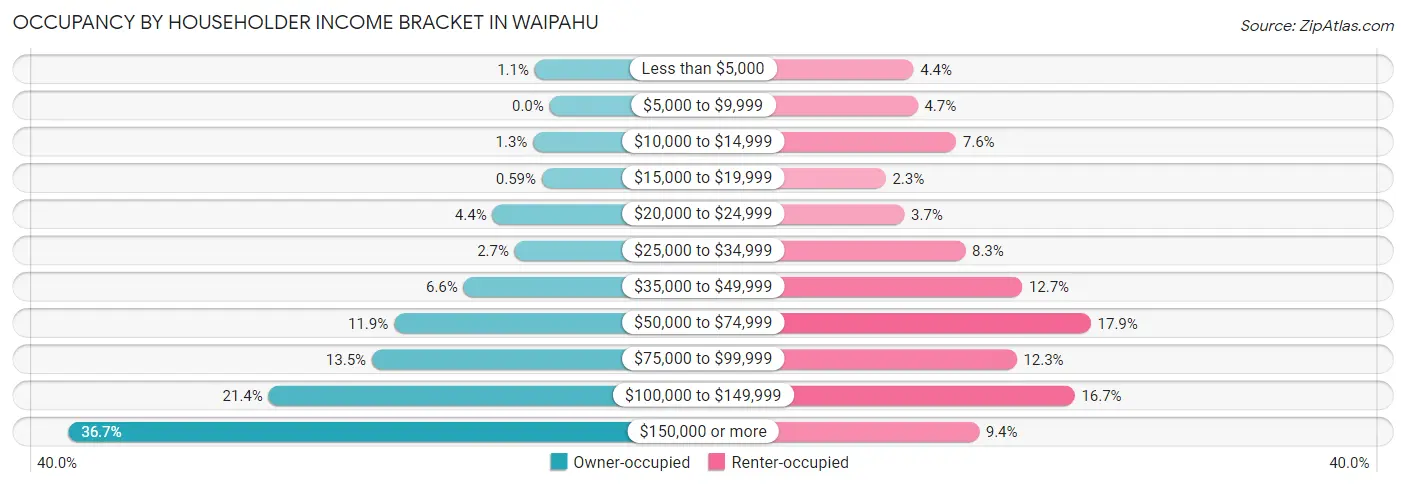
| Income Bracket | Owner-occupied | Renter-occupied |
| Less than $5,000 | 57 (1.1%) | 164 (4.4%) |
| $5,000 to $9,999 | 0 (0.0%) | 176 (4.7%) |
| $10,000 to $14,999 | 63 (1.3%) | 285 (7.6%) |
| $15,000 to $19,999 | 30 (0.6%) | 85 (2.3%) |
| $20,000 to $24,999 | 220 (4.3%) | 138 (3.7%) |
| $25,000 to $34,999 | 134 (2.6%) | 311 (8.3%) |
| $35,000 to $49,999 | 331 (6.6%) | 473 (12.7%) |
| $50,000 to $74,999 | 599 (11.8%) | 668 (17.9%) |
| $75,000 to $99,999 | 684 (13.5%) | 457 (12.3%) |
| $100,000 to $149,999 | 1,082 (21.4%) | 622 (16.7%) |
| $150,000 or more | 1,853 (36.7%) | 350 (9.4%) |
| Total | 5,053 (100.0%) | 3,729 (100.0%) |
Monthly Housing Cost Tiers in Waipahu
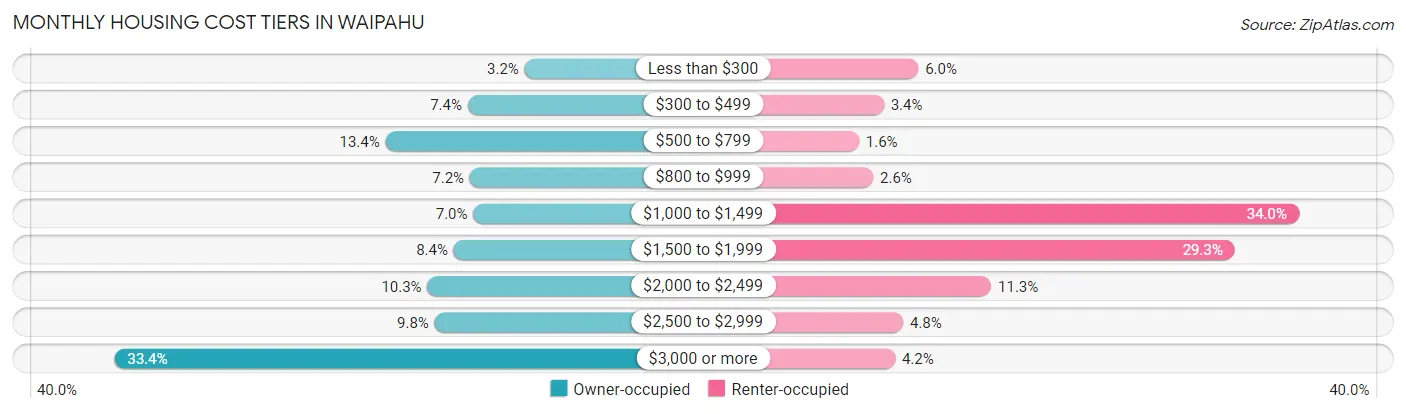
| Monthly Cost | Owner-occupied | Renter-occupied |
| Less than $300 | 160 (3.2%) | 222 (5.9%) |
| $300 to $499 | 372 (7.4%) | 127 (3.4%) |
| $500 to $799 | 678 (13.4%) | 59 (1.6%) |
| $800 to $999 | 364 (7.2%) | 98 (2.6%) |
| $1,000 to $1,499 | 351 (7.0%) | 1,267 (34.0%) |
| $1,500 to $1,999 | 424 (8.4%) | 1,091 (29.3%) |
| $2,000 to $2,499 | 522 (10.3%) | 422 (11.3%) |
| $2,500 to $2,999 | 495 (9.8%) | 180 (4.8%) |
| $3,000 or more | 1,687 (33.4%) | 158 (4.2%) |
| Total | 5,053 (100.0%) | 3,729 (100.0%) |
Physical Housing Characteristics in Waipahu
Housing Structures in Waipahu
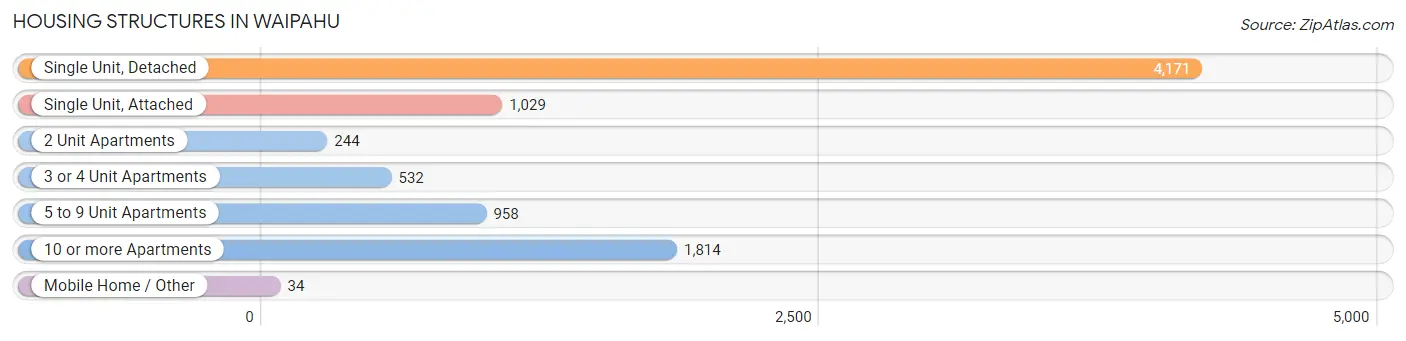
| Structure Type | # Housing Units | % Housing Units |
| Single Unit, Detached | 4,171 | 47.5% |
| Single Unit, Attached | 1,029 | 11.7% |
| 2 Unit Apartments | 244 | 2.8% |
| 3 or 4 Unit Apartments | 532 | 6.1% |
| 5 to 9 Unit Apartments | 958 | 10.9% |
| 10 or more Apartments | 1,814 | 20.7% |
| Mobile Home / Other | 34 | 0.4% |
| Total | 8,782 | 100.0% |
Housing Structures by Occupancy in Waipahu
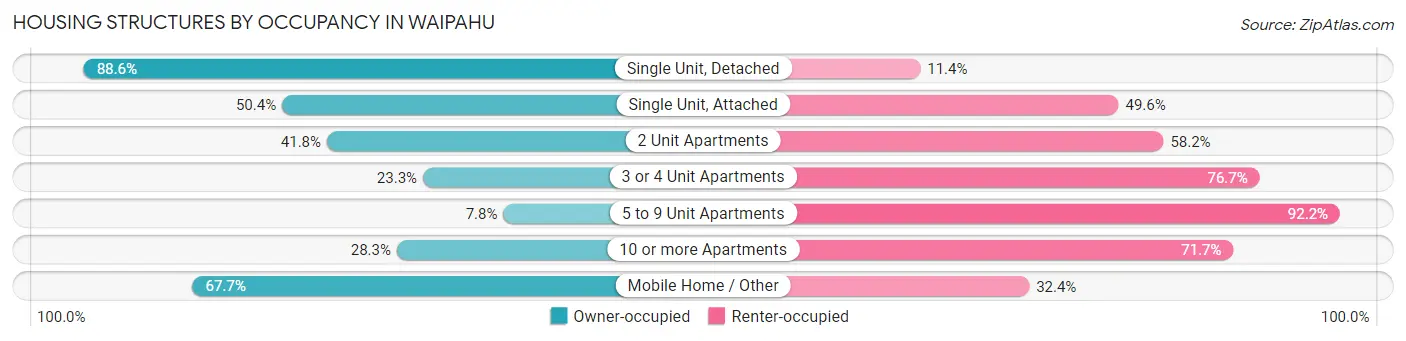
| Structure Type | Owner-occupied | Renter-occupied |
| Single Unit, Detached | 3,696 (88.6%) | 475 (11.4%) |
| Single Unit, Attached | 519 (50.4%) | 510 (49.6%) |
| 2 Unit Apartments | 102 (41.8%) | 142 (58.2%) |
| 3 or 4 Unit Apartments | 124 (23.3%) | 408 (76.7%) |
| 5 to 9 Unit Apartments | 75 (7.8%) | 883 (92.2%) |
| 10 or more Apartments | 514 (28.3%) | 1,300 (71.7%) |
| Mobile Home / Other | 23 (67.6%) | 11 (32.4%) |
| Total | 5,053 (57.5%) | 3,729 (42.5%) |
Housing Structures by Number of Rooms in Waipahu
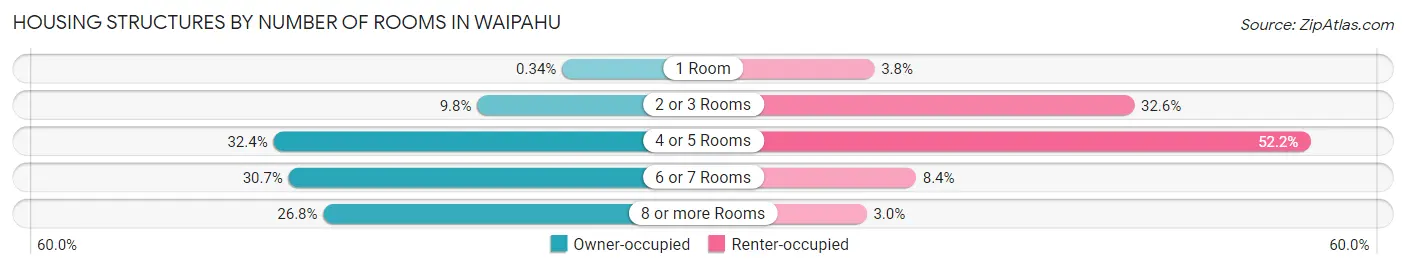
| Number of Rooms | Owner-occupied | Renter-occupied |
| 1 Room | 17 (0.3%) | 142 (3.8%) |
| 2 or 3 Rooms | 493 (9.8%) | 1,217 (32.6%) |
| 4 or 5 Rooms | 1,636 (32.4%) | 1,946 (52.2%) |
| 6 or 7 Rooms | 1,551 (30.7%) | 314 (8.4%) |
| 8 or more Rooms | 1,356 (26.8%) | 110 (2.9%) |
| Total | 5,053 (100.0%) | 3,729 (100.0%) |
Housing Structure by Heating Type in Waipahu
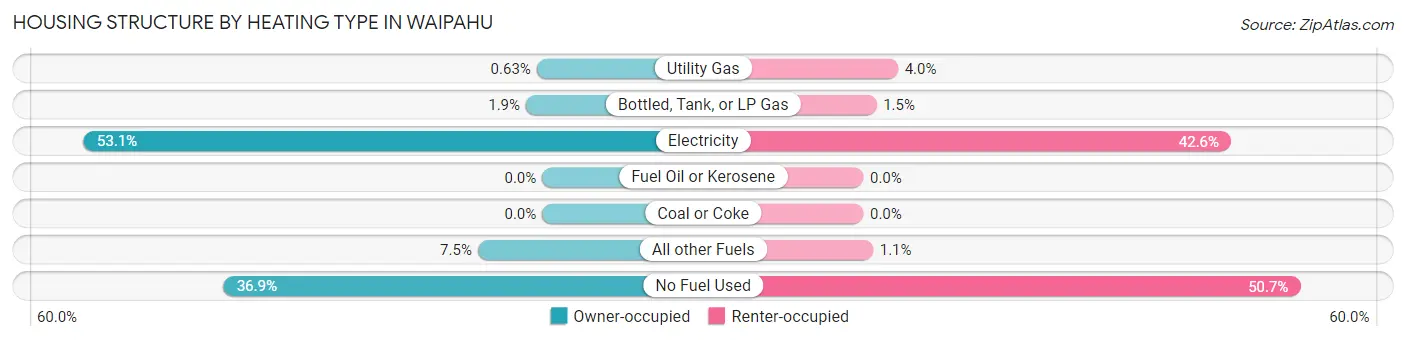
| Heating Type | Owner-occupied | Renter-occupied |
| Utility Gas | 32 (0.6%) | 150 (4.0%) |
| Bottled, Tank, or LP Gas | 95 (1.9%) | 57 (1.5%) |
| Electricity | 2,684 (53.1%) | 1,590 (42.6%) |
| Fuel Oil or Kerosene | 0 (0.0%) | 0 (0.0%) |
| Coal or Coke | 0 (0.0%) | 0 (0.0%) |
| All other Fuels | 377 (7.5%) | 42 (1.1%) |
| No Fuel Used | 1,865 (36.9%) | 1,890 (50.7%) |
| Total | 5,053 (100.0%) | 3,729 (100.0%) |
Household Vehicle Usage in Waipahu
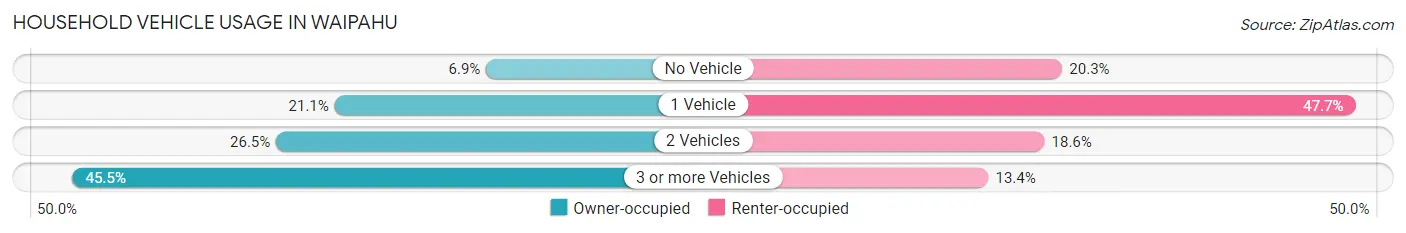
| Vehicles per Household | Owner-occupied | Renter-occupied |
| No Vehicle | 349 (6.9%) | 757 (20.3%) |
| 1 Vehicle | 1,064 (21.1%) | 1,777 (47.6%) |
| 2 Vehicles | 1,340 (26.5%) | 695 (18.6%) |
| 3 or more Vehicles | 2,300 (45.5%) | 500 (13.4%) |
| Total | 5,053 (100.0%) | 3,729 (100.0%) |
Real Estate & Mortgages in Waipahu
Real Estate and Mortgage Overview in Waipahu
| Characteristic | Without Mortgage | With Mortgage |
| Housing Units | 1,556 | 3,497 |
| Median Property Value | $794,600 | $810,400 |
| Median Household Income | $107,197 | $1,436 |
| Monthly Housing Costs | $621 | $1,687 |
| Real Estate Taxes | $2,045 | $325 |
Property Value by Mortgage Status in Waipahu
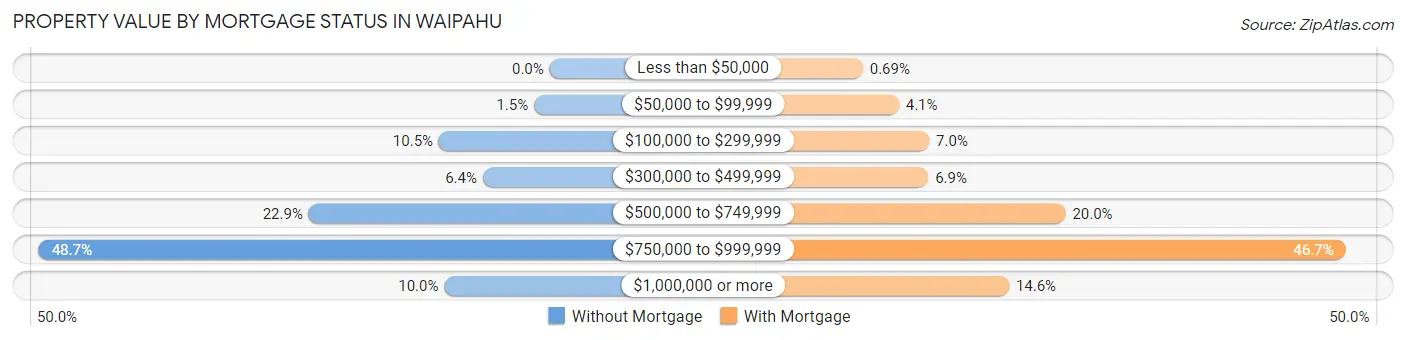
| Property Value | Without Mortgage | With Mortgage |
| Less than $50,000 | 0 (0.0%) | 24 (0.7%) |
| $50,000 to $99,999 | 23 (1.5%) | 144 (4.1%) |
| $100,000 to $299,999 | 164 (10.5%) | 245 (7.0%) |
| $300,000 to $499,999 | 99 (6.4%) | 242 (6.9%) |
| $500,000 to $749,999 | 357 (22.9%) | 699 (20.0%) |
| $750,000 to $999,999 | 757 (48.6%) | 1,632 (46.7%) |
| $1,000,000 or more | 156 (10.0%) | 511 (14.6%) |
| Total | 1,556 (100.0%) | 3,497 (100.0%) |
Household Income by Mortgage Status in Waipahu
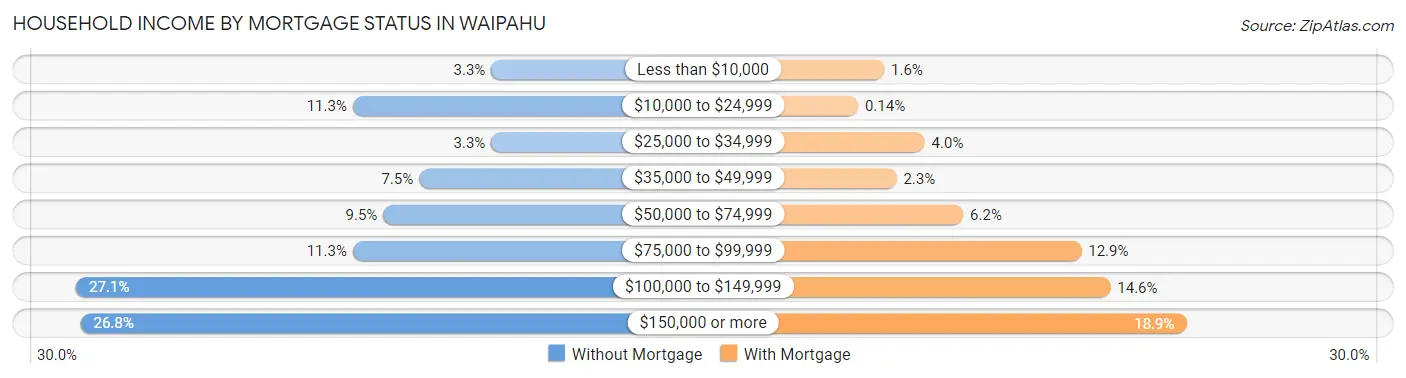
| Household Income | Without Mortgage | With Mortgage |
| Less than $10,000 | 52 (3.3%) | 57 (1.6%) |
| $10,000 to $24,999 | 175 (11.3%) | 5 (0.1%) |
| $25,000 to $34,999 | 52 (3.3%) | 138 (4.0%) |
| $35,000 to $49,999 | 116 (7.5%) | 82 (2.3%) |
| $50,000 to $74,999 | 148 (9.5%) | 215 (6.1%) |
| $75,000 to $99,999 | 175 (11.3%) | 451 (12.9%) |
| $100,000 to $149,999 | 421 (27.1%) | 509 (14.6%) |
| $150,000 or more | 417 (26.8%) | 661 (18.9%) |
| Total | 1,556 (100.0%) | 3,497 (100.0%) |
Property Value to Household Income Ratio in Waipahu
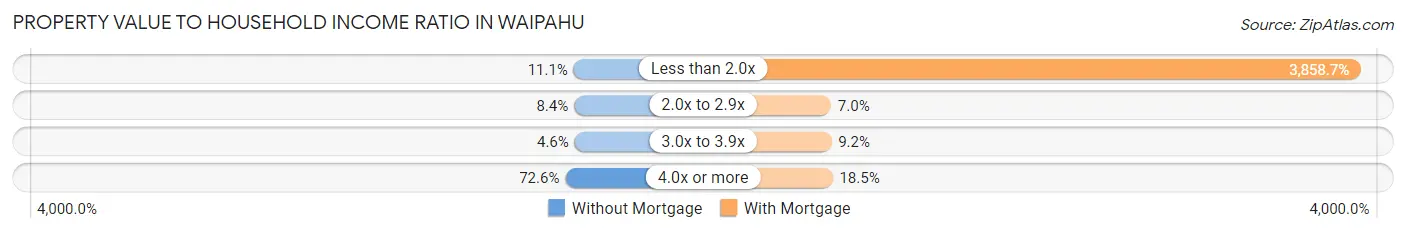
| Value-to-Income Ratio | Without Mortgage | With Mortgage |
| Less than 2.0x | 173 (11.1%) | 134,940 (3,858.7%) |
| 2.0x to 2.9x | 130 (8.4%) | 245 (7.0%) |
| 3.0x to 3.9x | 72 (4.6%) | 323 (9.2%) |
| 4.0x or more | 1,129 (72.6%) | 646 (18.5%) |
| Total | 1,556 (100.0%) | 3,497 (100.0%) |
Real Estate Taxes by Mortgage Status in Waipahu
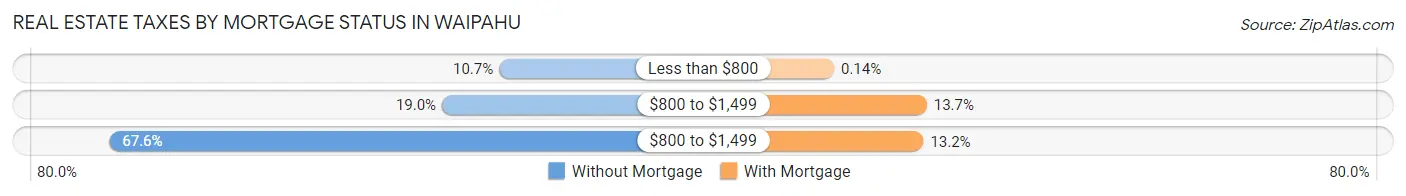
| Property Taxes | Without Mortgage | With Mortgage |
| Less than $800 | 166 (10.7%) | 5 (0.1%) |
| $800 to $1,499 | 296 (19.0%) | 479 (13.7%) |
| $800 to $1,499 | 1,052 (67.6%) | 462 (13.2%) |
| Total | 1,556 (100.0%) | 3,497 (100.0%) |
Health & Disability in Waipahu
Health Insurance Coverage by Age in Waipahu
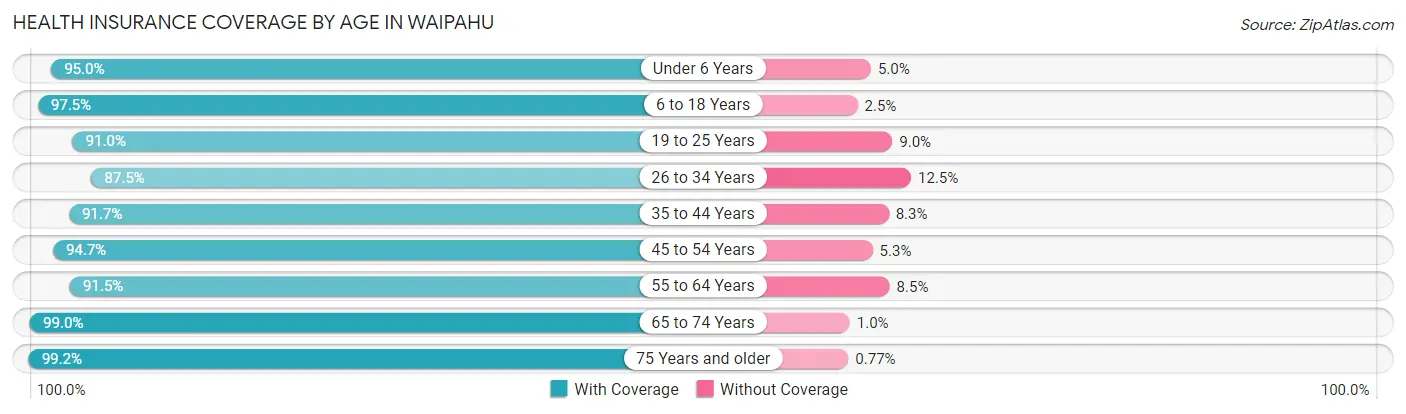
| Age Bracket | With Coverage | Without Coverage |
| Under 6 Years | 2,812 (95.0%) | 147 (5.0%) |
| 6 to 18 Years | 5,746 (97.5%) | 146 (2.5%) |
| 19 to 25 Years | 3,270 (91.0%) | 322 (9.0%) |
| 26 to 34 Years | 4,426 (87.5%) | 630 (12.5%) |
| 35 to 44 Years | 4,019 (91.7%) | 363 (8.3%) |
| 45 to 54 Years | 4,569 (94.7%) | 255 (5.3%) |
| 55 to 64 Years | 3,819 (91.5%) | 353 (8.5%) |
| 65 to 74 Years | 3,719 (99.0%) | 39 (1.0%) |
| 75 Years and older | 4,271 (99.2%) | 33 (0.8%) |
| Total | 36,651 (94.1%) | 2,288 (5.9%) |
Health Insurance Coverage by Citizenship Status in Waipahu
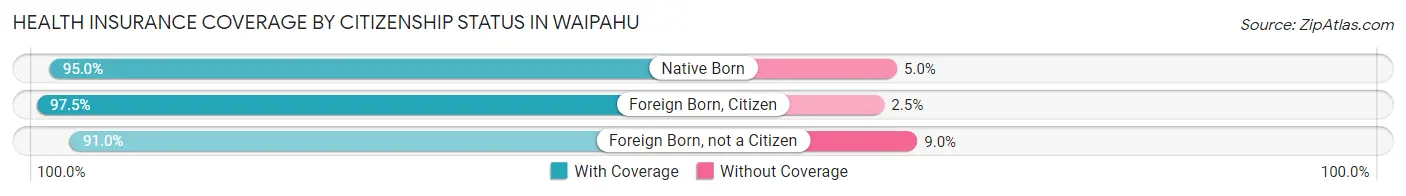
| Citizenship Status | With Coverage | Without Coverage |
| Native Born | 2,812 (95.0%) | 147 (5.0%) |
| Foreign Born, Citizen | 5,746 (97.5%) | 146 (2.5%) |
| Foreign Born, not a Citizen | 3,270 (91.0%) | 322 (9.0%) |
Health Insurance Coverage by Household Income in Waipahu
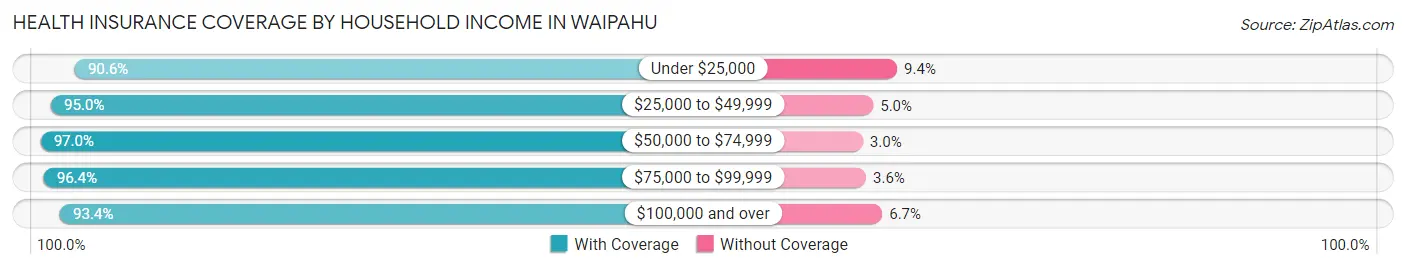
| Household Income | With Coverage | Without Coverage |
| Under $25,000 | 2,264 (90.6%) | 236 (9.4%) |
| $25,000 to $49,999 | 3,313 (95.0%) | 173 (5.0%) |
| $50,000 to $74,999 | 4,078 (97.0%) | 127 (3.0%) |
| $75,000 to $99,999 | 4,029 (96.4%) | 151 (3.6%) |
| $100,000 and over | 22,279 (93.3%) | 1,586 (6.7%) |
Public vs Private Health Insurance Coverage by Age in Waipahu
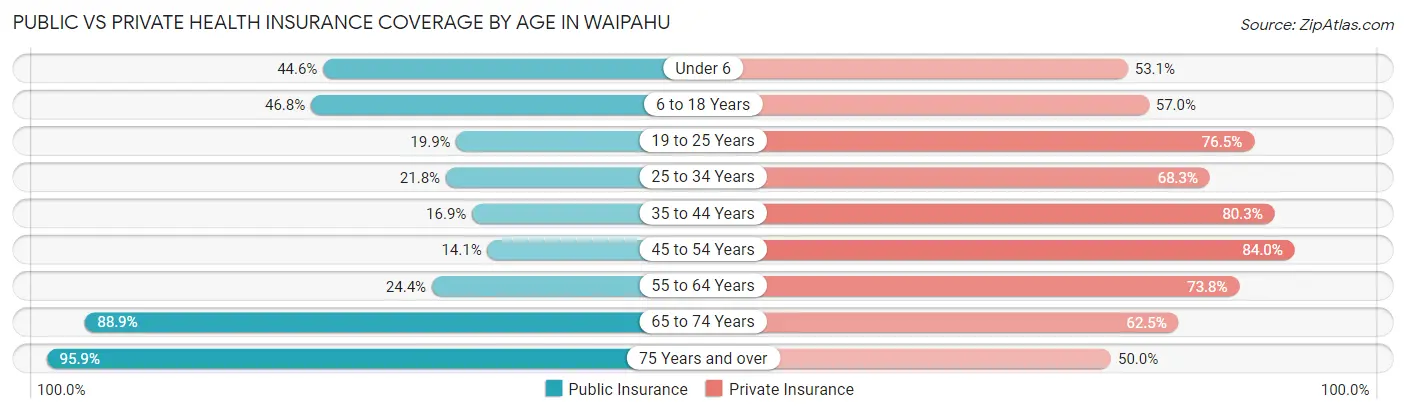
| Age Bracket | Public Insurance | Private Insurance |
| Under 6 | 1,319 (44.6%) | 1,571 (53.1%) |
| 6 to 18 Years | 2,759 (46.8%) | 3,357 (57.0%) |
| 19 to 25 Years | 713 (19.9%) | 2,748 (76.5%) |
| 25 to 34 Years | 1,102 (21.8%) | 3,453 (68.3%) |
| 35 to 44 Years | 742 (16.9%) | 3,519 (80.3%) |
| 45 to 54 Years | 679 (14.1%) | 4,054 (84.0%) |
| 55 to 64 Years | 1,018 (24.4%) | 3,078 (73.8%) |
| 65 to 74 Years | 3,341 (88.9%) | 2,349 (62.5%) |
| 75 Years and over | 4,128 (95.9%) | 2,151 (50.0%) |
| Total | 15,801 (40.6%) | 26,280 (67.5%) |
Disability Status by Sex by Age in Waipahu
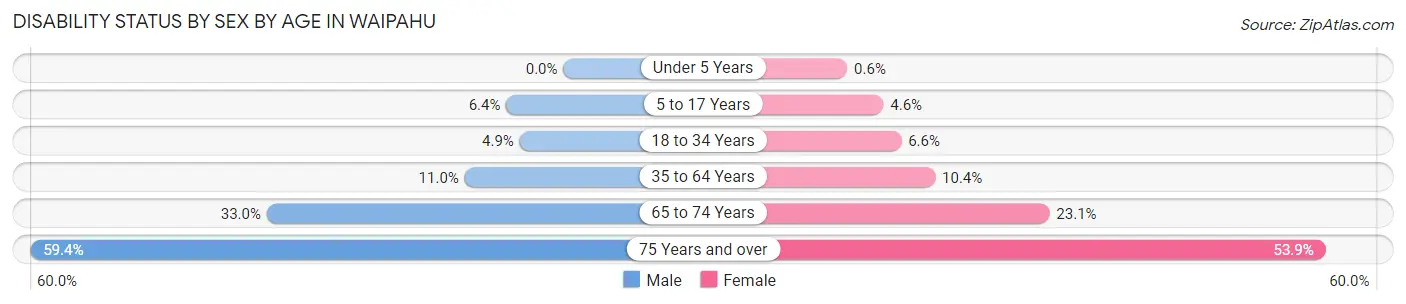
| Age Bracket | Male | Female |
| Under 5 Years | 0 (0.0%) | 9 (0.6%) |
| 5 to 17 Years | 203 (6.4%) | 130 (4.6%) |
| 18 to 34 Years | 228 (4.9%) | 282 (6.6%) |
| 35 to 64 Years | 733 (11.0%) | 697 (10.4%) |
| 65 to 74 Years | 587 (33.0%) | 458 (23.1%) |
| 75 Years and over | 805 (59.4%) | 1,588 (53.9%) |
Disability Class by Sex by Age in Waipahu
Disability Class: Hearing Difficulty
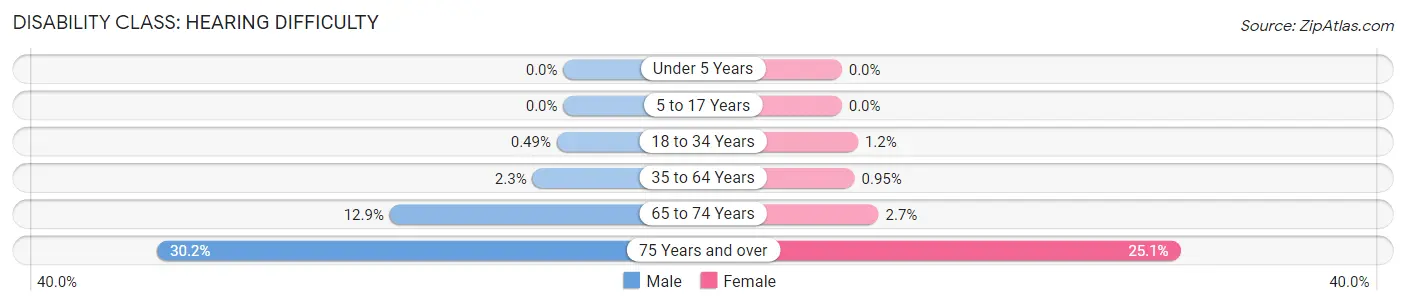
| Age Bracket | Male | Female |
| Under 5 Years | 0 (0.0%) | 0 (0.0%) |
| 5 to 17 Years | 0 (0.0%) | 0 (0.0%) |
| 18 to 34 Years | 23 (0.5%) | 51 (1.2%) |
| 35 to 64 Years | 153 (2.3%) | 64 (0.9%) |
| 65 to 74 Years | 229 (12.9%) | 54 (2.7%) |
| 75 Years and over | 409 (30.2%) | 741 (25.1%) |
Disability Class: Vision Difficulty
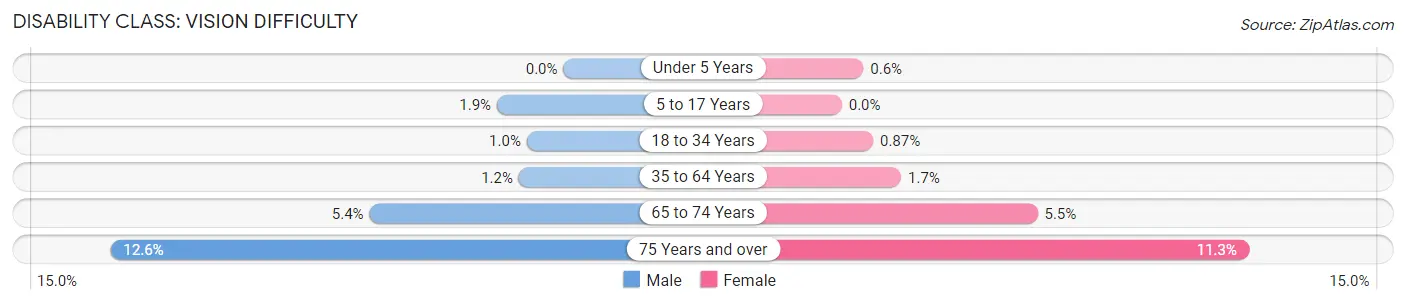
| Age Bracket | Male | Female |
| Under 5 Years | 0 (0.0%) | 9 (0.6%) |
| 5 to 17 Years | 59 (1.8%) | 0 (0.0%) |
| 18 to 34 Years | 48 (1.0%) | 37 (0.9%) |
| 35 to 64 Years | 83 (1.2%) | 111 (1.7%) |
| 65 to 74 Years | 96 (5.4%) | 108 (5.4%) |
| 75 Years and over | 171 (12.6%) | 334 (11.3%) |
Disability Class: Cognitive Difficulty
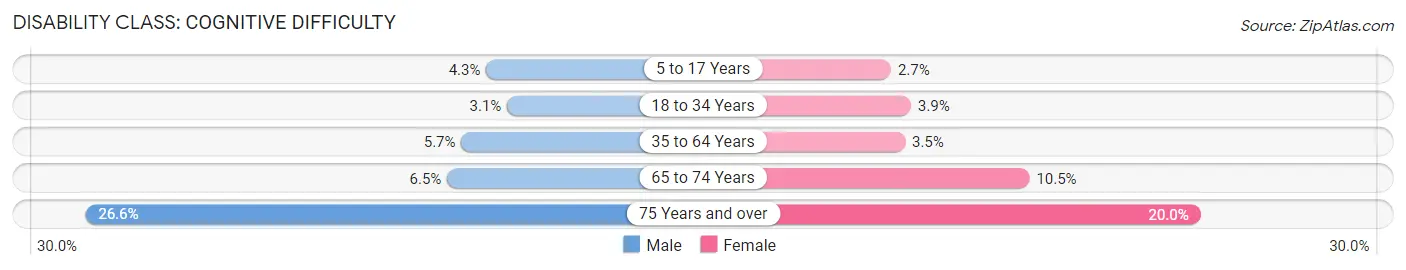
| Age Bracket | Male | Female |
| 5 to 17 Years | 137 (4.3%) | 77 (2.7%) |
| 18 to 34 Years | 147 (3.1%) | 164 (3.8%) |
| 35 to 64 Years | 379 (5.7%) | 236 (3.5%) |
| 65 to 74 Years | 115 (6.5%) | 207 (10.4%) |
| 75 Years and over | 361 (26.6%) | 589 (20.0%) |
Disability Class: Ambulatory Difficulty
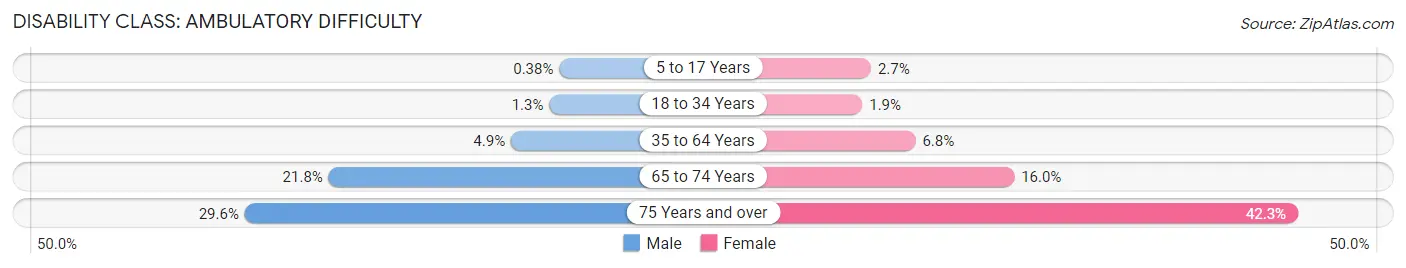
| Age Bracket | Male | Female |
| 5 to 17 Years | 12 (0.4%) | 76 (2.7%) |
| 18 to 34 Years | 61 (1.3%) | 81 (1.9%) |
| 35 to 64 Years | 324 (4.9%) | 459 (6.8%) |
| 65 to 74 Years | 387 (21.8%) | 317 (16.0%) |
| 75 Years and over | 401 (29.6%) | 1,248 (42.3%) |
Disability Class: Self-Care Difficulty
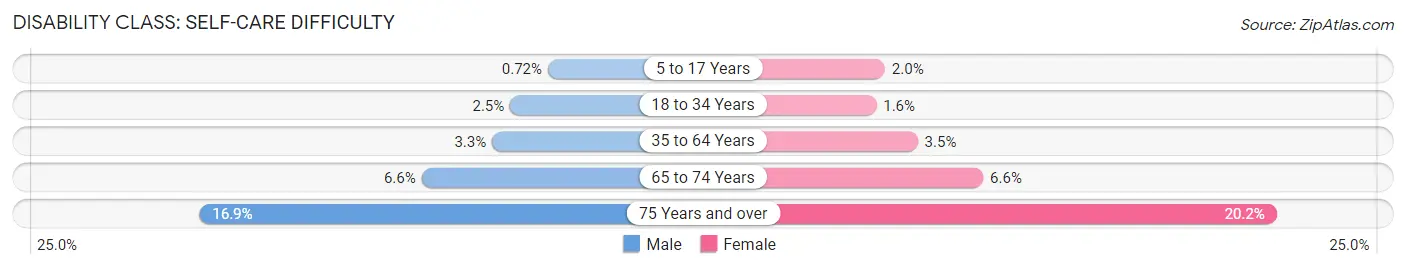
| Age Bracket | Male | Female |
| 5 to 17 Years | 23 (0.7%) | 56 (2.0%) |
| 18 to 34 Years | 116 (2.5%) | 68 (1.6%) |
| 35 to 64 Years | 221 (3.3%) | 236 (3.5%) |
| 65 to 74 Years | 117 (6.6%) | 130 (6.6%) |
| 75 Years and over | 229 (16.9%) | 595 (20.2%) |
Technology Access in Waipahu
Computing Device Access in Waipahu
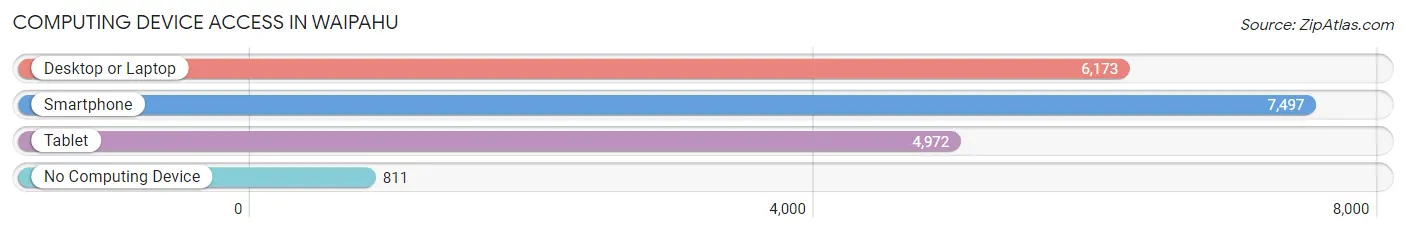
| Device Type | # Households | % Households |
| Desktop or Laptop | 6,173 | 70.3% |
| Smartphone | 7,497 | 85.4% |
| Tablet | 4,972 | 56.6% |
| No Computing Device | 811 | 9.2% |
| Total | 8,782 | 100.0% |
Internet Access in Waipahu
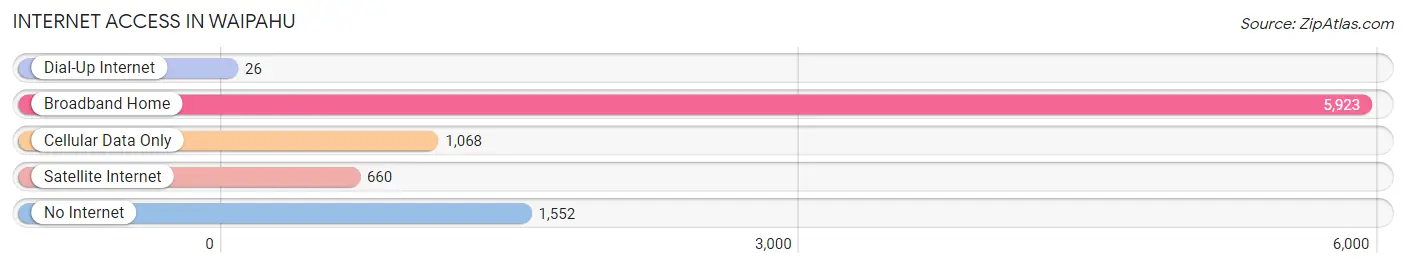
| Internet Type | # Households | % Households |
| Dial-Up Internet | 26 | 0.3% |
| Broadband Home | 5,923 | 67.4% |
| Cellular Data Only | 1,068 | 12.2% |
| Satellite Internet | 660 | 7.5% |
| No Internet | 1,552 | 17.7% |
| Total | 8,782 | 100.0% |
Waipahu Summary
Waipahu is a census-designated place (CDP) located in the Ewa District of Honolulu County, Hawaii, United States. As of the 2010 census, the population was 38,216. Waipahu is the oldest settlement on the island of Oahu and is located near the western edge of the island.
History
Waipahu was originally a Hawaiian agricultural community, and was once known as the “Garden Isle”. The area was once a major sugarcane plantation, and was home to the Waipahu Sugar Mill, which was built in the late 1800s. The mill was the largest sugar mill in the United States at the time, and was the first to use steam power. The mill was eventually closed in the early 1900s, and the area was transformed into a residential community.
In the early 1900s, Waipahu was also home to a large Japanese population. Many of the Japanese immigrants who settled in Waipahu were employed by the sugar mill, and the area became known as “Little Tokyo”. During World War II, many of the Japanese residents were sent to internment camps, and the area was transformed into a predominantly Filipino community.
Geography
Waipahu is located at 21°24'N 158°1'W (21.40, -158.02). According to the United States Census Bureau, the CDP has a total area of 4.2 square miles (10.8 km2), of which 4.1 square miles (10.6 km2) is land and 0.1 square miles (0.2 km2) (2.45%) is water.
Economy
Waipahu’s economy is largely based on tourism and retail. The area is home to several shopping centers, including the Waikele Premium Outlets, Waipio Shopping Center, and Waipahu Town Center. Waipahu is also home to several restaurants, including the popular Waipahu Sushi Bar.
The area is also home to several industrial and manufacturing businesses, including the Hawaiian Commercial & Sugar Company, which produces sugar and molasses. The area is also home to several military bases, including the Pearl Harbor Naval Base and the Hickam Air Force Base.
Demographics
As of the 2010 census, there were 38,216 people, 11,845 households, and 9,845 families residing in the CDP. The population density was 9,093.3 people per square mile (3,513.2/km2). There were 12,717 housing units at an average density of 3,093.3 per square mile (1,192.2/km2). The racial makeup of the CDP was 24.2% White, 0.7% African American, 0.3% Native American, 37.2% Asian, 8.2% Pacific Islander, 0.7% from other races, and 28.7% from two or more races. Hispanic or Latino of any race were 16.2% of the population.
There were 11,845 households, out of which 37.2% had children under the age of 18 living with them, 54.2% were married couples living together, 15.2% had a female householder with no husband present, and 23.2% were non-families. 17.2% of all households were made up of individuals, and 6.2% had someone living alone who was 65 years of age or older. The average household size was 3.21 and the average family size was 3.60.
In the CDP, the population was spread out, with 25.2% under the age of 18, 9.2% from 18 to 24, 28.2% from 25 to 44, 24.2% from 45 to 64, and 13.2% who were 65 years of age or older. The median age was 36 years. For every 100 females, there were 97.2 males. For every 100 females age 18 and over, there were 94.2 males.
The median income for a household in the CDP was $60,945, and the median income for a family was $66,945. Males had a median income of $41,945 versus $32,945 for females. The per capita income for the CDP was $21,945. About 6.2% of families and 8.2% of the population were below the poverty line, including 10.2% of those under age 18 and 6.2% of those age 65 or over.
Common Questions
What is Per Capita Income in Waipahu?
Per Capita income in Waipahu is $28,426.
What is the Median Family Income in Waipahu?
Median Family Income in Waipahu is $94,742.
What is the Median Household income in Waipahu?
Median Household Income in Waipahu is $87,961.
What is Income or Wage Gap in Waipahu?
Income or Wage Gap in Waipahu is 17.1%.
Women in Waipahu earn 82.9 cents for every dollar earned by a man.
What is Family Income Deficit in Waipahu?
Family Income Deficit in Waipahu is $9,762.
Families that are below poverty line in Waipahu earn $9,762 less on average than the poverty threshold level.
What is Inequality or Gini Index in Waipahu?
Inequality or Gini Index in Waipahu is 0.46.
What is the Total Population of Waipahu?
Total Population of Waipahu is 39,873.
What is the Total Male Population of Waipahu?
Total Male Population of Waipahu is 19,297.
What is the Total Female Population of Waipahu?
Total Female Population of Waipahu is 20,576.
What is the Ratio of Males per 100 Females in Waipahu?
There are 93.78 Males per 100 Females in Waipahu.
What is the Ratio of Females per 100 Males in Waipahu?
There are 106.63 Females per 100 Males in Waipahu.
What is the Median Population Age in Waipahu?
Median Population Age in Waipahu is 39.6 Years.
What is the Average Family Size in Waipahu
Average Family Size in Waipahu is 4.7 People.
What is the Average Household Size in Waipahu
Average Household Size in Waipahu is 4.4 People.
How Large is the Labor Force in Waipahu?
There are 19,389 People in the Labor Forcein in Waipahu.
What is the Percentage of People in the Labor Force in Waipahu?
60.2% of People are in the Labor Force in Waipahu.
What is the Unemployment Rate in Waipahu?
Unemployment Rate in Waipahu is 4.8%.