Winter Garden, FL Map & Demographics
Winter Garden Map
Winter Garden Overview
$40,685
PER CAPITA INCOME
$114,644
AVG FAMILY INCOME
$101,953
AVG HOUSEHOLD INCOME
29.3%
WAGE / INCOME GAP [ % ]
70.7¢/ $1
WAGE / INCOME GAP [ $ ]
0.40
INEQUALITY / GINI INDEX
46,518
TOTAL POPULATION
22,862
MALE POPULATION
23,656
FEMALE POPULATION
96.64
MALES / 100 FEMALES
103.47
FEMALES / 100 MALES
39.4
MEDIAN AGE
3.4
AVG FAMILY SIZE
3.1
AVG HOUSEHOLD SIZE
24,720
LABOR FORCE [ PEOPLE ]
69.2%
PERCENT IN LABOR FORCE
6.9%
UNEMPLOYMENT RATE
Winter Garden Zip Codes
Winter Garden Area Codes
Income in Winter Garden
Income Overview in Winter Garden
Per Capita Income in Winter Garden is $40,685, while median incomes of families and households are $114,644 and $101,953 respectively.
| Characteristic | Number | Measure |
| Per Capita Income | 46,518 | $40,685 |
| Median Family Income | 11,829 | $114,644 |
| Mean Family Income | 11,829 | $133,156 |
| Median Household Income | 14,786 | $101,953 |
| Mean Household Income | 14,786 | $121,755 |
| Income Deficit | 11,829 | $0 |
| Wage / Income Gap (%) | 46,518 | 29.28% |
| Wage / Income Gap ($) | 46,518 | 70.72¢ per $1 |
| Gini / Inequality Index | 46,518 | 0.40 |
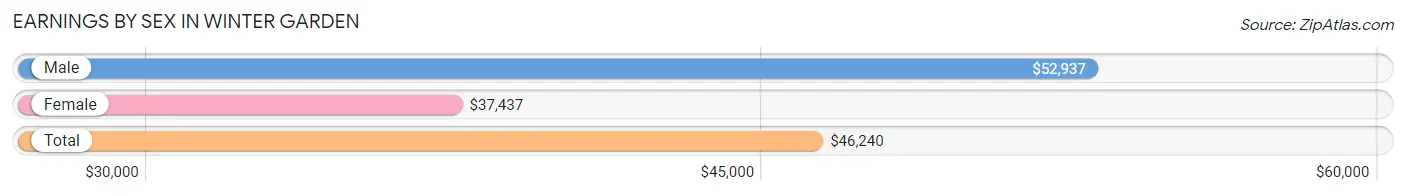
Earnings by Sex in Winter Garden
Average Earnings in Winter Garden are $46,240, $52,937 for men and $37,437 for women, a difference of 29.3%.
| Sex | Number | Average Earnings |
| Male | 13,674 (54.9%) | $52,937 |
| Female | 11,228 (45.1%) | $37,437 |
| Total | 24,902 (100.0%) | $46,240 |
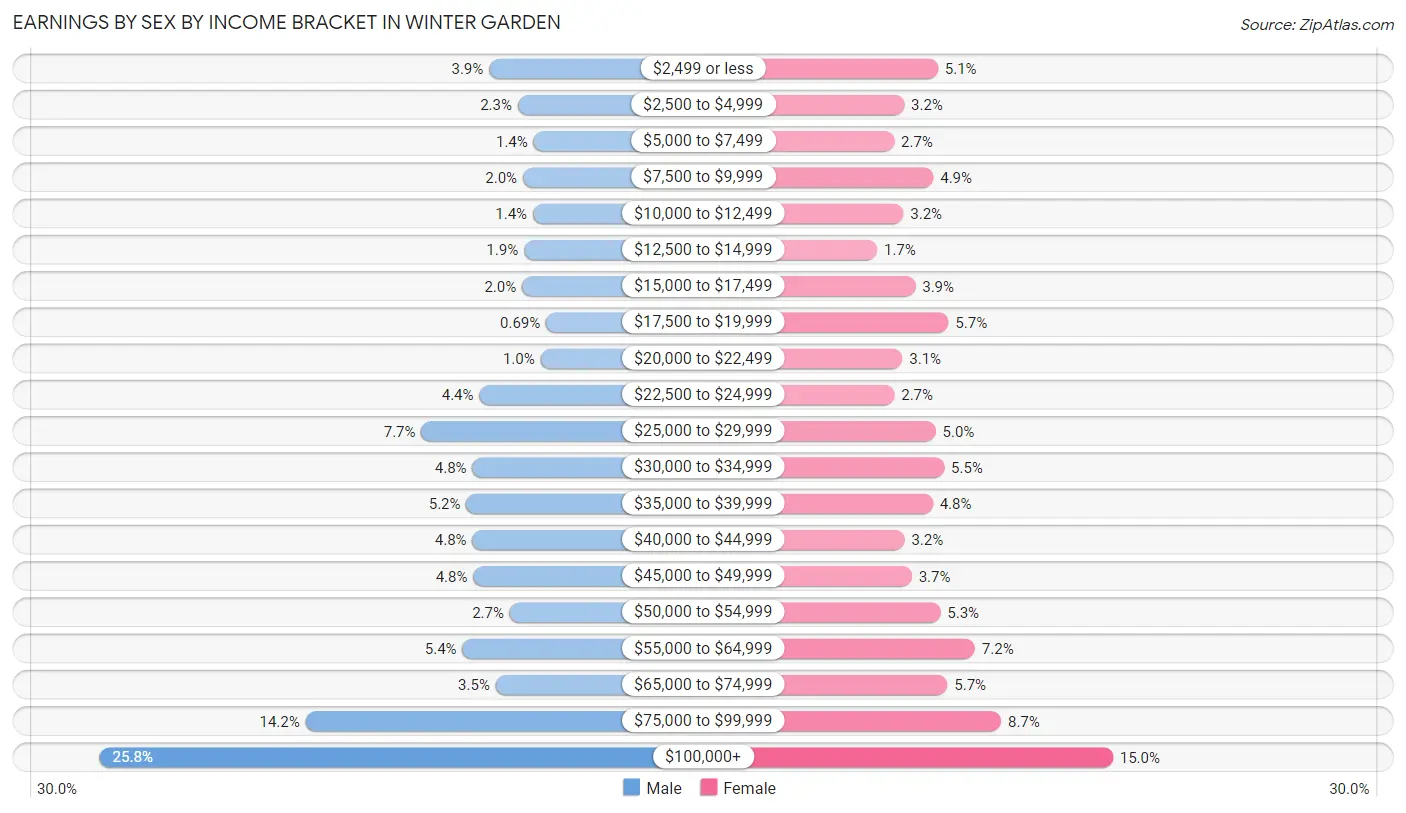
Earnings by Sex by Income Bracket in Winter Garden
The most common earnings brackets in Winter Garden are $100,000+ for men (3,525 | 25.8%) and $100,000+ for women (1,679 | 14.9%).
| Income | Male | Female |
| $2,499 or less | 532 (3.9%) | 575 (5.1%) |
| $2,500 to $4,999 | 312 (2.3%) | 361 (3.2%) |
| $5,000 to $7,499 | 190 (1.4%) | 299 (2.7%) |
| $7,500 to $9,999 | 272 (2.0%) | 546 (4.9%) |
| $10,000 to $12,499 | 195 (1.4%) | 357 (3.2%) |
| $12,500 to $14,999 | 264 (1.9%) | 191 (1.7%) |
| $15,000 to $17,499 | 279 (2.0%) | 432 (3.8%) |
| $17,500 to $19,999 | 94 (0.7%) | 641 (5.7%) |
| $20,000 to $22,499 | 137 (1.0%) | 350 (3.1%) |
| $22,500 to $24,999 | 607 (4.4%) | 300 (2.7%) |
| $25,000 to $29,999 | 1,053 (7.7%) | 560 (5.0%) |
| $30,000 to $34,999 | 660 (4.8%) | 614 (5.5%) |
| $35,000 to $39,999 | 707 (5.2%) | 542 (4.8%) |
| $40,000 to $44,999 | 660 (4.8%) | 364 (3.2%) |
| $45,000 to $49,999 | 653 (4.8%) | 410 (3.6%) |
| $50,000 to $54,999 | 373 (2.7%) | 591 (5.3%) |
| $55,000 to $64,999 | 737 (5.4%) | 808 (7.2%) |
| $65,000 to $74,999 | 481 (3.5%) | 634 (5.7%) |
| $75,000 to $99,999 | 1,943 (14.2%) | 974 (8.7%) |
| $100,000+ | 3,525 (25.8%) | 1,679 (14.9%) |
| Total | 13,674 (100.0%) | 11,228 (100.0%) |
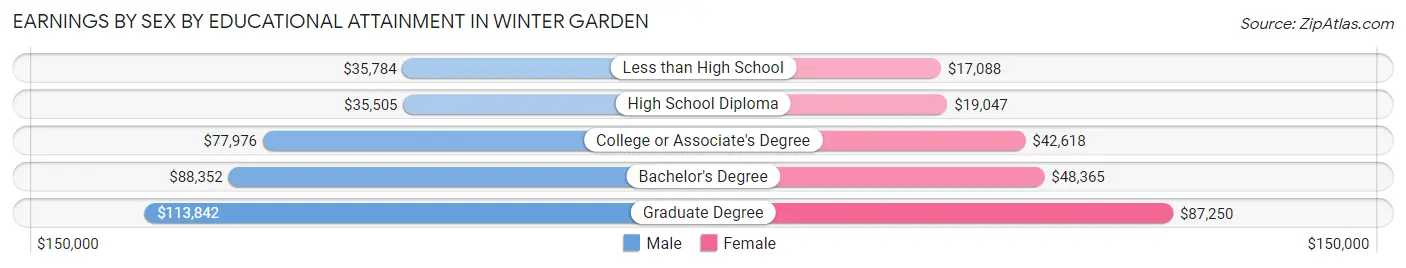
Earnings by Sex by Educational Attainment in Winter Garden
Average earnings in Winter Garden are $61,033 for men and $46,372 for women, a difference of 24.0%. Men with an educational attainment of graduate degree enjoy the highest average annual earnings of $113,842, while those with high school diploma education earn the least with $35,505. Women with an educational attainment of graduate degree earn the most with the average annual earnings of $87,250, while those with less than high school education have the smallest earnings of $17,088.
| Educational Attainment | Male Income | Female Income |
| Less than High School | $35,784 | $17,088 |
| High School Diploma | $35,505 | $19,047 |
| College or Associate's Degree | $77,976 | $42,618 |
| Bachelor's Degree | $88,352 | $48,365 |
| Graduate Degree | $113,842 | $87,250 |
| Total | $61,033 | $46,372 |
Family Income in Winter Garden
Family Income Brackets in Winter Garden
According to the Winter Garden family income data, there are 2,910 families falling into the $100,000 to $149,999 income range, which is the most common income bracket and makes up 24.6% of all families. Conversely, the less than $10,000 income bracket is the least frequent group with only 130 families (1.1%) belonging to this category.
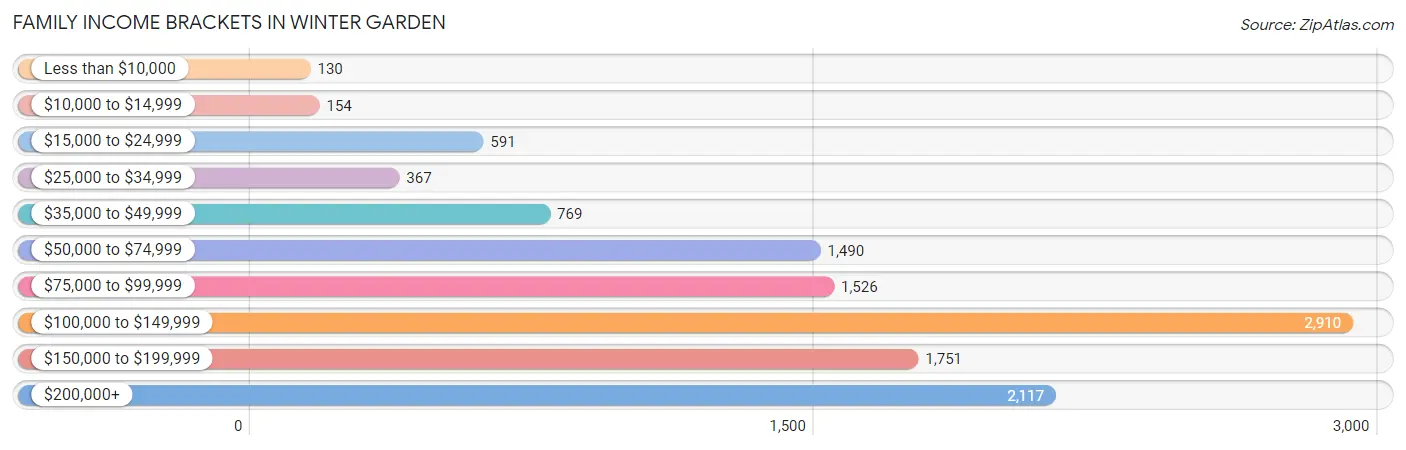
| Income Bracket | # Families | % Families |
| Less than $10,000 | 130 | 1.1% |
| $10,000 to $14,999 | 154 | 1.3% |
| $15,000 to $24,999 | 591 | 5.0% |
| $25,000 to $34,999 | 367 | 3.1% |
| $35,000 to $49,999 | 769 | 6.5% |
| $50,000 to $74,999 | 1,490 | 12.6% |
| $75,000 to $99,999 | 1,526 | 12.9% |
| $100,000 to $149,999 | 2,910 | 24.6% |
| $150,000 to $199,999 | 1,751 | 14.8% |
| $200,000+ | 2,117 | 17.9% |
Family Income by Famaliy Size in Winter Garden
4-person families (2,706 | 22.9%) account for the highest median family income in Winter Garden with $136,071 per family, while 2-person families (4,750 | 40.2%) have the highest median income of $51,012 per family member.
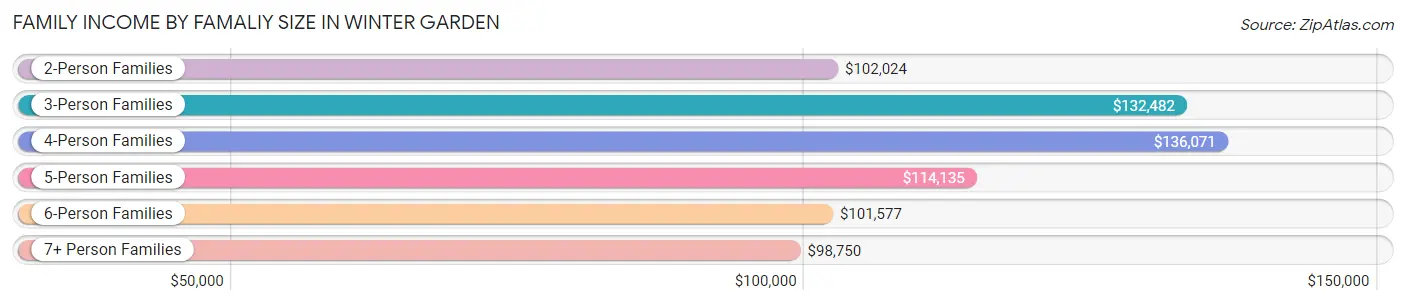
| Income Bracket | # Families | Median Income |
| 2-Person Families | 4,750 (40.2%) | $102,024 |
| 3-Person Families | 3,040 (25.7%) | $132,482 |
| 4-Person Families | 2,706 (22.9%) | $136,071 |
| 5-Person Families | 761 (6.4%) | $114,135 |
| 6-Person Families | 346 (2.9%) | $101,577 |
| 7+ Person Families | 226 (1.9%) | $98,750 |
| Total | 11,829 (100.0%) | $114,644 |
Family Income by Number of Earners in Winter Garden
The median family income in Winter Garden is $114,644, with families comprising 3+ earners (1,473) having the highest median family income of $130,469, while families with no earners (1,045) have the lowest median family income of $46,949, accounting for 12.4% and 8.8% of families, respectively.
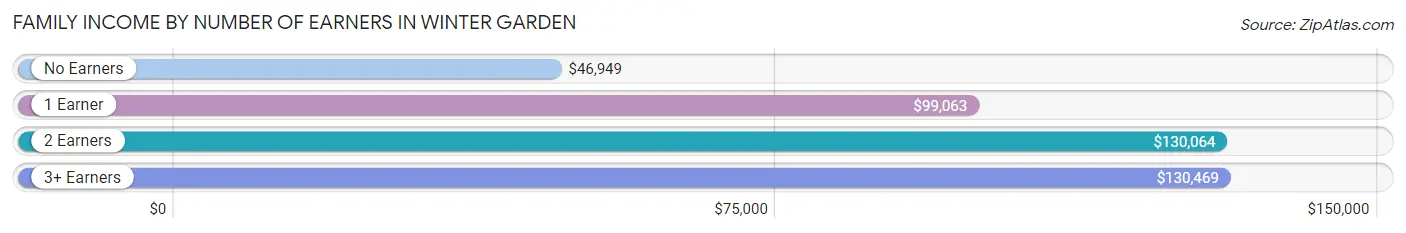
| Number of Earners | # Families | Median Income |
| No Earners | 1,045 (8.8%) | $46,949 |
| 1 Earner | 4,048 (34.2%) | $99,063 |
| 2 Earners | 5,263 (44.5%) | $130,064 |
| 3+ Earners | 1,473 (12.4%) | $130,469 |
| Total | 11,829 (100.0%) | $114,644 |
Household Income in Winter Garden
Household Income Brackets in Winter Garden
With 3,475 households falling in the category, the $100,000 to $149,999 income range is the most frequent in Winter Garden, accounting for 23.5% of all households. In contrast, only 266 households (1.8%) fall into the less than $10,000 income bracket, making it the least populous group.
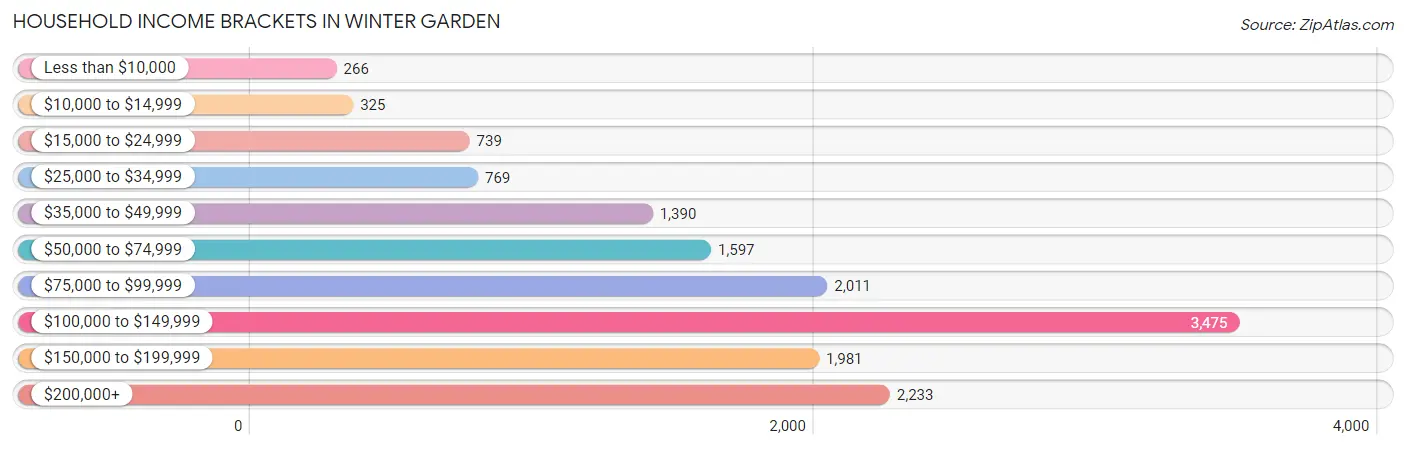
| Income Bracket | # Households | % Households |
| Less than $10,000 | 266 | 1.8% |
| $10,000 to $14,999 | 325 | 2.2% |
| $15,000 to $24,999 | 739 | 5.0% |
| $25,000 to $34,999 | 769 | 5.2% |
| $35,000 to $49,999 | 1,390 | 9.4% |
| $50,000 to $74,999 | 1,597 | 10.8% |
| $75,000 to $99,999 | 2,011 | 13.6% |
| $100,000 to $149,999 | 3,475 | 23.5% |
| $150,000 to $199,999 | 1,981 | 13.4% |
| $200,000+ | 2,233 | 15.1% |
Household Income by Householder Age in Winter Garden
The median household income in Winter Garden is $101,953, with the highest median household income of $123,393 found in the 25 to 44 years age bracket for the primary householder. A total of 5,277 households (35.7%) fall into this category. Meanwhile, the 65+ years age bracket for the primary householder has the lowest median household income of $65,682, with 3,266 households (22.1%) in this group.
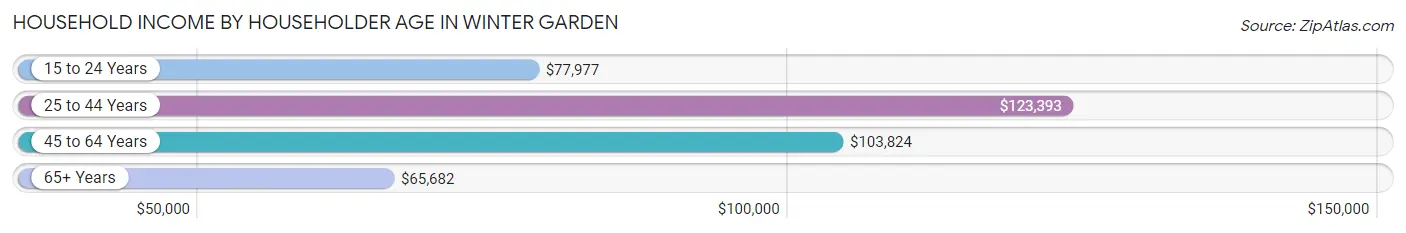
| Income Bracket | # Households | Median Income |
| 15 to 24 Years | 303 (2.1%) | $77,977 |
| 25 to 44 Years | 5,277 (35.7%) | $123,393 |
| 45 to 64 Years | 5,940 (40.2%) | $103,824 |
| 65+ Years | 3,266 (22.1%) | $65,682 |
| Total | 14,786 (100.0%) | $101,953 |
Poverty in Winter Garden
Income Below Poverty by Sex and Age in Winter Garden
With 9.4% poverty level for males and 9.5% for females among the residents of Winter Garden, 12 to 14 year old males and 16 and 17 year old females are the most vulnerable to poverty, with 159 males (22.5%) and 94 females (20.2%) in their respective age groups living below the poverty level.
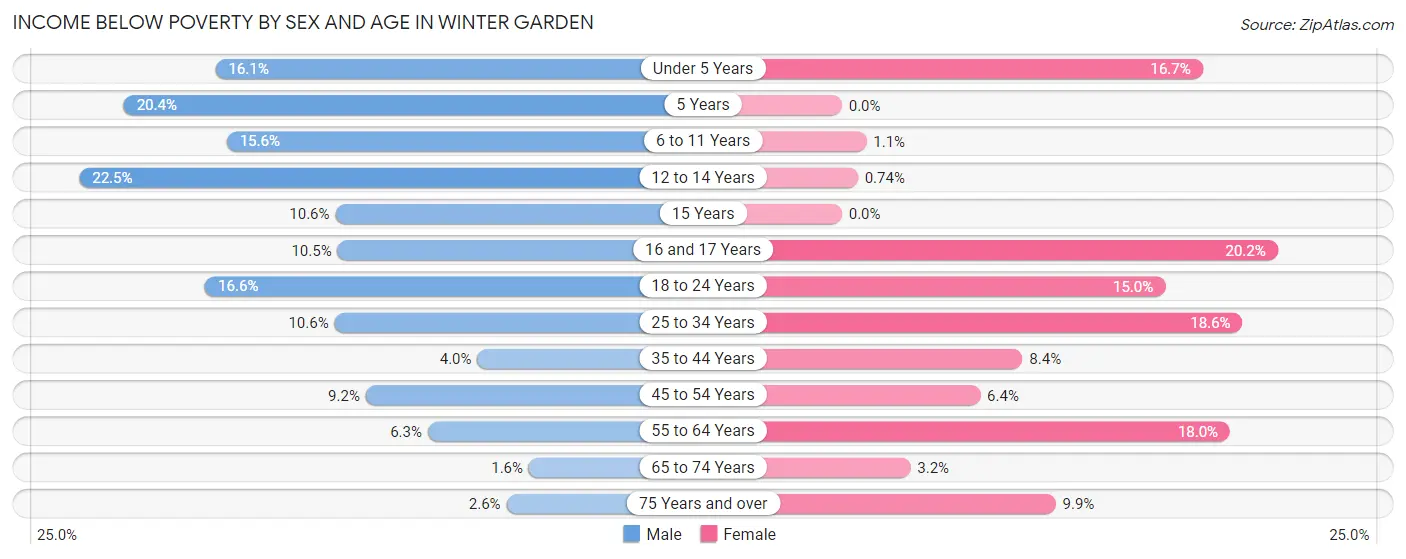
| Age Bracket | Male | Female |
| Under 5 Years | 193 (16.1%) | 230 (16.7%) |
| 5 Years | 81 (20.4%) | 0 (0.0%) |
| 6 to 11 Years | 347 (15.6%) | 18 (1.1%) |
| 12 to 14 Years | 159 (22.5%) | 8 (0.7%) |
| 15 Years | 71 (10.6%) | 0 (0.0%) |
| 16 and 17 Years | 79 (10.5%) | 94 (20.2%) |
| 18 to 24 Years | 256 (16.6%) | 256 (15.0%) |
| 25 to 34 Years | 296 (10.6%) | 447 (18.6%) |
| 35 to 44 Years | 166 (4.0%) | 310 (8.4%) |
| 45 to 54 Years | 286 (9.2%) | 244 (6.4%) |
| 55 to 64 Years | 148 (6.3%) | 430 (18.0%) |
| 65 to 74 Years | 31 (1.6%) | 71 (3.2%) |
| 75 Years and over | 20 (2.6%) | 99 (9.9%) |
| Total | 2,133 (9.4%) | 2,207 (9.5%) |
Income Above Poverty by Sex and Age in Winter Garden
According to the poverty statistics in Winter Garden, males aged 65 to 74 years and females aged 5 years are the age groups that are most secure financially, with 98.4% of males and 100.0% of females in these age groups living above the poverty line.
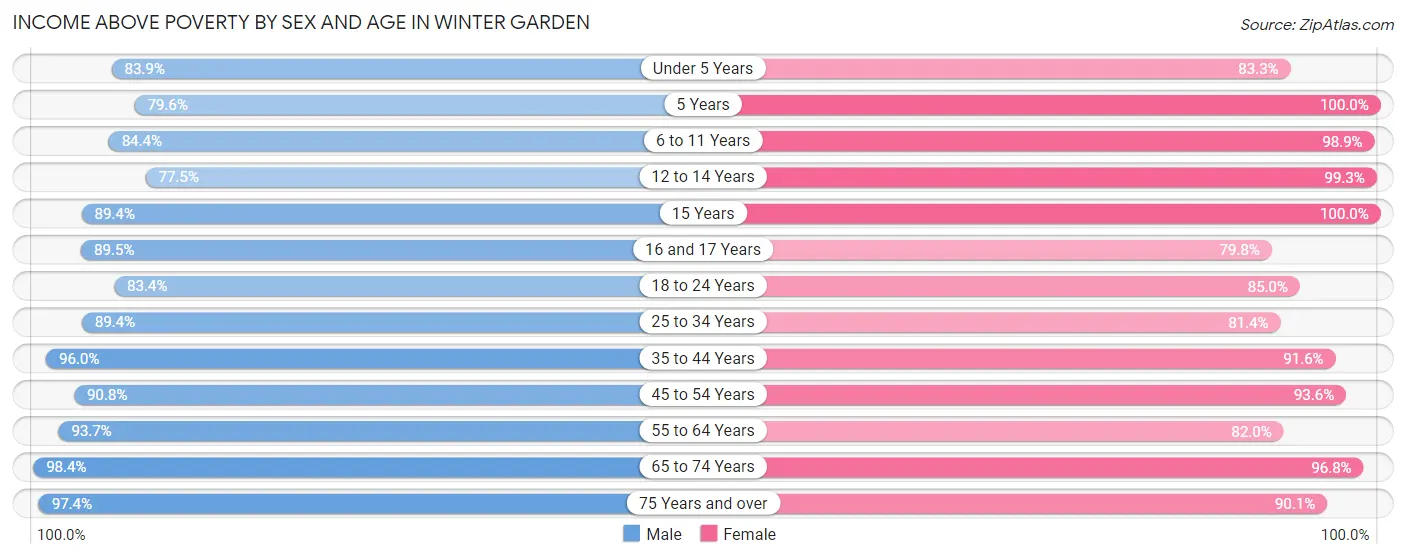
| Age Bracket | Male | Female |
| Under 5 Years | 1,003 (83.9%) | 1,144 (83.3%) |
| 5 Years | 316 (79.6%) | 936 (100.0%) |
| 6 to 11 Years | 1,875 (84.4%) | 1,560 (98.9%) |
| 12 to 14 Years | 549 (77.5%) | 1,075 (99.3%) |
| 15 Years | 600 (89.4%) | 519 (100.0%) |
| 16 and 17 Years | 675 (89.5%) | 371 (79.8%) |
| 18 to 24 Years | 1,284 (83.4%) | 1,451 (85.0%) |
| 25 to 34 Years | 2,490 (89.4%) | 1,958 (81.4%) |
| 35 to 44 Years | 3,991 (96.0%) | 3,391 (91.6%) |
| 45 to 54 Years | 2,833 (90.8%) | 3,557 (93.6%) |
| 55 to 64 Years | 2,205 (93.7%) | 1,958 (82.0%) |
| 65 to 74 Years | 1,901 (98.4%) | 2,162 (96.8%) |
| 75 Years and over | 738 (97.4%) | 899 (90.1%) |
| Total | 20,460 (90.6%) | 20,981 (90.5%) |
Income Below Poverty Among Married-Couple Families in Winter Garden
The poverty statistics for married-couple families in Winter Garden show that 5.5% or 486 of the total 8,858 families live below the poverty line. Families with 3 or 4 children have the highest poverty rate of 11.8%, comprising of 73 families. On the other hand, families with no children have the lowest poverty rate of 2.9%, which includes 122 families.
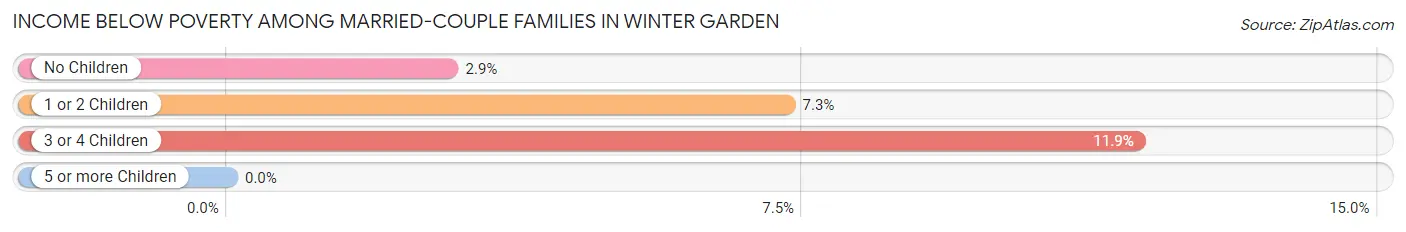
| Children | Above Poverty | Below Poverty |
| No Children | 4,121 (97.1%) | 122 (2.9%) |
| 1 or 2 Children | 3,708 (92.7%) | 291 (7.3%) |
| 3 or 4 Children | 543 (88.1%) | 73 (11.8%) |
| 5 or more Children | 0 (0.0%) | 0 (0.0%) |
| Total | 8,372 (94.5%) | 486 (5.5%) |
Income Below Poverty Among Single-Parent Households in Winter Garden
According to the poverty data in Winter Garden, 8.1% or 75 single-father households and 13.0% or 267 single-mother households are living below the poverty line. Among single-father households, those with no children have the highest poverty rate, with 58 households (15.4%) experiencing poverty. Likewise, among single-mother households, those with 3 or 4 children have the highest poverty rate, with 8 households (47.1%) falling below the poverty line.
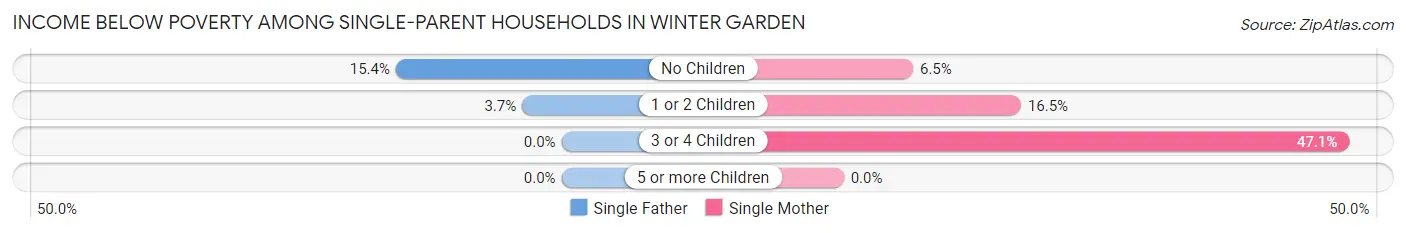
| Children | Single Father | Single Mother |
| No Children | 58 (15.4%) | 49 (6.5%) |
| 1 or 2 Children | 17 (3.7%) | 210 (16.5%) |
| 3 or 4 Children | 0 (0.0%) | 8 (47.1%) |
| 5 or more Children | 0 (0.0%) | 0 (0.0%) |
| Total | 75 (8.1%) | 267 (13.0%) |
Income Below Poverty Among Married-Couple vs Single-Parent Households in Winter Garden
The poverty data for Winter Garden shows that 486 of the married-couple family households (5.5%) and 342 of the single-parent households (11.5%) are living below the poverty level. Within the married-couple family households, those with 3 or 4 children have the highest poverty rate, with 73 households (11.8%) falling below the poverty line. Among the single-parent households, those with 1 or 2 children have the highest poverty rate, with 227 household (13.1%) living below poverty.
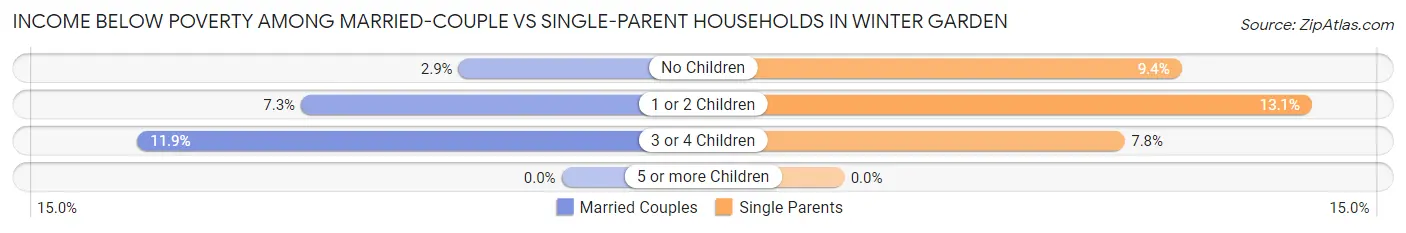
| Children | Married-Couple Families | Single-Parent Households |
| No Children | 122 (2.9%) | 107 (9.4%) |
| 1 or 2 Children | 291 (7.3%) | 227 (13.1%) |
| 3 or 4 Children | 73 (11.8%) | 8 (7.8%) |
| 5 or more Children | 0 (0.0%) | 0 (0.0%) |
| Total | 486 (5.5%) | 342 (11.5%) |
Race in Winter Garden
The most populous races in Winter Garden are White / Caucasian (28,629 | 61.5%), Hispanic or Latino (12,445 | 26.8%), and Two or more Races (7,007 | 15.1%).
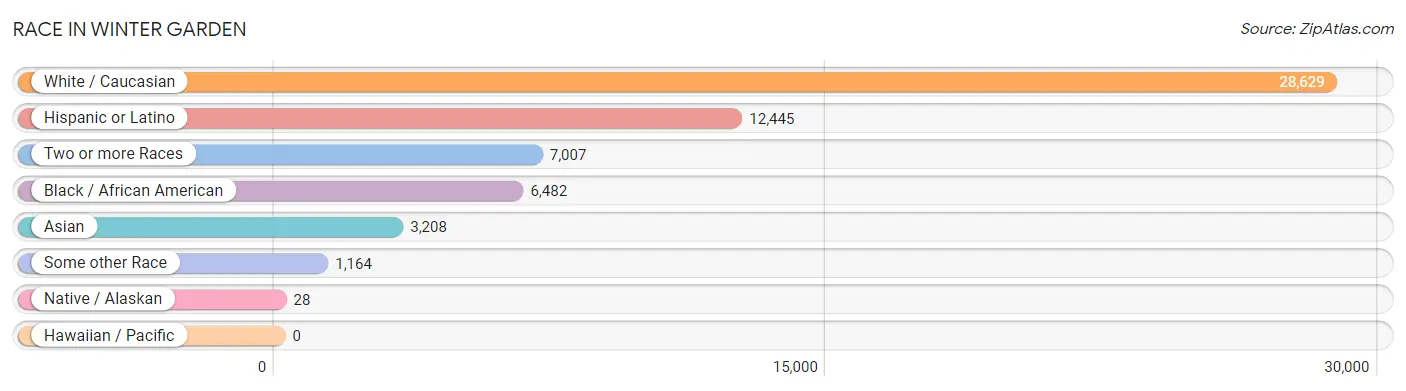
| Race | # Population | % Population |
| Asian | 3,208 | 6.9% |
| Black / African American | 6,482 | 13.9% |
| Hawaiian / Pacific | 0 | 0.0% |
| Hispanic or Latino | 12,445 | 26.8% |
| Native / Alaskan | 28 | 0.1% |
| White / Caucasian | 28,629 | 61.5% |
| Two or more Races | 7,007 | 15.1% |
| Some other Race | 1,164 | 2.5% |
| Total | 46,518 | 100.0% |
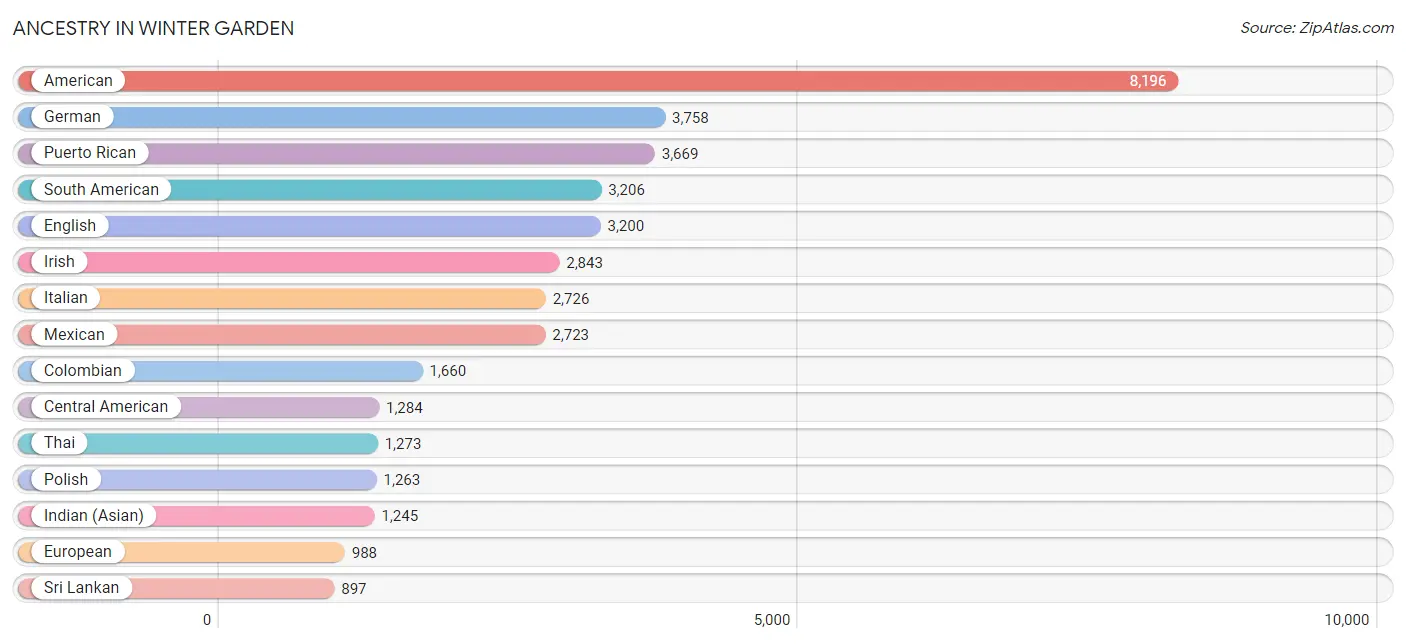
Ancestry in Winter Garden
The most populous ancestries reported in Winter Garden are American (8,196 | 17.6%), German (3,758 | 8.1%), Puerto Rican (3,669 | 7.9%), South American (3,206 | 6.9%), and English (3,200 | 6.9%), together accounting for 47.4% of all Winter Garden residents.
| Ancestry | # Population | % Population |
| Afghan | 16 | 0.0% |
| African | 388 | 0.8% |
| Albanian | 62 | 0.1% |
| American | 8,196 | 17.6% |
| Arab | 99 | 0.2% |
| Argentinean | 53 | 0.1% |
| Austrian | 48 | 0.1% |
| Bahamian | 38 | 0.1% |
| Barbadian | 30 | 0.1% |
| Belgian | 75 | 0.2% |
| Belizean | 9 | 0.0% |
| Blackfeet | 19 | 0.0% |
| Bolivian | 28 | 0.1% |
| Brazilian | 557 | 1.2% |
| British | 854 | 1.8% |
| Burmese | 15 | 0.0% |
| Canadian | 53 | 0.1% |
| Central American | 1,284 | 2.8% |
| Central American Indian | 18 | 0.0% |
| Cherokee | 49 | 0.1% |
| Chilean | 7 | 0.0% |
| Colombian | 1,660 | 3.6% |
| Costa Rican | 11 | 0.0% |
| Cuban | 867 | 1.9% |
| Czech | 79 | 0.2% |
| Czechoslovakian | 94 | 0.2% |
| Danish | 18 | 0.0% |
| Dominican | 424 | 0.9% |
| Dutch | 361 | 0.8% |
| Eastern European | 694 | 1.5% |
| Ecuadorian | 318 | 0.7% |
| English | 3,200 | 6.9% |
| European | 988 | 2.1% |
| Finnish | 76 | 0.2% |
| French | 673 | 1.5% |
| French Canadian | 70 | 0.2% |
| German | 3,758 | 8.1% |
| Greek | 106 | 0.2% |
| Guatemalan | 731 | 1.6% |
| Guyanese | 136 | 0.3% |
| Haitian | 203 | 0.4% |
| Honduran | 301 | 0.6% |
| Hungarian | 257 | 0.5% |
| Indian (Asian) | 1,245 | 2.7% |
| Irish | 2,843 | 6.1% |
| Israeli | 76 | 0.2% |
| Italian | 2,726 | 5.9% |
| Jamaican | 334 | 0.7% |
| Kenyan | 74 | 0.2% |
| Korean | 374 | 0.8% |
| Latvian | 20 | 0.0% |
| Lebanese | 54 | 0.1% |
| Liberian | 14 | 0.0% |
| Mexican | 2,723 | 5.9% |
| Native Hawaiian | 57 | 0.1% |
| Nigerian | 109 | 0.2% |
| Northern European | 17 | 0.0% |
| Norwegian | 230 | 0.5% |
| Palestinian | 32 | 0.1% |
| Panamanian | 241 | 0.5% |
| Paraguayan | 28 | 0.1% |
| Pennsylvania German | 16 | 0.0% |
| Peruvian | 198 | 0.4% |
| Polish | 1,263 | 2.7% |
| Portuguese | 78 | 0.2% |
| Potawatomi | 205 | 0.4% |
| Puerto Rican | 3,669 | 7.9% |
| Romanian | 16 | 0.0% |
| Russian | 510 | 1.1% |
| Scandinavian | 58 | 0.1% |
| Scotch-Irish | 192 | 0.4% |
| Scottish | 547 | 1.2% |
| Senegalese | 14 | 0.0% |
| Serbian | 33 | 0.1% |
| Slovak | 100 | 0.2% |
| Slovene | 13 | 0.0% |
| South American | 3,206 | 6.9% |
| Spanish | 117 | 0.3% |
| Sri Lankan | 897 | 1.9% |
| Subsaharan African | 563 | 1.2% |
| Swedish | 239 | 0.5% |
| Swiss | 392 | 0.8% |
| Thai | 1,273 | 2.7% |
| Turkish | 71 | 0.2% |
| U.S. Virgin Islander | 23 | 0.1% |
| Ukrainian | 163 | 0.4% |
| Uruguayan | 281 | 0.6% |
| Venezuelan | 633 | 1.4% |
| Welsh | 314 | 0.7% |
| West Indian | 68 | 0.2% |
| Yugoslavian | 48 | 0.1% | View All 91 Rows |
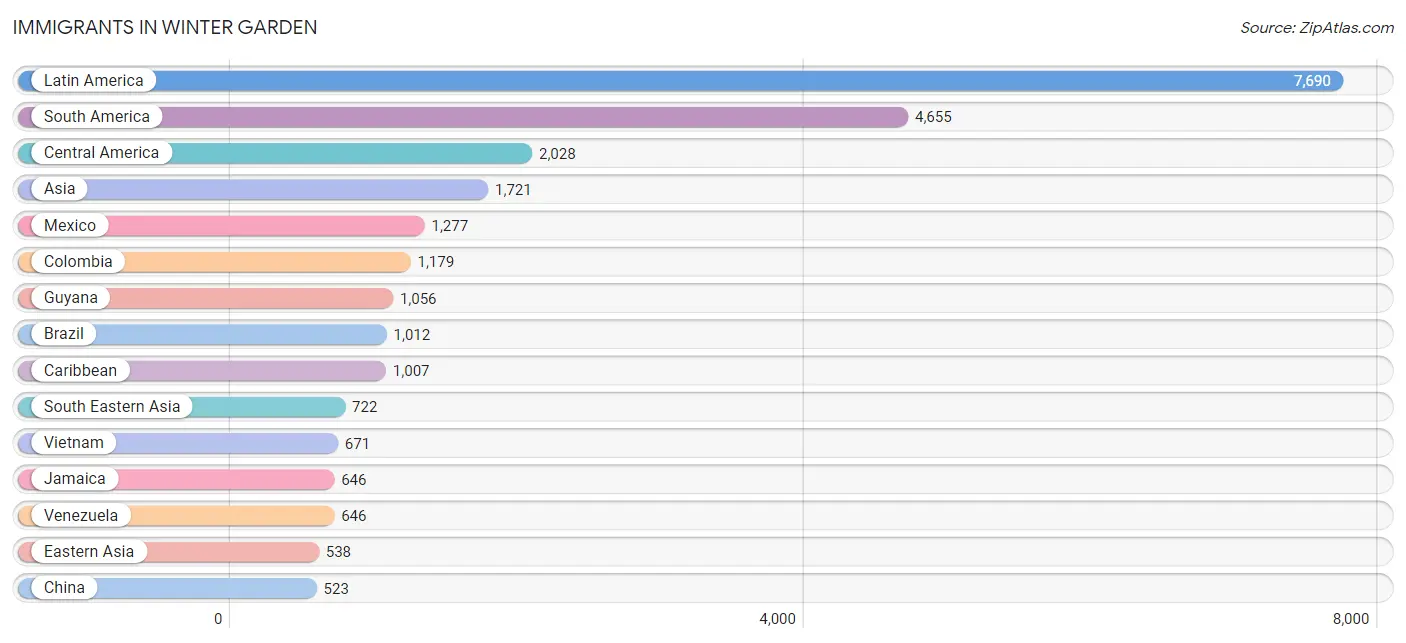
Immigrants in Winter Garden
The most numerous immigrant groups reported in Winter Garden came from Latin America (7,690 | 16.5%), South America (4,655 | 10.0%), Central America (2,028 | 4.4%), Asia (1,721 | 3.7%), and Mexico (1,277 | 2.8%), together accounting for 37.3% of all Winter Garden residents.
| Immigration Origin | # Population | % Population |
| Afghanistan | 16 | 0.0% |
| Africa | 268 | 0.6% |
| Albania | 44 | 0.1% |
| Argentina | 197 | 0.4% |
| Armenia | 26 | 0.1% |
| Asia | 1,721 | 3.7% |
| Austria | 83 | 0.2% |
| Barbados | 30 | 0.1% |
| Belgium | 6 | 0.0% |
| Bolivia | 28 | 0.1% |
| Brazil | 1,012 | 2.2% |
| Canada | 61 | 0.1% |
| Caribbean | 1,007 | 2.2% |
| Central America | 2,028 | 4.4% |
| Chile | 7 | 0.0% |
| China | 523 | 1.1% |
| Colombia | 1,179 | 2.5% |
| Costa Rica | 43 | 0.1% |
| Cuba | 102 | 0.2% |
| Dominica | 46 | 0.1% |
| Dominican Republic | 44 | 0.1% |
| Eastern Africa | 112 | 0.2% |
| Eastern Asia | 538 | 1.2% |
| Eastern Europe | 211 | 0.4% |
| Ecuador | 312 | 0.7% |
| El Salvador | 170 | 0.4% |
| England | 11 | 0.0% |
| Ethiopia | 68 | 0.2% |
| Europe | 499 | 1.1% |
| France | 5 | 0.0% |
| Germany | 61 | 0.1% |
| Guatemala | 273 | 0.6% |
| Guyana | 1,056 | 2.3% |
| Haiti | 63 | 0.1% |
| Honduras | 116 | 0.3% |
| Hong Kong | 213 | 0.5% |
| India | 342 | 0.7% |
| Iraq | 13 | 0.0% |
| Italy | 28 | 0.1% |
| Jamaica | 646 | 1.4% |
| Korea | 15 | 0.0% |
| Latin America | 7,690 | 16.5% |
| Liberia | 135 | 0.3% |
| Mexico | 1,277 | 2.8% |
| Nigeria | 21 | 0.1% |
| Northern Europe | 105 | 0.2% |
| Norway | 10 | 0.0% |
| Panama | 149 | 0.3% |
| Peru | 179 | 0.4% |
| Philippines | 51 | 0.1% |
| Poland | 8 | 0.0% |
| Russia | 127 | 0.3% |
| Scotland | 6 | 0.0% |
| South America | 4,655 | 10.0% |
| South Central Asia | 373 | 0.8% |
| South Eastern Asia | 722 | 1.5% |
| Southern Europe | 28 | 0.1% |
| Sri Lanka | 15 | 0.0% |
| Taiwan | 44 | 0.1% |
| Trinidad and Tobago | 24 | 0.1% |
| Turkey | 49 | 0.1% |
| Uganda | 33 | 0.1% |
| Ukraine | 32 | 0.1% |
| Venezuela | 646 | 1.4% |
| Vietnam | 671 | 1.4% |
| Western Africa | 156 | 0.3% |
| Western Asia | 88 | 0.2% |
| Western Europe | 155 | 0.3% | View All 68 Rows |
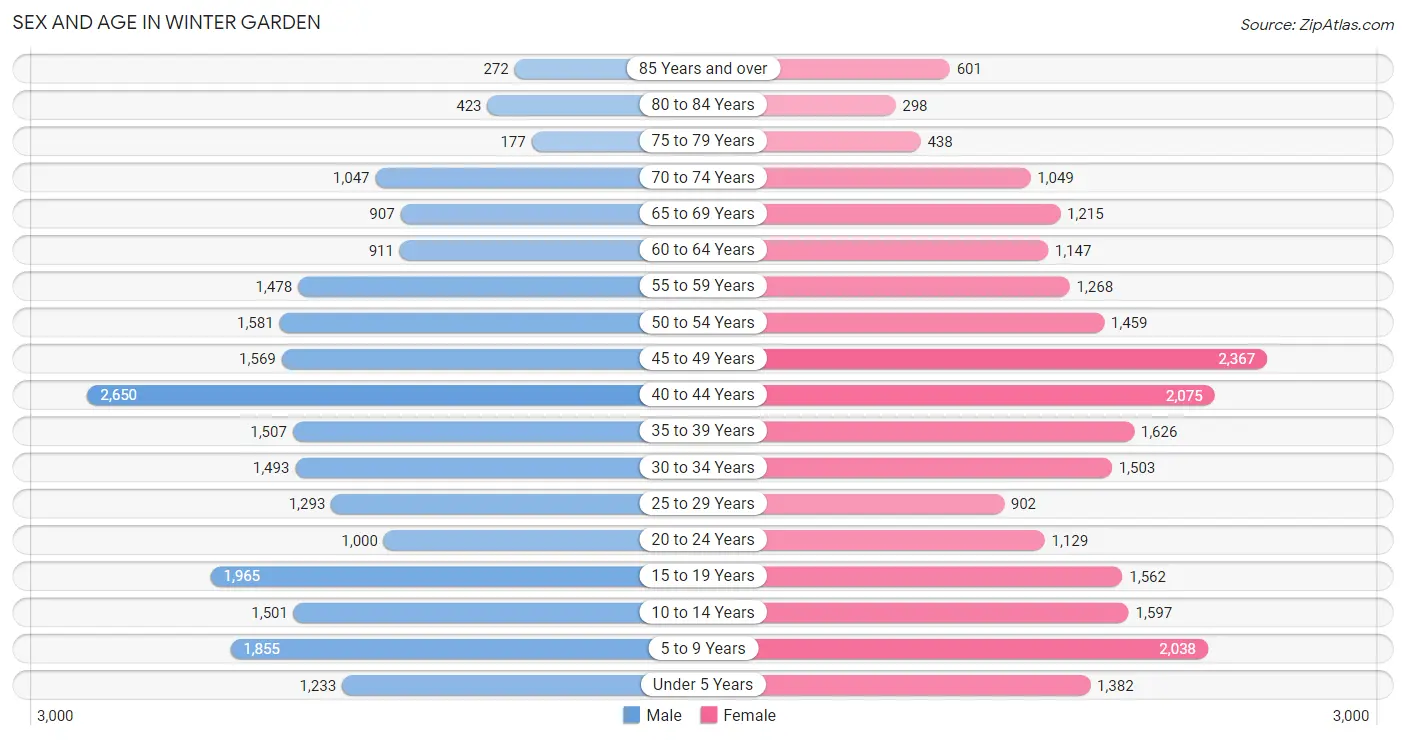
Sex and Age in Winter Garden
Sex and Age in Winter Garden
The most populous age groups in Winter Garden are 40 to 44 Years (2,650 | 11.6%) for men and 45 to 49 Years (2,367 | 10.0%) for women.
| Age Bracket | Male | Female |
| Under 5 Years | 1,233 (5.4%) | 1,382 (5.8%) |
| 5 to 9 Years | 1,855 (8.1%) | 2,038 (8.6%) |
| 10 to 14 Years | 1,501 (6.6%) | 1,597 (6.8%) |
| 15 to 19 Years | 1,965 (8.6%) | 1,562 (6.6%) |
| 20 to 24 Years | 1,000 (4.4%) | 1,129 (4.8%) |
| 25 to 29 Years | 1,293 (5.7%) | 902 (3.8%) |
| 30 to 34 Years | 1,493 (6.5%) | 1,503 (6.4%) |
| 35 to 39 Years | 1,507 (6.6%) | 1,626 (6.9%) |
| 40 to 44 Years | 2,650 (11.6%) | 2,075 (8.8%) |
| 45 to 49 Years | 1,569 (6.9%) | 2,367 (10.0%) |
| 50 to 54 Years | 1,581 (6.9%) | 1,459 (6.2%) |
| 55 to 59 Years | 1,478 (6.5%) | 1,268 (5.4%) |
| 60 to 64 Years | 911 (4.0%) | 1,147 (4.9%) |
| 65 to 69 Years | 907 (4.0%) | 1,215 (5.1%) |
| 70 to 74 Years | 1,047 (4.6%) | 1,049 (4.4%) |
| 75 to 79 Years | 177 (0.8%) | 438 (1.8%) |
| 80 to 84 Years | 423 (1.8%) | 298 (1.3%) |
| 85 Years and over | 272 (1.2%) | 601 (2.5%) |
| Total | 22,862 (100.0%) | 23,656 (100.0%) |
Families and Households in Winter Garden
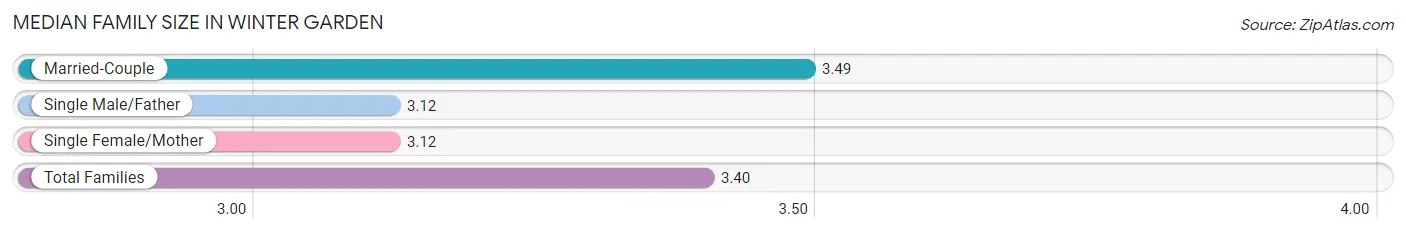
Median Family Size in Winter Garden
The median family size in Winter Garden is 3.40 persons per family, with married-couple families (8,858 | 74.9%) accounting for the largest median family size of 3.49 persons per family. On the other hand, single male/father families (924 | 7.8%) represent the smallest median family size with 3.12 persons per family.
| Family Type | # Families | Family Size |
| Married-Couple | 8,858 (74.9%) | 3.49 |
| Single Male/Father | 924 (7.8%) | 3.12 |
| Single Female/Mother | 2,047 (17.3%) | 3.12 |
| Total Families | 11,829 (100.0%) | 3.40 |
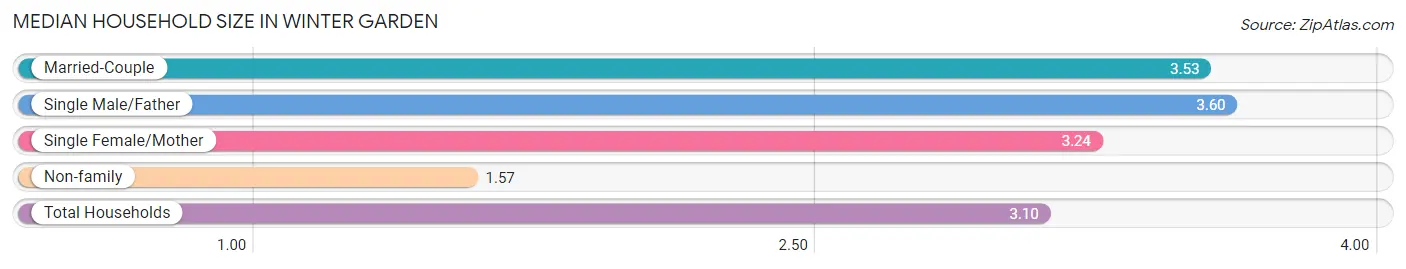
Median Household Size in Winter Garden
The median household size in Winter Garden is 3.10 persons per household, with single male/father households (924 | 6.2%) accounting for the largest median household size of 3.6 persons per household. non-family households (2,957 | 20.0%) represent the smallest median household size with 1.57 persons per household.
| Household Type | # Households | Household Size |
| Married-Couple | 8,858 (59.9%) | 3.53 |
| Single Male/Father | 924 (6.2%) | 3.60 |
| Single Female/Mother | 2,047 (13.8%) | 3.24 |
| Non-family | 2,957 (20.0%) | 1.57 |
| Total Households | 14,786 (100.0%) | 3.10 |
Household Size by Marriage Status in Winter Garden
Out of a total of 14,786 households in Winter Garden, 11,829 (80.0%) are family households, while 2,957 (20.0%) are nonfamily households. The most numerous type of family households are 2-person households, comprising 4,420, and the most common type of nonfamily households are 1-person households, comprising 2,255.
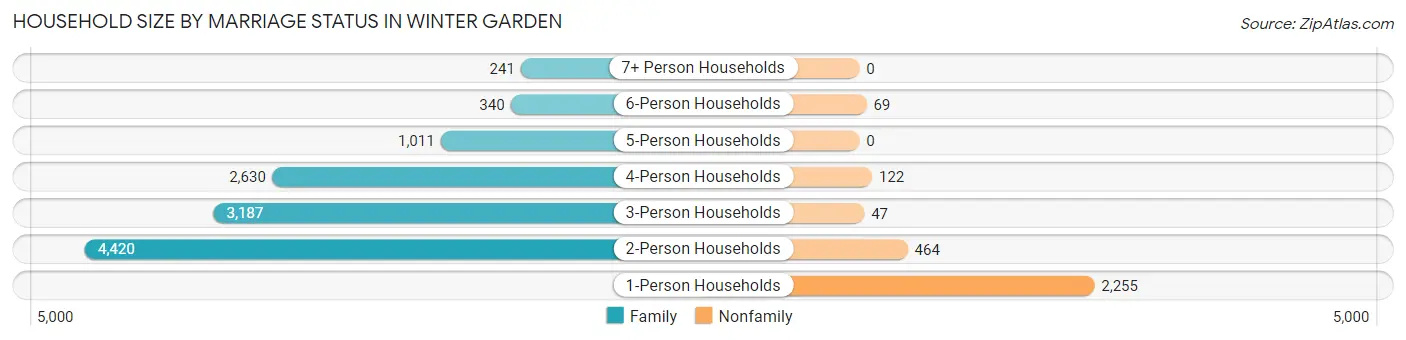
| Household Size | Family Households | Nonfamily Households |
| 1-Person Households | - | 2,255 (15.2%) |
| 2-Person Households | 4,420 (29.9%) | 464 (3.1%) |
| 3-Person Households | 3,187 (21.5%) | 47 (0.3%) |
| 4-Person Households | 2,630 (17.8%) | 122 (0.8%) |
| 5-Person Households | 1,011 (6.8%) | 0 (0.0%) |
| 6-Person Households | 340 (2.3%) | 69 (0.5%) |
| 7+ Person Households | 241 (1.6%) | 0 (0.0%) |
| Total | 11,829 (80.0%) | 2,957 (20.0%) |
Female Fertility in Winter Garden
Fertility by Age in Winter Garden
Average fertility rate in Winter Garden is 33.0 births per 1,000 women. Women in the age bracket of 20 to 34 years have the highest fertility rate with 51.0 births per 1,000 women. Women in the age bracket of 20 to 34 years acount for 46.3% of all women with births.
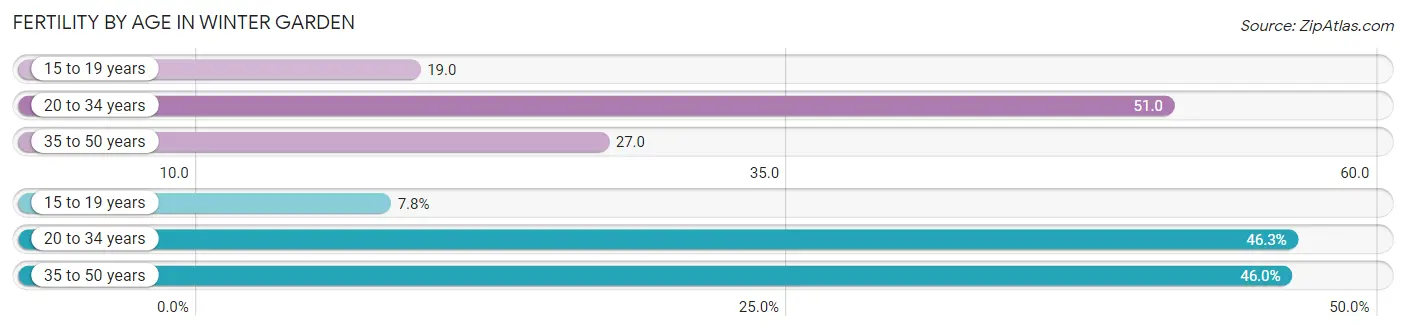
| Age Bracket | Women with Births | Births / 1,000 Women |
| 15 to 19 years | 30 (7.7%) | 19.0 |
| 20 to 34 years | 179 (46.3%) | 51.0 |
| 35 to 50 years | 178 (46.0%) | 27.0 |
| Total | 387 (100.0%) | 33.0 |
Fertility by Age by Marriage Status in Winter Garden
69.3% of women with births (387) in Winter Garden are married. The highest percentage of unmarried women with births falls into 15 to 19 years age bracket with 100.0% of them unmarried at the time of birth, while the lowest percentage of unmarried women with births belong to 35 to 50 years age bracket with 3.9% of them unmarried.
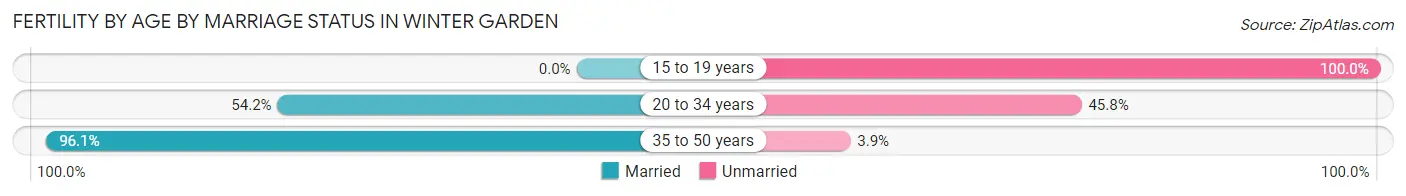
| Age Bracket | Married | Unmarried |
| 15 to 19 years | 0 (0.0%) | 30 (100.0%) |
| 20 to 34 years | 97 (54.2%) | 82 (45.8%) |
| 35 to 50 years | 171 (96.1%) | 7 (3.9%) |
| Total | 268 (69.3%) | 119 (30.7%) |
Fertility by Education in Winter Garden
Average fertility rate in Winter Garden is 33.0 births per 1,000 women. Women with the education attainment of bachelor's degree have the highest fertility rate of 46.0 births per 1,000 women, while women with the education attainment of high school diploma have the lowest fertility at 18.0 births per 1,000 women. Women with the education attainment of college or associate's degree represent 36.2% of all women with births.
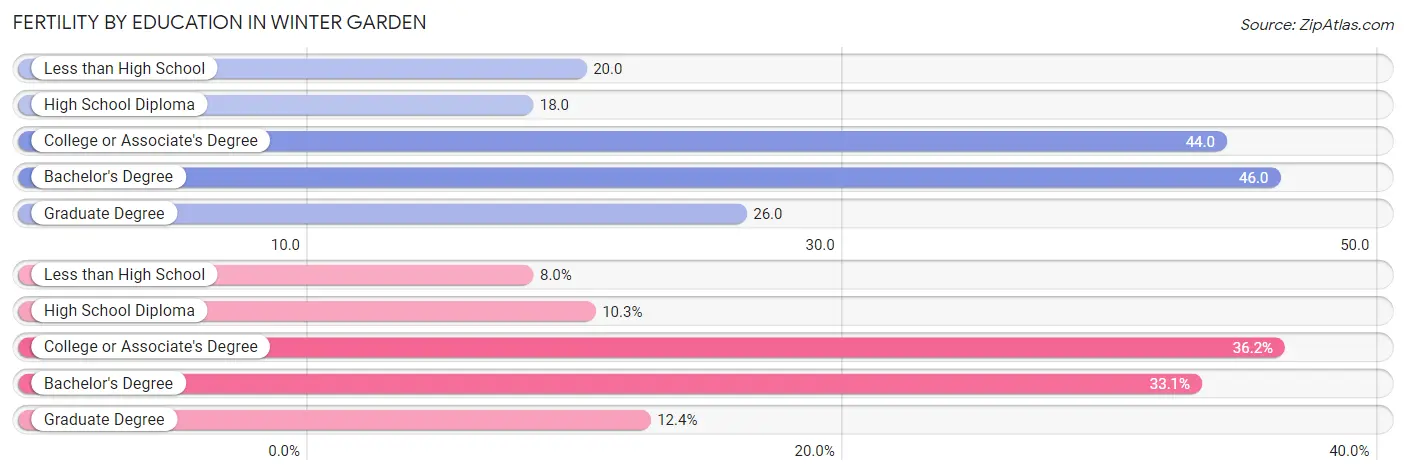
| Educational Attainment | Women with Births | Births / 1,000 Women |
| Less than High School | 31 (8.0%) | 20.0 |
| High School Diploma | 40 (10.3%) | 18.0 |
| College or Associate's Degree | 140 (36.2%) | 44.0 |
| Bachelor's Degree | 128 (33.1%) | 46.0 |
| Graduate Degree | 48 (12.4%) | 26.0 |
| Total | 387 (100.0%) | 33.0 |
Fertility by Education by Marriage Status in Winter Garden
30.7% of women with births in Winter Garden are unmarried. Women with the educational attainment of bachelor's degree are most likely to be married with 100.0% of them married at childbirth, while women with the educational attainment of less than high school are least likely to be married with 100.0% of them unmarried at childbirth.
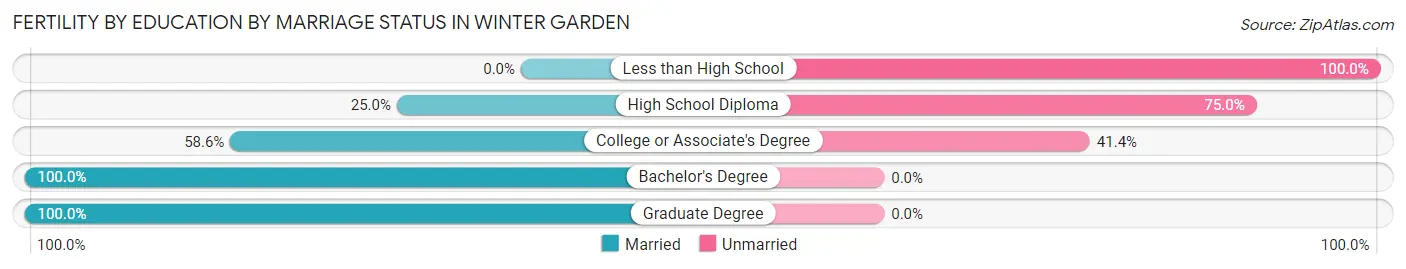
| Educational Attainment | Married | Unmarried |
| Less than High School | 0 (0.0%) | 31 (100.0%) |
| High School Diploma | 10 (25.0%) | 30 (75.0%) |
| College or Associate's Degree | 82 (58.6%) | 58 (41.4%) |
| Bachelor's Degree | 128 (100.0%) | 0 (0.0%) |
| Graduate Degree | 48 (100.0%) | 0 (0.0%) |
| Total | 268 (69.3%) | 119 (30.7%) |
Employment Characteristics in Winter Garden
Employment by Class of Employer in Winter Garden
Among the 22,702 employed individuals in Winter Garden, private company employees (16,861 | 74.3%), local government employees (1,456 | 6.4%), and self-employed (not incorporated) (1,445 | 6.4%) make up the most common classes of employment.
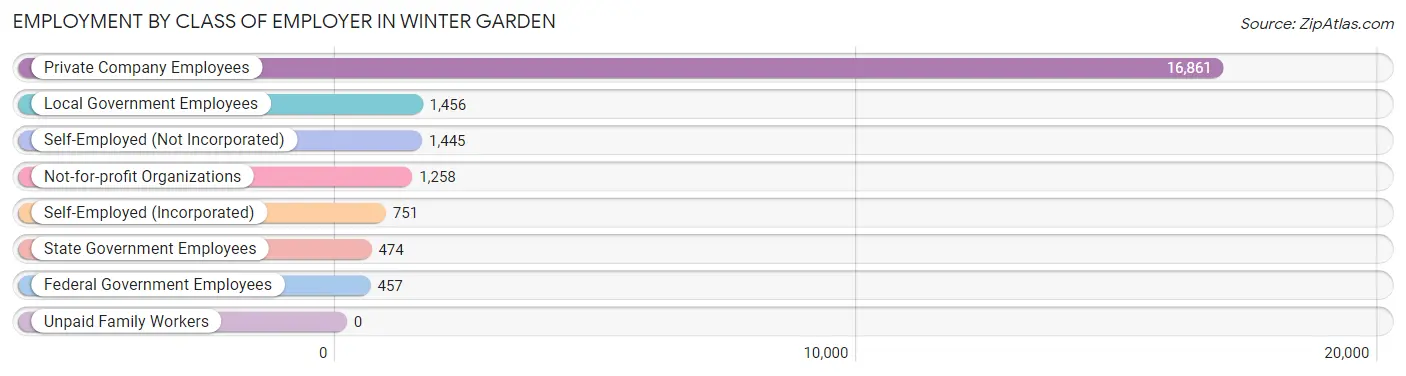
| Employer Class | # Employees | % Employees |
| Private Company Employees | 16,861 | 74.3% |
| Self-Employed (Incorporated) | 751 | 3.3% |
| Self-Employed (Not Incorporated) | 1,445 | 6.4% |
| Not-for-profit Organizations | 1,258 | 5.5% |
| Local Government Employees | 1,456 | 6.4% |
| State Government Employees | 474 | 2.1% |
| Federal Government Employees | 457 | 2.0% |
| Unpaid Family Workers | 0 | 0.0% |
| Total | 22,702 | 100.0% |
Employment Status by Age in Winter Garden
According to the labor force statistics for Winter Garden, out of the total population over 16 years of age (35,722), 69.2% or 24,720 individuals are in the labor force, with 6.9% or 1,706 of them unemployed. The age group with the highest labor force participation rate is 35 to 44 years, with 90.7% or 7,127 individuals in the labor force. Within the labor force, the 16 to 19 years age range has the highest percentage of unemployed individuals, with 29.3% or 321 of them being unemployed.
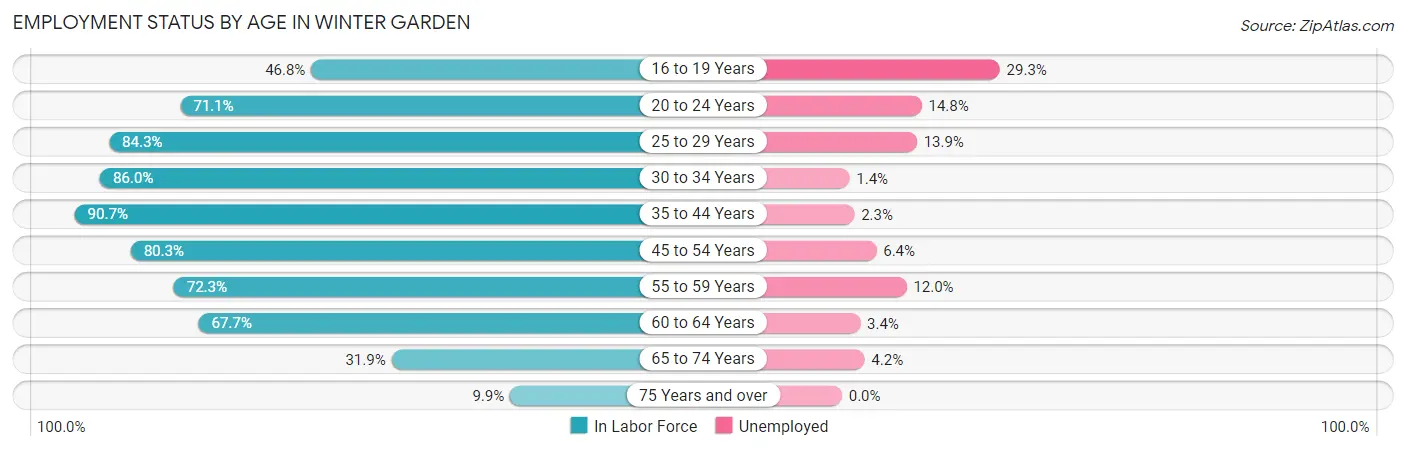
| Age Bracket | In Labor Force | Unemployed |
| 16 to 19 Years | 1,094 (46.8%) | 321 (29.3%) |
| 20 to 24 Years | 1,514 (71.1%) | 224 (14.8%) |
| 25 to 29 Years | 1,850 (84.3%) | 257 (13.9%) |
| 30 to 34 Years | 2,577 (86.0%) | 36 (1.4%) |
| 35 to 44 Years | 7,127 (90.7%) | 164 (2.3%) |
| 45 to 54 Years | 5,602 (80.3%) | 359 (6.4%) |
| 55 to 59 Years | 1,985 (72.3%) | 238 (12.0%) |
| 60 to 64 Years | 1,393 (67.7%) | 47 (3.4%) |
| 65 to 74 Years | 1,346 (31.9%) | 57 (4.2%) |
| 75 Years and over | 219 (9.9%) | 0 (0.0%) |
| Total | 24,720 (69.2%) | 1,706 (6.9%) |
Employment Status by Educational Attainment in Winter Garden
According to labor force statistics for Winter Garden, 82.7% of individuals (20,534) out of the total population between 25 and 64 years of age (24,829) are in the labor force, with 5.3% or 1,088 of them being unemployed. The group with the highest labor force participation rate are those with the educational attainment of bachelor's degree or higher, with 88.8% or 9,634 individuals in the labor force. Within the labor force, individuals with less than high school education have the highest percentage of unemployment, with 11.6% or 193 of them being unemployed.
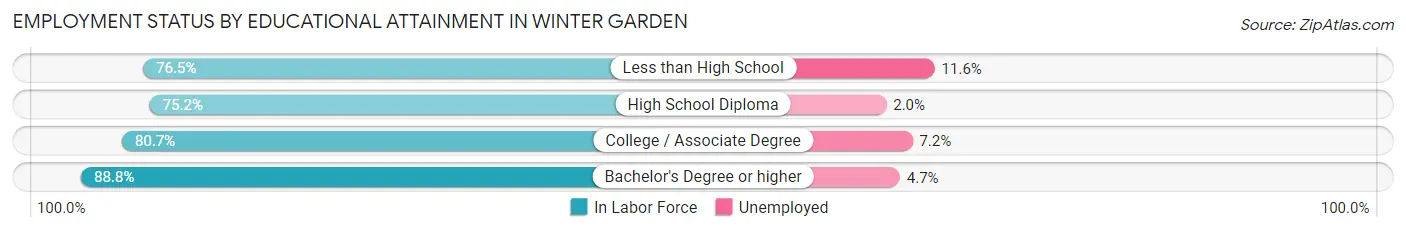
| Educational Attainment | In Labor Force | Unemployed |
| Less than High School | 1,666 (76.5%) | 253 (11.6%) |
| High School Diploma | 4,024 (75.2%) | 107 (2.0%) |
| College / Associate Degree | 5,206 (80.7%) | 464 (7.2%) |
| Bachelor's Degree or higher | 9,634 (88.8%) | 510 (4.7%) |
| Total | 20,534 (82.7%) | 1,316 (5.3%) |
Employment Occupations by Sex in Winter Garden
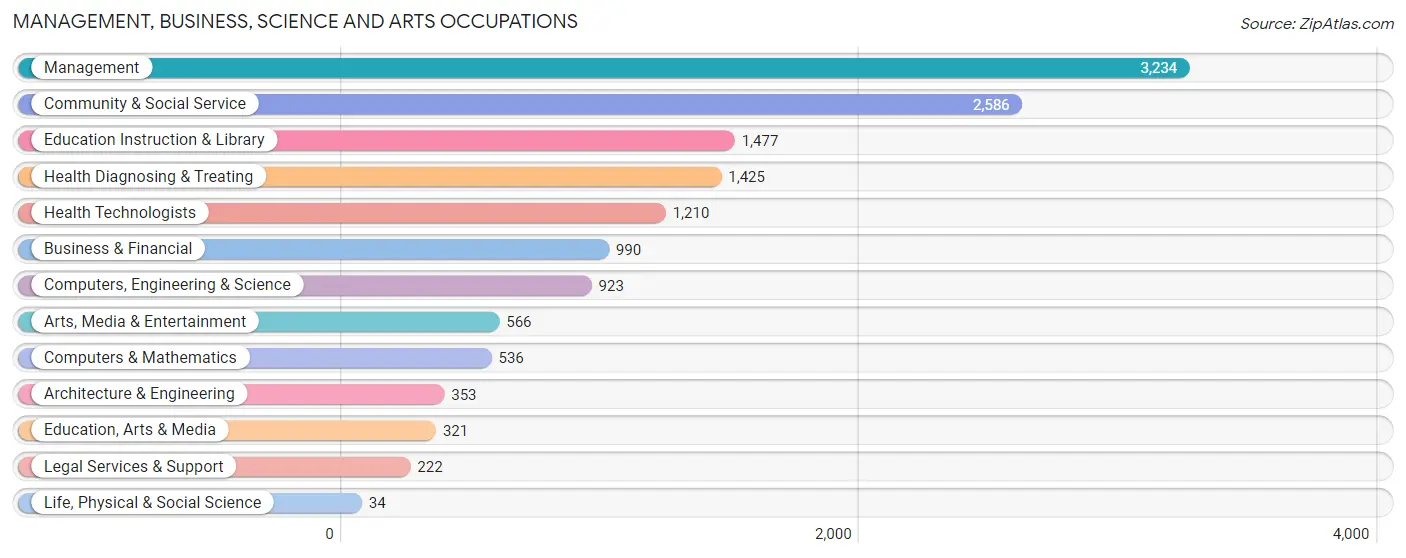
Management, Business, Science and Arts Occupations
The most common Management, Business, Science and Arts occupations in Winter Garden are Management (3,234 | 14.1%), Community & Social Service (2,586 | 11.3%), Education Instruction & Library (1,477 | 6.4%), Health Diagnosing & Treating (1,425 | 6.2%), and Health Technologists (1,210 | 5.3%).
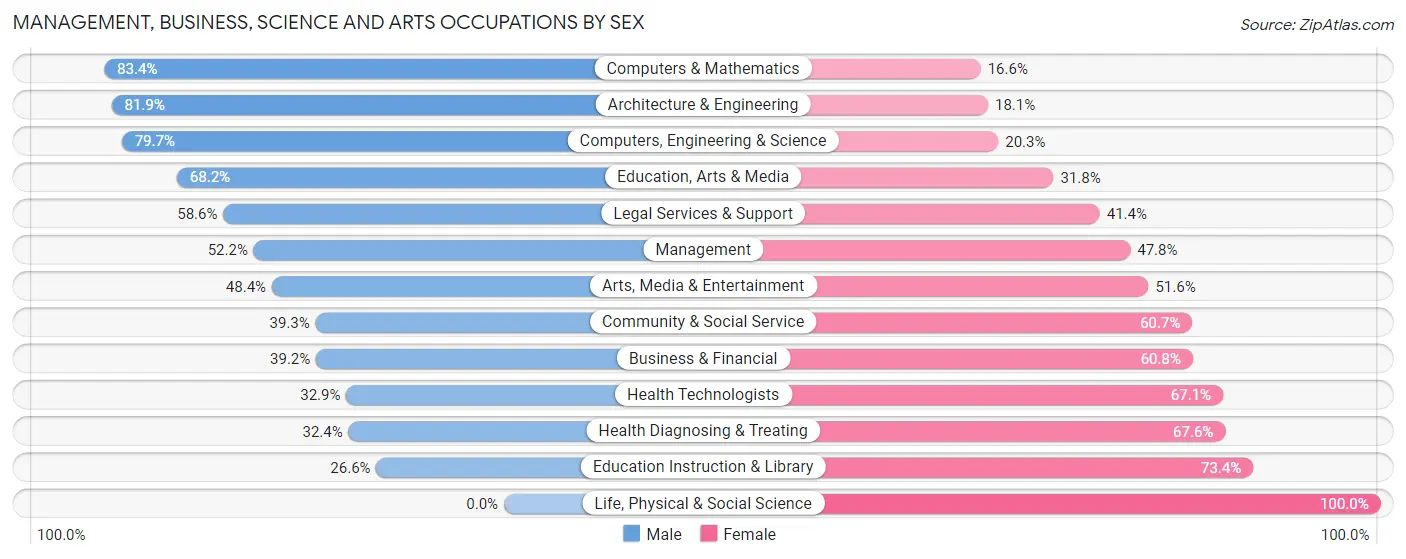
Management, Business, Science and Arts Occupations by Sex
Within the Management, Business, Science and Arts occupations in Winter Garden, the most male-oriented occupations are Computers & Mathematics (83.4%), Architecture & Engineering (81.9%), and Computers, Engineering & Science (79.7%), while the most female-oriented occupations are Life, Physical & Social Science (100.0%), Education Instruction & Library (73.4%), and Health Diagnosing & Treating (67.6%).
| Occupation | Male | Female |
| Management | 1,688 (52.2%) | 1,546 (47.8%) |
| Business & Financial | 388 (39.2%) | 602 (60.8%) |
| Computers, Engineering & Science | 736 (79.7%) | 187 (20.3%) |
| Computers & Mathematics | 447 (83.4%) | 89 (16.6%) |
| Architecture & Engineering | 289 (81.9%) | 64 (18.1%) |
| Life, Physical & Social Science | 0 (0.0%) | 34 (100.0%) |
| Community & Social Service | 1,016 (39.3%) | 1,570 (60.7%) |
| Education, Arts & Media | 219 (68.2%) | 102 (31.8%) |
| Legal Services & Support | 130 (58.6%) | 92 (41.4%) |
| Education Instruction & Library | 393 (26.6%) | 1,084 (73.4%) |
| Arts, Media & Entertainment | 274 (48.4%) | 292 (51.6%) |
| Health Diagnosing & Treating | 462 (32.4%) | 963 (67.6%) |
| Health Technologists | 398 (32.9%) | 812 (67.1%) |
| Total (Category) | 4,290 (46.8%) | 4,868 (53.2%) |
| Total (Overall) | 12,552 (54.6%) | 10,427 (45.4%) |
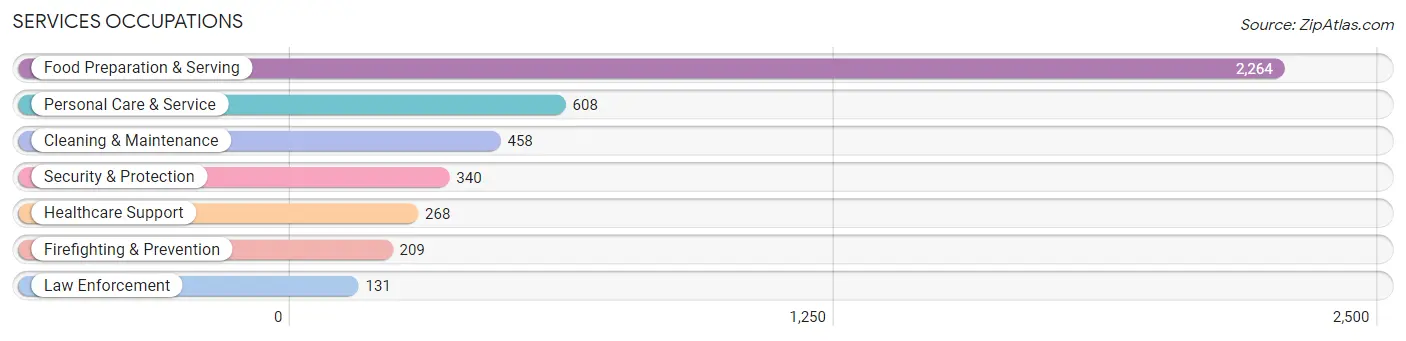
Services Occupations
The most common Services occupations in Winter Garden are Food Preparation & Serving (2,264 | 9.9%), Personal Care & Service (608 | 2.6%), Cleaning & Maintenance (458 | 2.0%), Security & Protection (340 | 1.5%), and Healthcare Support (268 | 1.2%).
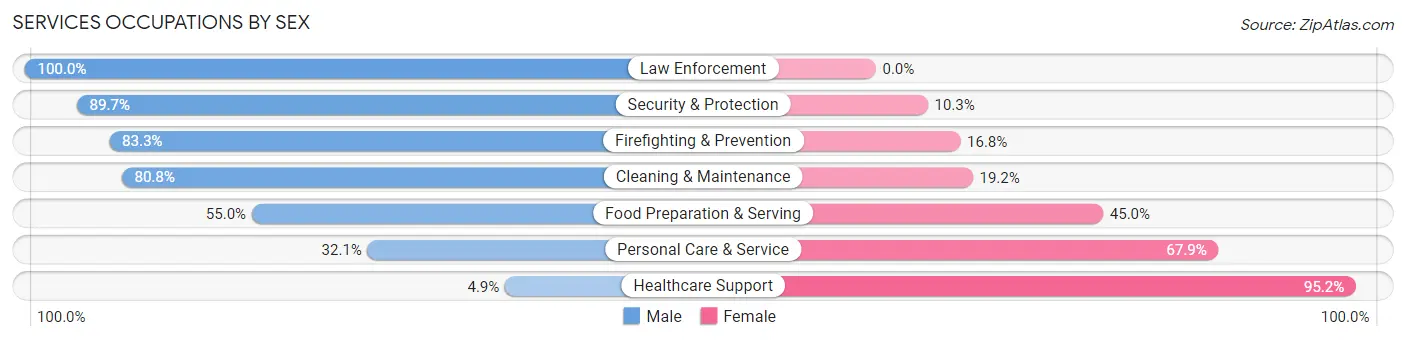
Services Occupations by Sex
Within the Services occupations in Winter Garden, the most male-oriented occupations are Law Enforcement (100.0%), Security & Protection (89.7%), and Firefighting & Prevention (83.3%), while the most female-oriented occupations are Healthcare Support (95.2%), Personal Care & Service (67.9%), and Food Preparation & Serving (45.0%).
| Occupation | Male | Female |
| Healthcare Support | 13 (4.9%) | 255 (95.2%) |
| Security & Protection | 305 (89.7%) | 35 (10.3%) |
| Firefighting & Prevention | 174 (83.3%) | 35 (16.8%) |
| Law Enforcement | 131 (100.0%) | 0 (0.0%) |
| Food Preparation & Serving | 1,245 (55.0%) | 1,019 (45.0%) |
| Cleaning & Maintenance | 370 (80.8%) | 88 (19.2%) |
| Personal Care & Service | 195 (32.1%) | 413 (67.9%) |
| Total (Category) | 2,128 (54.0%) | 1,810 (46.0%) |
| Total (Overall) | 12,552 (54.6%) | 10,427 (45.4%) |
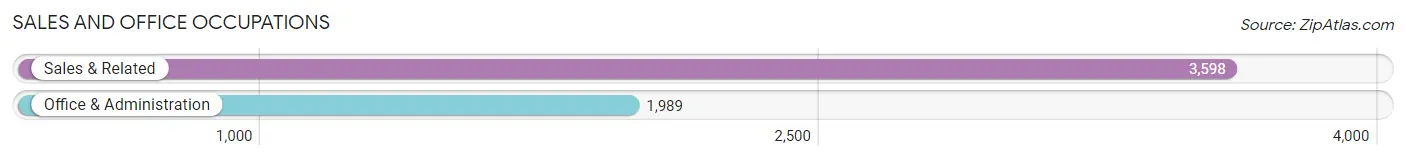
Sales and Office Occupations
The most common Sales and Office occupations in Winter Garden are Sales & Related (3,598 | 15.7%), and Office & Administration (1,989 | 8.7%).
Sales and Office Occupations by Sex
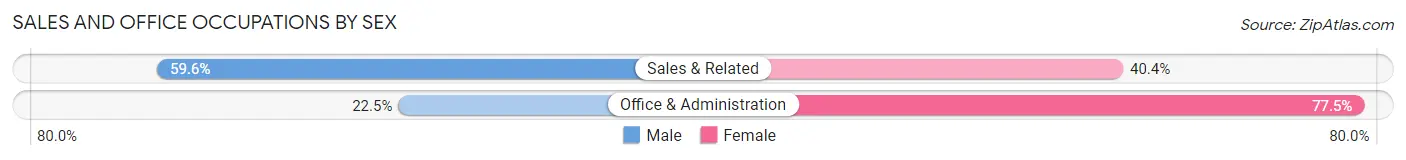
| Occupation | Male | Female |
| Sales & Related | 2,145 (59.6%) | 1,453 (40.4%) |
| Office & Administration | 448 (22.5%) | 1,541 (77.5%) |
| Total (Category) | 2,593 (46.4%) | 2,994 (53.6%) |
| Total (Overall) | 12,552 (54.6%) | 10,427 (45.4%) |
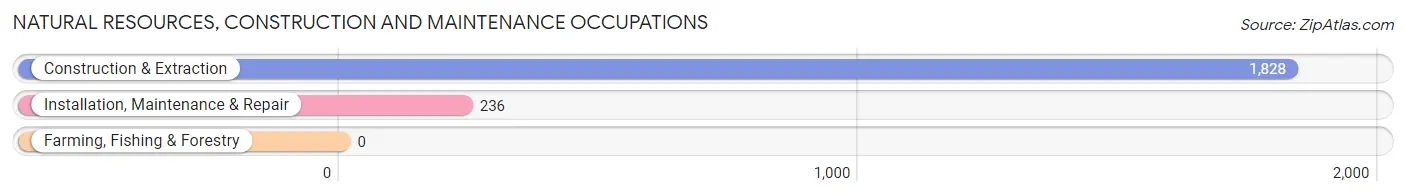
Natural Resources, Construction and Maintenance Occupations
The most common Natural Resources, Construction and Maintenance occupations in Winter Garden are Construction & Extraction (1,828 | 8.0%), and Installation, Maintenance & Repair (236 | 1.0%).
Natural Resources, Construction and Maintenance Occupations by Sex
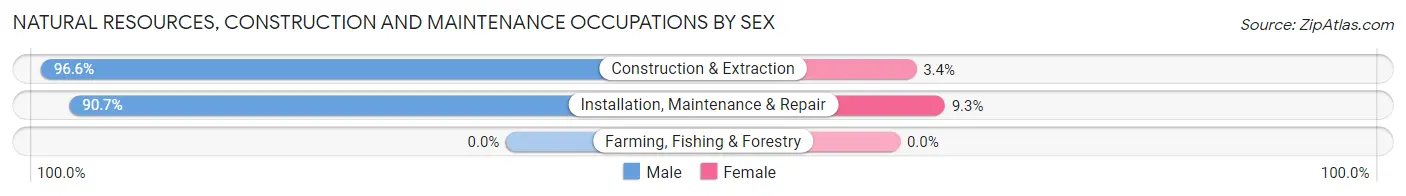
| Occupation | Male | Female |
| Farming, Fishing & Forestry | 0 (0.0%) | 0 (0.0%) |
| Construction & Extraction | 1,766 (96.6%) | 62 (3.4%) |
| Installation, Maintenance & Repair | 214 (90.7%) | 22 (9.3%) |
| Total (Category) | 1,980 (95.9%) | 84 (4.1%) |
| Total (Overall) | 12,552 (54.6%) | 10,427 (45.4%) |
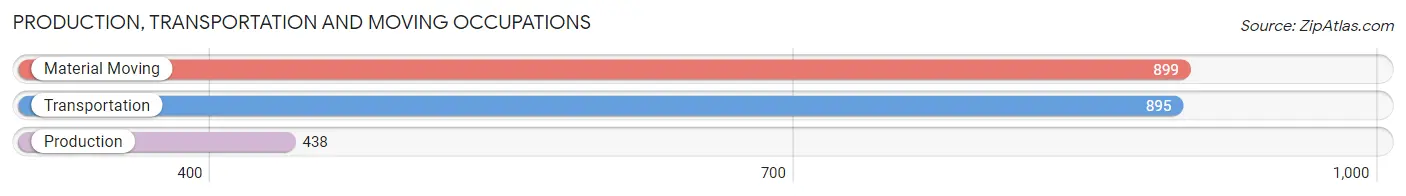
Production, Transportation and Moving Occupations
The most common Production, Transportation and Moving occupations in Winter Garden are Material Moving (899 | 3.9%), Transportation (895 | 3.9%), and Production (438 | 1.9%).
Production, Transportation and Moving Occupations by Sex
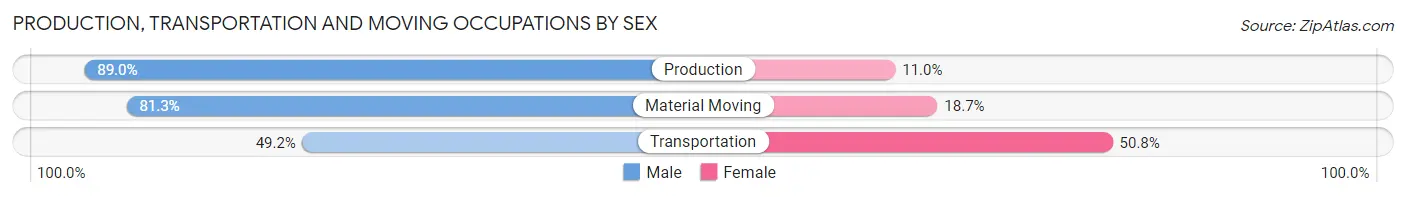
| Occupation | Male | Female |
| Production | 390 (89.0%) | 48 (11.0%) |
| Transportation | 440 (49.2%) | 455 (50.8%) |
| Material Moving | 731 (81.3%) | 168 (18.7%) |
| Total (Category) | 1,561 (69.9%) | 671 (30.1%) |
| Total (Overall) | 12,552 (54.6%) | 10,427 (45.4%) |
Employment Industries by Sex in Winter Garden
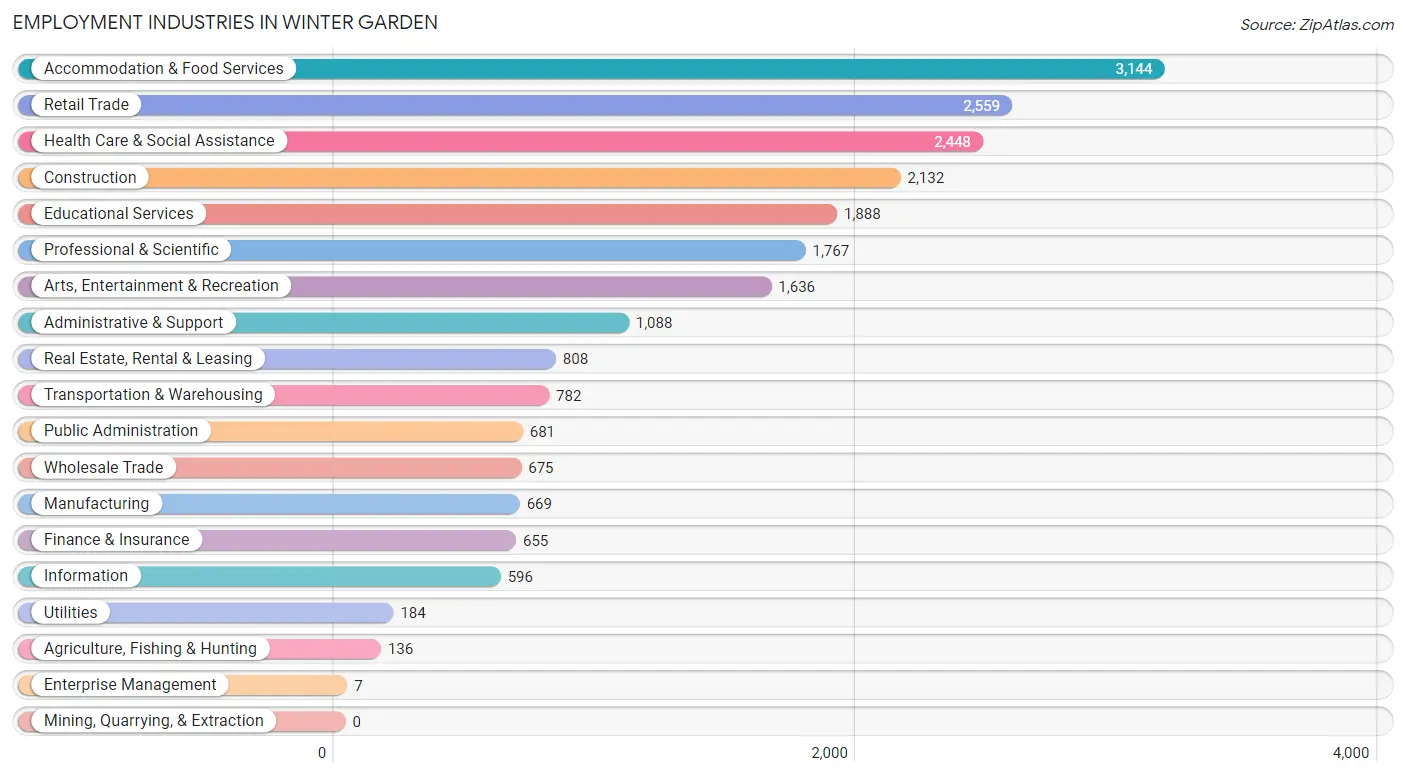
Employment Industries in Winter Garden
The major employment industries in Winter Garden include Accommodation & Food Services (3,144 | 13.7%), Retail Trade (2,559 | 11.1%), Health Care & Social Assistance (2,448 | 10.6%), Construction (2,132 | 9.3%), and Educational Services (1,888 | 8.2%).
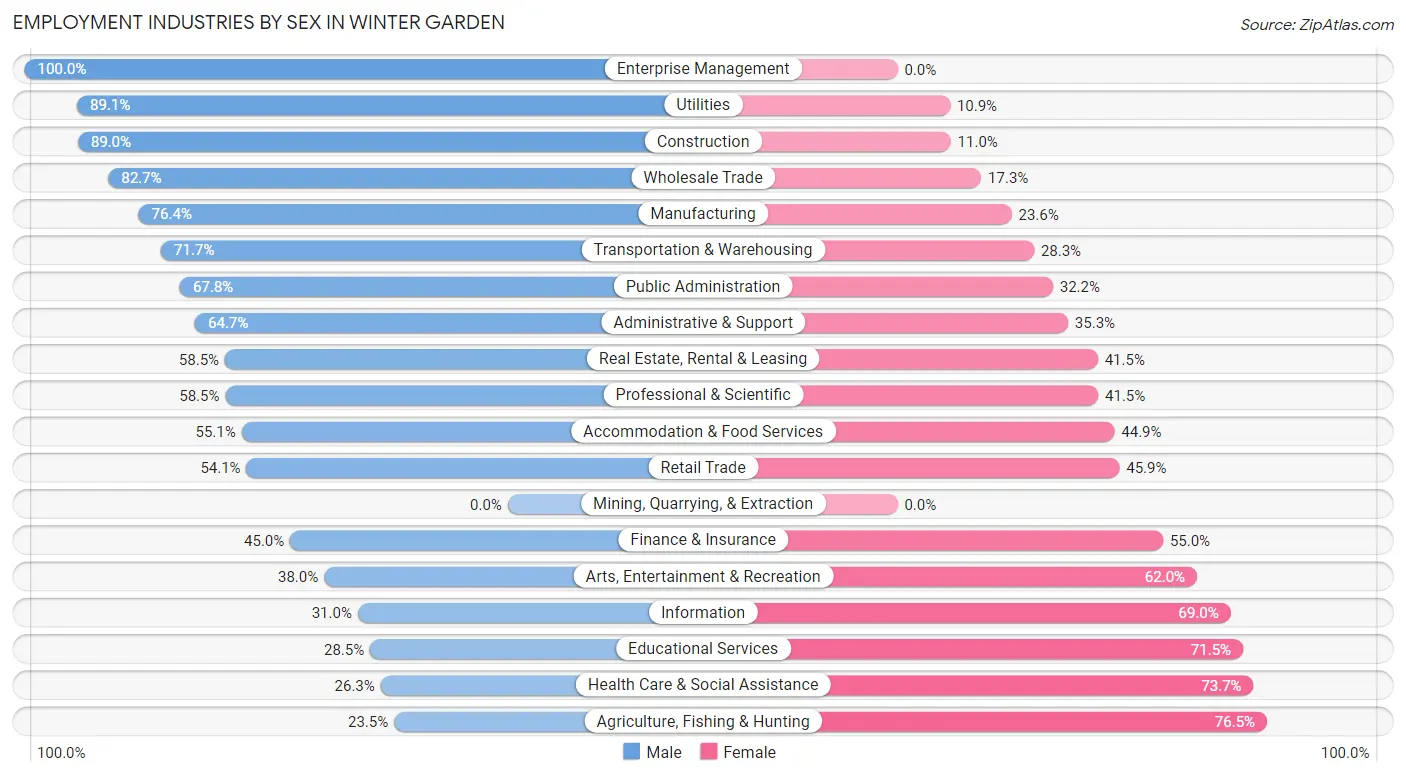
Employment Industries by Sex in Winter Garden
The Winter Garden industries that see more men than women are Enterprise Management (100.0%), Utilities (89.1%), and Construction (89.0%), whereas the industries that tend to have a higher number of women are Agriculture, Fishing & Hunting (76.5%), Health Care & Social Assistance (73.7%), and Educational Services (71.5%).
| Industry | Male | Female |
| Agriculture, Fishing & Hunting | 32 (23.5%) | 104 (76.5%) |
| Mining, Quarrying, & Extraction | 0 (0.0%) | 0 (0.0%) |
| Construction | 1,897 (89.0%) | 235 (11.0%) |
| Manufacturing | 511 (76.4%) | 158 (23.6%) |
| Wholesale Trade | 558 (82.7%) | 117 (17.3%) |
| Retail Trade | 1,384 (54.1%) | 1,175 (45.9%) |
| Transportation & Warehousing | 561 (71.7%) | 221 (28.3%) |
| Utilities | 164 (89.1%) | 20 (10.9%) |
| Information | 185 (31.0%) | 411 (69.0%) |
| Finance & Insurance | 295 (45.0%) | 360 (55.0%) |
| Real Estate, Rental & Leasing | 473 (58.5%) | 335 (41.5%) |
| Professional & Scientific | 1,033 (58.5%) | 734 (41.5%) |
| Enterprise Management | 7 (100.0%) | 0 (0.0%) |
| Administrative & Support | 704 (64.7%) | 384 (35.3%) |
| Educational Services | 538 (28.5%) | 1,350 (71.5%) |
| Health Care & Social Assistance | 644 (26.3%) | 1,804 (73.7%) |
| Arts, Entertainment & Recreation | 622 (38.0%) | 1,014 (62.0%) |
| Accommodation & Food Services | 1,732 (55.1%) | 1,412 (44.9%) |
| Public Administration | 462 (67.8%) | 219 (32.2%) |
| Total | 12,552 (54.6%) | 10,427 (45.4%) |
Education in Winter Garden
School Enrollment in Winter Garden
The most common levels of schooling among the 13,173 students in Winter Garden are high school (2,809 | 21.3%), middle school (2,759 | 20.9%), and elementary school (2,224 | 16.9%).
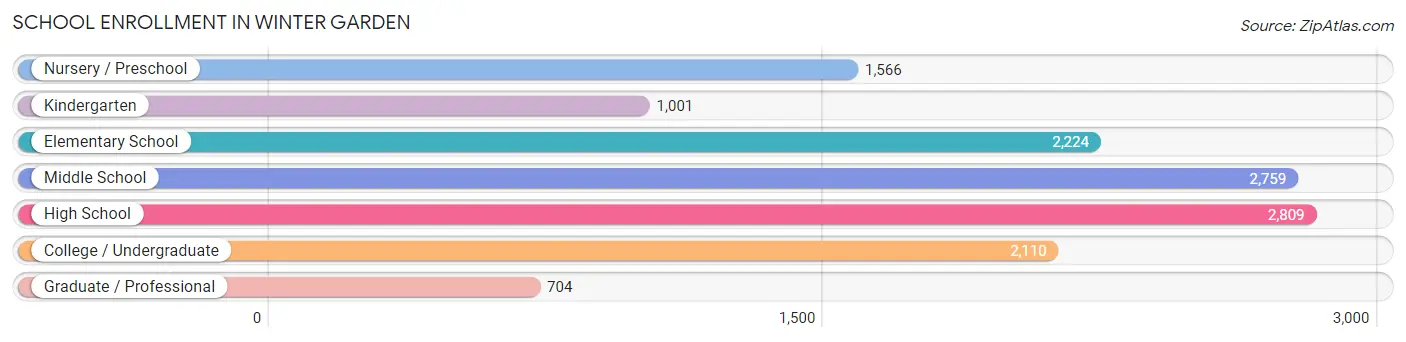
| School Level | # Students | % Students |
| Nursery / Preschool | 1,566 | 11.9% |
| Kindergarten | 1,001 | 7.6% |
| Elementary School | 2,224 | 16.9% |
| Middle School | 2,759 | 20.9% |
| High School | 2,809 | 21.3% |
| College / Undergraduate | 2,110 | 16.0% |
| Graduate / Professional | 704 | 5.3% |
| Total | 13,173 | 100.0% |
School Enrollment by Age by Funding Source in Winter Garden
Out of a total of 13,173 students who are enrolled in schools in Winter Garden, 2,648 (20.1%) attend a private institution, while the remaining 10,525 (79.9%) are enrolled in public schools. The age group of 35 years and over has the highest likelihood of being enrolled in private schools, with 330 (54.7% in the age bracket) enrolled. Conversely, the age group of 25 to 34 year olds has the lowest likelihood of being enrolled in a private school, with 863 (96.2% in the age bracket) attending a public institution.
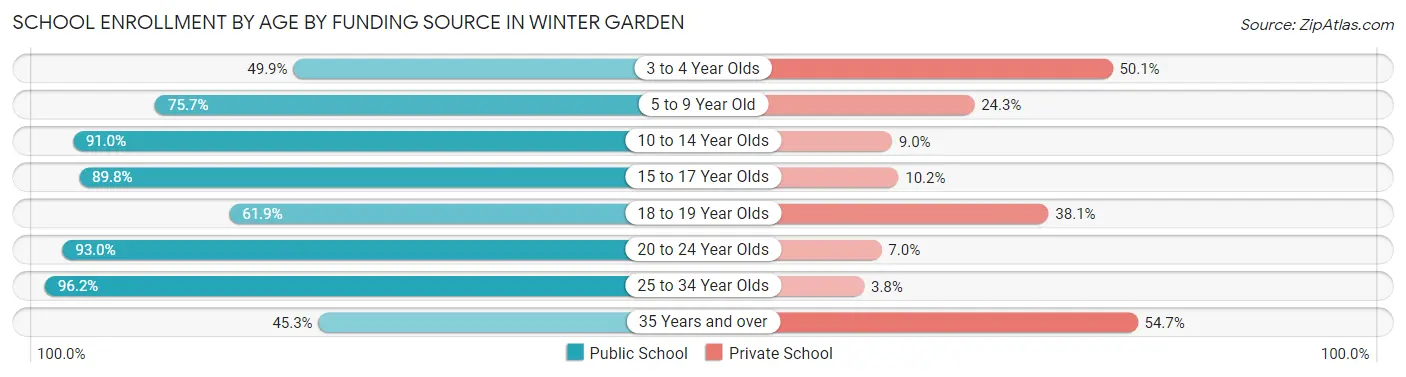
| Age Bracket | Public School | Private School |
| 3 to 4 Year Olds | 437 (49.9%) | 438 (50.1%) |
| 5 to 9 Year Old | 2,899 (75.7%) | 931 (24.3%) |
| 10 to 14 Year Olds | 2,705 (91.0%) | 267 (9.0%) |
| 15 to 17 Year Olds | 2,164 (89.8%) | 245 (10.2%) |
| 18 to 19 Year Olds | 568 (61.9%) | 350 (38.1%) |
| 20 to 24 Year Olds | 622 (93.0%) | 47 (7.0%) |
| 25 to 34 Year Olds | 863 (96.2%) | 34 (3.8%) |
| 35 Years and over | 273 (45.3%) | 330 (54.7%) |
| Total | 10,525 (79.9%) | 2,648 (20.1%) |
Educational Attainment by Field of Study in Winter Garden
Business (3,245 | 23.2%), science & technology (1,519 | 10.9%), arts & humanities (1,353 | 9.7%), education (1,301 | 9.3%), and engineering (1,054 | 7.5%) are the most common fields of study among 13,991 individuals in Winter Garden who have obtained a bachelor's degree or higher.
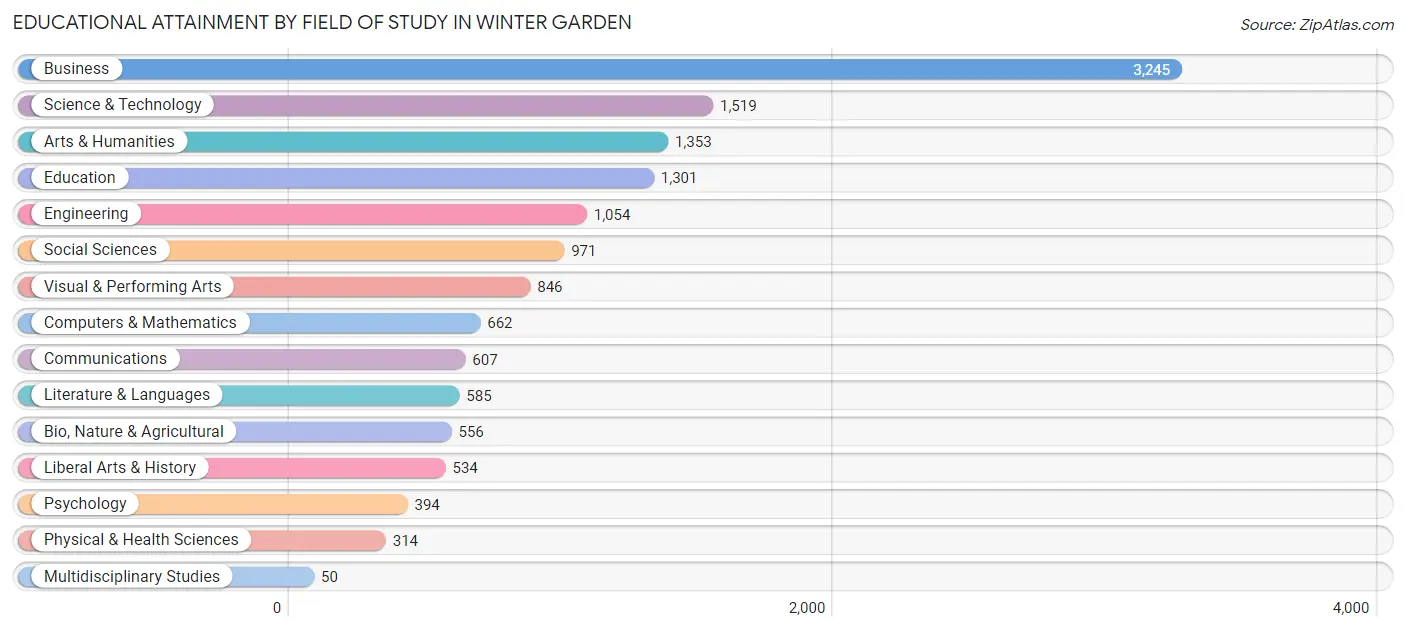
| Field of Study | # Graduates | % Graduates |
| Computers & Mathematics | 662 | 4.7% |
| Bio, Nature & Agricultural | 556 | 4.0% |
| Physical & Health Sciences | 314 | 2.2% |
| Psychology | 394 | 2.8% |
| Social Sciences | 971 | 6.9% |
| Engineering | 1,054 | 7.5% |
| Multidisciplinary Studies | 50 | 0.4% |
| Science & Technology | 1,519 | 10.9% |
| Business | 3,245 | 23.2% |
| Education | 1,301 | 9.3% |
| Literature & Languages | 585 | 4.2% |
| Liberal Arts & History | 534 | 3.8% |
| Visual & Performing Arts | 846 | 6.0% |
| Communications | 607 | 4.3% |
| Arts & Humanities | 1,353 | 9.7% |
| Total | 13,991 | 100.0% |
Transportation & Commute in Winter Garden
Vehicle Availability by Sex in Winter Garden
The most prevalent vehicle ownership categories in Winter Garden are males with 2 vehicles (5,756, accounting for 46.2%) and females with 2 vehicles (4,419, making up 56.3%).
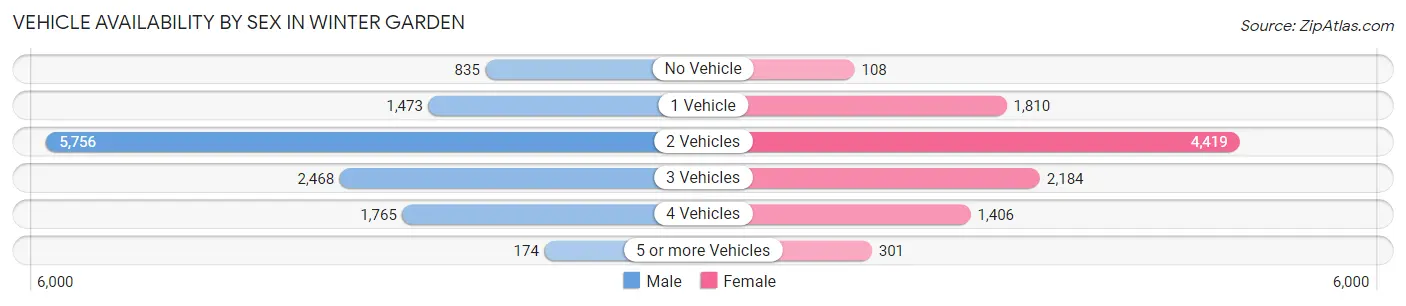
| Vehicles Available | Male | Female |
| No Vehicle | 835 (6.7%) | 108 (1.1%) |
| 1 Vehicle | 1,473 (11.8%) | 1,810 (17.7%) |
| 2 Vehicles | 5,756 (46.2%) | 4,419 (43.2%) |
| 3 Vehicles | 2,468 (19.8%) | 2,184 (21.3%) |
| 4 Vehicles | 1,765 (14.1%) | 1,406 (13.8%) |
| 5 or more Vehicles | 174 (1.4%) | 301 (2.9%) |
| Total | 12,471 (100.0%) | 10,228 (100.0%) |
Commute Time in Winter Garden
The most frequently occuring commute durations in Winter Garden are 30 to 34 minutes (4,847 commuters, 24.9%), 45 to 59 minutes (2,400 commuters, 12.3%), and 10 to 14 minutes (2,253 commuters, 11.6%).
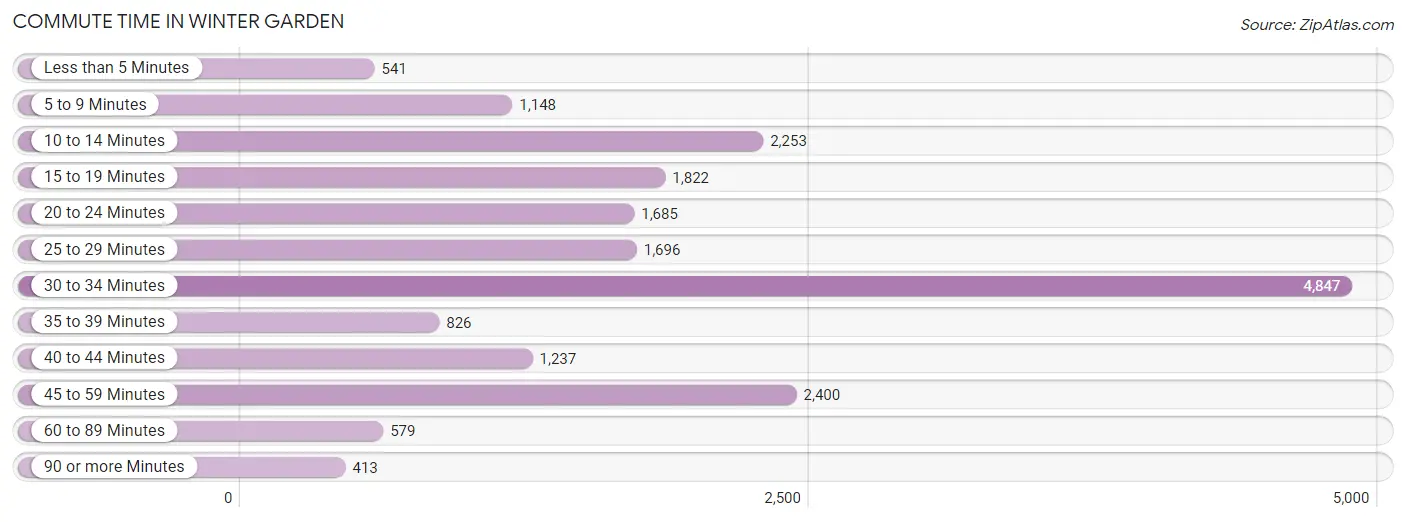
| Commute Time | # Commuters | % Commuters |
| Less than 5 Minutes | 541 | 2.8% |
| 5 to 9 Minutes | 1,148 | 5.9% |
| 10 to 14 Minutes | 2,253 | 11.6% |
| 15 to 19 Minutes | 1,822 | 9.4% |
| 20 to 24 Minutes | 1,685 | 8.7% |
| 25 to 29 Minutes | 1,696 | 8.7% |
| 30 to 34 Minutes | 4,847 | 24.9% |
| 35 to 39 Minutes | 826 | 4.3% |
| 40 to 44 Minutes | 1,237 | 6.4% |
| 45 to 59 Minutes | 2,400 | 12.3% |
| 60 to 89 Minutes | 579 | 3.0% |
| 90 or more Minutes | 413 | 2.1% |
Commute Time by Sex in Winter Garden
The most common commute times in Winter Garden are 30 to 34 minutes (2,808 commuters, 25.7%) for males and 30 to 34 minutes (2,039 commuters, 23.9%) for females.
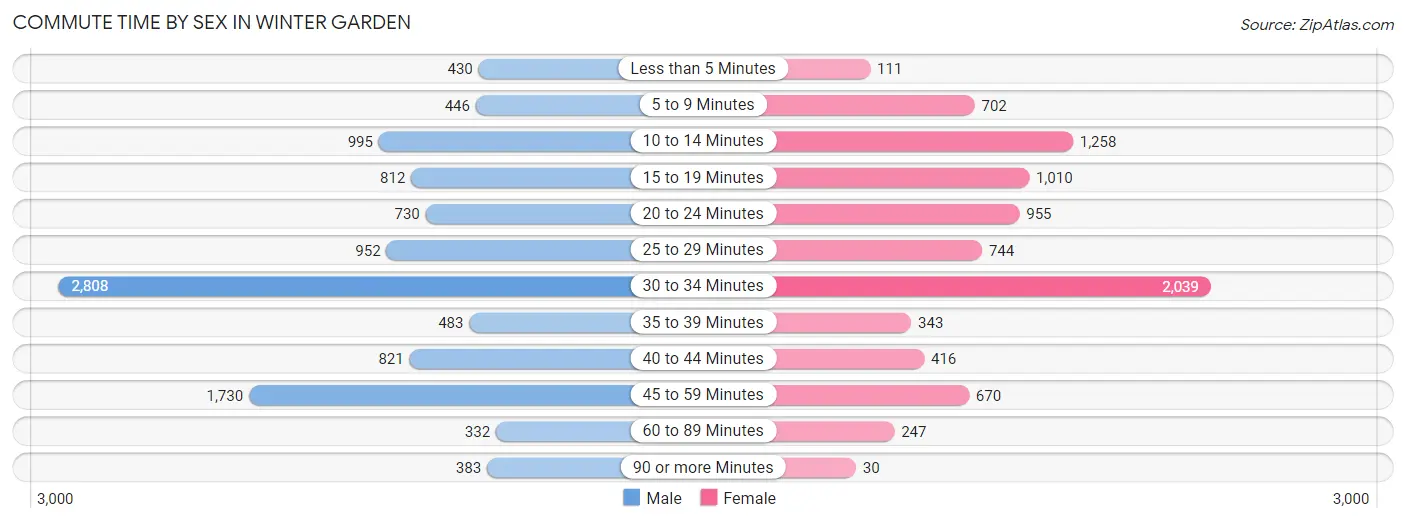
| Commute Time | Male | Female |
| Less than 5 Minutes | 430 (3.9%) | 111 (1.3%) |
| 5 to 9 Minutes | 446 (4.1%) | 702 (8.2%) |
| 10 to 14 Minutes | 995 (9.1%) | 1,258 (14.8%) |
| 15 to 19 Minutes | 812 (7.4%) | 1,010 (11.8%) |
| 20 to 24 Minutes | 730 (6.7%) | 955 (11.2%) |
| 25 to 29 Minutes | 952 (8.7%) | 744 (8.7%) |
| 30 to 34 Minutes | 2,808 (25.7%) | 2,039 (23.9%) |
| 35 to 39 Minutes | 483 (4.4%) | 343 (4.0%) |
| 40 to 44 Minutes | 821 (7.5%) | 416 (4.9%) |
| 45 to 59 Minutes | 1,730 (15.8%) | 670 (7.9%) |
| 60 to 89 Minutes | 332 (3.0%) | 247 (2.9%) |
| 90 or more Minutes | 383 (3.5%) | 30 (0.4%) |
Time of Departure to Work by Sex in Winter Garden
The most frequent times of departure to work in Winter Garden are 8:00 AM to 8:29 AM (1,923, 17.6%) for males and 8:00 AM to 8:29 AM (1,701, 20.0%) for females.
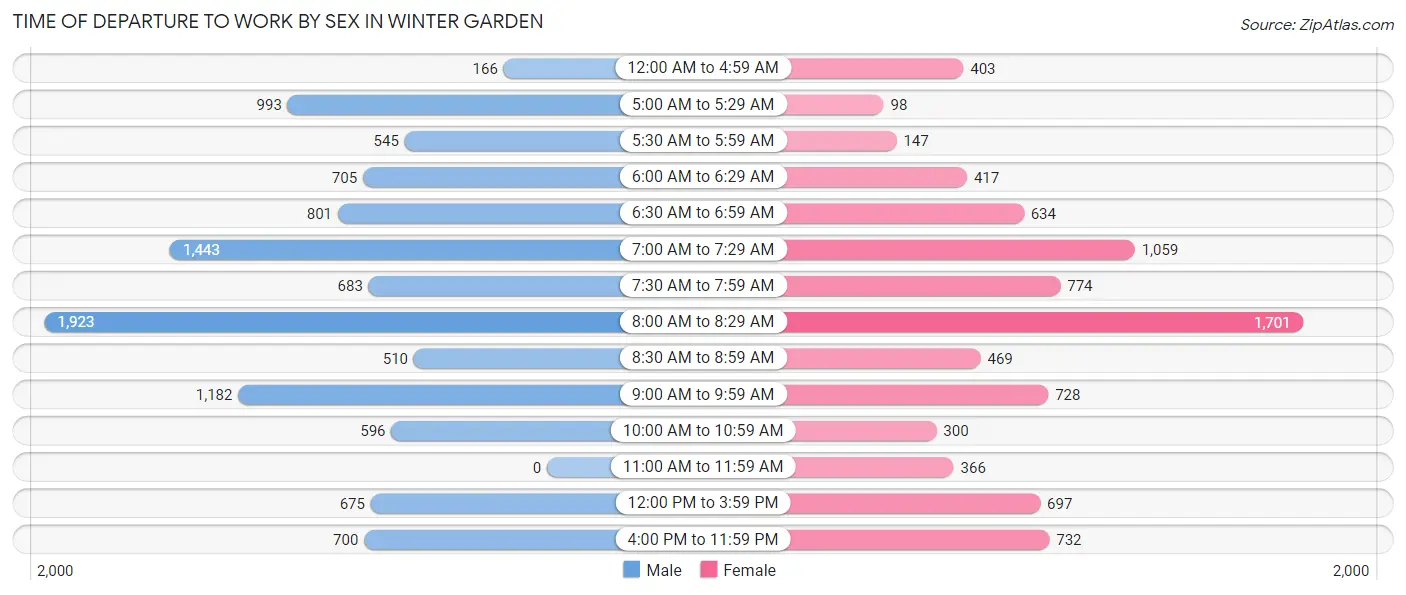
| Time of Departure | Male | Female |
| 12:00 AM to 4:59 AM | 166 (1.5%) | 403 (4.7%) |
| 5:00 AM to 5:29 AM | 993 (9.1%) | 98 (1.1%) |
| 5:30 AM to 5:59 AM | 545 (5.0%) | 147 (1.7%) |
| 6:00 AM to 6:29 AM | 705 (6.5%) | 417 (4.9%) |
| 6:30 AM to 6:59 AM | 801 (7.3%) | 634 (7.4%) |
| 7:00 AM to 7:29 AM | 1,443 (13.2%) | 1,059 (12.4%) |
| 7:30 AM to 7:59 AM | 683 (6.2%) | 774 (9.1%) |
| 8:00 AM to 8:29 AM | 1,923 (17.6%) | 1,701 (20.0%) |
| 8:30 AM to 8:59 AM | 510 (4.7%) | 469 (5.5%) |
| 9:00 AM to 9:59 AM | 1,182 (10.8%) | 728 (8.5%) |
| 10:00 AM to 10:59 AM | 596 (5.5%) | 300 (3.5%) |
| 11:00 AM to 11:59 AM | 0 (0.0%) | 366 (4.3%) |
| 12:00 PM to 3:59 PM | 675 (6.2%) | 697 (8.2%) |
| 4:00 PM to 11:59 PM | 700 (6.4%) | 732 (8.6%) |
| Total | 10,922 (100.0%) | 8,525 (100.0%) |
Housing Occupancy in Winter Garden
Occupancy by Ownership in Winter Garden
Of the total 14,786 dwellings in Winter Garden, owner-occupied units account for 10,393 (70.3%), while renter-occupied units make up 4,393 (29.7%).
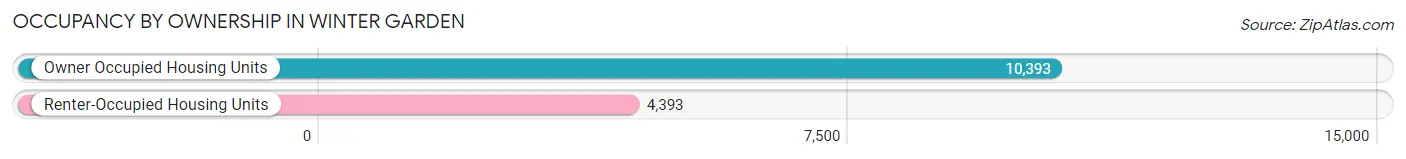
| Occupancy | # Housing Units | % Housing Units |
| Owner Occupied Housing Units | 10,393 | 70.3% |
| Renter-Occupied Housing Units | 4,393 | 29.7% |
| Total Occupied Housing Units | 14,786 | 100.0% |
Occupancy by Household Size in Winter Garden
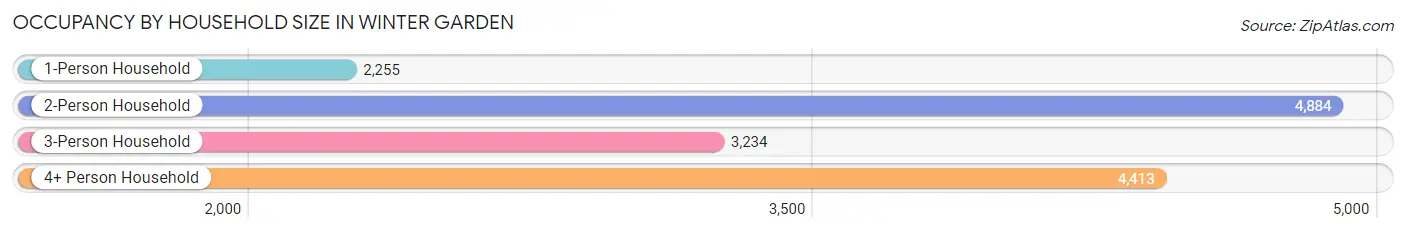
| Household Size | # Housing Units | % Housing Units |
| 1-Person Household | 2,255 | 15.2% |
| 2-Person Household | 4,884 | 33.0% |
| 3-Person Household | 3,234 | 21.9% |
| 4+ Person Household | 4,413 | 29.8% |
| Total Housing Units | 14,786 | 100.0% |
Occupancy by Ownership by Household Size in Winter Garden
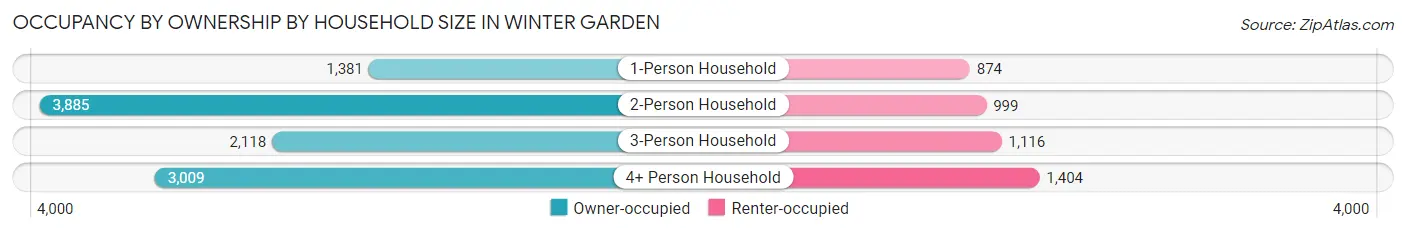
| Household Size | Owner-occupied | Renter-occupied |
| 1-Person Household | 1,381 (61.2%) | 874 (38.8%) |
| 2-Person Household | 3,885 (79.5%) | 999 (20.4%) |
| 3-Person Household | 2,118 (65.5%) | 1,116 (34.5%) |
| 4+ Person Household | 3,009 (68.2%) | 1,404 (31.8%) |
| Total Housing Units | 10,393 (70.3%) | 4,393 (29.7%) |
Occupancy by Educational Attainment in Winter Garden
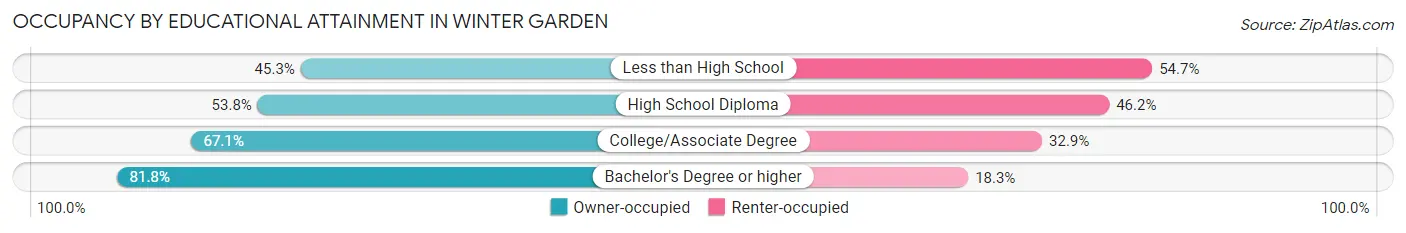
| Household Size | Owner-occupied | Renter-occupied |
| Less than High School | 565 (45.3%) | 683 (54.7%) |
| High School Diploma | 1,368 (53.8%) | 1,175 (46.2%) |
| College/Associate Degree | 2,419 (67.1%) | 1,186 (32.9%) |
| Bachelor's Degree or higher | 6,041 (81.8%) | 1,349 (18.2%) |
Occupancy by Age of Householder in Winter Garden
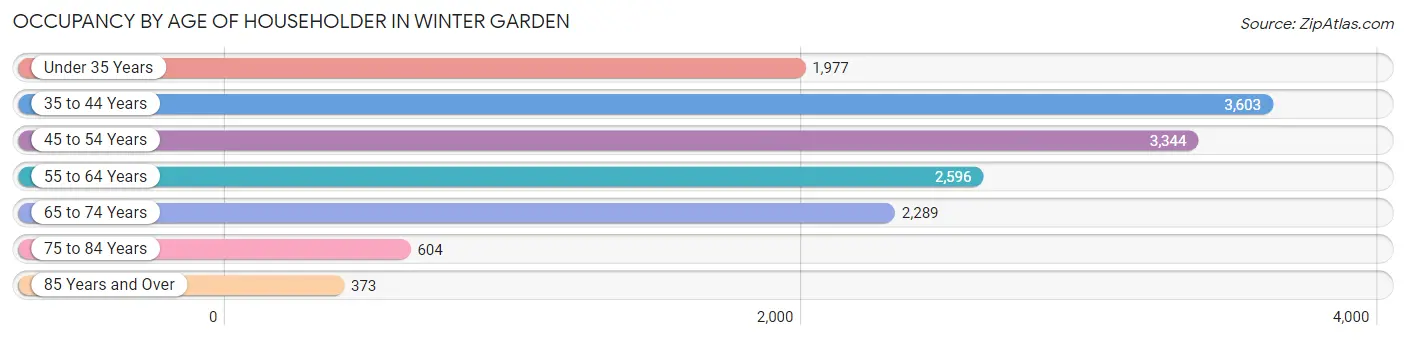
| Age Bracket | # Households | % Households |
| Under 35 Years | 1,977 | 13.4% |
| 35 to 44 Years | 3,603 | 24.4% |
| 45 to 54 Years | 3,344 | 22.6% |
| 55 to 64 Years | 2,596 | 17.6% |
| 65 to 74 Years | 2,289 | 15.5% |
| 75 to 84 Years | 604 | 4.1% |
| 85 Years and Over | 373 | 2.5% |
| Total | 14,786 | 100.0% |
Housing Finances in Winter Garden
Median Income by Occupancy in Winter Garden
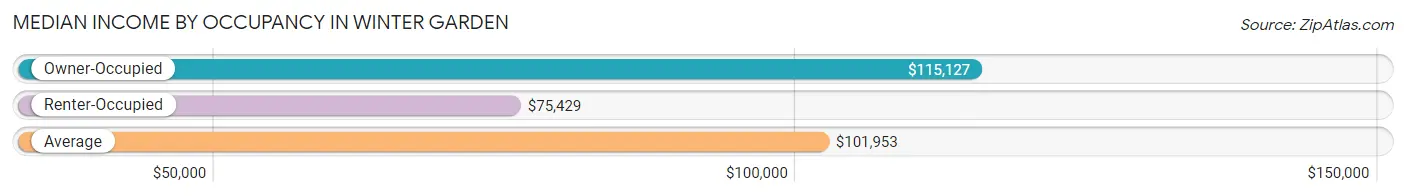
| Occupancy Type | # Households | Median Income |
| Owner-Occupied | 10,393 (70.3%) | $115,127 |
| Renter-Occupied | 4,393 (29.7%) | $75,429 |
| Average | 14,786 (100.0%) | $101,953 |
Occupancy by Householder Income Bracket in Winter Garden
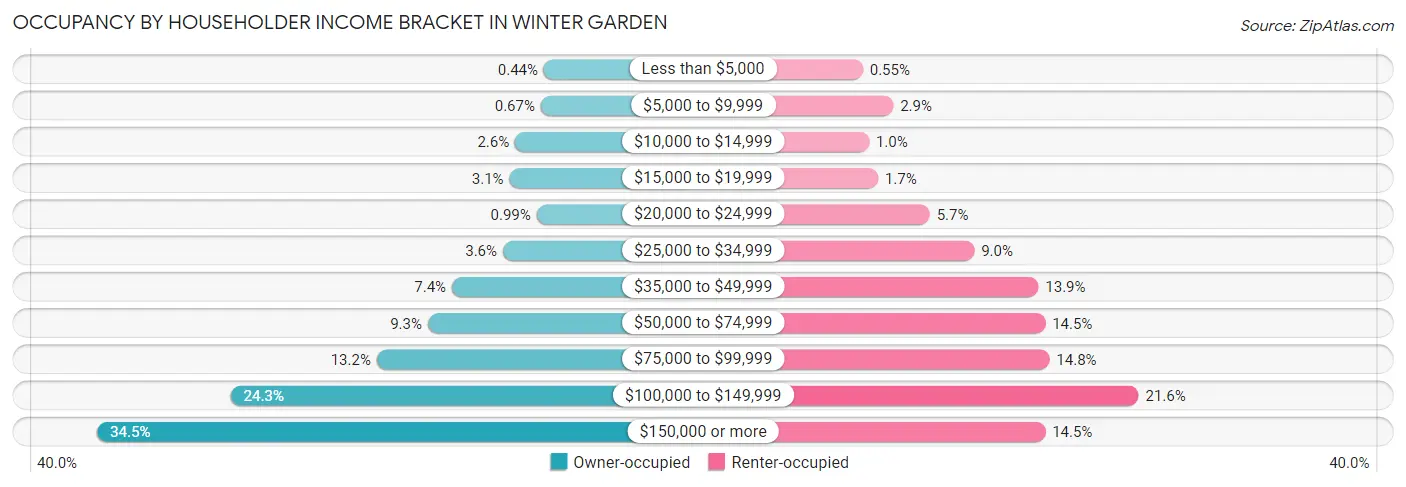
| Income Bracket | Owner-occupied | Renter-occupied |
| Less than $5,000 | 46 (0.4%) | 24 (0.5%) |
| $5,000 to $9,999 | 70 (0.7%) | 126 (2.9%) |
| $10,000 to $14,999 | 273 (2.6%) | 45 (1.0%) |
| $15,000 to $19,999 | 318 (3.1%) | 75 (1.7%) |
| $20,000 to $24,999 | 103 (1.0%) | 248 (5.7%) |
| $25,000 to $34,999 | 370 (3.6%) | 397 (9.0%) |
| $35,000 to $49,999 | 773 (7.4%) | 612 (13.9%) |
| $50,000 to $74,999 | 964 (9.3%) | 635 (14.4%) |
| $75,000 to $99,999 | 1,369 (13.2%) | 649 (14.8%) |
| $100,000 to $149,999 | 2,525 (24.3%) | 947 (21.6%) |
| $150,000 or more | 3,582 (34.5%) | 635 (14.4%) |
| Total | 10,393 (100.0%) | 4,393 (100.0%) |
Monthly Housing Cost Tiers in Winter Garden
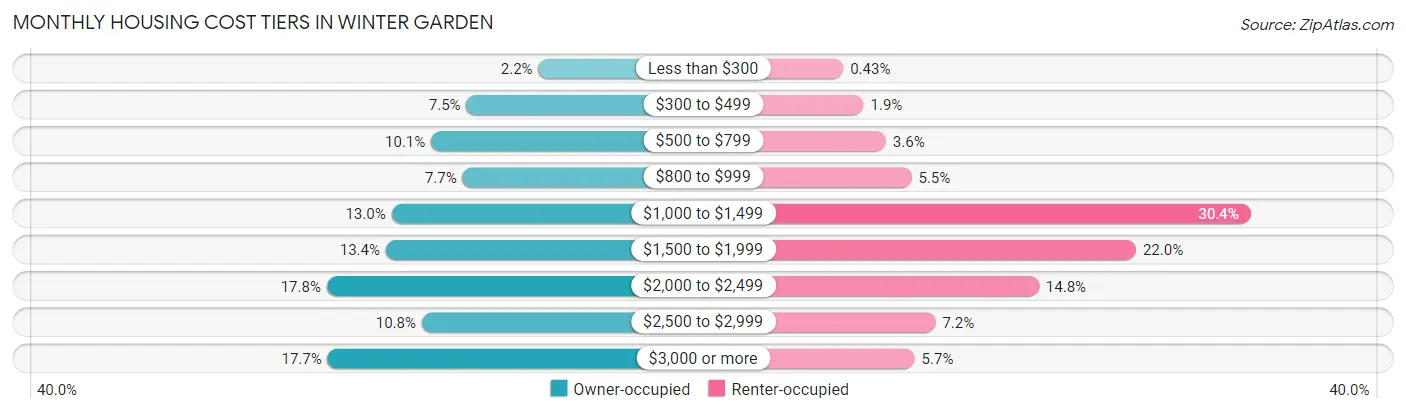
| Monthly Cost | Owner-occupied | Renter-occupied |
| Less than $300 | 225 (2.2%) | 19 (0.4%) |
| $300 to $499 | 775 (7.5%) | 85 (1.9%) |
| $500 to $799 | 1,046 (10.1%) | 157 (3.6%) |
| $800 to $999 | 804 (7.7%) | 240 (5.5%) |
| $1,000 to $1,499 | 1,349 (13.0%) | 1,337 (30.4%) |
| $1,500 to $1,999 | 1,393 (13.4%) | 966 (22.0%) |
| $2,000 to $2,499 | 1,845 (17.7%) | 652 (14.8%) |
| $2,500 to $2,999 | 1,117 (10.7%) | 317 (7.2%) |
| $3,000 or more | 1,839 (17.7%) | 250 (5.7%) |
| Total | 10,393 (100.0%) | 4,393 (100.0%) |
Physical Housing Characteristics in Winter Garden
Housing Structures in Winter Garden
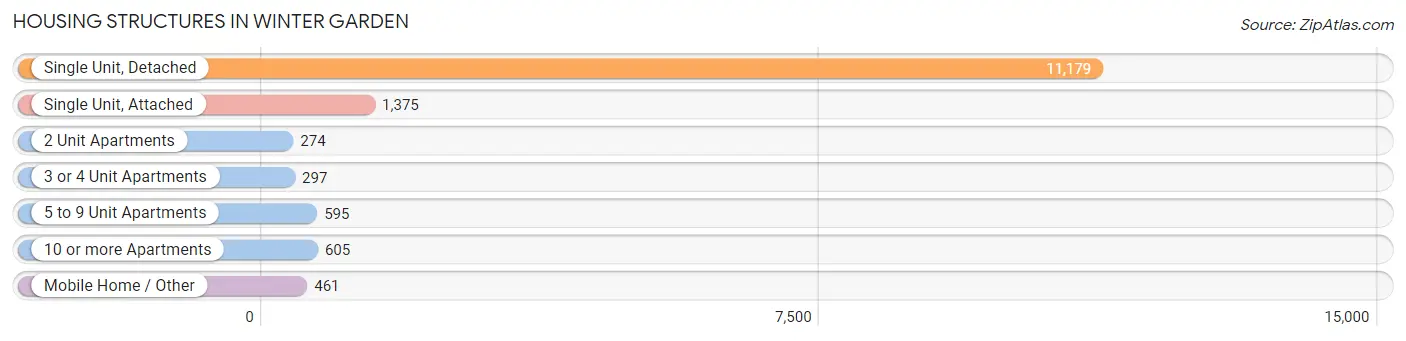
| Structure Type | # Housing Units | % Housing Units |
| Single Unit, Detached | 11,179 | 75.6% |
| Single Unit, Attached | 1,375 | 9.3% |
| 2 Unit Apartments | 274 | 1.8% |
| 3 or 4 Unit Apartments | 297 | 2.0% |
| 5 to 9 Unit Apartments | 595 | 4.0% |
| 10 or more Apartments | 605 | 4.1% |
| Mobile Home / Other | 461 | 3.1% |
| Total | 14,786 | 100.0% |
Housing Structures by Occupancy in Winter Garden
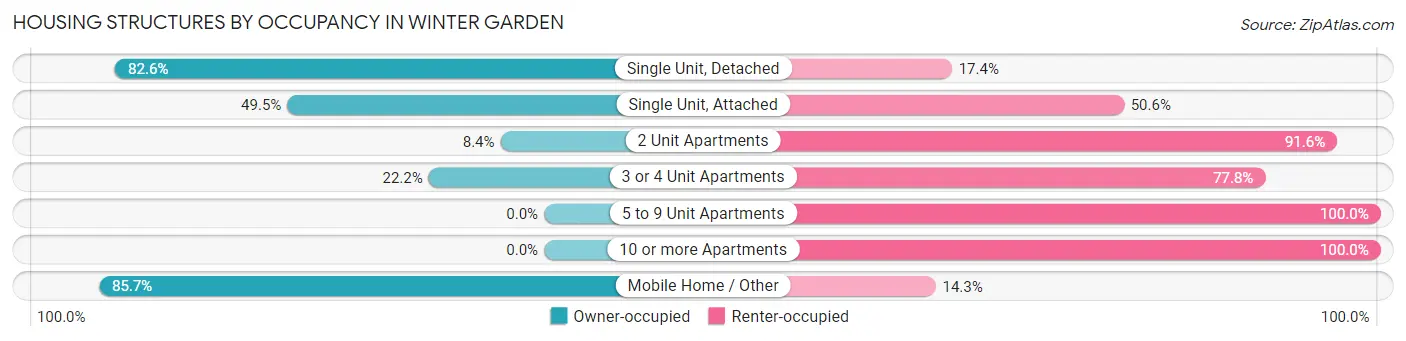
| Structure Type | Owner-occupied | Renter-occupied |
| Single Unit, Detached | 9,229 (82.6%) | 1,950 (17.4%) |
| Single Unit, Attached | 680 (49.4%) | 695 (50.5%) |
| 2 Unit Apartments | 23 (8.4%) | 251 (91.6%) |
| 3 or 4 Unit Apartments | 66 (22.2%) | 231 (77.8%) |
| 5 to 9 Unit Apartments | 0 (0.0%) | 595 (100.0%) |
| 10 or more Apartments | 0 (0.0%) | 605 (100.0%) |
| Mobile Home / Other | 395 (85.7%) | 66 (14.3%) |
| Total | 10,393 (70.3%) | 4,393 (29.7%) |
Housing Structures by Number of Rooms in Winter Garden
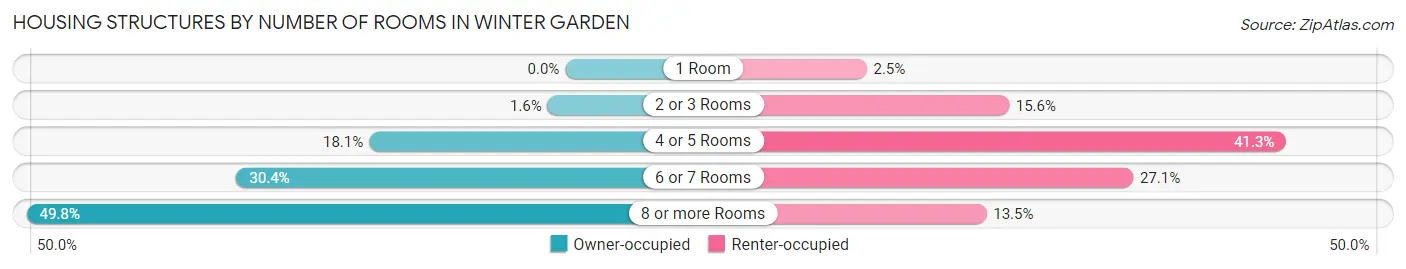
| Number of Rooms | Owner-occupied | Renter-occupied |
| 1 Room | 0 (0.0%) | 108 (2.5%) |
| 2 or 3 Rooms | 169 (1.6%) | 686 (15.6%) |
| 4 or 5 Rooms | 1,885 (18.1%) | 1,813 (41.3%) |
| 6 or 7 Rooms | 3,161 (30.4%) | 1,191 (27.1%) |
| 8 or more Rooms | 5,178 (49.8%) | 595 (13.5%) |
| Total | 10,393 (100.0%) | 4,393 (100.0%) |
Housing Structure by Heating Type in Winter Garden
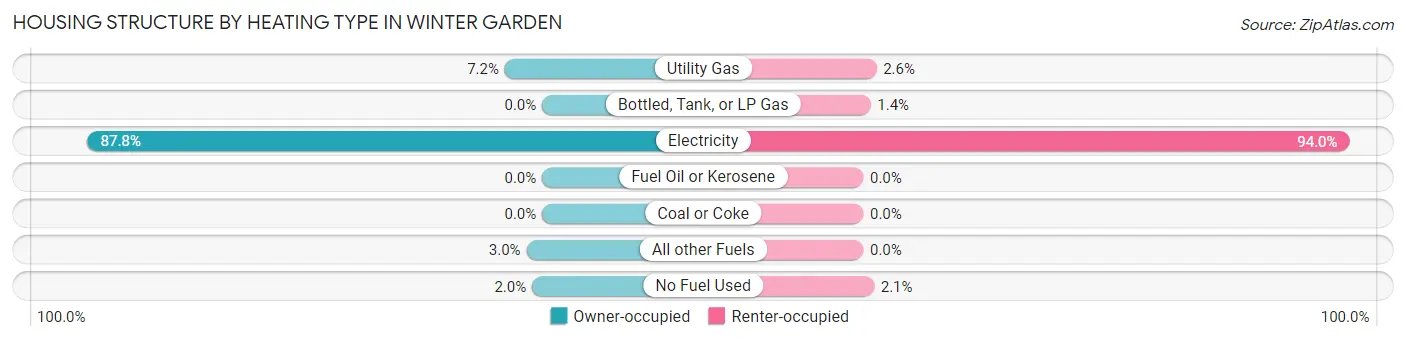
| Heating Type | Owner-occupied | Renter-occupied |
| Utility Gas | 749 (7.2%) | 112 (2.5%) |
| Bottled, Tank, or LP Gas | 0 (0.0%) | 62 (1.4%) |
| Electricity | 9,127 (87.8%) | 4,128 (94.0%) |
| Fuel Oil or Kerosene | 0 (0.0%) | 0 (0.0%) |
| Coal or Coke | 0 (0.0%) | 0 (0.0%) |
| All other Fuels | 314 (3.0%) | 0 (0.0%) |
| No Fuel Used | 203 (1.9%) | 91 (2.1%) |
| Total | 10,393 (100.0%) | 4,393 (100.0%) |
Household Vehicle Usage in Winter Garden
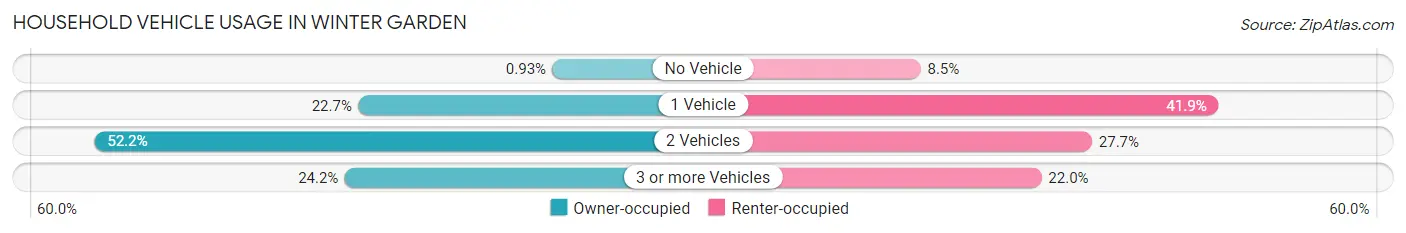
| Vehicles per Household | Owner-occupied | Renter-occupied |
| No Vehicle | 97 (0.9%) | 372 (8.5%) |
| 1 Vehicle | 2,357 (22.7%) | 1,839 (41.9%) |
| 2 Vehicles | 5,424 (52.2%) | 1,215 (27.7%) |
| 3 or more Vehicles | 2,515 (24.2%) | 967 (22.0%) |
| Total | 10,393 (100.0%) | 4,393 (100.0%) |
Real Estate & Mortgages in Winter Garden
Real Estate and Mortgage Overview in Winter Garden
| Characteristic | Without Mortgage | With Mortgage |
| Housing Units | 3,120 | 7,273 |
| Median Property Value | $339,200 | $445,200 |
| Median Household Income | $76,848 | $2,922 |
| Monthly Housing Costs | $646 | $1,831 |
| Real Estate Taxes | $2,772 | $67 |
Property Value by Mortgage Status in Winter Garden
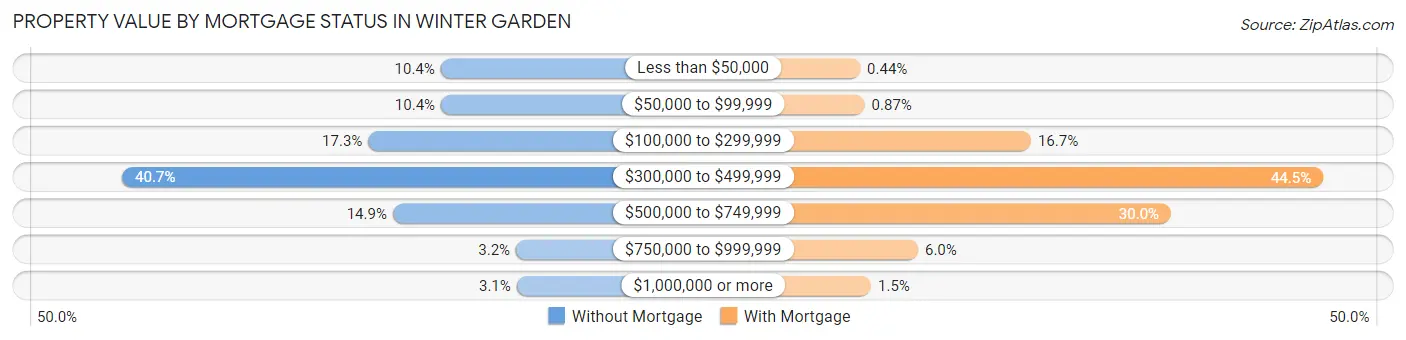
| Property Value | Without Mortgage | With Mortgage |
| Less than $50,000 | 324 (10.4%) | 32 (0.4%) |
| $50,000 to $99,999 | 323 (10.3%) | 63 (0.9%) |
| $100,000 to $299,999 | 539 (17.3%) | 1,215 (16.7%) |
| $300,000 to $499,999 | 1,270 (40.7%) | 3,238 (44.5%) |
| $500,000 to $749,999 | 466 (14.9%) | 2,184 (30.0%) |
| $750,000 to $999,999 | 100 (3.2%) | 433 (5.9%) |
| $1,000,000 or more | 98 (3.1%) | 108 (1.5%) |
| Total | 3,120 (100.0%) | 7,273 (100.0%) |
Household Income by Mortgage Status in Winter Garden
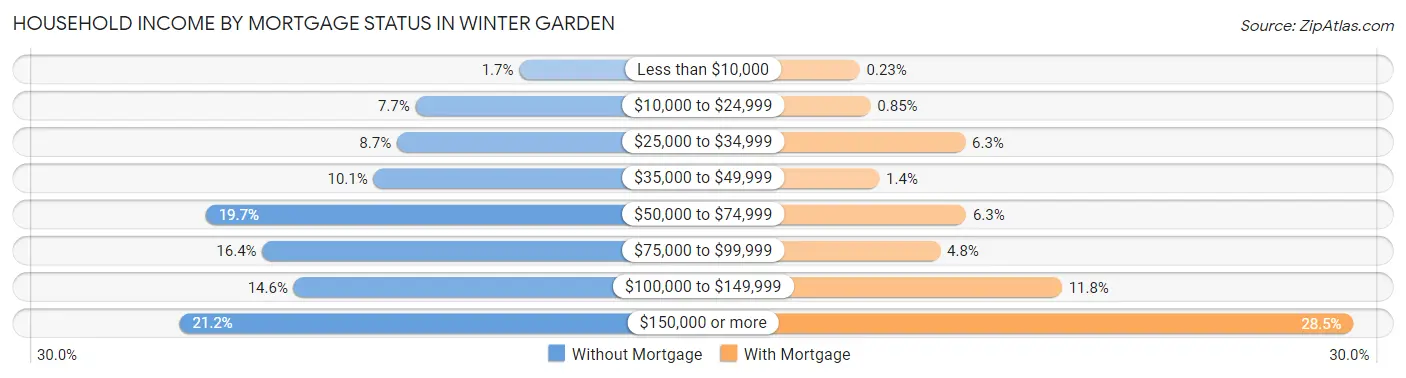
| Household Income | Without Mortgage | With Mortgage |
| Less than $10,000 | 54 (1.7%) | 17 (0.2%) |
| $10,000 to $24,999 | 239 (7.7%) | 62 (0.9%) |
| $25,000 to $34,999 | 272 (8.7%) | 455 (6.3%) |
| $35,000 to $49,999 | 314 (10.1%) | 98 (1.3%) |
| $50,000 to $74,999 | 613 (19.7%) | 459 (6.3%) |
| $75,000 to $99,999 | 512 (16.4%) | 351 (4.8%) |
| $100,000 to $149,999 | 456 (14.6%) | 857 (11.8%) |
| $150,000 or more | 660 (21.1%) | 2,069 (28.4%) |
| Total | 3,120 (100.0%) | 7,273 (100.0%) |
Property Value to Household Income Ratio in Winter Garden
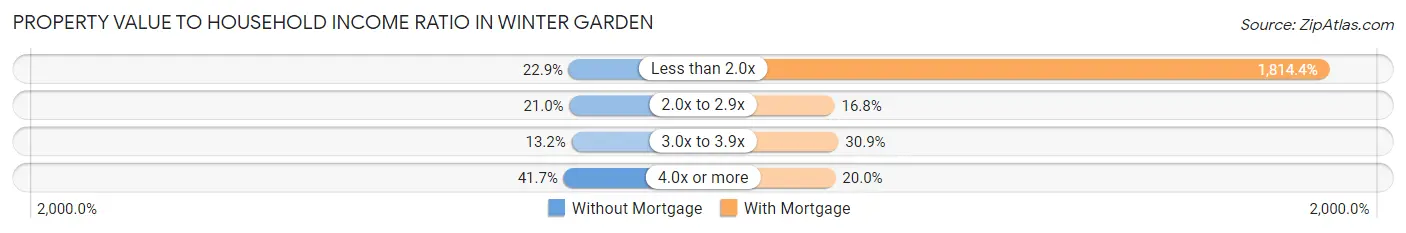
| Value-to-Income Ratio | Without Mortgage | With Mortgage |
| Less than 2.0x | 713 (22.9%) | 131,960 (1,814.4%) |
| 2.0x to 2.9x | 656 (21.0%) | 1,218 (16.8%) |
| 3.0x to 3.9x | 413 (13.2%) | 2,246 (30.9%) |
| 4.0x or more | 1,302 (41.7%) | 1,453 (20.0%) |
| Total | 3,120 (100.0%) | 7,273 (100.0%) |
Real Estate Taxes by Mortgage Status in Winter Garden
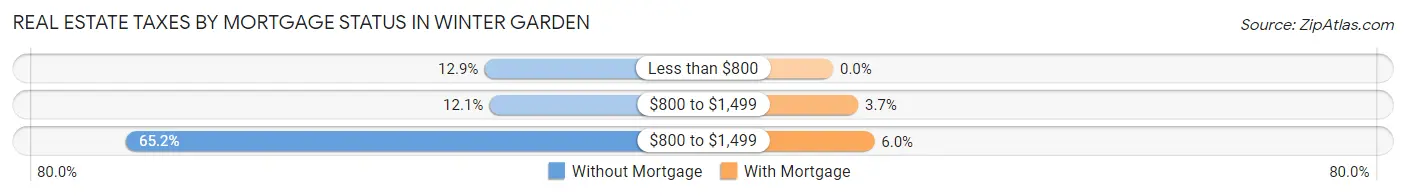
| Property Taxes | Without Mortgage | With Mortgage |
| Less than $800 | 401 (12.9%) | 0 (0.0%) |
| $800 to $1,499 | 378 (12.1%) | 266 (3.7%) |
| $800 to $1,499 | 2,033 (65.2%) | 439 (6.0%) |
| Total | 3,120 (100.0%) | 7,273 (100.0%) |
Health & Disability in Winter Garden
Health Insurance Coverage by Age in Winter Garden
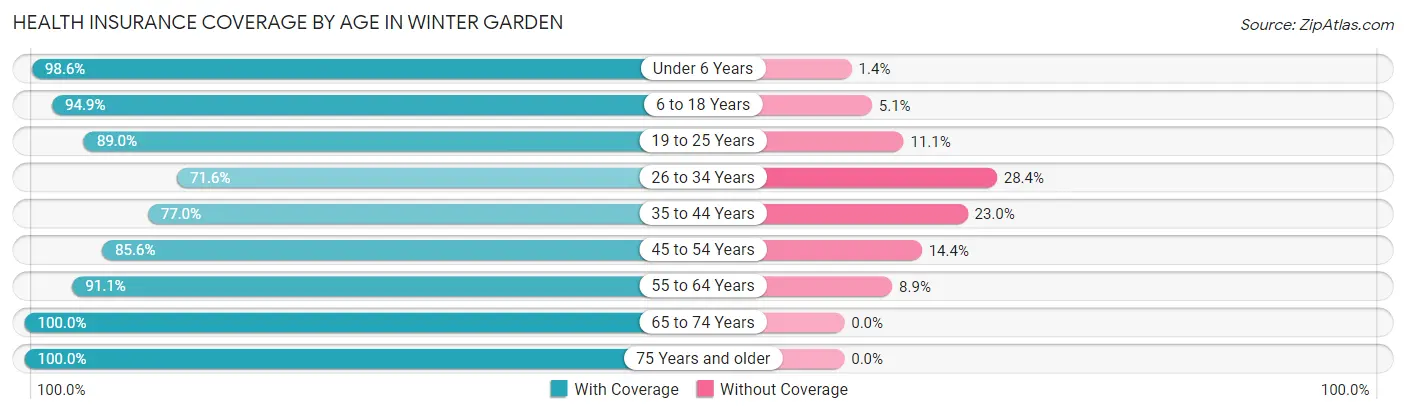
| Age Bracket | With Coverage | Without Coverage |
| Under 6 Years | 3,894 (98.6%) | 54 (1.4%) |
| 6 to 18 Years | 8,161 (94.9%) | 442 (5.1%) |
| 19 to 25 Years | 2,826 (88.9%) | 351 (11.1%) |
| 26 to 34 Years | 3,381 (71.6%) | 1,344 (28.4%) |
| 35 to 44 Years | 6,052 (77.0%) | 1,806 (23.0%) |
| 45 to 54 Years | 5,892 (85.6%) | 994 (14.4%) |
| 55 to 64 Years | 4,318 (91.1%) | 423 (8.9%) |
| 65 to 74 Years | 4,165 (100.0%) | 0 (0.0%) |
| 75 Years and older | 1,756 (100.0%) | 0 (0.0%) |
| Total | 40,445 (88.2%) | 5,414 (11.8%) |
Health Insurance Coverage by Citizenship Status in Winter Garden
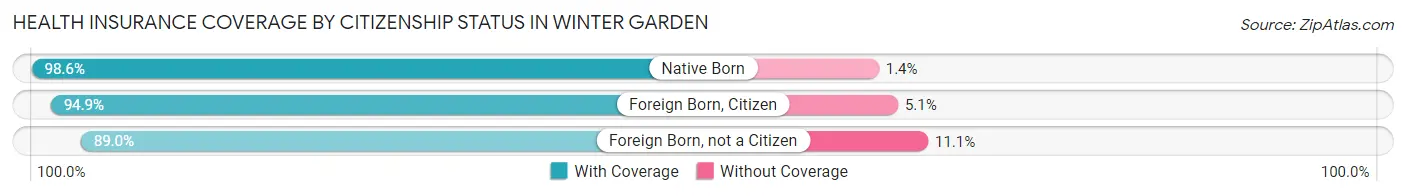
| Citizenship Status | With Coverage | Without Coverage |
| Native Born | 3,894 (98.6%) | 54 (1.4%) |
| Foreign Born, Citizen | 8,161 (94.9%) | 442 (5.1%) |
| Foreign Born, not a Citizen | 2,826 (88.9%) | 351 (11.1%) |
Health Insurance Coverage by Household Income in Winter Garden
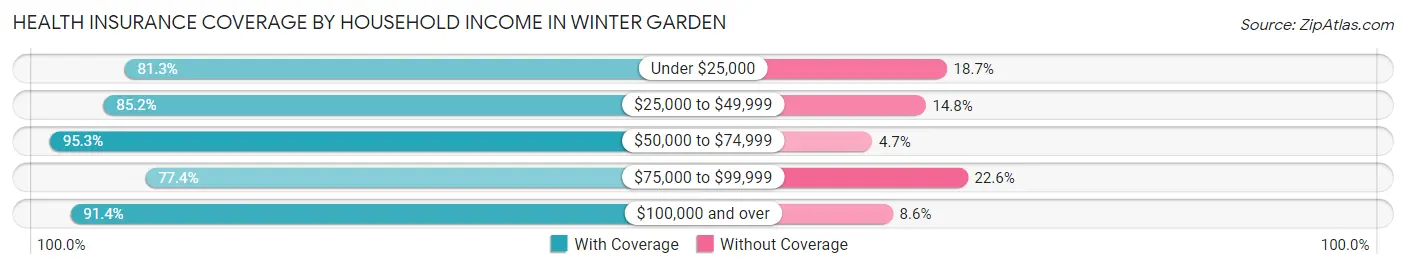
| Household Income | With Coverage | Without Coverage |
| Under $25,000 | 2,845 (81.3%) | 655 (18.7%) |
| $25,000 to $49,999 | 3,986 (85.2%) | 690 (14.8%) |
| $50,000 to $74,999 | 4,165 (95.3%) | 207 (4.7%) |
| $75,000 to $99,999 | 5,510 (77.4%) | 1,610 (22.6%) |
| $100,000 and over | 23,927 (91.4%) | 2,248 (8.6%) |
Public vs Private Health Insurance Coverage by Age in Winter Garden
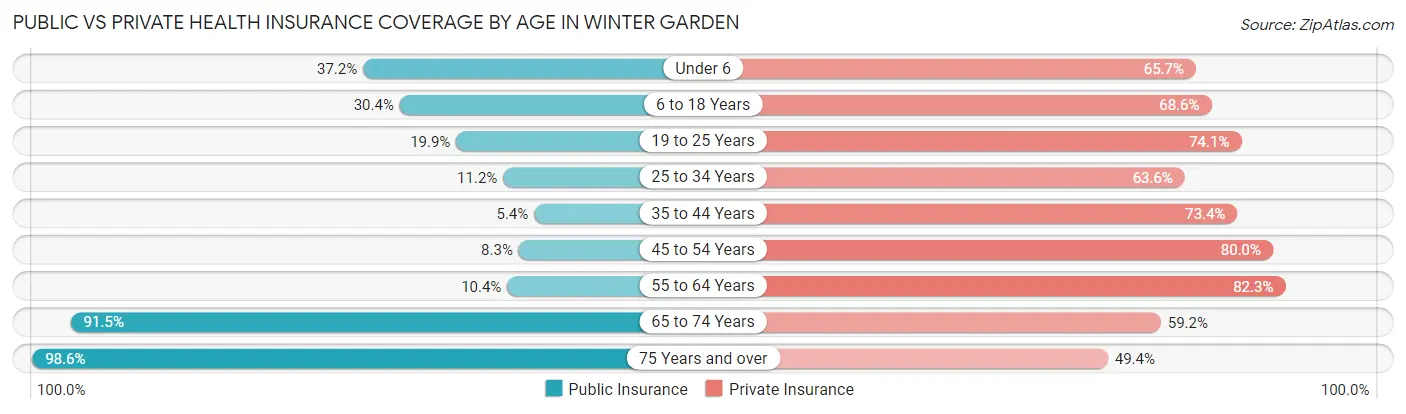
| Age Bracket | Public Insurance | Private Insurance |
| Under 6 | 1,468 (37.2%) | 2,594 (65.7%) |
| 6 to 18 Years | 2,613 (30.4%) | 5,900 (68.6%) |
| 19 to 25 Years | 632 (19.9%) | 2,355 (74.1%) |
| 25 to 34 Years | 528 (11.2%) | 3,007 (63.6%) |
| 35 to 44 Years | 427 (5.4%) | 5,769 (73.4%) |
| 45 to 54 Years | 570 (8.3%) | 5,509 (80.0%) |
| 55 to 64 Years | 494 (10.4%) | 3,902 (82.3%) |
| 65 to 74 Years | 3,810 (91.5%) | 2,466 (59.2%) |
| 75 Years and over | 1,731 (98.6%) | 867 (49.4%) |
| Total | 12,273 (26.8%) | 32,369 (70.6%) |
Disability Status by Sex by Age in Winter Garden
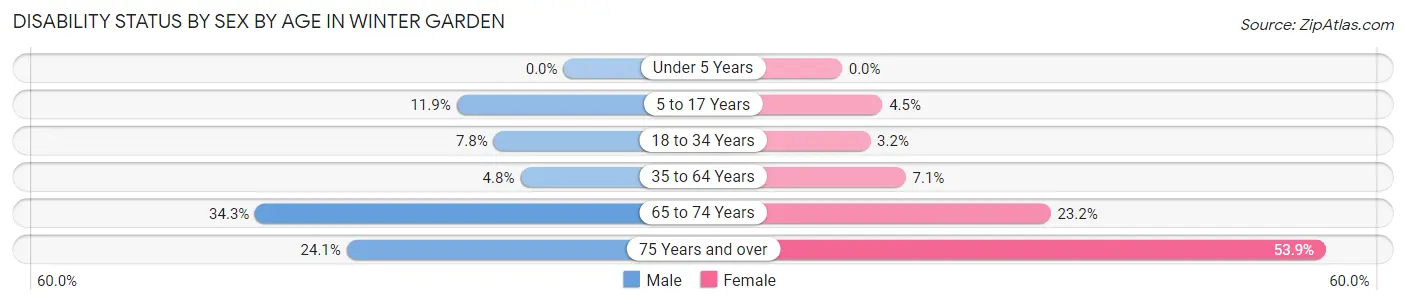
| Age Bracket | Male | Female |
| Under 5 Years | 0 (0.0%) | 0 (0.0%) |
| 5 to 17 Years | 569 (11.9%) | 208 (4.5%) |
| 18 to 34 Years | 336 (7.8%) | 130 (3.2%) |
| 35 to 64 Years | 461 (4.8%) | 703 (7.1%) |
| 65 to 74 Years | 663 (34.3%) | 519 (23.2%) |
| 75 Years and over | 183 (24.1%) | 538 (53.9%) |
Disability Class by Sex by Age in Winter Garden
Disability Class: Hearing Difficulty
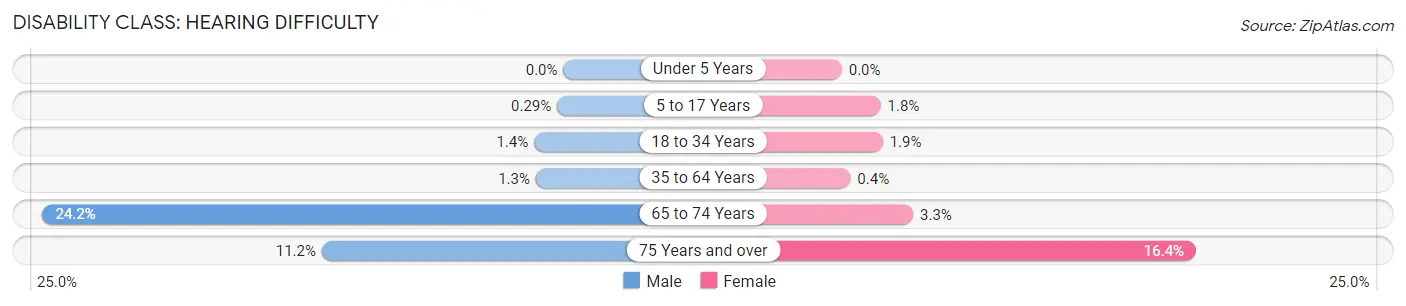
| Age Bracket | Male | Female |
| Under 5 Years | 0 (0.0%) | 0 (0.0%) |
| 5 to 17 Years | 14 (0.3%) | 83 (1.8%) |
| 18 to 34 Years | 59 (1.4%) | 78 (1.9%) |
| 35 to 64 Years | 123 (1.3%) | 40 (0.4%) |
| 65 to 74 Years | 467 (24.2%) | 74 (3.3%) |
| 75 Years and over | 85 (11.2%) | 164 (16.4%) |
Disability Class: Vision Difficulty
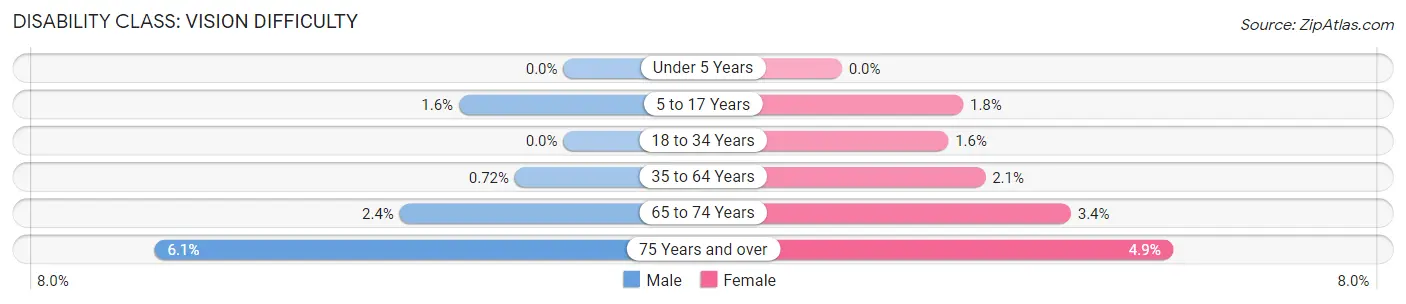
| Age Bracket | Male | Female |
| Under 5 Years | 0 (0.0%) | 0 (0.0%) |
| 5 to 17 Years | 74 (1.5%) | 83 (1.8%) |
| 18 to 34 Years | 0 (0.0%) | 65 (1.6%) |
| 35 to 64 Years | 69 (0.7%) | 211 (2.1%) |
| 65 to 74 Years | 47 (2.4%) | 76 (3.4%) |
| 75 Years and over | 46 (6.1%) | 49 (4.9%) |
Disability Class: Cognitive Difficulty
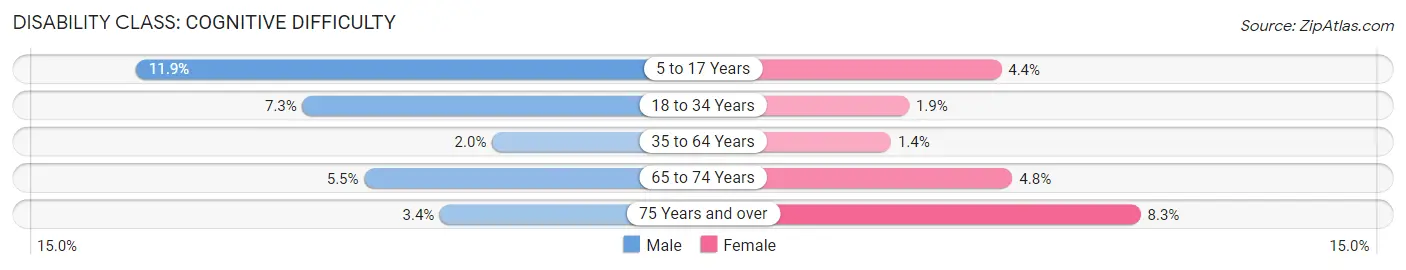
| Age Bracket | Male | Female |
| 5 to 17 Years | 569 (11.9%) | 205 (4.4%) |
| 18 to 34 Years | 314 (7.3%) | 77 (1.9%) |
| 35 to 64 Years | 190 (2.0%) | 135 (1.4%) |
| 65 to 74 Years | 107 (5.5%) | 106 (4.8%) |
| 75 Years and over | 26 (3.4%) | 83 (8.3%) |
Disability Class: Ambulatory Difficulty
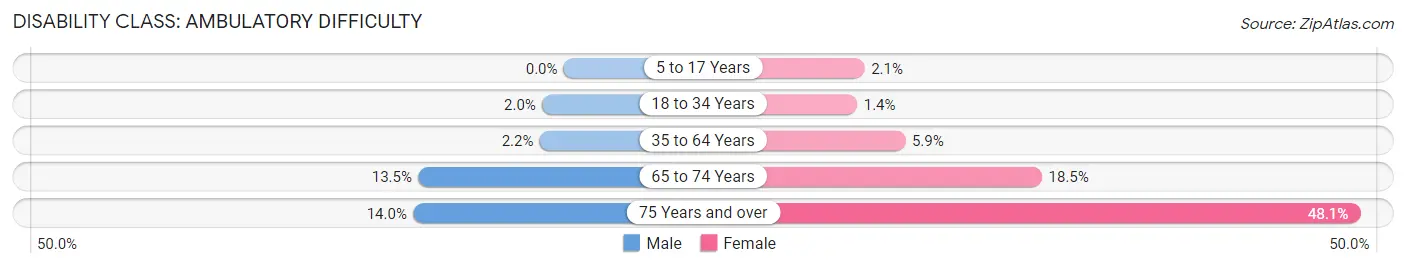
| Age Bracket | Male | Female |
| 5 to 17 Years | 0 (0.0%) | 96 (2.1%) |
| 18 to 34 Years | 87 (2.0%) | 57 (1.4%) |
| 35 to 64 Years | 214 (2.2%) | 580 (5.9%) |
| 65 to 74 Years | 261 (13.5%) | 414 (18.5%) |
| 75 Years and over | 106 (14.0%) | 480 (48.1%) |
Disability Class: Self-Care Difficulty
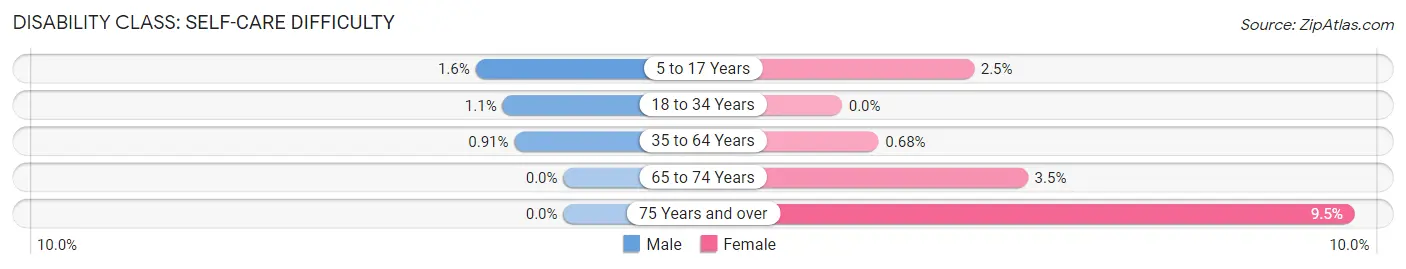
| Age Bracket | Male | Female |
| 5 to 17 Years | 78 (1.6%) | 113 (2.5%) |
| 18 to 34 Years | 49 (1.1%) | 0 (0.0%) |
| 35 to 64 Years | 87 (0.9%) | 67 (0.7%) |
| 65 to 74 Years | 0 (0.0%) | 77 (3.5%) |
| 75 Years and over | 0 (0.0%) | 95 (9.5%) |
Technology Access in Winter Garden
Computing Device Access in Winter Garden
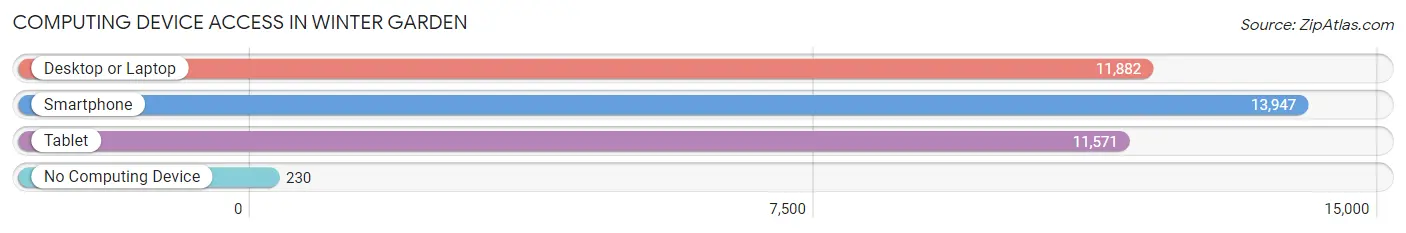
| Device Type | # Households | % Households |
| Desktop or Laptop | 11,882 | 80.4% |
| Smartphone | 13,947 | 94.3% |
| Tablet | 11,571 | 78.3% |
| No Computing Device | 230 | 1.6% |
| Total | 14,786 | 100.0% |
Internet Access in Winter Garden
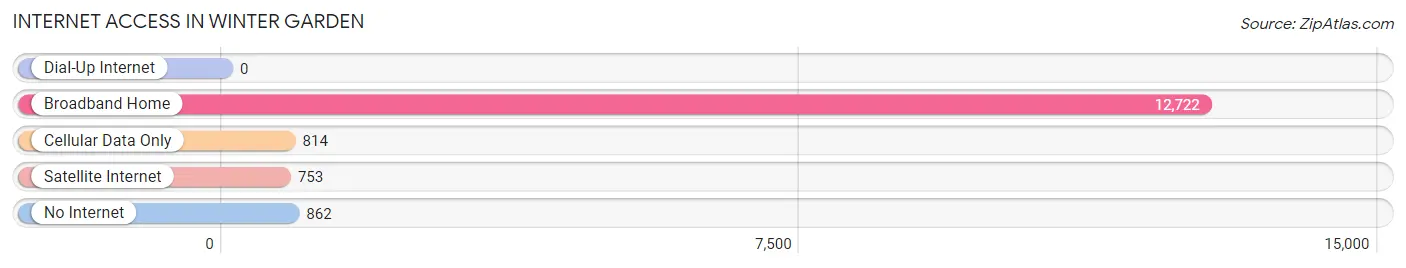
| Internet Type | # Households | % Households |
| Dial-Up Internet | 0 | 0.0% |
| Broadband Home | 12,722 | 86.0% |
| Cellular Data Only | 814 | 5.5% |
| Satellite Internet | 753 | 5.1% |
| No Internet | 862 | 5.8% |
| Total | 14,786 | 100.0% |
Winter Garden Summary
History
The city of Winter Garden, Florida is located in Orange County, just west of Orlando. It is a small city with a population of just over 30,000 people. The city was founded in 1856 by a group of settlers from the North who were looking for a place to settle and start a new life. The city was originally called “Lakeview” but was later changed to “Winter Garden” in 1881. The name was chosen to reflect the mild climate of the area and the abundance of citrus trees in the area.
The city of Winter Garden has a rich history that dates back to the early 1800s. The area was originally inhabited by the Timucua Indians, who were the first inhabitants of the area. The first settlers to the area were a group of pioneers from the North who were looking for a place to settle and start a new life. The settlers built a small settlement near Lake Apopka and named it “Lakeview”. The settlement grew slowly but steadily and by 1881, the population had grown to over 500 people.
In 1883, the city was officially incorporated and the name was changed to “Winter Garden”. The city was named after the abundance of citrus trees in the area, which provided a mild climate and a great place to grow citrus fruits. The city quickly became a popular destination for tourists and the economy began to grow.
In the early 1900s, the city began to expand and the population grew to over 2,000 people. The city was home to several businesses, including a hotel, a bank, a post office, and a railroad station. The city also had a thriving citrus industry, which provided jobs for many of the residents.
In the 1920s, the city experienced a period of growth and prosperity. The population grew to over 5,000 people and the economy continued to thrive. The city was home to several businesses, including a movie theater, a department store, and a library. The city also had a thriving citrus industry, which provided jobs for many of the residents.
In the 1950s, the city experienced a period of decline as the citrus industry began to decline. The population began to decline as well, and by the 1970s, the population had dropped to just over 2,000 people. The city was struggling economically and many of the businesses had closed.
In the 1980s, the city began to experience a period of revitalization. The population began to grow again and the economy began to improve. The city was home to several businesses, including a movie theater, a department store, and a library. The city also had a thriving citrus industry, which provided jobs for many of the residents.
Today, the city of Winter Garden is a thriving community with a population of over 30,000 people. The city is home to several businesses, including a movie theater, a department store, and a library. The city also has a thriving citrus industry, which provides jobs for many of the residents.
Geography
Winter Garden is located in Orange County, Florida, just west of Orlando. The city is situated on the west side of Lake Apopka, which is the largest lake in the county. The city is bordered by the cities of Ocoee, Windermere, and Oakland. The city is also located near the Orange County Convention Center and the Orlando International Airport.
The city of Winter Garden has a total area of 8.3 square miles, of which 8.2 square miles is land and 0.1 square miles is water. The city is located at an elevation of approximately 100 feet above sea level. The city is located in a humid subtropical climate zone, which means that the summers are hot and humid and the winters are mild.
Economy
The economy of Winter Garden is largely based on tourism and agriculture. The city is home to several businesses, including a movie theater, a department store, and a library. The city also has a thriving citrus industry, which provides jobs for many of the residents.
The city is also home to several large employers, including the Orange County Public Schools, the Orange County Convention Center, and the Orlando International Airport. The city is also home to several major retail stores, including Walmart, Target, and Best Buy.
Demographics
As of the 2010 census, the population of Winter Garden was 30,396. The population is made up of a diverse mix of people from different backgrounds and cultures. The racial makeup of the city is 73.3% White, 15.2% African American, 0.4% Native American, 2.2% Asian, 0.1% Pacific Islander, 5.7% from other races, and 3.1% from two or more races.
The median household income in the city is $50,945 and the median family income is $60,945. The per capita income in the city is $25,945. The city has a poverty rate of 11.3%. The city has a high school graduation rate of 87.3%.
Conclusion
Winter Garden, Florida is a small city located in Orange County, just west of Orlando. The city has a rich history that dates back to the early 1800s and has a population of over 30,000 people. The city is home to several businesses, including a movie theater, a department store, and a library. The city also has a thriving citrus industry, which provides jobs for many of the residents. The economy of the city is largely based on tourism and agriculture and the city has a diverse population with a median household income of $50,945.
Common Questions
What is Per Capita Income in Winter Garden?
Per Capita income in Winter Garden is $40,685.
What is the Median Family Income in Winter Garden?
Median Family Income in Winter Garden is $114,644.
What is the Median Household income in Winter Garden?
Median Household Income in Winter Garden is $101,953.
What is Income or Wage Gap in Winter Garden?
Income or Wage Gap in Winter Garden is 29.3%.
Women in Winter Garden earn 70.7 cents for every dollar earned by a man.
What is Inequality or Gini Index in Winter Garden?
Inequality or Gini Index in Winter Garden is 0.40.
What is the Total Population of Winter Garden?
Total Population of Winter Garden is 46,518.
What is the Total Male Population of Winter Garden?
Total Male Population of Winter Garden is 22,862.
What is the Total Female Population of Winter Garden?
Total Female Population of Winter Garden is 23,656.
What is the Ratio of Males per 100 Females in Winter Garden?
There are 96.64 Males per 100 Females in Winter Garden.
What is the Ratio of Females per 100 Males in Winter Garden?
There are 103.47 Females per 100 Males in Winter Garden.
What is the Median Population Age in Winter Garden?
Median Population Age in Winter Garden is 39.4 Years.
What is the Average Family Size in Winter Garden
Average Family Size in Winter Garden is 3.4 People.
What is the Average Household Size in Winter Garden
Average Household Size in Winter Garden is 3.1 People.
How Large is the Labor Force in Winter Garden?
There are 24,720 People in the Labor Forcein in Winter Garden.
What is the Percentage of People in the Labor Force in Winter Garden?
69.2% of People are in the Labor Force in Winter Garden.
What is the Unemployment Rate in Winter Garden?
Unemployment Rate in Winter Garden is 6.9%.