Aspen Hill, MD Map & Demographics
Aspen Hill Map
Aspen Hill Overview
$44,296
PER CAPITA INCOME
$127,830
AVG FAMILY INCOME
$104,582
AVG HOUSEHOLD INCOME
21.0%
WAGE / INCOME GAP [ % ]
79.0¢/ $1
WAGE / INCOME GAP [ $ ]
$11,943
FAMILY INCOME DEFICIT
0.43
INEQUALITY / GINI INDEX
54,262
TOTAL POPULATION
26,722
MALE POPULATION
27,540
FEMALE POPULATION
97.03
MALES / 100 FEMALES
103.06
FEMALES / 100 MALES
36.8
MEDIAN AGE
3.5
AVG FAMILY SIZE
3.1
AVG HOUSEHOLD SIZE
31,002
LABOR FORCE [ PEOPLE ]
73.0%
PERCENT IN LABOR FORCE
6.6%
UNEMPLOYMENT RATE
Income in Aspen Hill
Income Overview in Aspen Hill
Per Capita Income in Aspen Hill is $44,296, while median incomes of families and households are $127,830 and $104,582 respectively.
| Characteristic | Number | Measure |
| Per Capita Income | 54,262 | $44,296 |
| Median Family Income | 12,729 | $127,830 |
| Mean Family Income | 12,729 | $149,978 |
| Median Household Income | 17,369 | $104,582 |
| Mean Household Income | 17,369 | $135,700 |
| Income Deficit | 12,729 | $11,943 |
| Wage / Income Gap (%) | 54,262 | 20.97% |
| Wage / Income Gap ($) | 54,262 | 79.03¢ per $1 |
| Gini / Inequality Index | 54,262 | 0.43 |
Earnings by Sex in Aspen Hill
Average Earnings in Aspen Hill are $46,541, $50,938 for men and $40,257 for women, a difference of 21.0%.
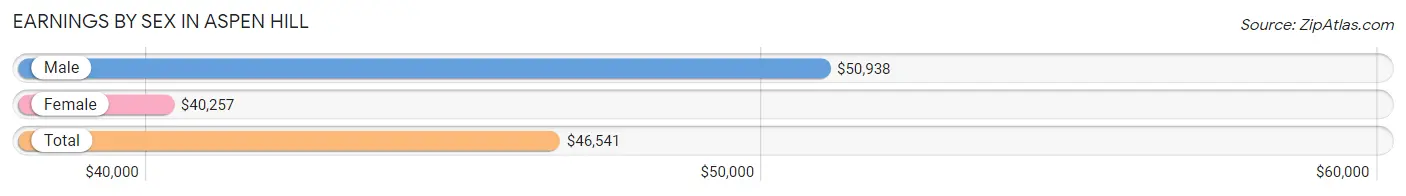
| Sex | Number | Average Earnings |
| Male | 16,063 (51.8%) | $50,938 |
| Female | 14,937 (48.2%) | $40,257 |
| Total | 31,000 (100.0%) | $46,541 |
Earnings by Sex by Income Bracket in Aspen Hill
The most common earnings brackets in Aspen Hill are $100,000+ for men (3,559 | 22.2%) and $100,000+ for women (2,671 | 17.9%).
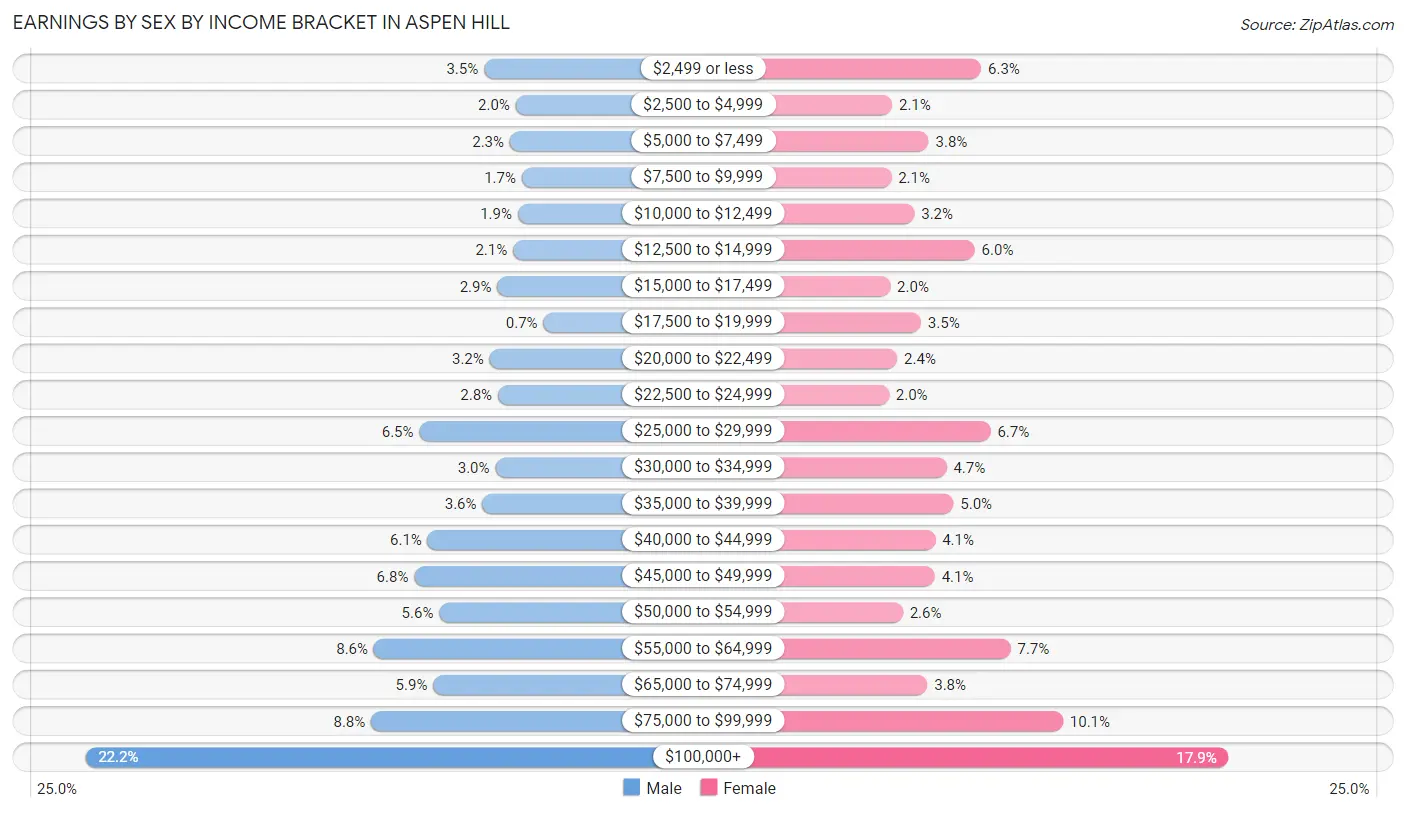
| Income | Male | Female |
| $2,499 or less | 559 (3.5%) | 939 (6.3%) |
| $2,500 to $4,999 | 322 (2.0%) | 316 (2.1%) |
| $5,000 to $7,499 | 365 (2.3%) | 572 (3.8%) |
| $7,500 to $9,999 | 275 (1.7%) | 310 (2.1%) |
| $10,000 to $12,499 | 305 (1.9%) | 472 (3.2%) |
| $12,500 to $14,999 | 340 (2.1%) | 895 (6.0%) |
| $15,000 to $17,499 | 460 (2.9%) | 303 (2.0%) |
| $17,500 to $19,999 | 113 (0.7%) | 518 (3.5%) |
| $20,000 to $22,499 | 517 (3.2%) | 353 (2.4%) |
| $22,500 to $24,999 | 454 (2.8%) | 294 (2.0%) |
| $25,000 to $29,999 | 1,045 (6.5%) | 1,005 (6.7%) |
| $30,000 to $34,999 | 474 (2.9%) | 697 (4.7%) |
| $35,000 to $39,999 | 572 (3.6%) | 746 (5.0%) |
| $40,000 to $44,999 | 983 (6.1%) | 619 (4.1%) |
| $45,000 to $49,999 | 1,085 (6.8%) | 615 (4.1%) |
| $50,000 to $54,999 | 896 (5.6%) | 391 (2.6%) |
| $55,000 to $64,999 | 1,388 (8.6%) | 1,146 (7.7%) |
| $65,000 to $74,999 | 942 (5.9%) | 563 (3.8%) |
| $75,000 to $99,999 | 1,409 (8.8%) | 1,512 (10.1%) |
| $100,000+ | 3,559 (22.2%) | 2,671 (17.9%) |
| Total | 16,063 (100.0%) | 14,937 (100.0%) |
Earnings by Sex by Educational Attainment in Aspen Hill
Average earnings in Aspen Hill are $58,014 for men and $47,581 for women, a difference of 18.0%. Men with an educational attainment of graduate degree enjoy the highest average annual earnings of $121,852, while those with less than high school education earn the least with $41,161. Women with an educational attainment of graduate degree earn the most with the average annual earnings of $93,823, while those with less than high school education have the smallest earnings of $19,517.
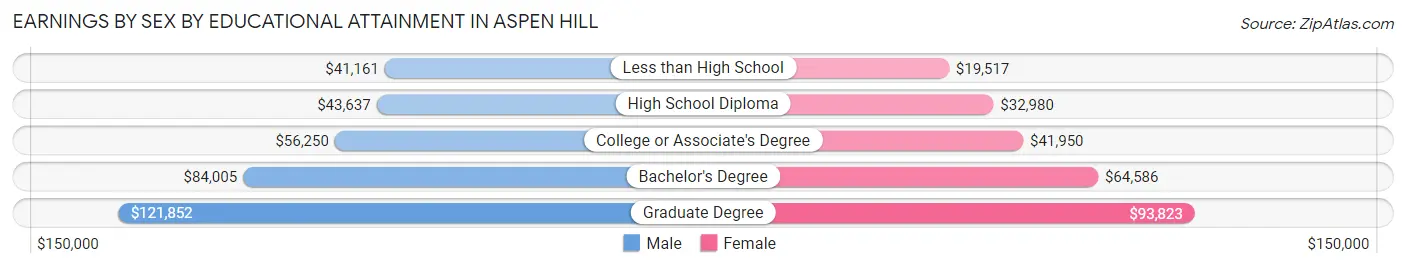
| Educational Attainment | Male Income | Female Income |
| Less than High School | $41,161 | $19,517 |
| High School Diploma | $43,637 | $32,980 |
| College or Associate's Degree | $56,250 | $41,950 |
| Bachelor's Degree | $84,005 | $64,586 |
| Graduate Degree | $121,852 | $93,823 |
| Total | $58,014 | $47,581 |
Family Income in Aspen Hill
Family Income Brackets in Aspen Hill
According to the Aspen Hill family income data, there are 3,170 families falling into the $200,000+ income range, which is the most common income bracket and makes up 24.9% of all families. Conversely, the $15,000 to $24,999 income bracket is the least frequent group with only 191 families (1.5%) belonging to this category.
| Income Bracket | # Families | % Families |
| Less than $10,000 | 216 | 1.7% |
| $10,000 to $14,999 | 216 | 1.7% |
| $15,000 to $24,999 | 191 | 1.5% |
| $25,000 to $34,999 | 573 | 4.5% |
| $35,000 to $49,999 | 789 | 6.2% |
| $50,000 to $74,999 | 1,718 | 13.5% |
| $75,000 to $99,999 | 1,438 | 11.3% |
| $100,000 to $149,999 | 2,495 | 19.6% |
| $150,000 to $199,999 | 1,935 | 15.2% |
| $200,000+ | 3,170 | 24.9% |
Family Income by Famaliy Size in Aspen Hill
7+ person families (624 | 4.9%) account for the highest median family income in Aspen Hill with $182,083 per family, while 2-person families (4,274 | 33.6%) have the highest median income of $54,810 per family member.
| Income Bracket | # Families | Median Income |
| 2-Person Families | 4,274 (33.6%) | $109,620 |
| 3-Person Families | 2,991 (23.5%) | $123,423 |
| 4-Person Families | 2,942 (23.1%) | $132,809 |
| 5-Person Families | 1,391 (10.9%) | $142,630 |
| 6-Person Families | 507 (4.0%) | $177,182 |
| 7+ Person Families | 624 (4.9%) | $182,083 |
| Total | 12,729 (100.0%) | $127,830 |
Family Income by Number of Earners in Aspen Hill
The median family income in Aspen Hill is $127,830, with families comprising 3+ earners (2,643) having the highest median family income of $159,712, while families with 1 earner (2,965) have the lowest median family income of $81,138, accounting for 20.8% and 23.3% of families, respectively.
| Number of Earners | # Families | Median Income |
| No Earners | 1,118 (8.8%) | $99,038 |
| 1 Earner | 2,965 (23.3%) | $81,138 |
| 2 Earners | 6,003 (47.2%) | $141,543 |
| 3+ Earners | 2,643 (20.8%) | $159,712 |
| Total | 12,729 (100.0%) | $127,830 |
Household Income in Aspen Hill
Household Income Brackets in Aspen Hill
With 3,630 households falling in the category, the $200,000+ income range is the most frequent in Aspen Hill, accounting for 20.9% of all households. In contrast, only 486 households (2.8%) fall into the $15,000 to $24,999 income bracket, making it the least populous group.
| Income Bracket | # Households | % Households |
| Less than $10,000 | 573 | 3.3% |
| $10,000 to $14,999 | 660 | 3.8% |
| $15,000 to $24,999 | 486 | 2.8% |
| $25,000 to $34,999 | 834 | 4.8% |
| $35,000 to $49,999 | 1,233 | 7.1% |
| $50,000 to $74,999 | 2,206 | 12.7% |
| $75,000 to $99,999 | 2,015 | 11.6% |
| $100,000 to $149,999 | 3,387 | 19.5% |
| $150,000 to $199,999 | 2,362 | 13.6% |
| $200,000+ | 3,630 | 20.9% |
Household Income by Householder Age in Aspen Hill
The median household income in Aspen Hill is $104,582, with the highest median household income of $113,365 found in the 25 to 44 years age bracket for the primary householder. A total of 5,489 households (31.6%) fall into this category. Meanwhile, the 15 to 24 years age bracket for the primary householder has the lowest median household income of $86,060, with 390 households (2.2%) in this group.
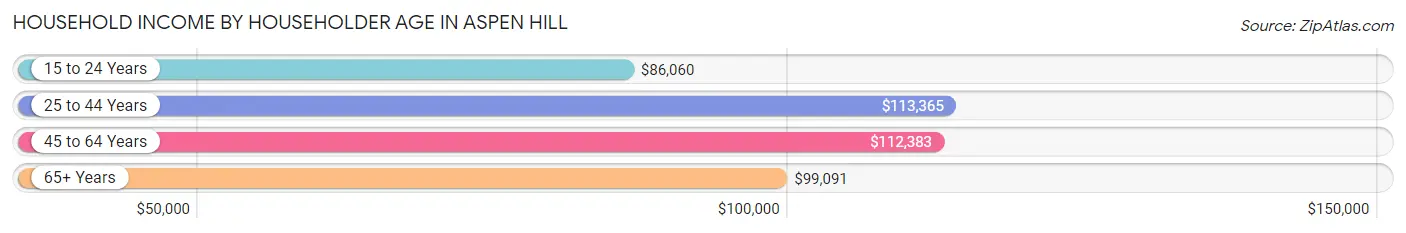
| Income Bracket | # Households | Median Income |
| 15 to 24 Years | 390 (2.2%) | $86,060 |
| 25 to 44 Years | 5,489 (31.6%) | $113,365 |
| 45 to 64 Years | 7,270 (41.9%) | $112,383 |
| 65+ Years | 4,220 (24.3%) | $99,091 |
| Total | 17,369 (100.0%) | $104,582 |
Poverty in Aspen Hill
Income Below Poverty by Sex and Age in Aspen Hill
With 7.1% poverty level for males and 9.2% for females among the residents of Aspen Hill, under 5 year old males and 65 to 74 year old females are the most vulnerable to poverty, with 228 males (13.6%) and 342 females (14.0%) in their respective age groups living below the poverty level.
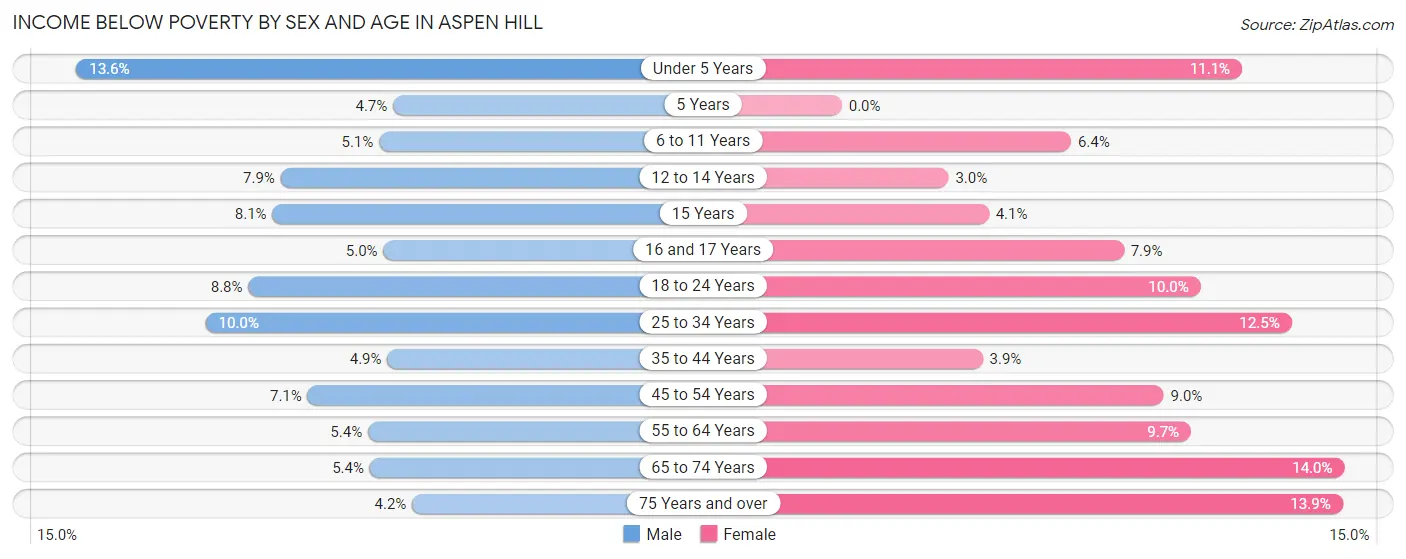
| Age Bracket | Male | Female |
| Under 5 Years | 228 (13.6%) | 167 (11.1%) |
| 5 Years | 9 (4.7%) | 0 (0.0%) |
| 6 to 11 Years | 113 (5.1%) | 139 (6.4%) |
| 12 to 14 Years | 113 (7.9%) | 35 (3.0%) |
| 15 Years | 44 (8.1%) | 14 (4.1%) |
| 16 and 17 Years | 43 (5.0%) | 72 (7.9%) |
| 18 to 24 Years | 267 (8.8%) | 260 (10.0%) |
| 25 to 34 Years | 292 (10.0%) | 443 (12.5%) |
| 35 to 44 Years | 179 (4.9%) | 150 (3.9%) |
| 45 to 54 Years | 261 (7.1%) | 322 (9.0%) |
| 55 to 64 Years | 166 (5.4%) | 302 (9.7%) |
| 65 to 74 Years | 100 (5.4%) | 342 (14.0%) |
| 75 Years and over | 54 (4.2%) | 265 (13.9%) |
| Total | 1,869 (7.1%) | 2,511 (9.2%) |
Income Above Poverty by Sex and Age in Aspen Hill
According to the poverty statistics in Aspen Hill, males aged 75 years and over and females aged 5 years are the age groups that are most secure financially, with 95.8% of males and 100.0% of females in these age groups living above the poverty line.
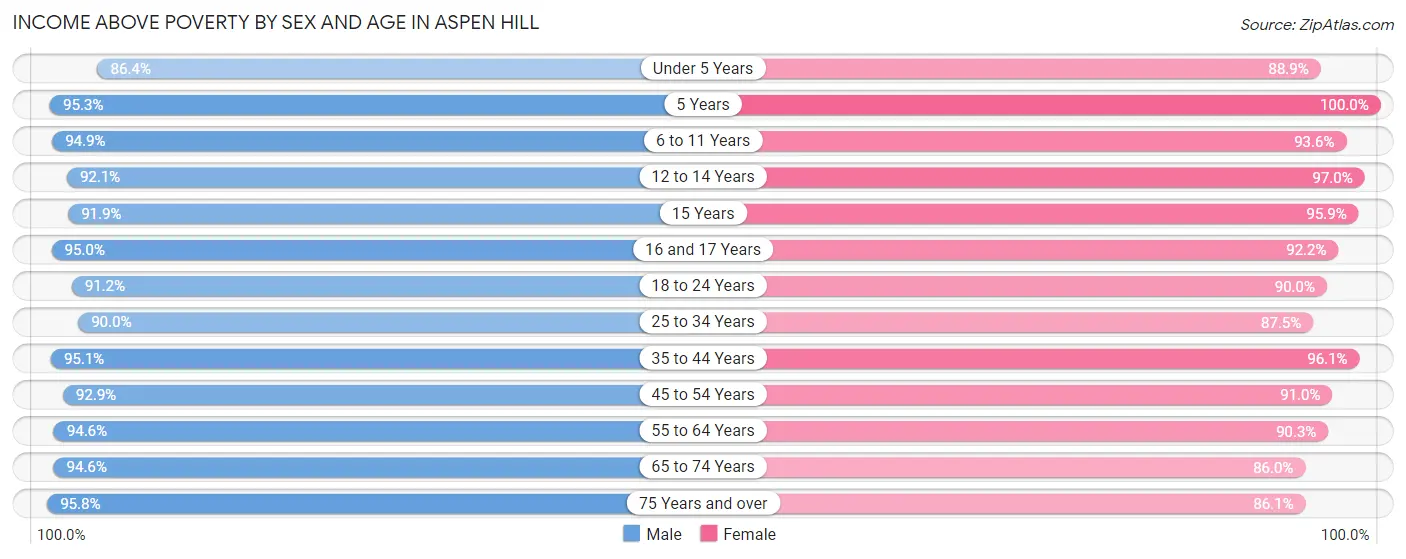
| Age Bracket | Male | Female |
| Under 5 Years | 1,453 (86.4%) | 1,332 (88.9%) |
| 5 Years | 181 (95.3%) | 185 (100.0%) |
| 6 to 11 Years | 2,091 (94.9%) | 2,041 (93.6%) |
| 12 to 14 Years | 1,322 (92.1%) | 1,143 (97.0%) |
| 15 Years | 499 (91.9%) | 328 (95.9%) |
| 16 and 17 Years | 816 (95.0%) | 845 (92.1%) |
| 18 to 24 Years | 2,778 (91.2%) | 2,342 (90.0%) |
| 25 to 34 Years | 2,640 (90.0%) | 3,095 (87.5%) |
| 35 to 44 Years | 3,473 (95.1%) | 3,678 (96.1%) |
| 45 to 54 Years | 3,406 (92.9%) | 3,271 (91.0%) |
| 55 to 64 Years | 2,888 (94.6%) | 2,804 (90.3%) |
| 65 to 74 Years | 1,754 (94.6%) | 2,103 (86.0%) |
| 75 Years and over | 1,228 (95.8%) | 1,636 (86.1%) |
| Total | 24,529 (92.9%) | 24,803 (90.8%) |
Income Below Poverty Among Married-Couple Families in Aspen Hill
The poverty statistics for married-couple families in Aspen Hill show that 4.0% or 377 of the total 9,428 families live below the poverty line. Families with 3 or 4 children have the highest poverty rate of 7.7%, comprising of 90 families. On the other hand, families with 5 or more children have the lowest poverty rate of 0.0%, which includes 0 families.
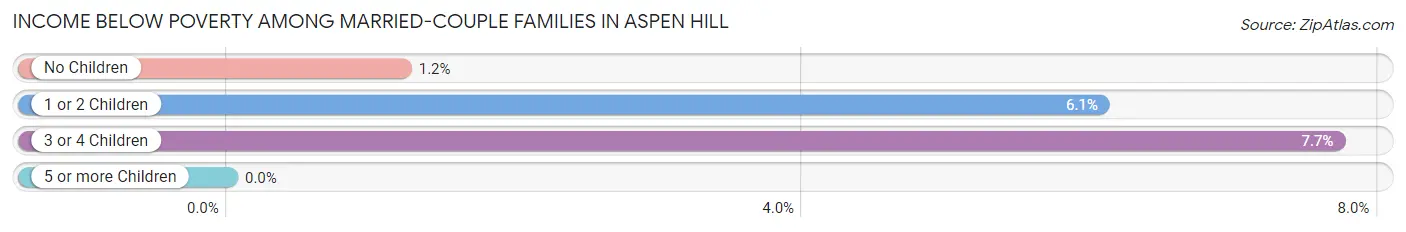
| Children | Above Poverty | Below Poverty |
| No Children | 4,259 (98.8%) | 52 (1.2%) |
| 1 or 2 Children | 3,638 (93.9%) | 235 (6.1%) |
| 3 or 4 Children | 1,077 (92.3%) | 90 (7.7%) |
| 5 or more Children | 77 (100.0%) | 0 (0.0%) |
| Total | 9,051 (96.0%) | 377 (4.0%) |
Income Below Poverty Among Single-Parent Households in Aspen Hill
According to the poverty data in Aspen Hill, 4.2% or 41 single-father households and 9.9% or 231 single-mother households are living below the poverty line. Among single-father households, those with 3 or 4 children have the highest poverty rate, with 17 households (16.5%) experiencing poverty. Likewise, among single-mother households, those with 1 or 2 children have the highest poverty rate, with 131 households (12.4%) falling below the poverty line.
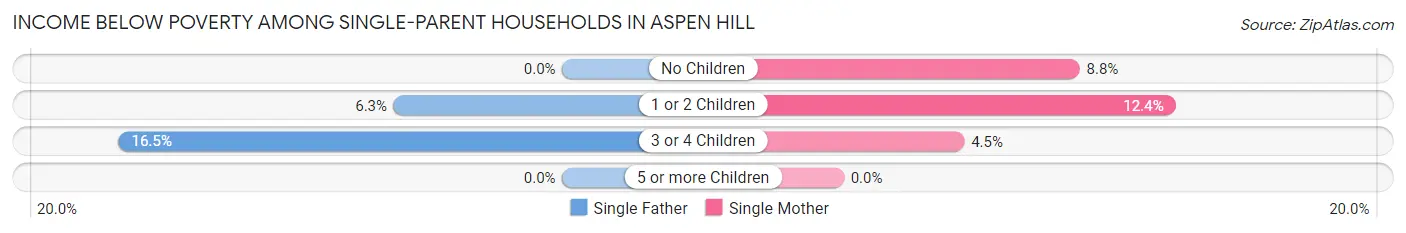
| Children | Single Father | Single Mother |
| No Children | 0 (0.0%) | 88 (8.8%) |
| 1 or 2 Children | 24 (6.3%) | 131 (12.4%) |
| 3 or 4 Children | 17 (16.5%) | 12 (4.5%) |
| 5 or more Children | 0 (0.0%) | 0 (0.0%) |
| Total | 41 (4.2%) | 231 (9.9%) |
Income Below Poverty Among Married-Couple vs Single-Parent Households in Aspen Hill
The poverty data for Aspen Hill shows that 377 of the married-couple family households (4.0%) and 272 of the single-parent households (8.2%) are living below the poverty level. Within the married-couple family households, those with 3 or 4 children have the highest poverty rate, with 90 households (7.7%) falling below the poverty line. Among the single-parent households, those with 1 or 2 children have the highest poverty rate, with 155 household (10.7%) living below poverty.
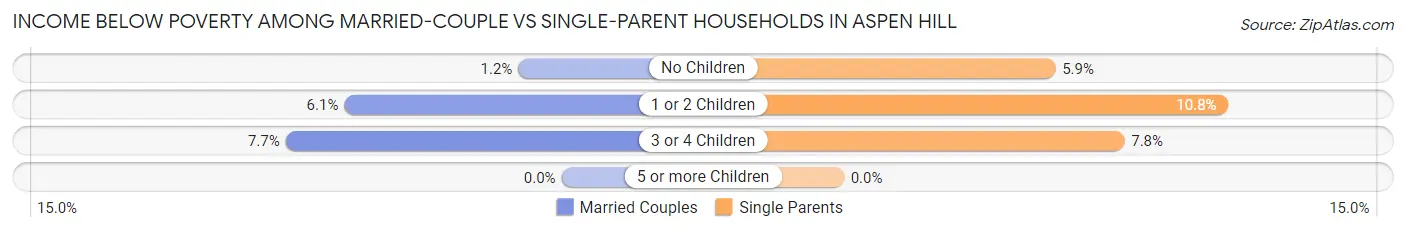
| Children | Married-Couple Families | Single-Parent Households |
| No Children | 52 (1.2%) | 88 (5.9%) |
| 1 or 2 Children | 235 (6.1%) | 155 (10.7%) |
| 3 or 4 Children | 90 (7.7%) | 29 (7.8%) |
| 5 or more Children | 0 (0.0%) | 0 (0.0%) |
| Total | 377 (4.0%) | 272 (8.2%) |
Race in Aspen Hill
The most populous races in Aspen Hill are White / Caucasian (21,853 | 40.3%), Hispanic or Latino (17,935 | 33.1%), and Some other Race (12,558 | 23.1%).
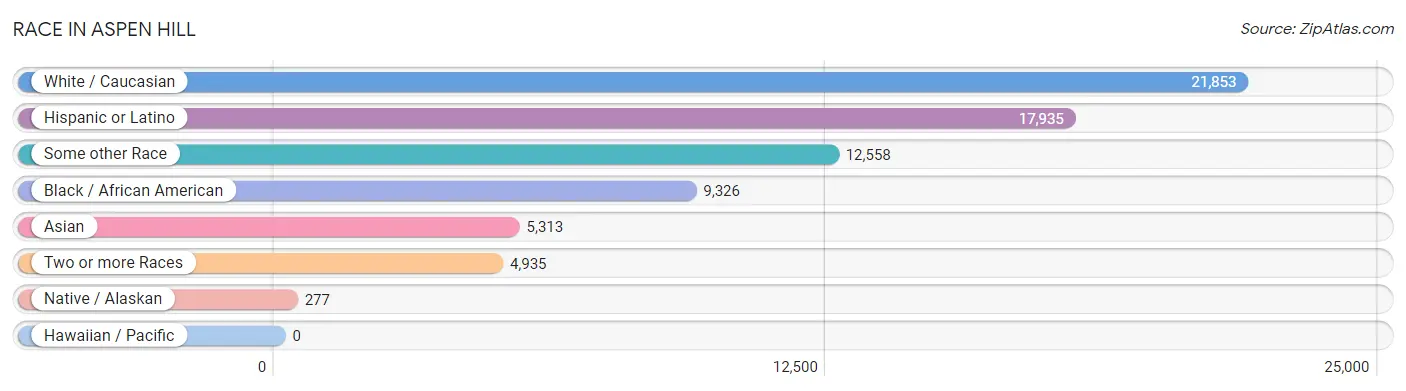
| Race | # Population | % Population |
| Asian | 5,313 | 9.8% |
| Black / African American | 9,326 | 17.2% |
| Hawaiian / Pacific | 0 | 0.0% |
| Hispanic or Latino | 17,935 | 33.1% |
| Native / Alaskan | 277 | 0.5% |
| White / Caucasian | 21,853 | 40.3% |
| Two or more Races | 4,935 | 9.1% |
| Some other Race | 12,558 | 23.1% |
| Total | 54,262 | 100.0% |
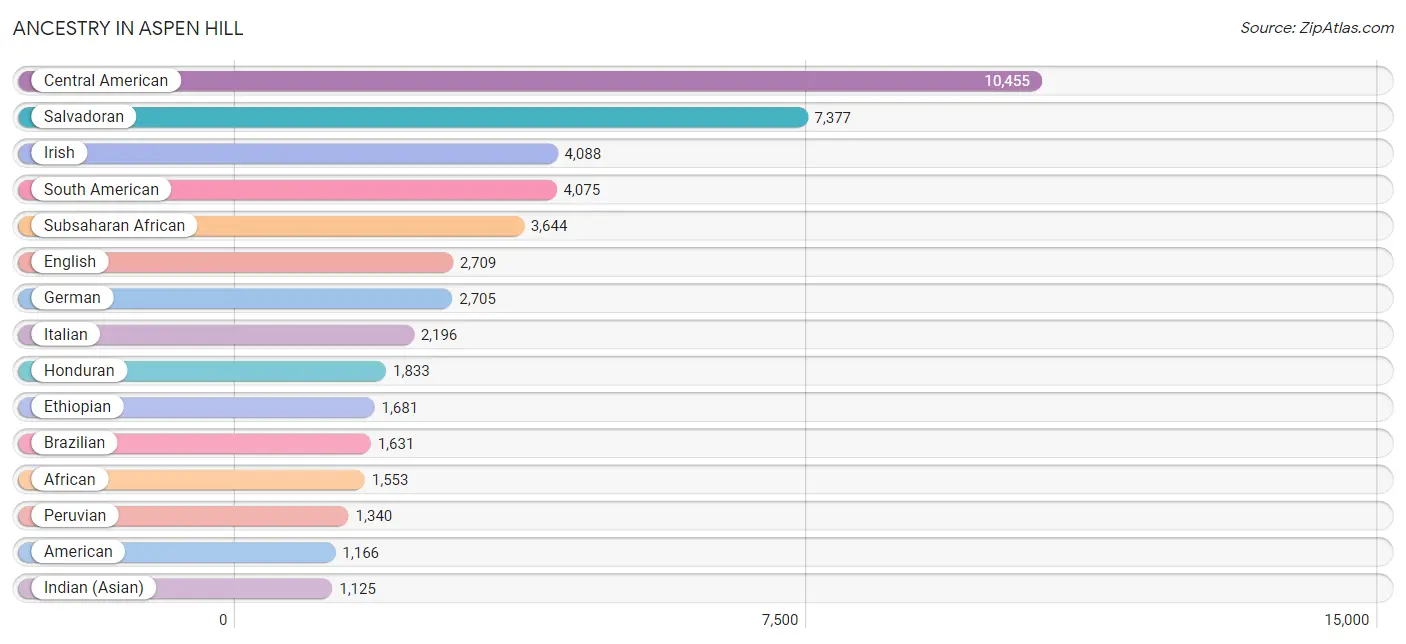
Ancestry in Aspen Hill
The most populous ancestries reported in Aspen Hill are Central American (10,455 | 19.3%), Salvadoran (7,377 | 13.6%), Irish (4,088 | 7.5%), South American (4,075 | 7.5%), and Subsaharan African (3,644 | 6.7%), together accounting for 54.6% of all Aspen Hill residents.
| Ancestry | # Population | % Population |
| Afghan | 33 | 0.1% |
| African | 1,553 | 2.9% |
| American | 1,166 | 2.1% |
| Arab | 831 | 1.5% |
| Argentinean | 25 | 0.1% |
| Australian | 15 | 0.0% |
| Austrian | 46 | 0.1% |
| Bangladeshi | 18 | 0.0% |
| Barbadian | 30 | 0.1% |
| Basque | 5 | 0.0% |
| Belgian | 82 | 0.2% |
| Belizean | 30 | 0.1% |
| Bhutanese | 257 | 0.5% |
| Blackfeet | 14 | 0.0% |
| Bolivian | 577 | 1.1% |
| Brazilian | 1,631 | 3.0% |
| British | 423 | 0.8% |
| British West Indian | 80 | 0.2% |
| Bulgarian | 280 | 0.5% |
| Burmese | 729 | 1.3% |
| Canadian | 60 | 0.1% |
| Cape Verdean | 15 | 0.0% |
| Celtic | 59 | 0.1% |
| Central American | 10,455 | 19.3% |
| Central American Indian | 224 | 0.4% |
| Cherokee | 80 | 0.2% |
| Chickasaw | 16 | 0.0% |
| Chilean | 151 | 0.3% |
| Chippewa | 39 | 0.1% |
| Colombian | 644 | 1.2% |
| Costa Rican | 9 | 0.0% |
| Croatian | 33 | 0.1% |
| Crow | 9 | 0.0% |
| Cuban | 188 | 0.4% |
| Czech | 175 | 0.3% |
| Czechoslovakian | 54 | 0.1% |
| Danish | 15 | 0.0% |
| Dominican | 379 | 0.7% |
| Dutch | 637 | 1.2% |
| Eastern European | 293 | 0.5% |
| Ecuadorian | 668 | 1.2% |
| Egyptian | 164 | 0.3% |
| English | 2,709 | 5.0% |
| Ethiopian | 1,681 | 3.1% |
| European | 832 | 1.5% |
| Filipino | 151 | 0.3% |
| Finnish | 39 | 0.1% |
| French | 450 | 0.8% |
| French Canadian | 81 | 0.2% |
| German | 2,705 | 5.0% |
| Ghanaian | 42 | 0.1% |
| Greek | 390 | 0.7% |
| Guatemalan | 1,060 | 1.9% |
| Guyanese | 16 | 0.0% |
| Haitian | 244 | 0.4% |
| Honduran | 1,833 | 3.4% |
| Hungarian | 136 | 0.3% |
| Indian (Asian) | 1,125 | 2.1% |
| Indonesian | 60 | 0.1% |
| Iranian | 187 | 0.3% |
| Irish | 4,088 | 7.5% |
| Israeli | 16 | 0.0% |
| Italian | 2,196 | 4.1% |
| Jamaican | 637 | 1.2% |
| Japanese | 266 | 0.5% |
| Korean | 785 | 1.5% |
| Laotian | 46 | 0.1% |
| Latvian | 19 | 0.0% |
| Lebanese | 123 | 0.2% |
| Liberian | 23 | 0.0% |
| Lithuanian | 66 | 0.1% |
| Mexican | 837 | 1.5% |
| Mexican American Indian | 20 | 0.0% |
| Mongolian | 32 | 0.1% |
| Moroccan | 242 | 0.4% |
| Native Hawaiian | 28 | 0.1% |
| Nicaraguan | 166 | 0.3% |
| Nigerian | 164 | 0.3% |
| Northern European | 43 | 0.1% |
| Norwegian | 268 | 0.5% |
| Okinawan | 22 | 0.0% |
| Pakistani | 238 | 0.4% |
| Palestinian | 91 | 0.2% |
| Panamanian | 10 | 0.0% |
| Pennsylvania German | 8 | 0.0% |
| Peruvian | 1,340 | 2.5% |
| Polish | 734 | 1.3% |
| Portuguese | 186 | 0.3% |
| Puerto Rican | 1,082 | 2.0% |
| Romanian | 110 | 0.2% |
| Russian | 564 | 1.0% |
| Salvadoran | 7,377 | 13.6% |
| Scandinavian | 52 | 0.1% |
| Scotch-Irish | 135 | 0.3% |
| Scottish | 514 | 0.9% |
| Senegalese | 19 | 0.0% |
| Slovak | 65 | 0.1% |
| Slovene | 32 | 0.1% |
| South American | 4,075 | 7.5% |
| South American Indian | 111 | 0.2% |
| Spaniard | 124 | 0.2% |
| Spanish | 29 | 0.1% |
| Sri Lankan | 775 | 1.4% |
| Subsaharan African | 3,644 | 6.7% |
| Swedish | 306 | 0.6% |
| Swiss | 60 | 0.1% |
| Syrian | 8 | 0.0% |
| Thai | 807 | 1.5% |
| Trinidadian and Tobagonian | 79 | 0.2% |
| Turkish | 127 | 0.2% |
| Ugandan | 11 | 0.0% |
| Ukrainian | 354 | 0.6% |
| Uruguayan | 510 | 0.9% |
| Venezuelan | 160 | 0.3% |
| Vietnamese | 13 | 0.0% |
| Welsh | 442 | 0.8% |
| West Indian | 91 | 0.2% |
| Yugoslavian | 41 | 0.1% |
| Zimbabwean | 156 | 0.3% | View All 119 Rows |
Immigrants in Aspen Hill
The most numerous immigrant groups reported in Aspen Hill came from Latin America (12,126 | 22.4%), Central America (6,246 | 11.5%), South America (4,917 | 9.1%), Asia (3,814 | 7.0%), and El Salvador (3,668 | 6.8%), together accounting for 56.7% of all Aspen Hill residents.
| Immigration Origin | # Population | % Population |
| Africa | 3,268 | 6.0% |
| Asia | 3,814 | 7.0% |
| Australia | 7 | 0.0% |
| Bangladesh | 13 | 0.0% |
| Barbados | 30 | 0.1% |
| Belize | 30 | 0.1% |
| Bolivia | 314 | 0.6% |
| Bosnia and Herzegovina | 12 | 0.0% |
| Brazil | 1,812 | 3.3% |
| Bulgaria | 117 | 0.2% |
| Cambodia | 111 | 0.2% |
| Cameroon | 288 | 0.5% |
| Canada | 230 | 0.4% |
| Caribbean | 963 | 1.8% |
| Central America | 6,246 | 11.5% |
| Chile | 107 | 0.2% |
| China | 574 | 1.1% |
| Colombia | 420 | 0.8% |
| Cuba | 39 | 0.1% |
| Czechoslovakia | 36 | 0.1% |
| Dominica | 43 | 0.1% |
| Dominican Republic | 330 | 0.6% |
| Eastern Africa | 1,307 | 2.4% |
| Eastern Asia | 1,123 | 2.1% |
| Eastern Europe | 460 | 0.9% |
| Ecuador | 631 | 1.2% |
| Egypt | 136 | 0.3% |
| El Salvador | 3,668 | 6.8% |
| England | 73 | 0.1% |
| Ethiopia | 1,127 | 2.1% |
| Europe | 993 | 1.8% |
| France | 80 | 0.2% |
| Germany | 98 | 0.2% |
| Ghana | 416 | 0.8% |
| Greece | 35 | 0.1% |
| Grenada | 22 | 0.0% |
| Guatemala | 717 | 1.3% |
| Guyana | 161 | 0.3% |
| Haiti | 121 | 0.2% |
| Honduras | 1,447 | 2.7% |
| Hong Kong | 50 | 0.1% |
| India | 449 | 0.8% |
| Indonesia | 19 | 0.0% |
| Iran | 124 | 0.2% |
| Ireland | 12 | 0.0% |
| Israel | 31 | 0.1% |
| Italy | 56 | 0.1% |
| Jamaica | 203 | 0.4% |
| Japan | 9 | 0.0% |
| Kenya | 12 | 0.0% |
| Korea | 540 | 1.0% |
| Laos | 12 | 0.0% |
| Latin America | 12,126 | 22.4% |
| Lebanon | 60 | 0.1% |
| Liberia | 39 | 0.1% |
| Malaysia | 60 | 0.1% |
| Mexico | 262 | 0.5% |
| Middle Africa | 350 | 0.6% |
| Moldova | 7 | 0.0% |
| Morocco | 185 | 0.3% |
| Nepal | 70 | 0.1% |
| Nicaragua | 51 | 0.1% |
| Nigeria | 118 | 0.2% |
| Northern Africa | 321 | 0.6% |
| Northern Europe | 192 | 0.4% |
| Oceania | 7 | 0.0% |
| Pakistan | 248 | 0.5% |
| Panama | 71 | 0.1% |
| Peru | 1,135 | 2.1% |
| Philippines | 434 | 0.8% |
| Poland | 19 | 0.0% |
| Portugal | 57 | 0.1% |
| Romania | 76 | 0.1% |
| Russia | 67 | 0.1% |
| Scotland | 18 | 0.0% |
| Senegal | 39 | 0.1% |
| Sierra Leone | 394 | 0.7% |
| Singapore | 11 | 0.0% |
| South Africa | 50 | 0.1% |
| South America | 4,917 | 9.1% |
| South Central Asia | 1,159 | 2.1% |
| South Eastern Asia | 1,324 | 2.4% |
| Southern Europe | 148 | 0.3% |
| Sri Lanka | 255 | 0.5% |
| Switzerland | 15 | 0.0% |
| Taiwan | 96 | 0.2% |
| Thailand | 147 | 0.3% |
| Trinidad and Tobago | 95 | 0.2% |
| Turkey | 60 | 0.1% |
| Uganda | 28 | 0.1% |
| Ukraine | 71 | 0.1% |
| Uruguay | 123 | 0.2% |
| Venezuela | 214 | 0.4% |
| Vietnam | 479 | 0.9% |
| West Indies | 49 | 0.1% |
| Western Africa | 1,207 | 2.2% |
| Western Asia | 160 | 0.3% |
| Western Europe | 193 | 0.4% |
| Zaire | 24 | 0.0% |
| Zimbabwe | 126 | 0.2% | View All 100 Rows |
Sex and Age in Aspen Hill
Sex and Age in Aspen Hill
The most populous age groups in Aspen Hill are 20 to 24 Years (2,379 | 8.9%) for men and 15 to 19 Years (2,218 | 8.1%) for women.
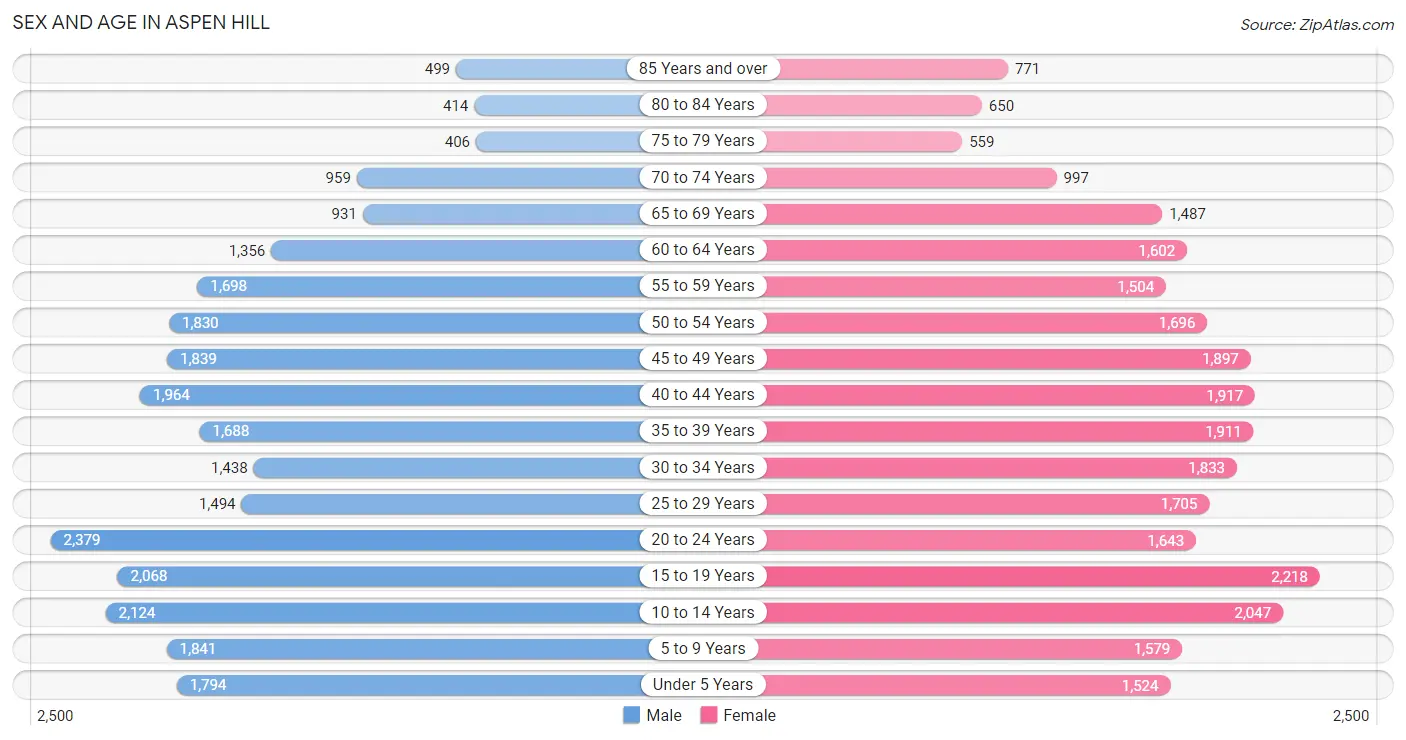
| Age Bracket | Male | Female |
| Under 5 Years | 1,794 (6.7%) | 1,524 (5.5%) |
| 5 to 9 Years | 1,841 (6.9%) | 1,579 (5.7%) |
| 10 to 14 Years | 2,124 (8.0%) | 2,047 (7.4%) |
| 15 to 19 Years | 2,068 (7.7%) | 2,218 (8.1%) |
| 20 to 24 Years | 2,379 (8.9%) | 1,643 (6.0%) |
| 25 to 29 Years | 1,494 (5.6%) | 1,705 (6.2%) |
| 30 to 34 Years | 1,438 (5.4%) | 1,833 (6.7%) |
| 35 to 39 Years | 1,688 (6.3%) | 1,911 (6.9%) |
| 40 to 44 Years | 1,964 (7.3%) | 1,917 (7.0%) |
| 45 to 49 Years | 1,839 (6.9%) | 1,897 (6.9%) |
| 50 to 54 Years | 1,830 (6.9%) | 1,696 (6.2%) |
| 55 to 59 Years | 1,698 (6.4%) | 1,504 (5.5%) |
| 60 to 64 Years | 1,356 (5.1%) | 1,602 (5.8%) |
| 65 to 69 Years | 931 (3.5%) | 1,487 (5.4%) |
| 70 to 74 Years | 959 (3.6%) | 997 (3.6%) |
| 75 to 79 Years | 406 (1.5%) | 559 (2.0%) |
| 80 to 84 Years | 414 (1.5%) | 650 (2.4%) |
| 85 Years and over | 499 (1.9%) | 771 (2.8%) |
| Total | 26,722 (100.0%) | 27,540 (100.0%) |
Families and Households in Aspen Hill
Median Family Size in Aspen Hill
The median family size in Aspen Hill is 3.54 persons per family, with married-couple families (9,428 | 74.1%) accounting for the largest median family size of 3.57 persons per family. On the other hand, single female/mother families (2,328 | 18.3%) represent the smallest median family size with 3.39 persons per family.
| Family Type | # Families | Family Size |
| Married-Couple | 9,428 (74.1%) | 3.57 |
| Single Male/Father | 973 (7.6%) | 3.57 |
| Single Female/Mother | 2,328 (18.3%) | 3.39 |
| Total Families | 12,729 (100.0%) | 3.54 |
Median Household Size in Aspen Hill
The median household size in Aspen Hill is 3.10 persons per household, with single male/father households (973 | 5.6%) accounting for the largest median household size of 4.24 persons per household. non-family households (4,640 | 26.7%) represent the smallest median household size with 1.52 persons per household.
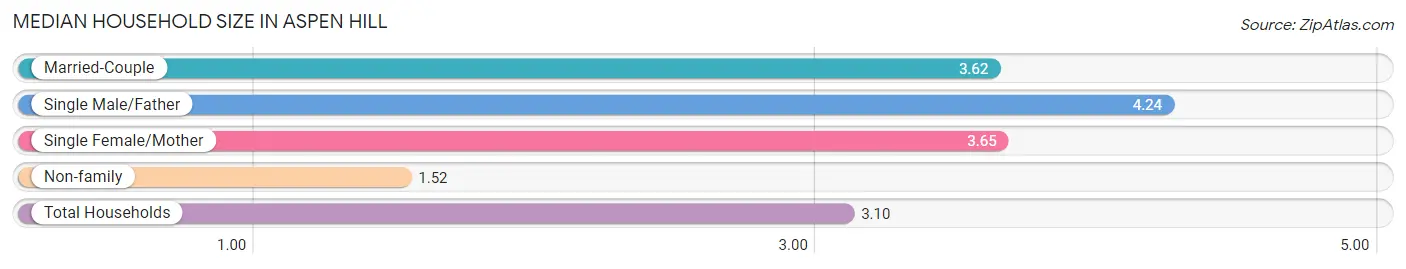
| Household Type | # Households | Household Size |
| Married-Couple | 9,428 (54.3%) | 3.62 |
| Single Male/Father | 973 (5.6%) | 4.24 |
| Single Female/Mother | 2,328 (13.4%) | 3.65 |
| Non-family | 4,640 (26.7%) | 1.52 |
| Total Households | 17,369 (100.0%) | 3.10 |
Household Size by Marriage Status in Aspen Hill
Out of a total of 17,369 households in Aspen Hill, 12,729 (73.3%) are family households, while 4,640 (26.7%) are nonfamily households. The most numerous type of family households are 2-person households, comprising 3,954, and the most common type of nonfamily households are 1-person households, comprising 3,292.
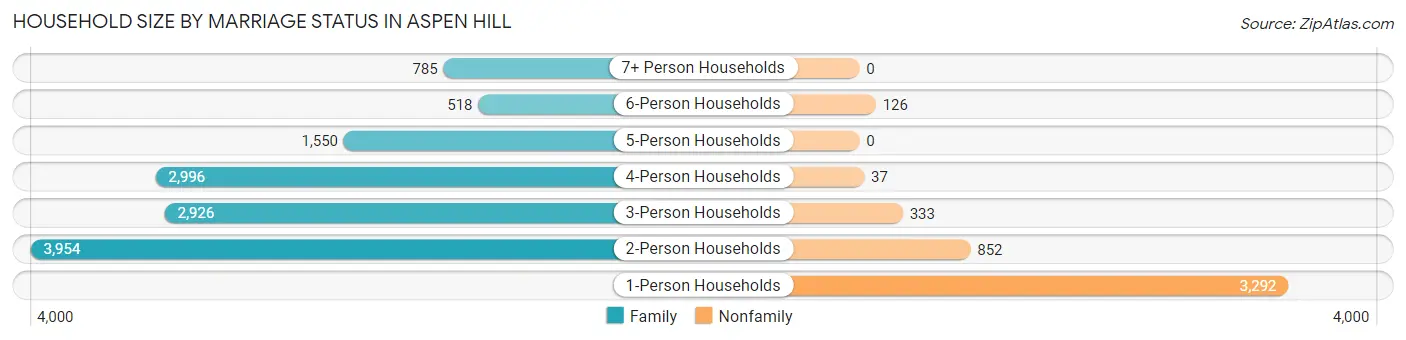
| Household Size | Family Households | Nonfamily Households |
| 1-Person Households | - | 3,292 (19.0%) |
| 2-Person Households | 3,954 (22.8%) | 852 (4.9%) |
| 3-Person Households | 2,926 (16.9%) | 333 (1.9%) |
| 4-Person Households | 2,996 (17.2%) | 37 (0.2%) |
| 5-Person Households | 1,550 (8.9%) | 0 (0.0%) |
| 6-Person Households | 518 (3.0%) | 126 (0.7%) |
| 7+ Person Households | 785 (4.5%) | 0 (0.0%) |
| Total | 12,729 (73.3%) | 4,640 (26.7%) |
Female Fertility in Aspen Hill
Fertility by Age in Aspen Hill
Average fertility rate in Aspen Hill is 57.0 births per 1,000 women. Women in the age bracket of 20 to 34 years have the highest fertility rate with 78.0 births per 1,000 women. Women in the age bracket of 20 to 34 years acount for 52.7% of all women with births.
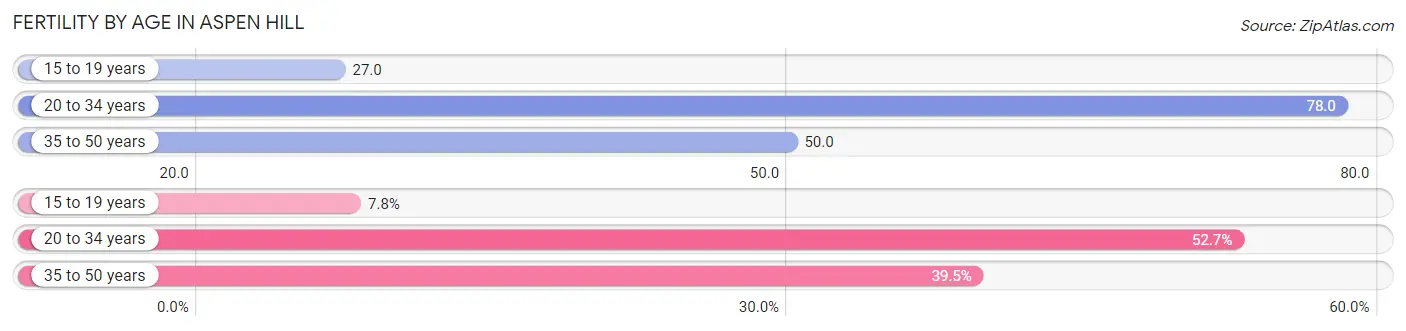
| Age Bracket | Women with Births | Births / 1,000 Women |
| 15 to 19 years | 60 (7.8%) | 27.0 |
| 20 to 34 years | 406 (52.7%) | 78.0 |
| 35 to 50 years | 304 (39.5%) | 50.0 |
| Total | 770 (100.0%) | 57.0 |
Fertility by Age by Marriage Status in Aspen Hill
79.1% of women with births (770) in Aspen Hill are married. The highest percentage of unmarried women with births falls into 15 to 19 years age bracket with 100.0% of them unmarried at the time of birth, while the lowest percentage of unmarried women with births belong to 35 to 50 years age bracket with 3.6% of them unmarried.
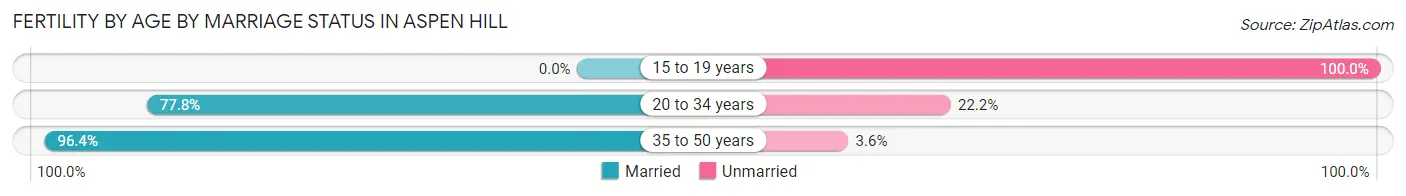
| Age Bracket | Married | Unmarried |
| 15 to 19 years | 0 (0.0%) | 60 (100.0%) |
| 20 to 34 years | 316 (77.8%) | 90 (22.2%) |
| 35 to 50 years | 293 (96.4%) | 11 (3.6%) |
| Total | 609 (79.1%) | 161 (20.9%) |
Fertility by Education in Aspen Hill
Average fertility rate in Aspen Hill is 57.0 births per 1,000 women. Women with the education attainment of bachelor's degree have the highest fertility rate of 109.0 births per 1,000 women, while women with the education attainment of college or associate's degree have the lowest fertility at 19.0 births per 1,000 women. Women with the education attainment of bachelor's degree represent 36.9% of all women with births.
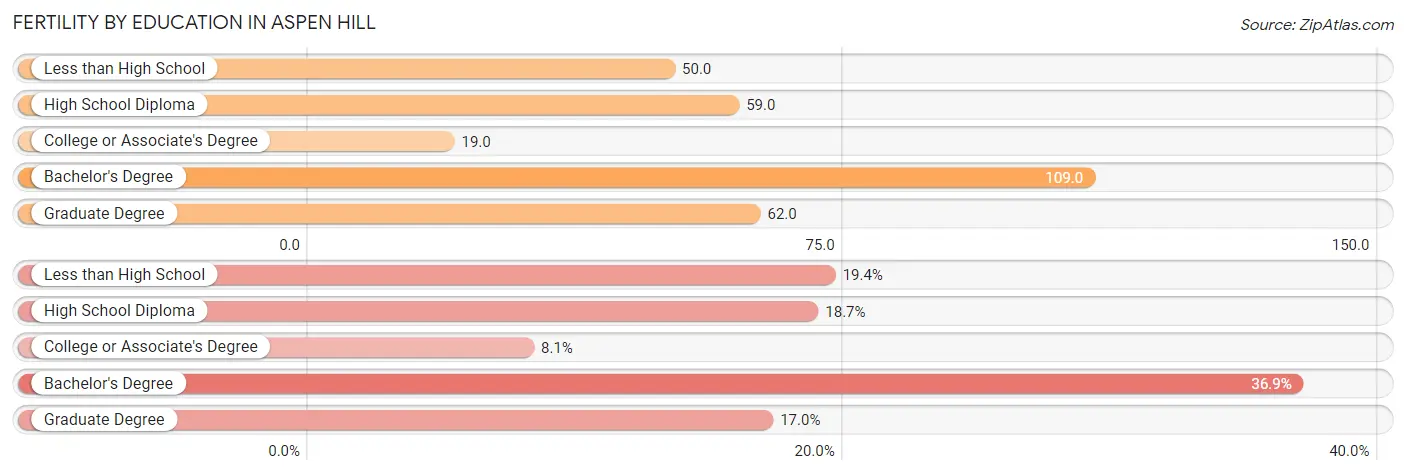
| Educational Attainment | Women with Births | Births / 1,000 Women |
| Less than High School | 149 (19.4%) | 50.0 |
| High School Diploma | 144 (18.7%) | 59.0 |
| College or Associate's Degree | 62 (8.1%) | 19.0 |
| Bachelor's Degree | 284 (36.9%) | 109.0 |
| Graduate Degree | 131 (17.0%) | 62.0 |
| Total | 770 (100.0%) | 57.0 |
Fertility by Education by Marriage Status in Aspen Hill
20.9% of women with births in Aspen Hill are unmarried. Women with the educational attainment of bachelor's degree are most likely to be married with 100.0% of them married at childbirth, while women with the educational attainment of less than high school are least likely to be married with 74.5% of them unmarried at childbirth.
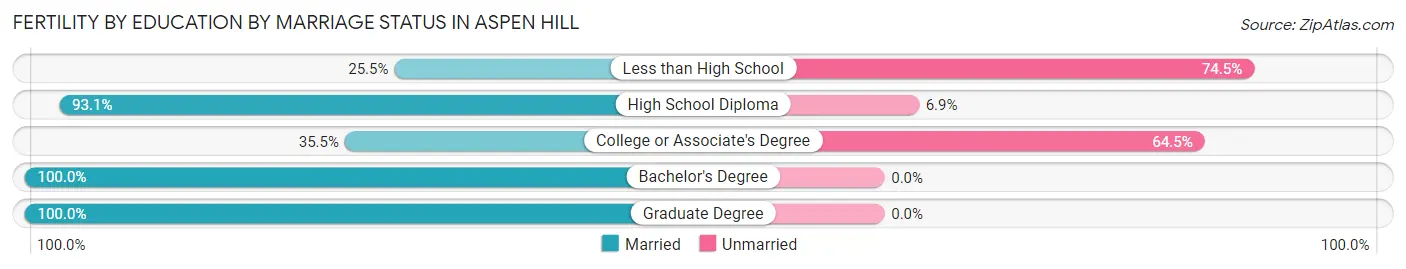
| Educational Attainment | Married | Unmarried |
| Less than High School | 38 (25.5%) | 111 (74.5%) |
| High School Diploma | 134 (93.1%) | 10 (6.9%) |
| College or Associate's Degree | 22 (35.5%) | 40 (64.5%) |
| Bachelor's Degree | 284 (100.0%) | 0 (0.0%) |
| Graduate Degree | 131 (100.0%) | 0 (0.0%) |
| Total | 609 (79.1%) | 161 (20.9%) |
Employment Characteristics in Aspen Hill
Employment by Class of Employer in Aspen Hill
Among the 27,936 employed individuals in Aspen Hill, private company employees (16,636 | 59.6%), not-for-profit organizations (2,835 | 10.2%), and self-employed (not incorporated) (2,332 | 8.4%) make up the most common classes of employment.
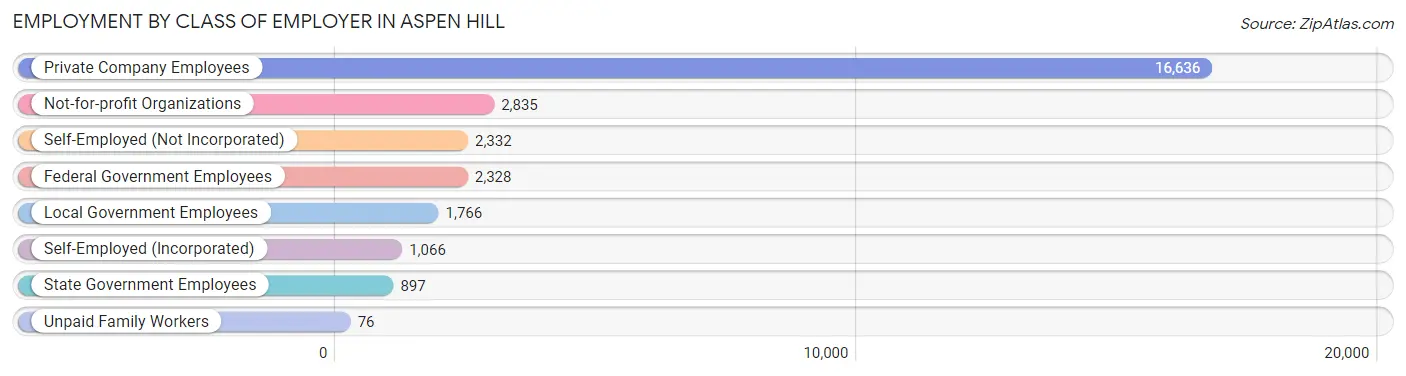
| Employer Class | # Employees | % Employees |
| Private Company Employees | 16,636 | 59.6% |
| Self-Employed (Incorporated) | 1,066 | 3.8% |
| Self-Employed (Not Incorporated) | 2,332 | 8.4% |
| Not-for-profit Organizations | 2,835 | 10.2% |
| Local Government Employees | 1,766 | 6.3% |
| State Government Employees | 897 | 3.2% |
| Federal Government Employees | 2,328 | 8.3% |
| Unpaid Family Workers | 76 | 0.3% |
| Total | 27,936 | 100.0% |
Employment Status by Age in Aspen Hill
According to the labor force statistics for Aspen Hill, out of the total population over 16 years of age (42,468), 73.0% or 31,002 individuals are in the labor force, with 6.6% or 2,046 of them unemployed. The age group with the highest labor force participation rate is 30 to 34 years, with 95.3% or 3,117 individuals in the labor force. Within the labor force, the 16 to 19 years age range has the highest percentage of unemployed individuals, with 21.7% or 273 of them being unemployed.
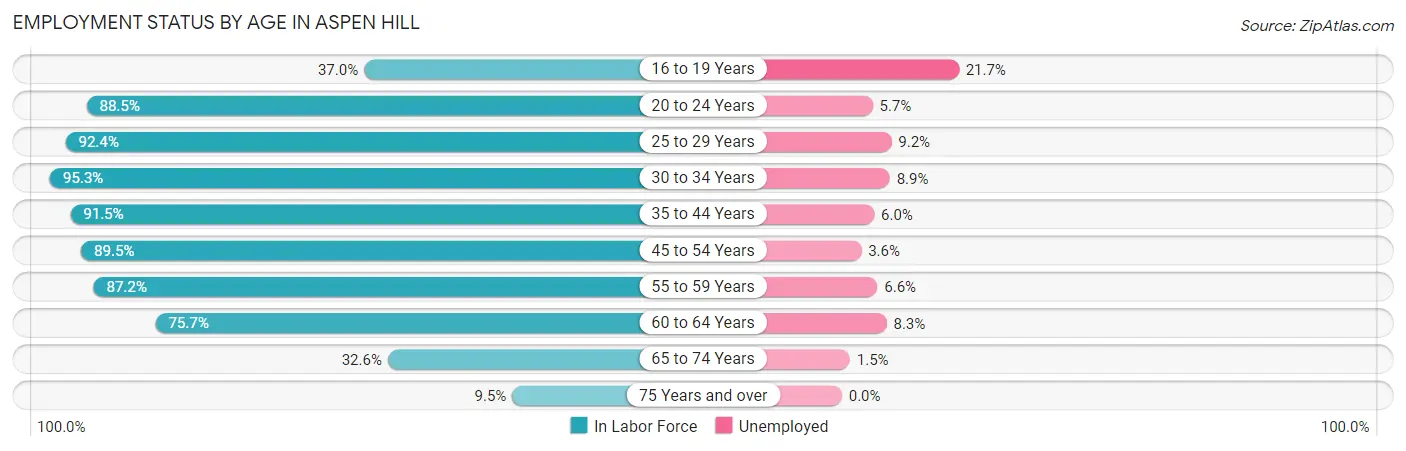
| Age Bracket | In Labor Force | Unemployed |
| 16 to 19 Years | 1,258 (37.0%) | 273 (21.7%) |
| 20 to 24 Years | 3,559 (88.5%) | 203 (5.7%) |
| 25 to 29 Years | 2,956 (92.4%) | 272 (9.2%) |
| 30 to 34 Years | 3,117 (95.3%) | 277 (8.9%) |
| 35 to 44 Years | 6,844 (91.5%) | 411 (6.0%) |
| 45 to 54 Years | 6,499 (89.5%) | 234 (3.6%) |
| 55 to 59 Years | 2,792 (87.2%) | 184 (6.6%) |
| 60 to 64 Years | 2,239 (75.7%) | 186 (8.3%) |
| 65 to 74 Years | 1,426 (32.6%) | 21 (1.5%) |
| 75 Years and over | 313 (9.5%) | 0 (0.0%) |
| Total | 31,002 (73.0%) | 2,046 (6.6%) |
Employment Status by Educational Attainment in Aspen Hill
According to labor force statistics for Aspen Hill, 89.3% of individuals (24,443) out of the total population between 25 and 64 years of age (27,372) are in the labor force, with 6.4% or 1,564 of them being unemployed. The group with the highest labor force participation rate are those with the educational attainment of bachelor's degree or higher, with 92.1% or 10,609 individuals in the labor force. Within the labor force, individuals with less than high school education have the highest percentage of unemployment, with 7.3% or 271 of them being unemployed.
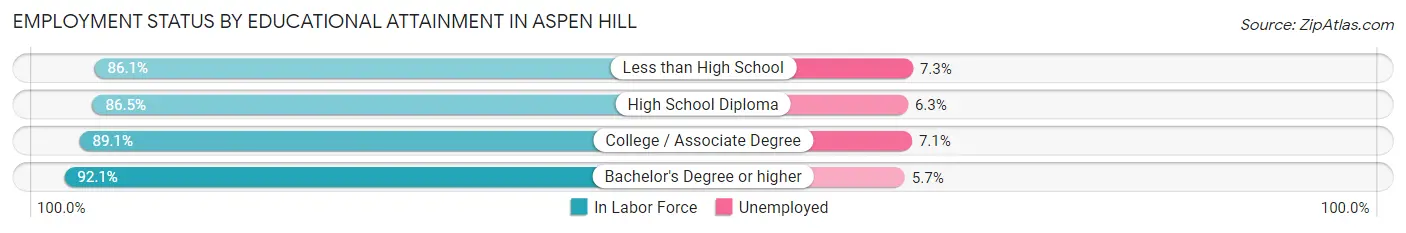
| Educational Attainment | In Labor Force | Unemployed |
| Less than High School | 3,713 (86.1%) | 315 (7.3%) |
| High School Diploma | 5,128 (86.5%) | 373 (6.3%) |
| College / Associate Degree | 5,001 (89.1%) | 399 (7.1%) |
| Bachelor's Degree or higher | 10,609 (92.1%) | 657 (5.7%) |
| Total | 24,443 (89.3%) | 1,752 (6.4%) |
Employment Occupations by Sex in Aspen Hill
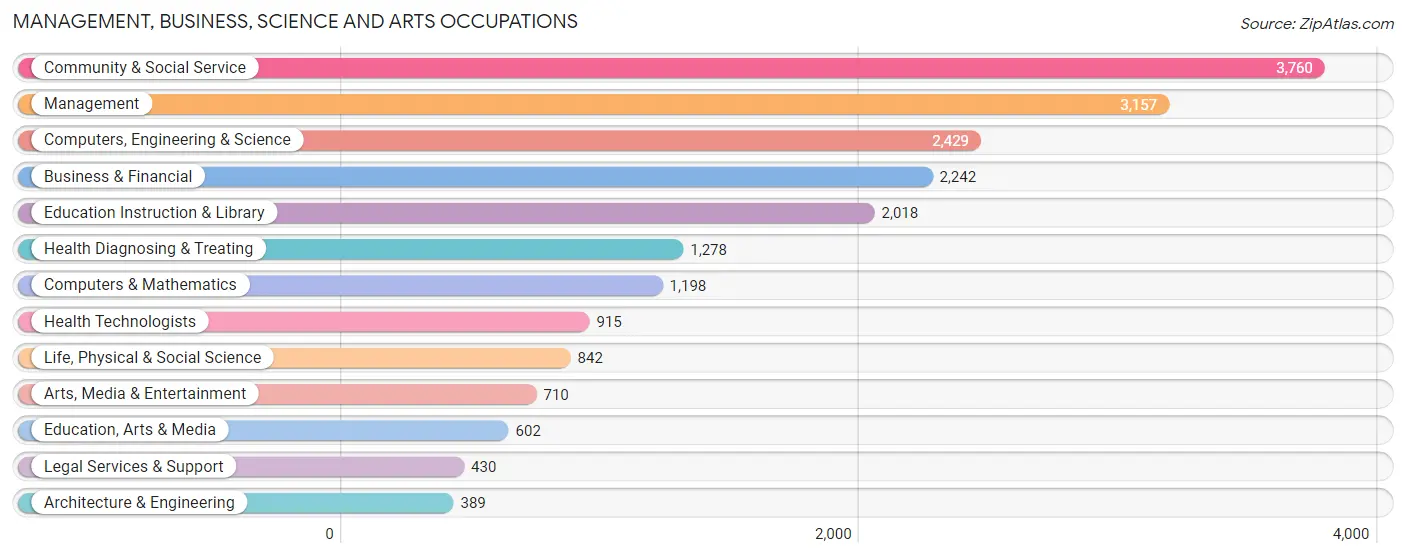
Management, Business, Science and Arts Occupations
The most common Management, Business, Science and Arts occupations in Aspen Hill are Community & Social Service (3,760 | 13.1%), Management (3,157 | 11.0%), Computers, Engineering & Science (2,429 | 8.4%), Business & Financial (2,242 | 7.8%), and Education Instruction & Library (2,018 | 7.0%).
Management, Business, Science and Arts Occupations by Sex
Within the Management, Business, Science and Arts occupations in Aspen Hill, the most male-oriented occupations are Architecture & Engineering (83.8%), Computers & Mathematics (80.7%), and Computers, Engineering & Science (68.9%), while the most female-oriented occupations are Legal Services & Support (81.4%), Education Instruction & Library (69.2%), and Community & Social Service (64.6%).
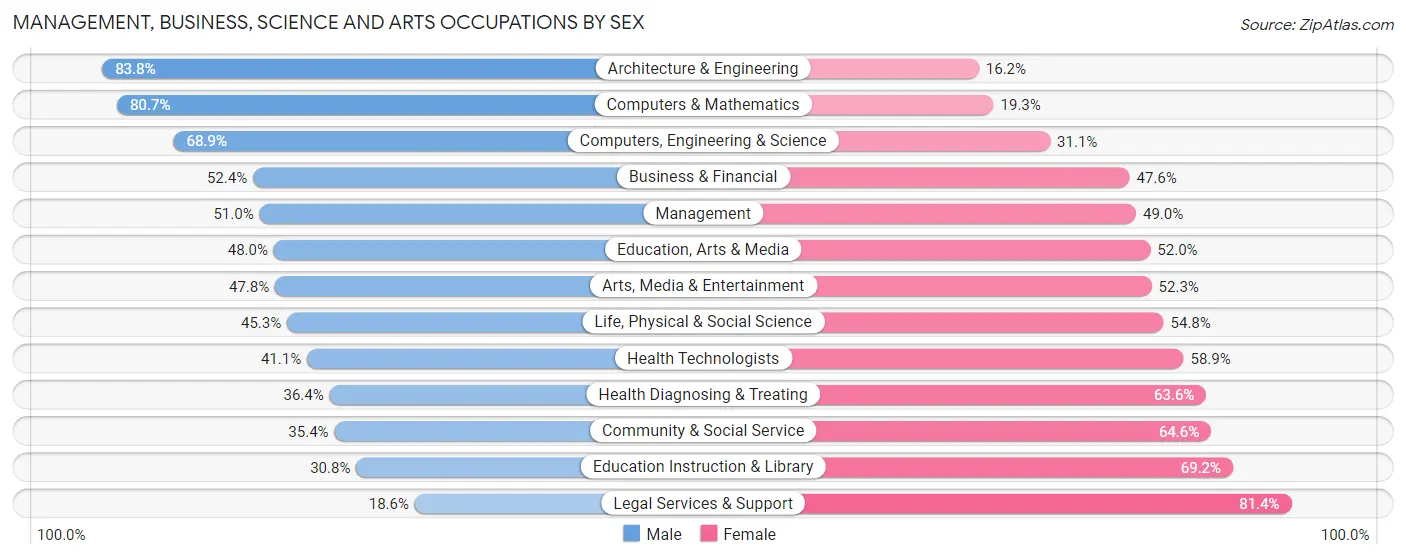
| Occupation | Male | Female |
| Management | 1,610 (51.0%) | 1,547 (49.0%) |
| Business & Financial | 1,174 (52.4%) | 1,068 (47.6%) |
| Computers, Engineering & Science | 1,674 (68.9%) | 755 (31.1%) |
| Computers & Mathematics | 967 (80.7%) | 231 (19.3%) |
| Architecture & Engineering | 326 (83.8%) | 63 (16.2%) |
| Life, Physical & Social Science | 381 (45.3%) | 461 (54.7%) |
| Community & Social Service | 1,330 (35.4%) | 2,430 (64.6%) |
| Education, Arts & Media | 289 (48.0%) | 313 (52.0%) |
| Legal Services & Support | 80 (18.6%) | 350 (81.4%) |
| Education Instruction & Library | 622 (30.8%) | 1,396 (69.2%) |
| Arts, Media & Entertainment | 339 (47.7%) | 371 (52.2%) |
| Health Diagnosing & Treating | 465 (36.4%) | 813 (63.6%) |
| Health Technologists | 376 (41.1%) | 539 (58.9%) |
| Total (Category) | 6,253 (48.6%) | 6,613 (51.4%) |
| Total (Overall) | 14,780 (51.3%) | 14,024 (48.7%) |
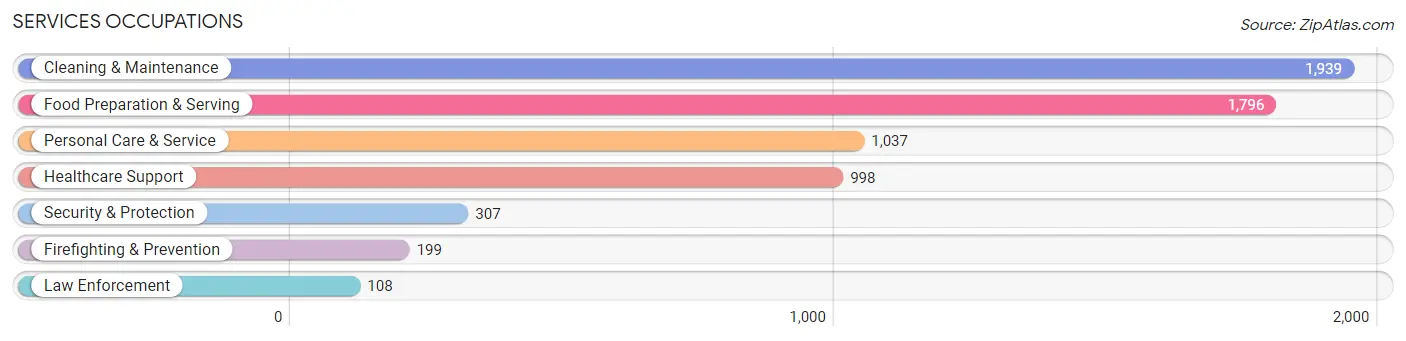
Services Occupations
The most common Services occupations in Aspen Hill are Cleaning & Maintenance (1,939 | 6.7%), Food Preparation & Serving (1,796 | 6.2%), Personal Care & Service (1,037 | 3.6%), Healthcare Support (998 | 3.5%), and Security & Protection (307 | 1.1%).
Services Occupations by Sex
Within the Services occupations in Aspen Hill, the most male-oriented occupations are Law Enforcement (100.0%), Security & Protection (80.8%), and Firefighting & Prevention (70.4%), while the most female-oriented occupations are Personal Care & Service (82.4%), Healthcare Support (78.9%), and Cleaning & Maintenance (74.3%).
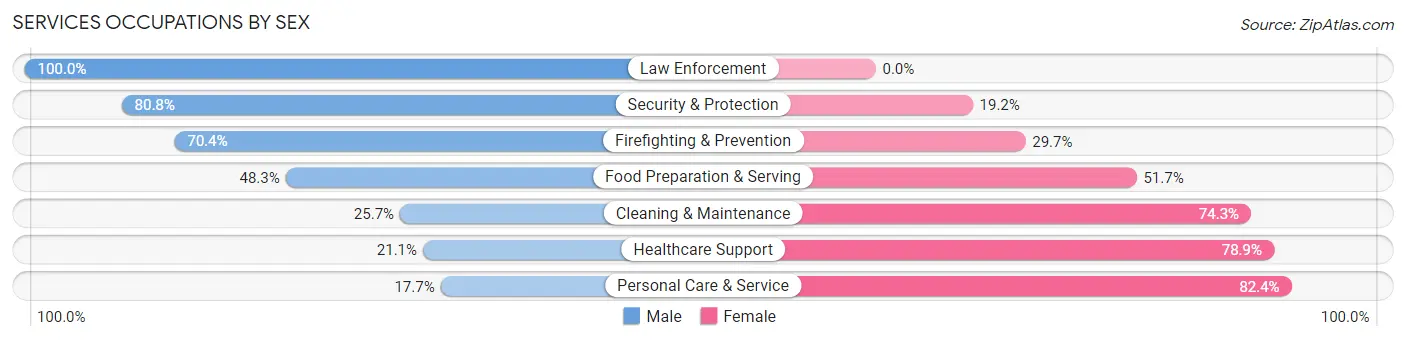
| Occupation | Male | Female |
| Healthcare Support | 211 (21.1%) | 787 (78.9%) |
| Security & Protection | 248 (80.8%) | 59 (19.2%) |
| Firefighting & Prevention | 140 (70.4%) | 59 (29.6%) |
| Law Enforcement | 108 (100.0%) | 0 (0.0%) |
| Food Preparation & Serving | 868 (48.3%) | 928 (51.7%) |
| Cleaning & Maintenance | 498 (25.7%) | 1,441 (74.3%) |
| Personal Care & Service | 183 (17.6%) | 854 (82.4%) |
| Total (Category) | 2,008 (33.0%) | 4,069 (67.0%) |
| Total (Overall) | 14,780 (51.3%) | 14,024 (48.7%) |
Sales and Office Occupations
The most common Sales and Office occupations in Aspen Hill are Office & Administration (2,341 | 8.1%), and Sales & Related (2,181 | 7.6%).

Sales and Office Occupations by Sex
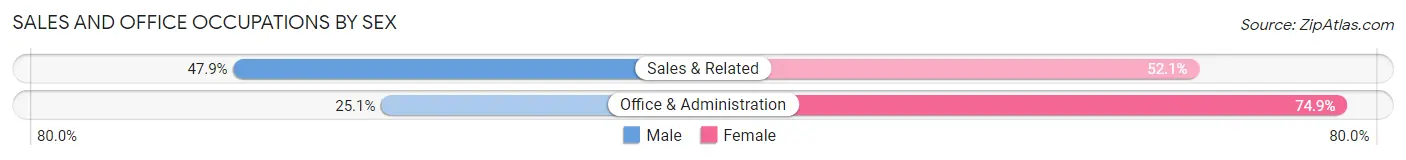
| Occupation | Male | Female |
| Sales & Related | 1,044 (47.9%) | 1,137 (52.1%) |
| Office & Administration | 588 (25.1%) | 1,753 (74.9%) |
| Total (Category) | 1,632 (36.1%) | 2,890 (63.9%) |
| Total (Overall) | 14,780 (51.3%) | 14,024 (48.7%) |
Natural Resources, Construction and Maintenance Occupations
The most common Natural Resources, Construction and Maintenance occupations in Aspen Hill are Construction & Extraction (2,340 | 8.1%), and Installation, Maintenance & Repair (1,316 | 4.6%).
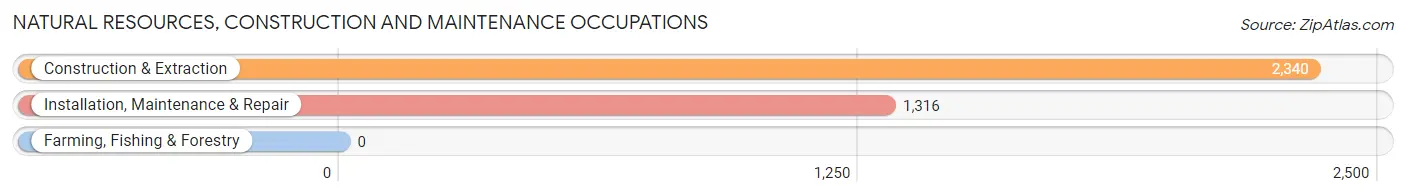
Natural Resources, Construction and Maintenance Occupations by Sex
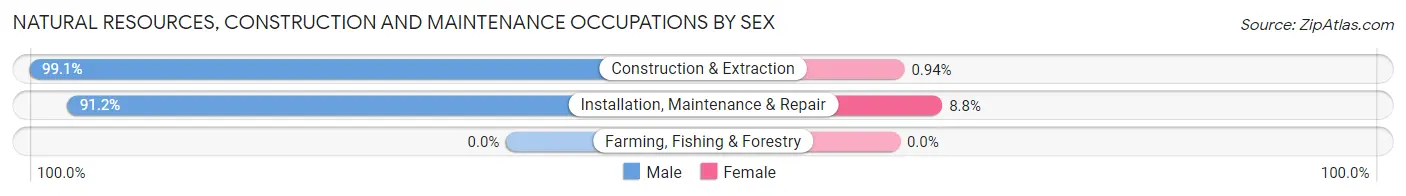
| Occupation | Male | Female |
| Farming, Fishing & Forestry | 0 (0.0%) | 0 (0.0%) |
| Construction & Extraction | 2,318 (99.1%) | 22 (0.9%) |
| Installation, Maintenance & Repair | 1,200 (91.2%) | 116 (8.8%) |
| Total (Category) | 3,518 (96.2%) | 138 (3.8%) |
| Total (Overall) | 14,780 (51.3%) | 14,024 (48.7%) |
Production, Transportation and Moving Occupations
The most common Production, Transportation and Moving occupations in Aspen Hill are Transportation (763 | 2.6%), Production (460 | 1.6%), and Material Moving (460 | 1.6%).
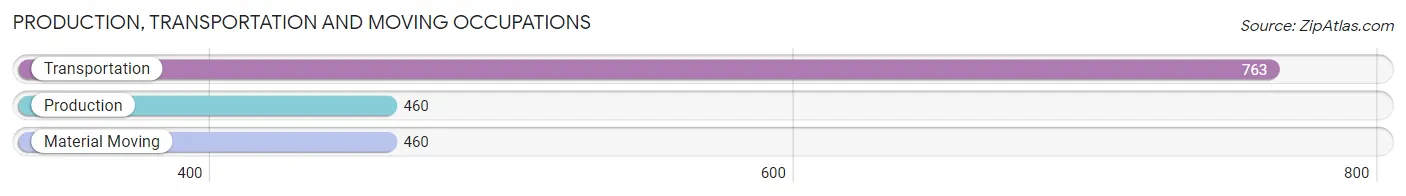
Production, Transportation and Moving Occupations by Sex
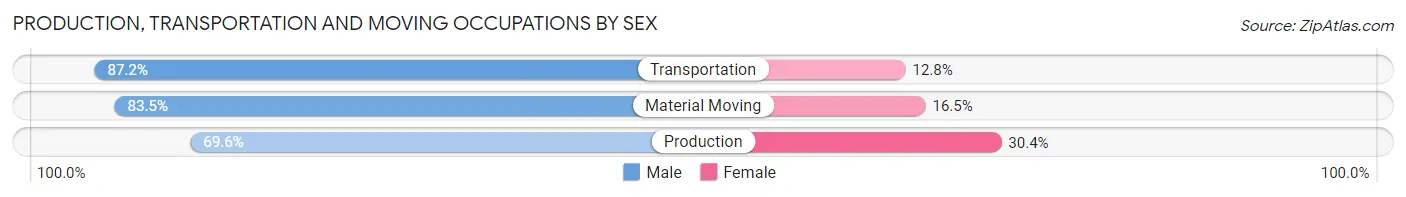
| Occupation | Male | Female |
| Production | 320 (69.6%) | 140 (30.4%) |
| Transportation | 665 (87.2%) | 98 (12.8%) |
| Material Moving | 384 (83.5%) | 76 (16.5%) |
| Total (Category) | 1,369 (81.3%) | 314 (18.7%) |
| Total (Overall) | 14,780 (51.3%) | 14,024 (48.7%) |
Employment Industries by Sex in Aspen Hill
Employment Industries in Aspen Hill
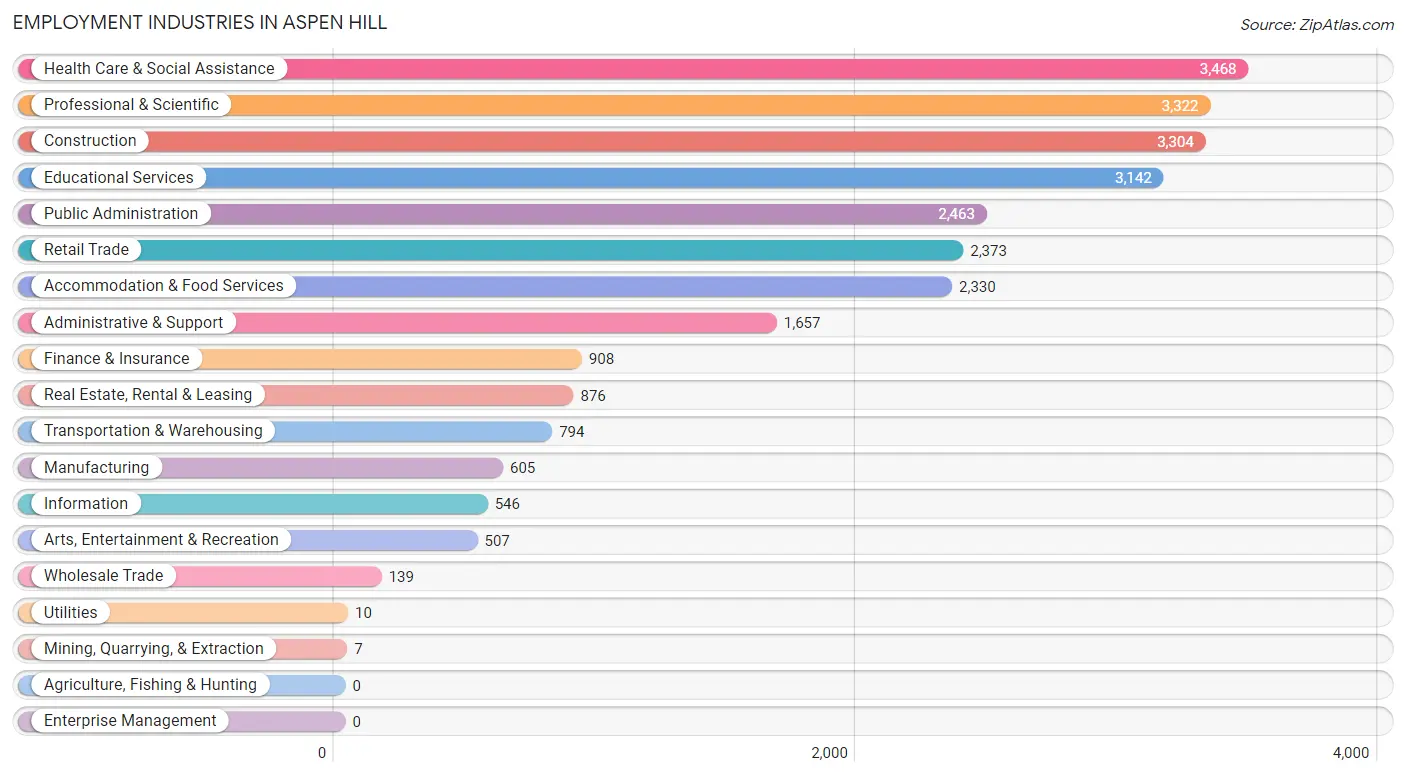
The major employment industries in Aspen Hill include Health Care & Social Assistance (3,468 | 12.0%), Professional & Scientific (3,322 | 11.5%), Construction (3,304 | 11.5%), Educational Services (3,142 | 10.9%), and Public Administration (2,463 | 8.6%).
Employment Industries by Sex in Aspen Hill
The Aspen Hill industries that see more men than women are Mining, Quarrying, & Extraction (100.0%), Construction (97.3%), and Transportation & Warehousing (80.7%), whereas the industries that tend to have a higher number of women are Utilities (100.0%), Health Care & Social Assistance (73.2%), and Administrative & Support (66.3%).
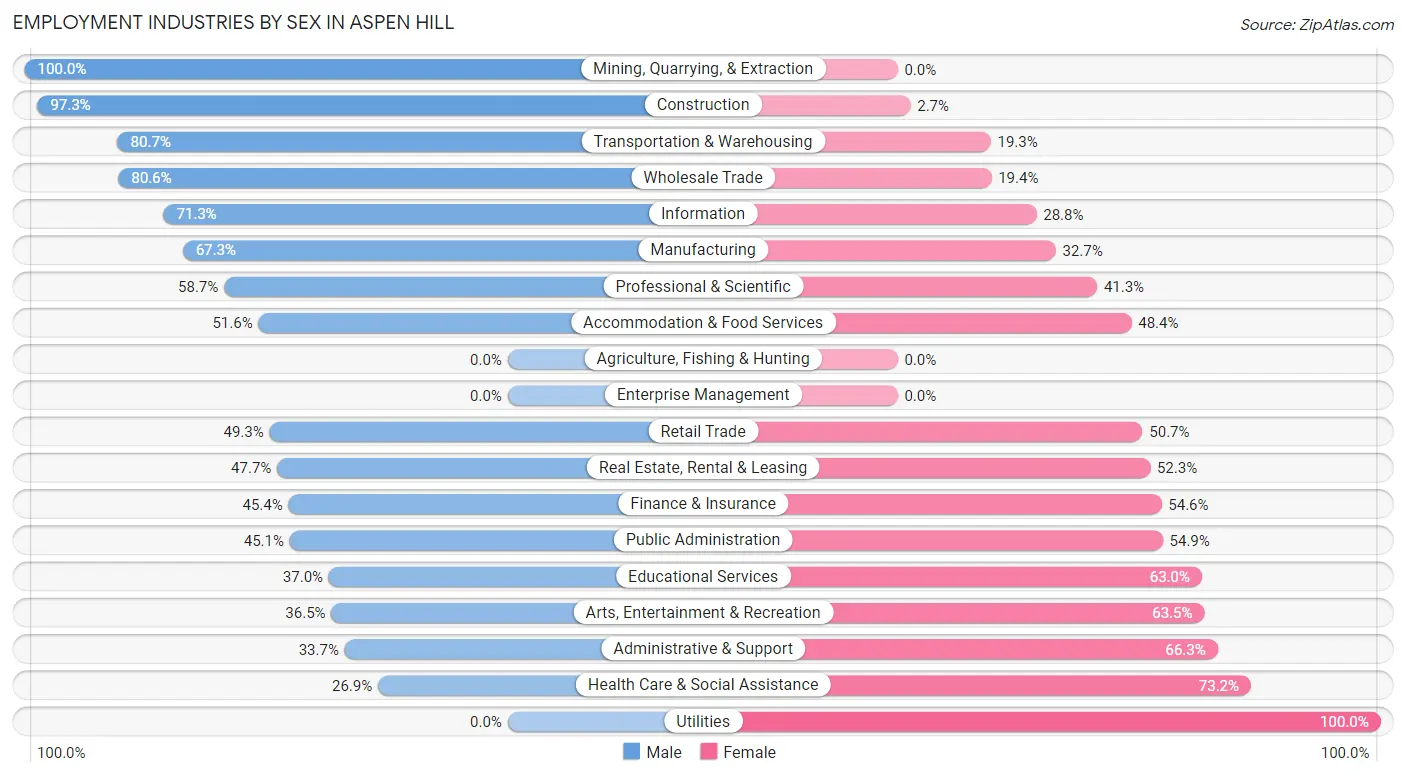
| Industry | Male | Female |
| Agriculture, Fishing & Hunting | 0 (0.0%) | 0 (0.0%) |
| Mining, Quarrying, & Extraction | 7 (100.0%) | 0 (0.0%) |
| Construction | 3,216 (97.3%) | 88 (2.7%) |
| Manufacturing | 407 (67.3%) | 198 (32.7%) |
| Wholesale Trade | 112 (80.6%) | 27 (19.4%) |
| Retail Trade | 1,170 (49.3%) | 1,203 (50.7%) |
| Transportation & Warehousing | 641 (80.7%) | 153 (19.3%) |
| Utilities | 0 (0.0%) | 10 (100.0%) |
| Information | 389 (71.3%) | 157 (28.7%) |
| Finance & Insurance | 412 (45.4%) | 496 (54.6%) |
| Real Estate, Rental & Leasing | 418 (47.7%) | 458 (52.3%) |
| Professional & Scientific | 1,950 (58.7%) | 1,372 (41.3%) |
| Enterprise Management | 0 (0.0%) | 0 (0.0%) |
| Administrative & Support | 559 (33.7%) | 1,098 (66.3%) |
| Educational Services | 1,163 (37.0%) | 1,979 (63.0%) |
| Health Care & Social Assistance | 931 (26.9%) | 2,537 (73.2%) |
| Arts, Entertainment & Recreation | 185 (36.5%) | 322 (63.5%) |
| Accommodation & Food Services | 1,202 (51.6%) | 1,128 (48.4%) |
| Public Administration | 1,111 (45.1%) | 1,352 (54.9%) |
| Total | 14,780 (51.3%) | 14,024 (48.7%) |
Education in Aspen Hill
School Enrollment in Aspen Hill
The most common levels of schooling among the 14,855 students in Aspen Hill are high school (3,779 | 25.4%), middle school (3,315 | 22.3%), and elementary school (3,016 | 20.3%).
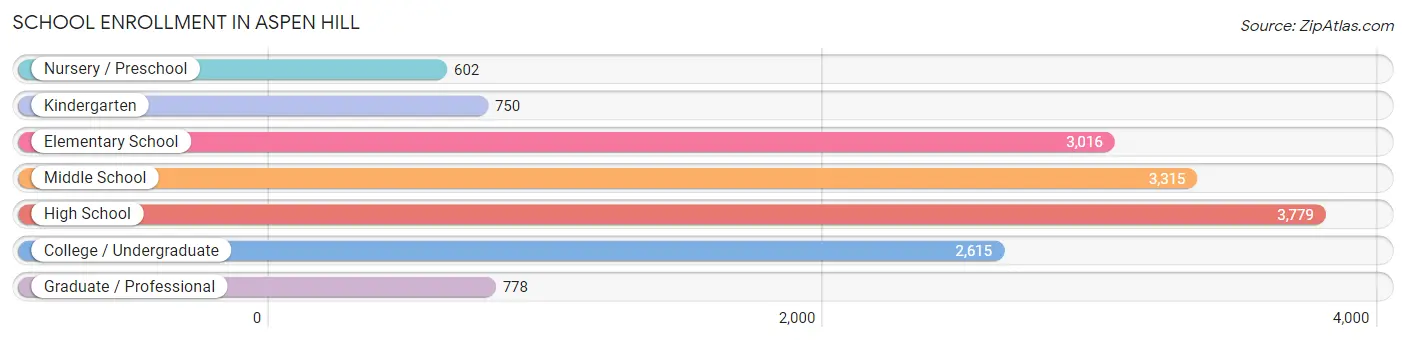
| School Level | # Students | % Students |
| Nursery / Preschool | 602 | 4.1% |
| Kindergarten | 750 | 5.1% |
| Elementary School | 3,016 | 20.3% |
| Middle School | 3,315 | 22.3% |
| High School | 3,779 | 25.4% |
| College / Undergraduate | 2,615 | 17.6% |
| Graduate / Professional | 778 | 5.2% |
| Total | 14,855 | 100.0% |
School Enrollment by Age by Funding Source in Aspen Hill
Out of a total of 14,855 students who are enrolled in schools in Aspen Hill, 3,328 (22.4%) attend a private institution, while the remaining 11,527 (77.6%) are enrolled in public schools. The age group of 3 to 4 year olds has the highest likelihood of being enrolled in private schools, with 307 (55.7% in the age bracket) enrolled. Conversely, the age group of 18 to 19 year olds has the lowest likelihood of being enrolled in a private school, with 1,078 (88.5% in the age bracket) attending a public institution.
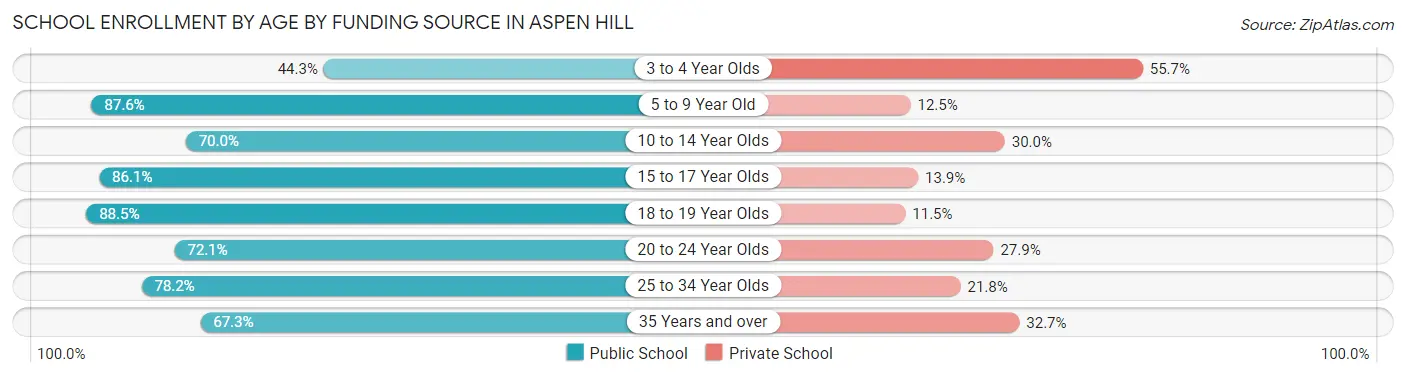
| Age Bracket | Public School | Private School |
| 3 to 4 Year Olds | 244 (44.3%) | 307 (55.7%) |
| 5 to 9 Year Old | 2,919 (87.5%) | 415 (12.4%) |
| 10 to 14 Year Olds | 2,889 (70.0%) | 1,239 (30.0%) |
| 15 to 17 Year Olds | 2,211 (86.1%) | 356 (13.9%) |
| 18 to 19 Year Olds | 1,078 (88.5%) | 140 (11.5%) |
| 20 to 24 Year Olds | 987 (72.1%) | 382 (27.9%) |
| 25 to 34 Year Olds | 496 (78.2%) | 138 (21.8%) |
| 35 Years and over | 709 (67.3%) | 345 (32.7%) |
| Total | 11,527 (77.6%) | 3,328 (22.4%) |
Educational Attainment by Field of Study in Aspen Hill
Business (3,015 | 18.6%), social sciences (2,122 | 13.1%), education (1,488 | 9.2%), science & technology (1,423 | 8.8%), and bio, nature & agricultural (1,270 | 7.8%) are the most common fields of study among 16,237 individuals in Aspen Hill who have obtained a bachelor's degree or higher.
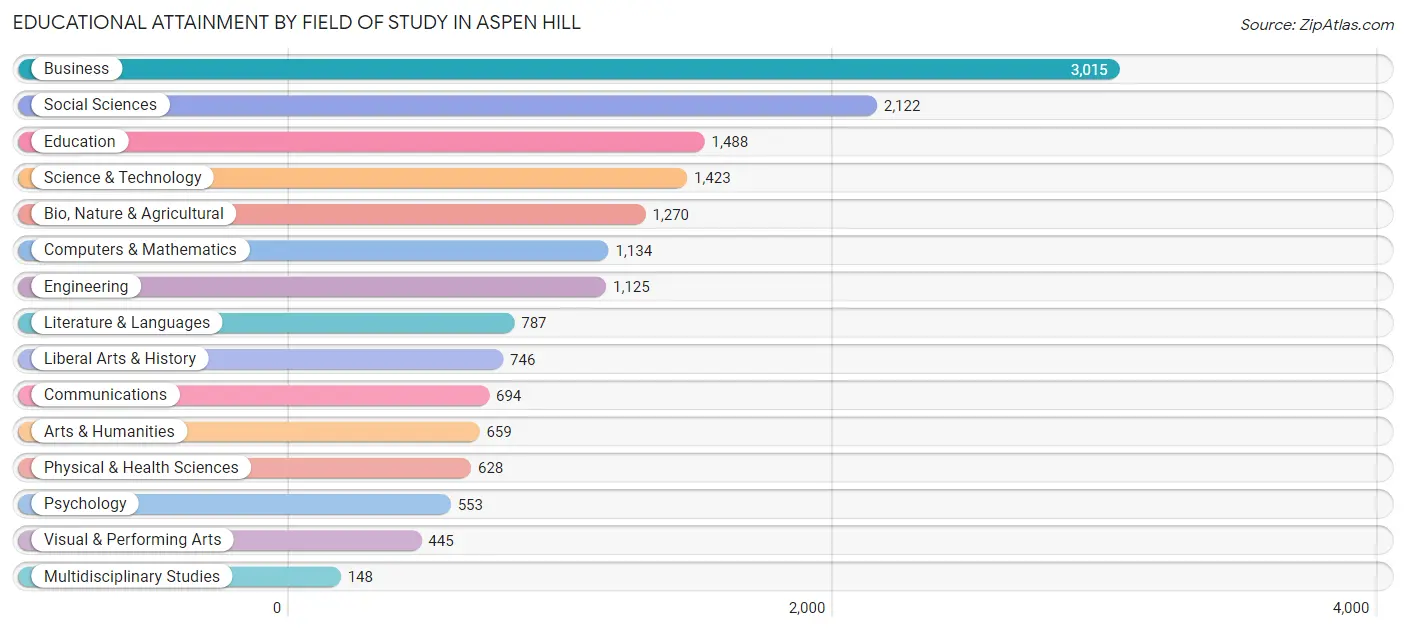
| Field of Study | # Graduates | % Graduates |
| Computers & Mathematics | 1,134 | 7.0% |
| Bio, Nature & Agricultural | 1,270 | 7.8% |
| Physical & Health Sciences | 628 | 3.9% |
| Psychology | 553 | 3.4% |
| Social Sciences | 2,122 | 13.1% |
| Engineering | 1,125 | 6.9% |
| Multidisciplinary Studies | 148 | 0.9% |
| Science & Technology | 1,423 | 8.8% |
| Business | 3,015 | 18.6% |
| Education | 1,488 | 9.2% |
| Literature & Languages | 787 | 4.9% |
| Liberal Arts & History | 746 | 4.6% |
| Visual & Performing Arts | 445 | 2.7% |
| Communications | 694 | 4.3% |
| Arts & Humanities | 659 | 4.1% |
| Total | 16,237 | 100.0% |
Transportation & Commute in Aspen Hill
Vehicle Availability by Sex in Aspen Hill
The most prevalent vehicle ownership categories in Aspen Hill are males with 2 vehicles (5,317, accounting for 36.1%) and females with 2 vehicles (4,835, making up 40.3%).
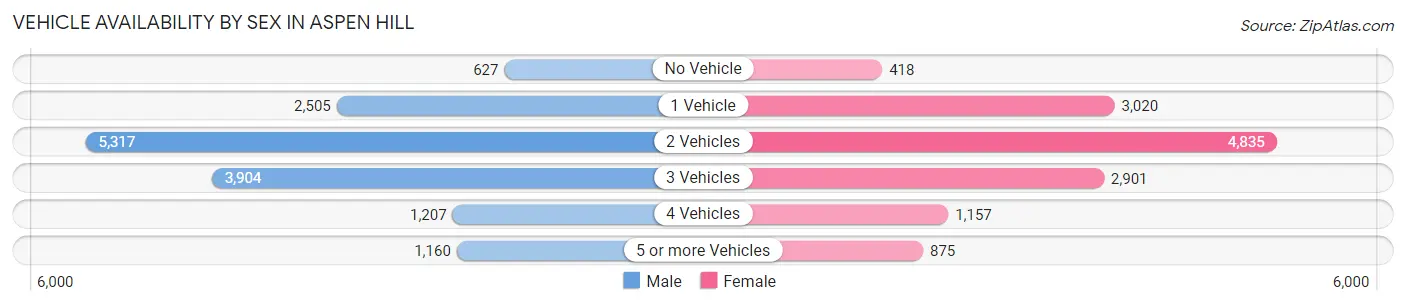
| Vehicles Available | Male | Female |
| No Vehicle | 627 (4.3%) | 418 (3.2%) |
| 1 Vehicle | 2,505 (17.0%) | 3,020 (22.9%) |
| 2 Vehicles | 5,317 (36.1%) | 4,835 (36.6%) |
| 3 Vehicles | 3,904 (26.5%) | 2,901 (22.0%) |
| 4 Vehicles | 1,207 (8.2%) | 1,157 (8.8%) |
| 5 or more Vehicles | 1,160 (7.9%) | 875 (6.6%) |
| Total | 14,720 (100.0%) | 13,206 (100.0%) |
Commute Time in Aspen Hill
The most frequently occuring commute durations in Aspen Hill are 20 to 24 minutes (3,629 commuters, 16.0%), 30 to 34 minutes (3,624 commuters, 16.0%), and 60 to 89 minutes (3,162 commuters, 14.0%).
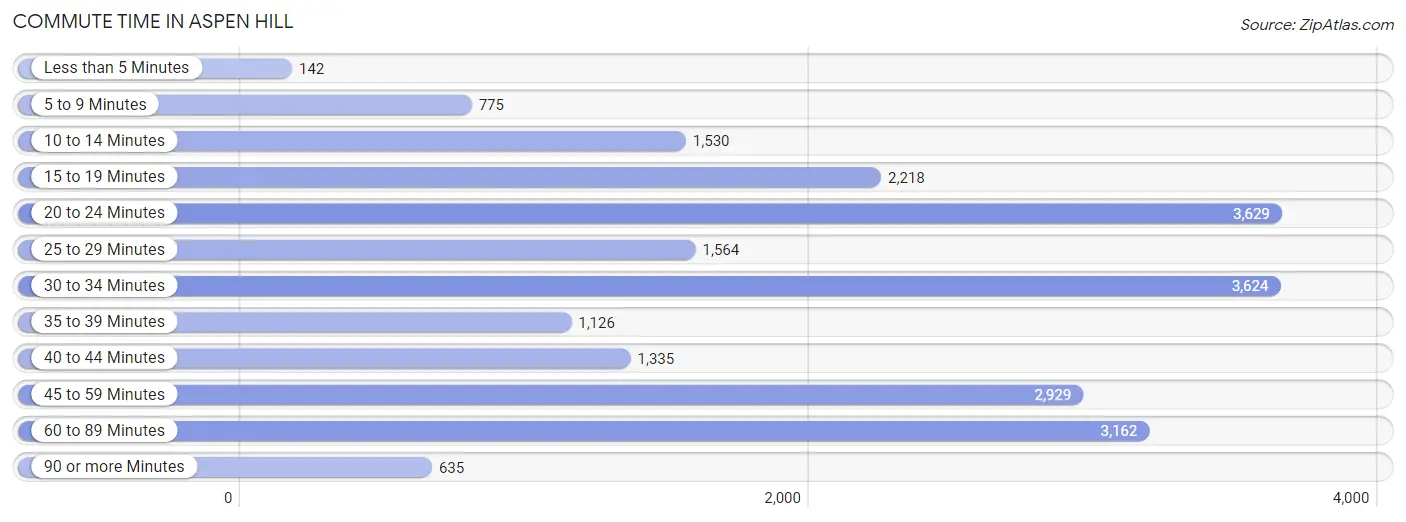
| Commute Time | # Commuters | % Commuters |
| Less than 5 Minutes | 142 | 0.6% |
| 5 to 9 Minutes | 775 | 3.4% |
| 10 to 14 Minutes | 1,530 | 6.8% |
| 15 to 19 Minutes | 2,218 | 9.8% |
| 20 to 24 Minutes | 3,629 | 16.0% |
| 25 to 29 Minutes | 1,564 | 6.9% |
| 30 to 34 Minutes | 3,624 | 16.0% |
| 35 to 39 Minutes | 1,126 | 5.0% |
| 40 to 44 Minutes | 1,335 | 5.9% |
| 45 to 59 Minutes | 2,929 | 12.9% |
| 60 to 89 Minutes | 3,162 | 14.0% |
| 90 or more Minutes | 635 | 2.8% |
Commute Time by Sex in Aspen Hill
The most common commute times in Aspen Hill are 20 to 24 minutes (1,987 commuters, 16.1%) for males and 30 to 34 minutes (1,788 commuters, 17.3%) for females.
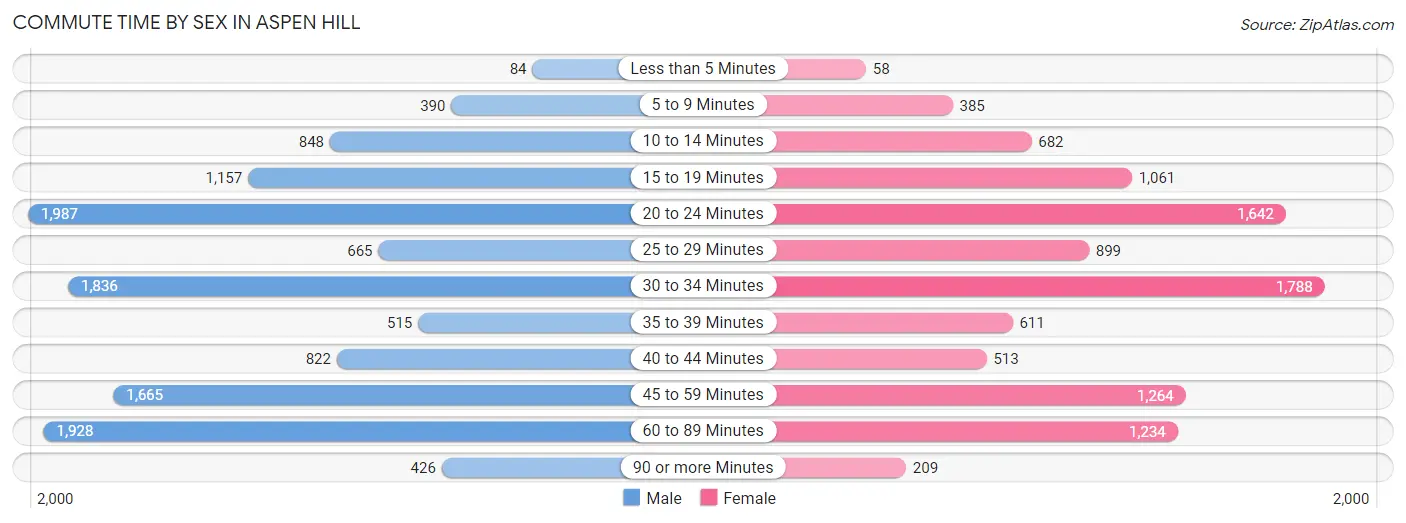
| Commute Time | Male | Female |
| Less than 5 Minutes | 84 (0.7%) | 58 (0.6%) |
| 5 to 9 Minutes | 390 (3.2%) | 385 (3.7%) |
| 10 to 14 Minutes | 848 (6.9%) | 682 (6.6%) |
| 15 to 19 Minutes | 1,157 (9.4%) | 1,061 (10.3%) |
| 20 to 24 Minutes | 1,987 (16.1%) | 1,642 (15.9%) |
| 25 to 29 Minutes | 665 (5.4%) | 899 (8.7%) |
| 30 to 34 Minutes | 1,836 (14.9%) | 1,788 (17.3%) |
| 35 to 39 Minutes | 515 (4.2%) | 611 (5.9%) |
| 40 to 44 Minutes | 822 (6.7%) | 513 (5.0%) |
| 45 to 59 Minutes | 1,665 (13.5%) | 1,264 (12.2%) |
| 60 to 89 Minutes | 1,928 (15.7%) | 1,234 (11.9%) |
| 90 or more Minutes | 426 (3.5%) | 209 (2.0%) |
Time of Departure to Work by Sex in Aspen Hill
The most frequent times of departure to work in Aspen Hill are 7:00 AM to 7:29 AM (2,489, 20.2%) for males and 7:00 AM to 7:29 AM (1,950, 18.9%) for females.
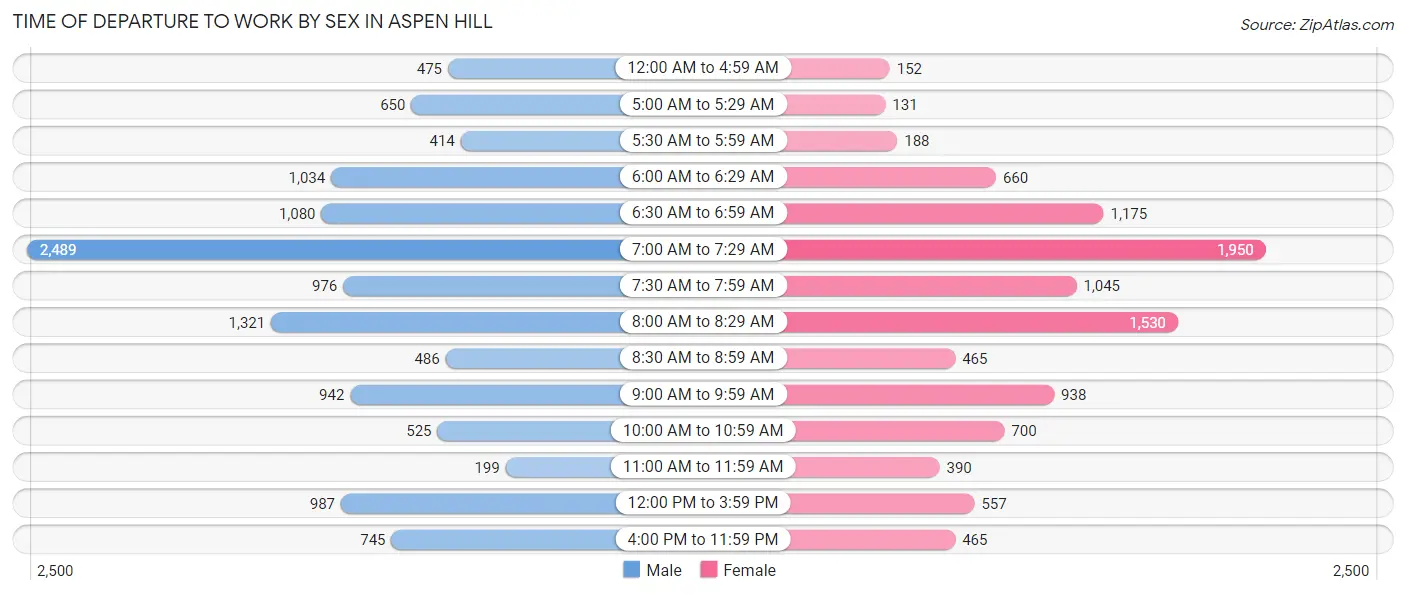
| Time of Departure | Male | Female |
| 12:00 AM to 4:59 AM | 475 (3.8%) | 152 (1.5%) |
| 5:00 AM to 5:29 AM | 650 (5.3%) | 131 (1.3%) |
| 5:30 AM to 5:59 AM | 414 (3.4%) | 188 (1.8%) |
| 6:00 AM to 6:29 AM | 1,034 (8.4%) | 660 (6.4%) |
| 6:30 AM to 6:59 AM | 1,080 (8.8%) | 1,175 (11.4%) |
| 7:00 AM to 7:29 AM | 2,489 (20.2%) | 1,950 (18.9%) |
| 7:30 AM to 7:59 AM | 976 (7.9%) | 1,045 (10.1%) |
| 8:00 AM to 8:29 AM | 1,321 (10.7%) | 1,530 (14.8%) |
| 8:30 AM to 8:59 AM | 486 (3.9%) | 465 (4.5%) |
| 9:00 AM to 9:59 AM | 942 (7.6%) | 938 (9.1%) |
| 10:00 AM to 10:59 AM | 525 (4.3%) | 700 (6.8%) |
| 11:00 AM to 11:59 AM | 199 (1.6%) | 390 (3.8%) |
| 12:00 PM to 3:59 PM | 987 (8.0%) | 557 (5.4%) |
| 4:00 PM to 11:59 PM | 745 (6.0%) | 465 (4.5%) |
| Total | 12,323 (100.0%) | 10,346 (100.0%) |
Housing Occupancy in Aspen Hill
Occupancy by Ownership in Aspen Hill
Of the total 17,369 dwellings in Aspen Hill, owner-occupied units account for 11,058 (63.7%), while renter-occupied units make up 6,311 (36.3%).
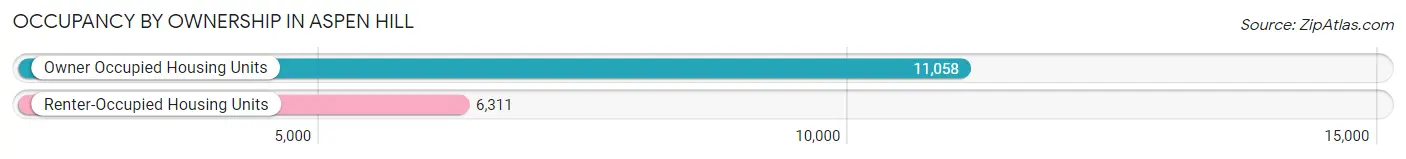
| Occupancy | # Housing Units | % Housing Units |
| Owner Occupied Housing Units | 11,058 | 63.7% |
| Renter-Occupied Housing Units | 6,311 | 36.3% |
| Total Occupied Housing Units | 17,369 | 100.0% |
Occupancy by Household Size in Aspen Hill
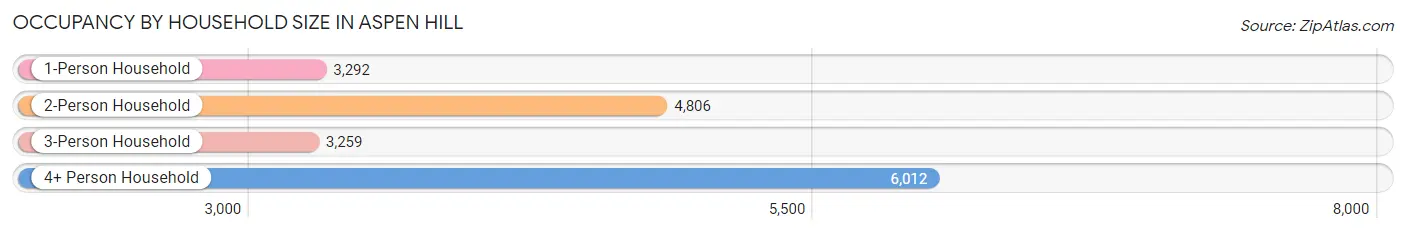
| Household Size | # Housing Units | % Housing Units |
| 1-Person Household | 3,292 | 19.0% |
| 2-Person Household | 4,806 | 27.7% |
| 3-Person Household | 3,259 | 18.8% |
| 4+ Person Household | 6,012 | 34.6% |
| Total Housing Units | 17,369 | 100.0% |
Occupancy by Ownership by Household Size in Aspen Hill
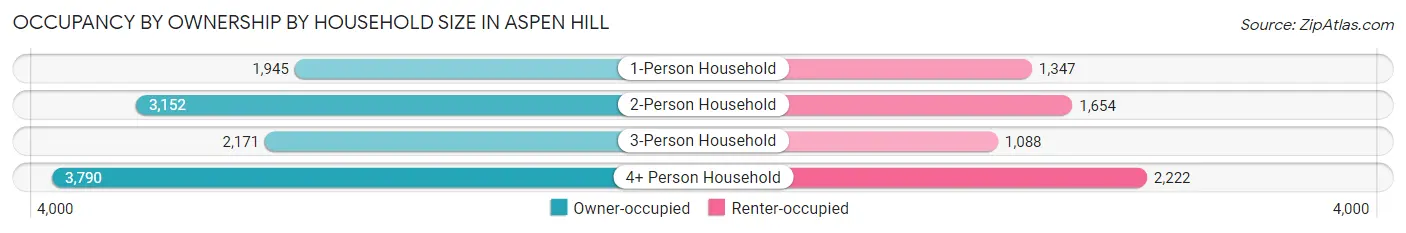
| Household Size | Owner-occupied | Renter-occupied |
| 1-Person Household | 1,945 (59.1%) | 1,347 (40.9%) |
| 2-Person Household | 3,152 (65.6%) | 1,654 (34.4%) |
| 3-Person Household | 2,171 (66.6%) | 1,088 (33.4%) |
| 4+ Person Household | 3,790 (63.0%) | 2,222 (37.0%) |
| Total Housing Units | 11,058 (63.7%) | 6,311 (36.3%) |
Occupancy by Educational Attainment in Aspen Hill
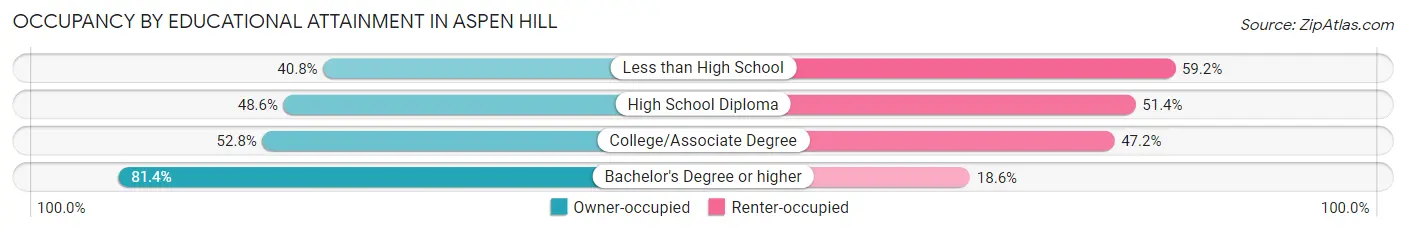
| Household Size | Owner-occupied | Renter-occupied |
| Less than High School | 889 (40.8%) | 1,292 (59.2%) |
| High School Diploma | 1,642 (48.6%) | 1,736 (51.4%) |
| College/Associate Degree | 2,008 (52.8%) | 1,795 (47.2%) |
| Bachelor's Degree or higher | 6,519 (81.4%) | 1,488 (18.6%) |
Occupancy by Age of Householder in Aspen Hill
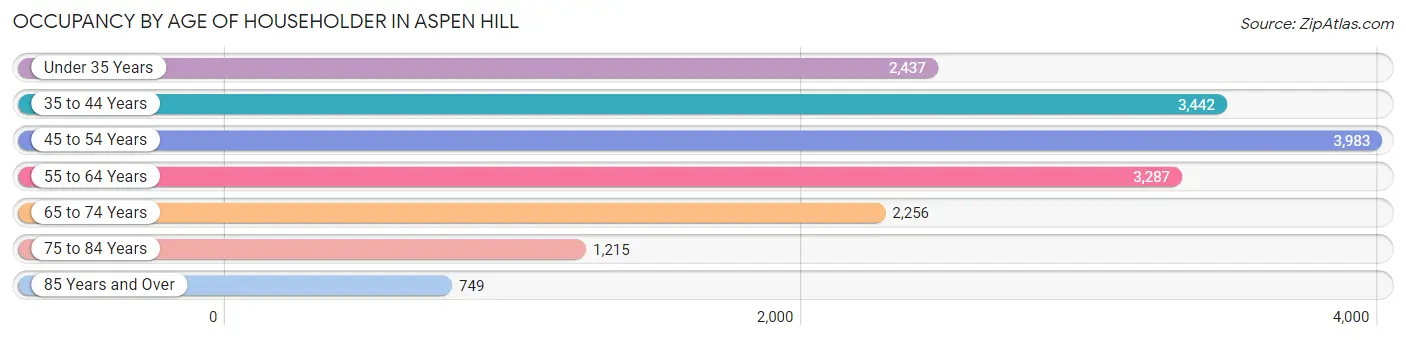
| Age Bracket | # Households | % Households |
| Under 35 Years | 2,437 | 14.0% |
| 35 to 44 Years | 3,442 | 19.8% |
| 45 to 54 Years | 3,983 | 22.9% |
| 55 to 64 Years | 3,287 | 18.9% |
| 65 to 74 Years | 2,256 | 13.0% |
| 75 to 84 Years | 1,215 | 7.0% |
| 85 Years and Over | 749 | 4.3% |
| Total | 17,369 | 100.0% |
Housing Finances in Aspen Hill
Median Income by Occupancy in Aspen Hill
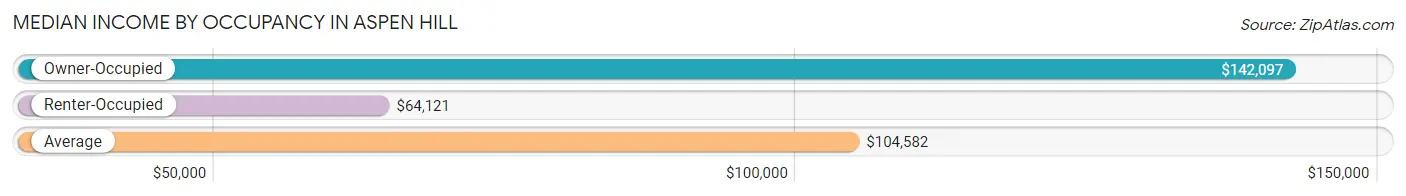
| Occupancy Type | # Households | Median Income |
| Owner-Occupied | 11,058 (63.7%) | $142,097 |
| Renter-Occupied | 6,311 (36.3%) | $64,121 |
| Average | 17,369 (100.0%) | $104,582 |
Occupancy by Householder Income Bracket in Aspen Hill
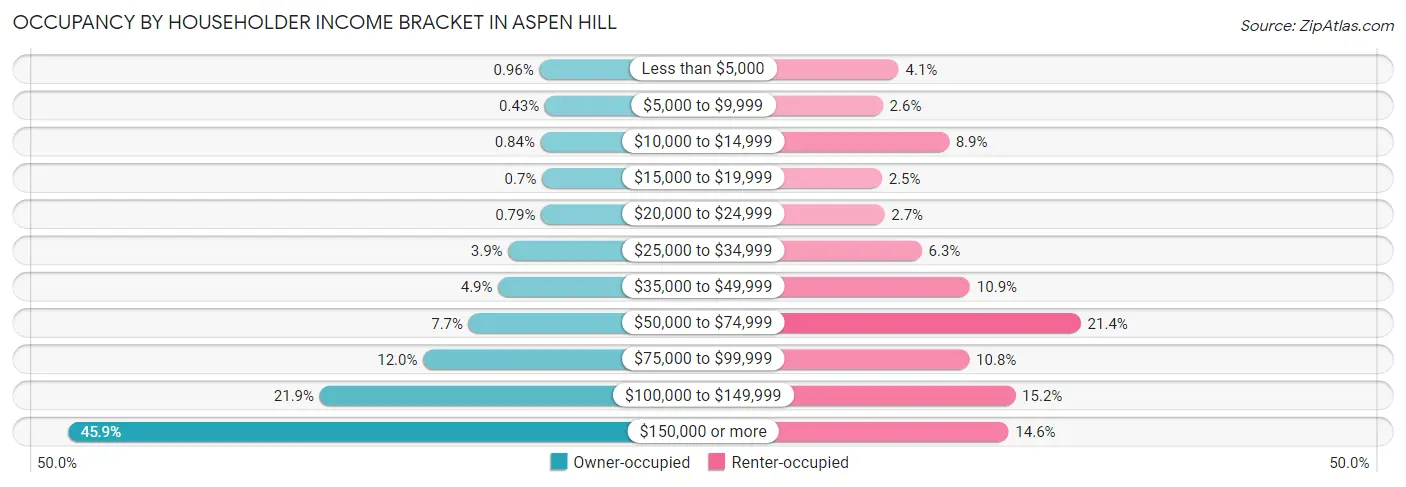
| Income Bracket | Owner-occupied | Renter-occupied |
| Less than $5,000 | 106 (1.0%) | 259 (4.1%) |
| $5,000 to $9,999 | 48 (0.4%) | 163 (2.6%) |
| $10,000 to $14,999 | 93 (0.8%) | 560 (8.9%) |
| $15,000 to $19,999 | 77 (0.7%) | 158 (2.5%) |
| $20,000 to $24,999 | 87 (0.8%) | 173 (2.7%) |
| $25,000 to $34,999 | 434 (3.9%) | 397 (6.3%) |
| $35,000 to $49,999 | 540 (4.9%) | 687 (10.9%) |
| $50,000 to $74,999 | 850 (7.7%) | 1,353 (21.4%) |
| $75,000 to $99,999 | 1,330 (12.0%) | 683 (10.8%) |
| $100,000 to $149,999 | 2,420 (21.9%) | 959 (15.2%) |
| $150,000 or more | 5,073 (45.9%) | 919 (14.6%) |
| Total | 11,058 (100.0%) | 6,311 (100.0%) |
Monthly Housing Cost Tiers in Aspen Hill
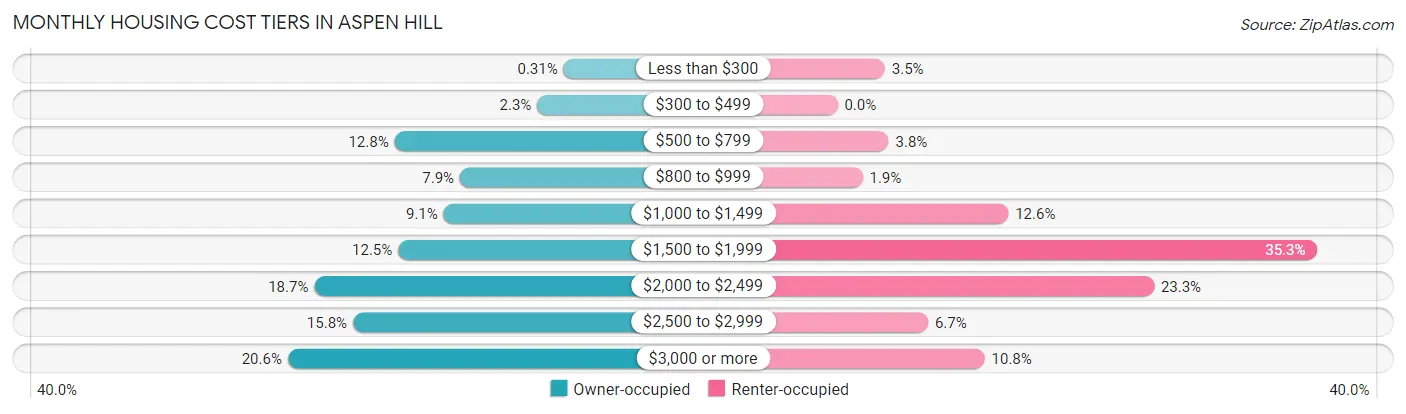
| Monthly Cost | Owner-occupied | Renter-occupied |
| Less than $300 | 34 (0.3%) | 220 (3.5%) |
| $300 to $499 | 249 (2.2%) | 0 (0.0%) |
| $500 to $799 | 1,411 (12.8%) | 238 (3.8%) |
| $800 to $999 | 878 (7.9%) | 117 (1.8%) |
| $1,000 to $1,499 | 1,011 (9.1%) | 794 (12.6%) |
| $1,500 to $1,999 | 1,381 (12.5%) | 2,230 (35.3%) |
| $2,000 to $2,499 | 2,065 (18.7%) | 1,471 (23.3%) |
| $2,500 to $2,999 | 1,749 (15.8%) | 421 (6.7%) |
| $3,000 or more | 2,280 (20.6%) | 684 (10.8%) |
| Total | 11,058 (100.0%) | 6,311 (100.0%) |
Physical Housing Characteristics in Aspen Hill
Housing Structures in Aspen Hill
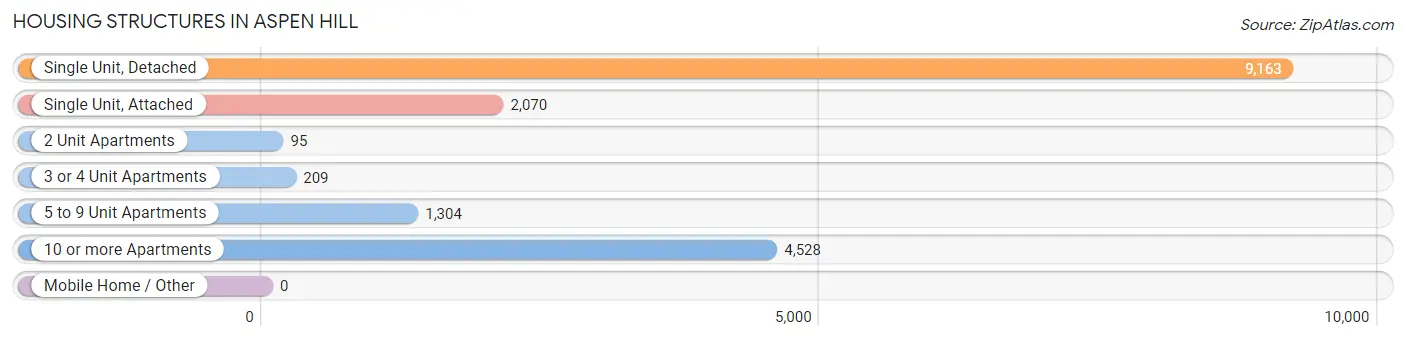
| Structure Type | # Housing Units | % Housing Units |
| Single Unit, Detached | 9,163 | 52.7% |
| Single Unit, Attached | 2,070 | 11.9% |
| 2 Unit Apartments | 95 | 0.5% |
| 3 or 4 Unit Apartments | 209 | 1.2% |
| 5 to 9 Unit Apartments | 1,304 | 7.5% |
| 10 or more Apartments | 4,528 | 26.1% |
| Mobile Home / Other | 0 | 0.0% |
| Total | 17,369 | 100.0% |
Housing Structures by Occupancy in Aspen Hill
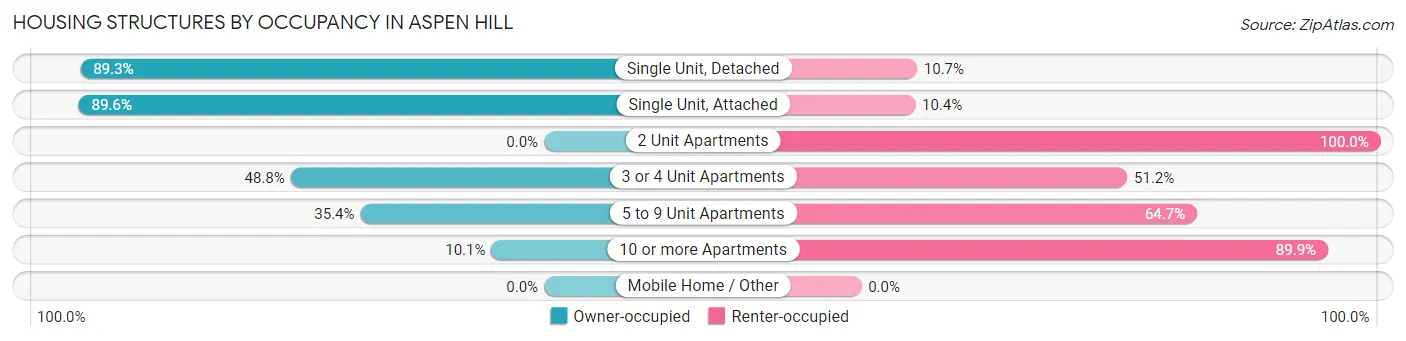
| Structure Type | Owner-occupied | Renter-occupied |
| Single Unit, Detached | 8,181 (89.3%) | 982 (10.7%) |
| Single Unit, Attached | 1,855 (89.6%) | 215 (10.4%) |
| 2 Unit Apartments | 0 (0.0%) | 95 (100.0%) |
| 3 or 4 Unit Apartments | 102 (48.8%) | 107 (51.2%) |
| 5 to 9 Unit Apartments | 461 (35.3%) | 843 (64.6%) |
| 10 or more Apartments | 459 (10.1%) | 4,069 (89.9%) |
| Mobile Home / Other | 0 (0.0%) | 0 (0.0%) |
| Total | 11,058 (63.7%) | 6,311 (36.3%) |
Housing Structures by Number of Rooms in Aspen Hill
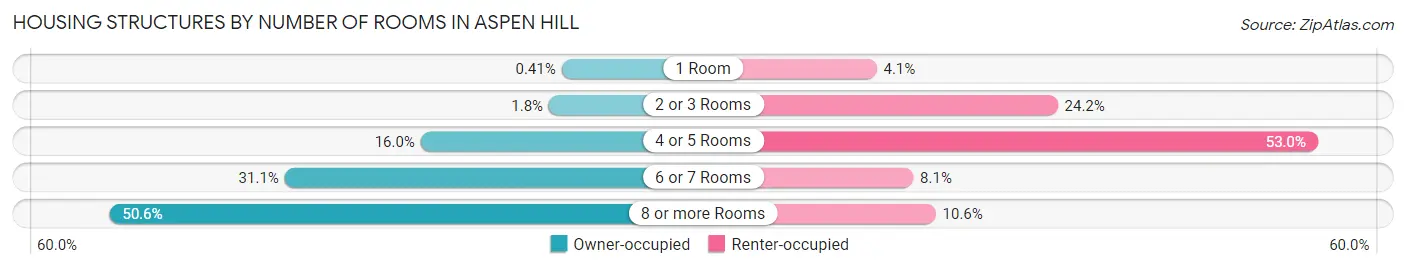
| Number of Rooms | Owner-occupied | Renter-occupied |
| 1 Room | 45 (0.4%) | 256 (4.1%) |
| 2 or 3 Rooms | 200 (1.8%) | 1,525 (24.2%) |
| 4 or 5 Rooms | 1,774 (16.0%) | 3,347 (53.0%) |
| 6 or 7 Rooms | 3,444 (31.1%) | 513 (8.1%) |
| 8 or more Rooms | 5,595 (50.6%) | 670 (10.6%) |
| Total | 11,058 (100.0%) | 6,311 (100.0%) |
Housing Structure by Heating Type in Aspen Hill
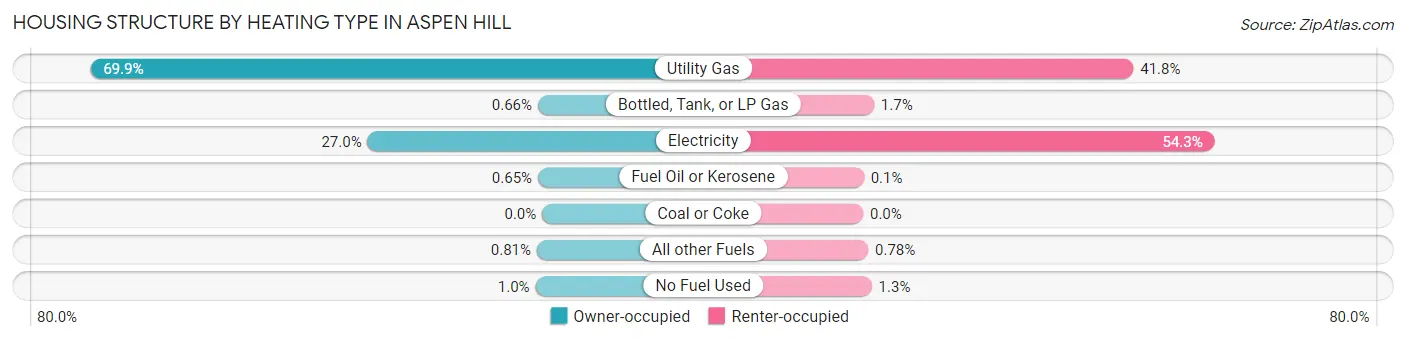
| Heating Type | Owner-occupied | Renter-occupied |
| Utility Gas | 7,724 (69.9%) | 2,637 (41.8%) |
| Bottled, Tank, or LP Gas | 73 (0.7%) | 106 (1.7%) |
| Electricity | 2,985 (27.0%) | 3,429 (54.3%) |
| Fuel Oil or Kerosene | 72 (0.6%) | 6 (0.1%) |
| Coal or Coke | 0 (0.0%) | 0 (0.0%) |
| All other Fuels | 90 (0.8%) | 49 (0.8%) |
| No Fuel Used | 114 (1.0%) | 84 (1.3%) |
| Total | 11,058 (100.0%) | 6,311 (100.0%) |
Household Vehicle Usage in Aspen Hill
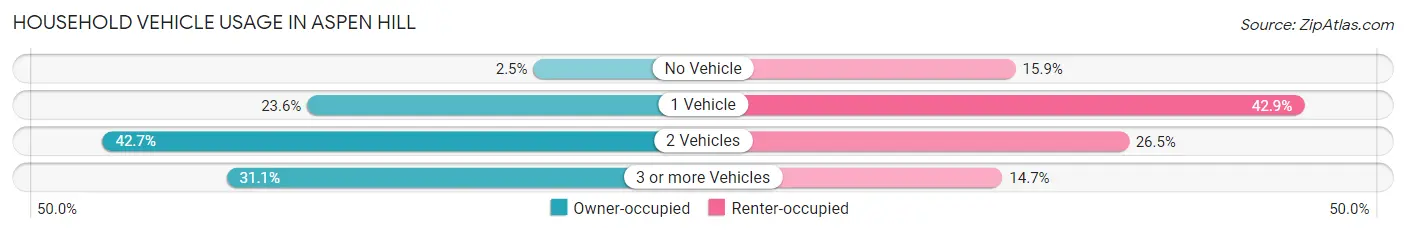
| Vehicles per Household | Owner-occupied | Renter-occupied |
| No Vehicle | 278 (2.5%) | 1,006 (15.9%) |
| 1 Vehicle | 2,612 (23.6%) | 2,705 (42.9%) |
| 2 Vehicles | 4,724 (42.7%) | 1,672 (26.5%) |
| 3 or more Vehicles | 3,444 (31.1%) | 928 (14.7%) |
| Total | 11,058 (100.0%) | 6,311 (100.0%) |
Real Estate & Mortgages in Aspen Hill
Real Estate and Mortgage Overview in Aspen Hill
| Characteristic | Without Mortgage | With Mortgage |
| Housing Units | 3,085 | 7,973 |
| Median Property Value | $509,300 | $492,100 |
| Median Household Income | $125,650 | $3,925 |
| Monthly Housing Costs | $777 | $2,236 |
| Real Estate Taxes | $4,477 | $97 |
Property Value by Mortgage Status in Aspen Hill
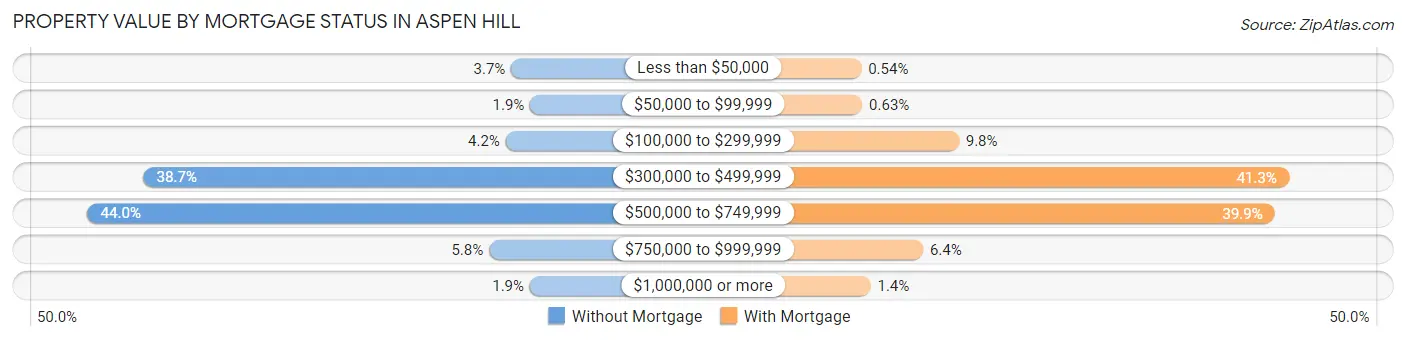
| Property Value | Without Mortgage | With Mortgage |
| Less than $50,000 | 113 (3.7%) | 43 (0.5%) |
| $50,000 to $99,999 | 57 (1.8%) | 50 (0.6%) |
| $100,000 to $299,999 | 129 (4.2%) | 784 (9.8%) |
| $300,000 to $499,999 | 1,193 (38.7%) | 3,289 (41.2%) |
| $500,000 to $749,999 | 1,357 (44.0%) | 3,181 (39.9%) |
| $750,000 to $999,999 | 178 (5.8%) | 512 (6.4%) |
| $1,000,000 or more | 58 (1.9%) | 114 (1.4%) |
| Total | 3,085 (100.0%) | 7,973 (100.0%) |
Household Income by Mortgage Status in Aspen Hill
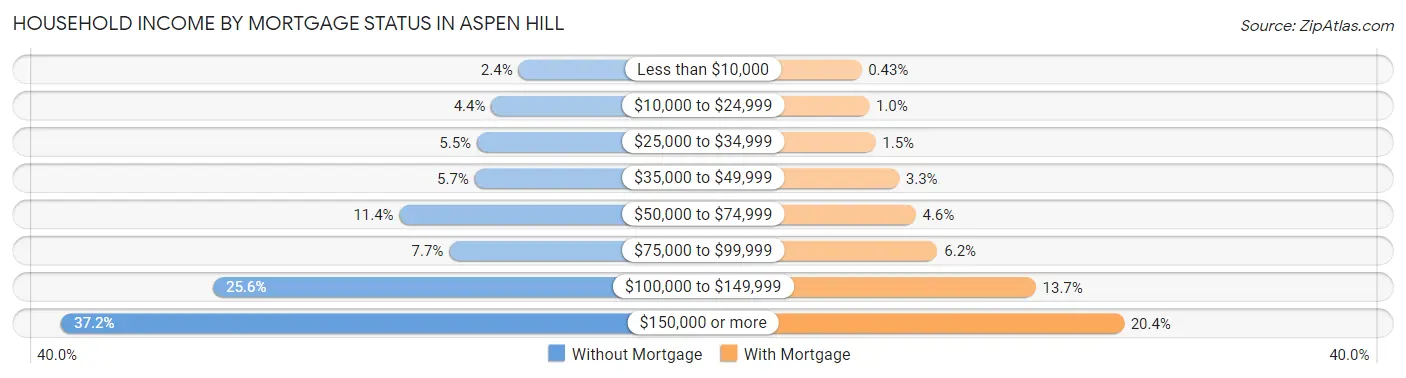
| Household Income | Without Mortgage | With Mortgage |
| Less than $10,000 | 73 (2.4%) | 34 (0.4%) |
| $10,000 to $24,999 | 137 (4.4%) | 81 (1.0%) |
| $25,000 to $34,999 | 171 (5.5%) | 120 (1.5%) |
| $35,000 to $49,999 | 176 (5.7%) | 263 (3.3%) |
| $50,000 to $74,999 | 353 (11.4%) | 364 (4.6%) |
| $75,000 to $99,999 | 236 (7.6%) | 497 (6.2%) |
| $100,000 to $149,999 | 791 (25.6%) | 1,094 (13.7%) |
| $150,000 or more | 1,148 (37.2%) | 1,629 (20.4%) |
| Total | 3,085 (100.0%) | 7,973 (100.0%) |
Property Value to Household Income Ratio in Aspen Hill
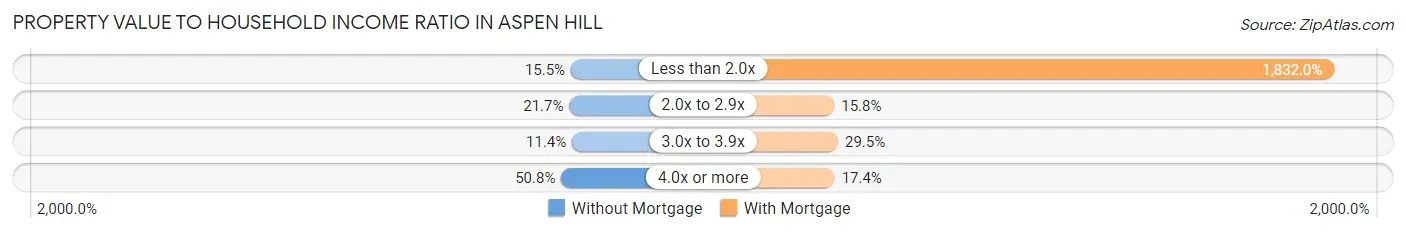
| Value-to-Income Ratio | Without Mortgage | With Mortgage |
| Less than 2.0x | 478 (15.5%) | 146,066 (1,832.0%) |
| 2.0x to 2.9x | 669 (21.7%) | 1,262 (15.8%) |
| 3.0x to 3.9x | 352 (11.4%) | 2,354 (29.5%) |
| 4.0x or more | 1,568 (50.8%) | 1,383 (17.3%) |
| Total | 3,085 (100.0%) | 7,973 (100.0%) |
Real Estate Taxes by Mortgage Status in Aspen Hill
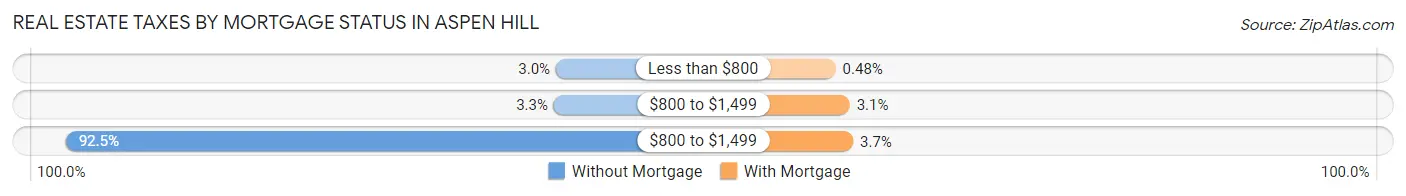
| Property Taxes | Without Mortgage | With Mortgage |
| Less than $800 | 91 (2.9%) | 38 (0.5%) |
| $800 to $1,499 | 103 (3.3%) | 243 (3.0%) |
| $800 to $1,499 | 2,853 (92.5%) | 292 (3.7%) |
| Total | 3,085 (100.0%) | 7,973 (100.0%) |
Health & Disability in Aspen Hill
Health Insurance Coverage by Age in Aspen Hill
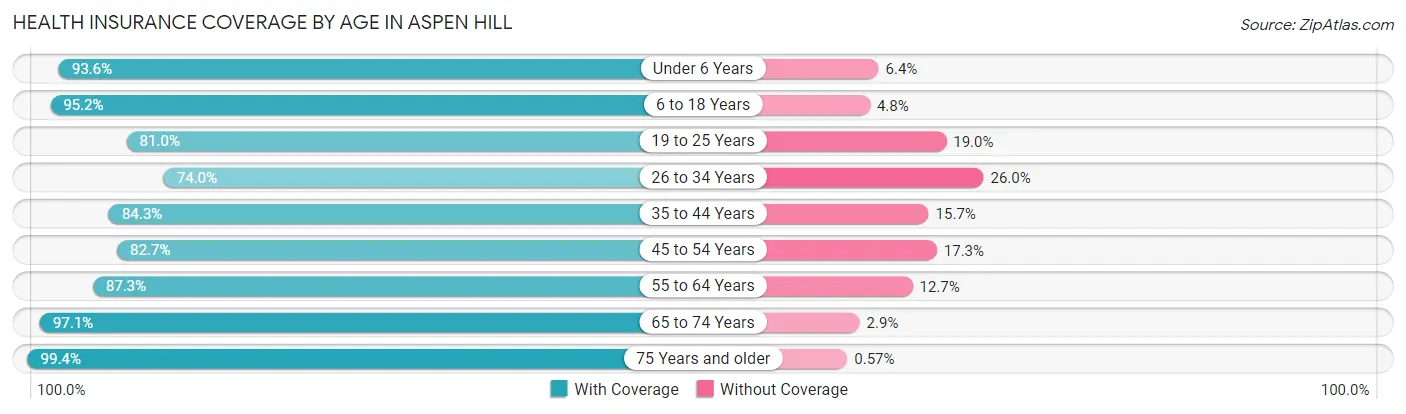
| Age Bracket | With Coverage | Without Coverage |
| Under 6 Years | 3,504 (93.6%) | 239 (6.4%) |
| 6 to 18 Years | 10,009 (95.2%) | 502 (4.8%) |
| 19 to 25 Years | 4,355 (81.0%) | 1,023 (19.0%) |
| 26 to 34 Years | 4,402 (74.0%) | 1,544 (26.0%) |
| 35 to 44 Years | 6,298 (84.3%) | 1,176 (15.7%) |
| 45 to 54 Years | 5,970 (82.7%) | 1,245 (17.3%) |
| 55 to 64 Years | 5,376 (87.3%) | 784 (12.7%) |
| 65 to 74 Years | 4,176 (97.1%) | 123 (2.9%) |
| 75 Years and older | 3,165 (99.4%) | 18 (0.6%) |
| Total | 47,255 (87.7%) | 6,654 (12.3%) |
Health Insurance Coverage by Citizenship Status in Aspen Hill
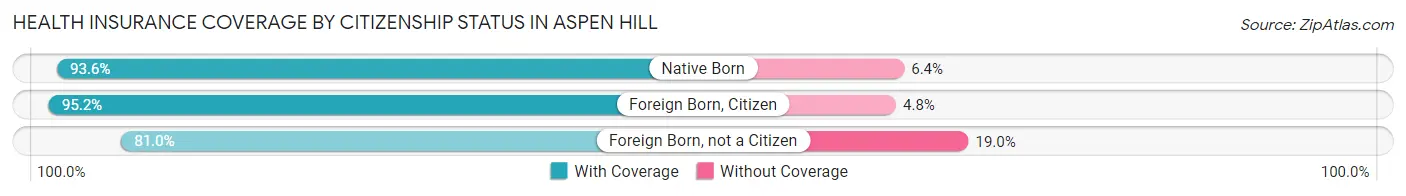
| Citizenship Status | With Coverage | Without Coverage |
| Native Born | 3,504 (93.6%) | 239 (6.4%) |
| Foreign Born, Citizen | 10,009 (95.2%) | 502 (4.8%) |
| Foreign Born, not a Citizen | 4,355 (81.0%) | 1,023 (19.0%) |
Health Insurance Coverage by Household Income in Aspen Hill
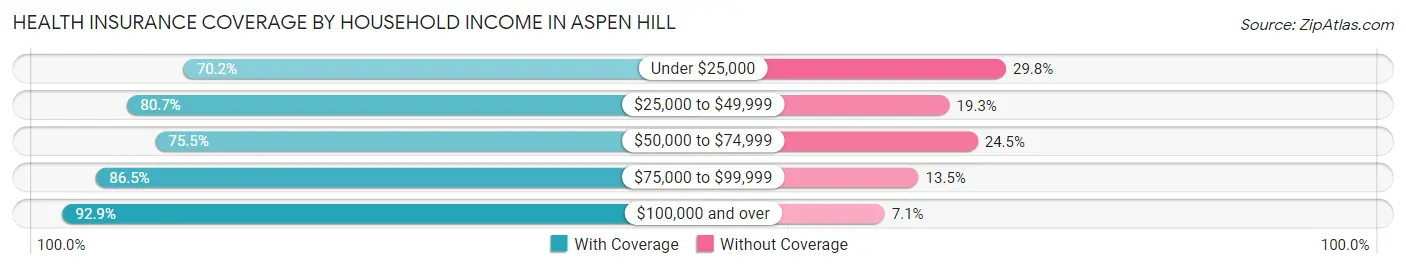
| Household Income | With Coverage | Without Coverage |
| Under $25,000 | 2,100 (70.2%) | 893 (29.8%) |
| $25,000 to $49,999 | 4,126 (80.7%) | 985 (19.3%) |
| $50,000 to $74,999 | 5,022 (75.5%) | 1,633 (24.5%) |
| $75,000 to $99,999 | 4,943 (86.5%) | 769 (13.5%) |
| $100,000 and over | 30,860 (92.9%) | 2,368 (7.1%) |
Public vs Private Health Insurance Coverage by Age in Aspen Hill
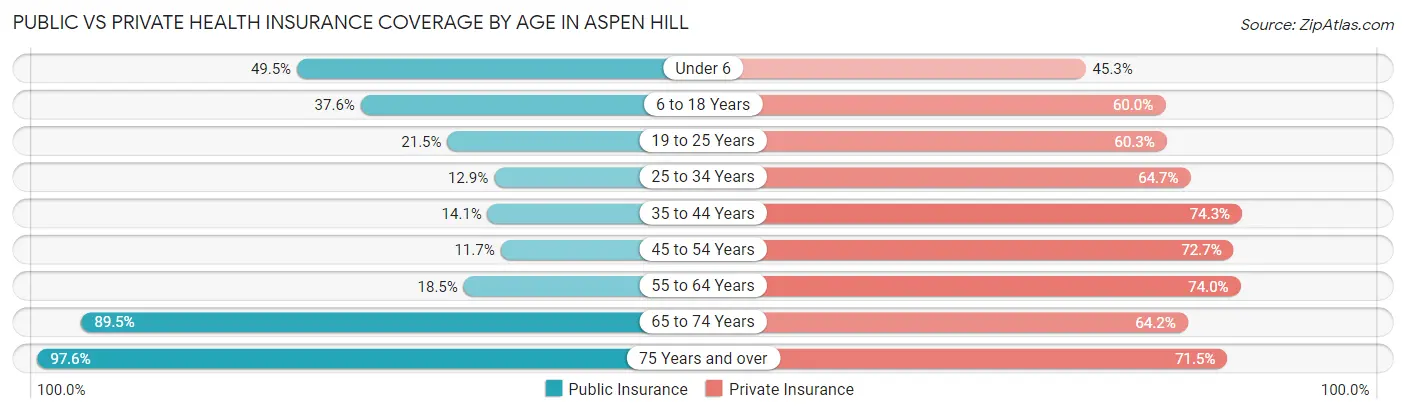
| Age Bracket | Public Insurance | Private Insurance |
| Under 6 | 1,851 (49.4%) | 1,694 (45.3%) |
| 6 to 18 Years | 3,954 (37.6%) | 6,307 (60.0%) |
| 19 to 25 Years | 1,158 (21.5%) | 3,242 (60.3%) |
| 25 to 34 Years | 765 (12.9%) | 3,846 (64.7%) |
| 35 to 44 Years | 1,050 (14.1%) | 5,550 (74.3%) |
| 45 to 54 Years | 842 (11.7%) | 5,245 (72.7%) |
| 55 to 64 Years | 1,140 (18.5%) | 4,557 (74.0%) |
| 65 to 74 Years | 3,846 (89.5%) | 2,759 (64.2%) |
| 75 Years and over | 3,108 (97.6%) | 2,277 (71.5%) |
| Total | 17,714 (32.9%) | 35,477 (65.8%) |
Disability Status by Sex by Age in Aspen Hill
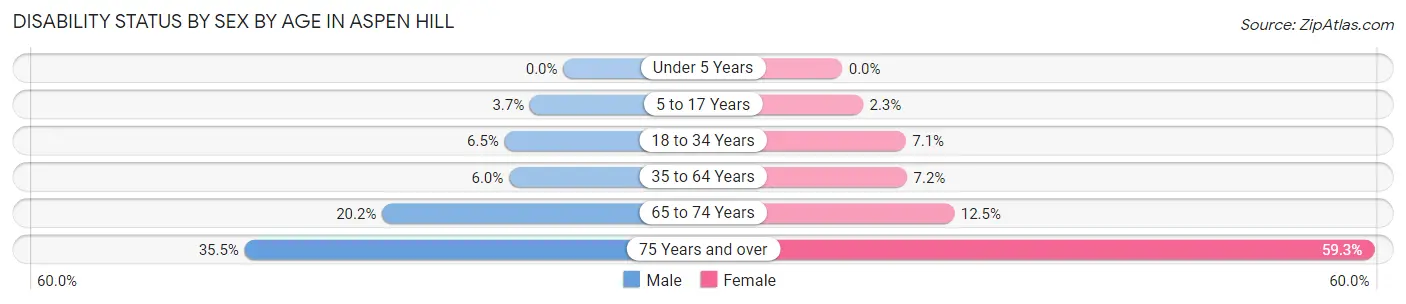
| Age Bracket | Male | Female |
| Under 5 Years | 0 (0.0%) | 0 (0.0%) |
| 5 to 17 Years | 199 (3.7%) | 113 (2.3%) |
| 18 to 34 Years | 384 (6.5%) | 434 (7.1%) |
| 35 to 64 Years | 624 (6.0%) | 759 (7.2%) |
| 65 to 74 Years | 374 (20.2%) | 305 (12.5%) |
| 75 Years and over | 455 (35.5%) | 1,127 (59.3%) |
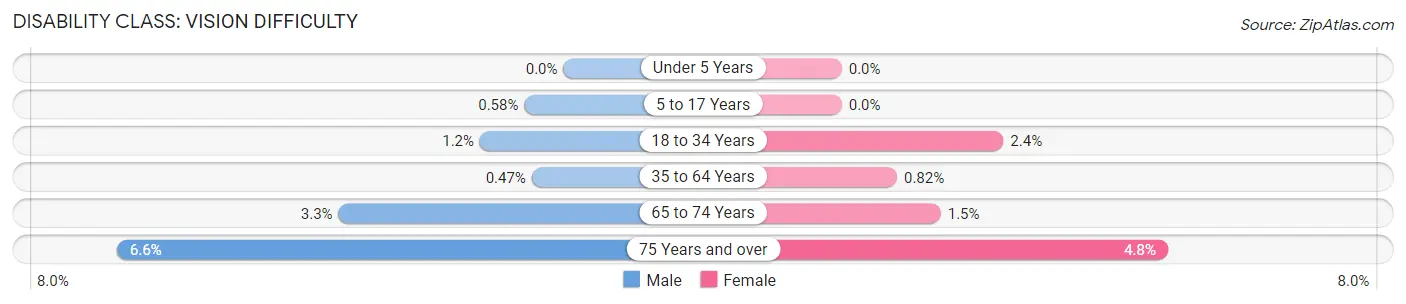
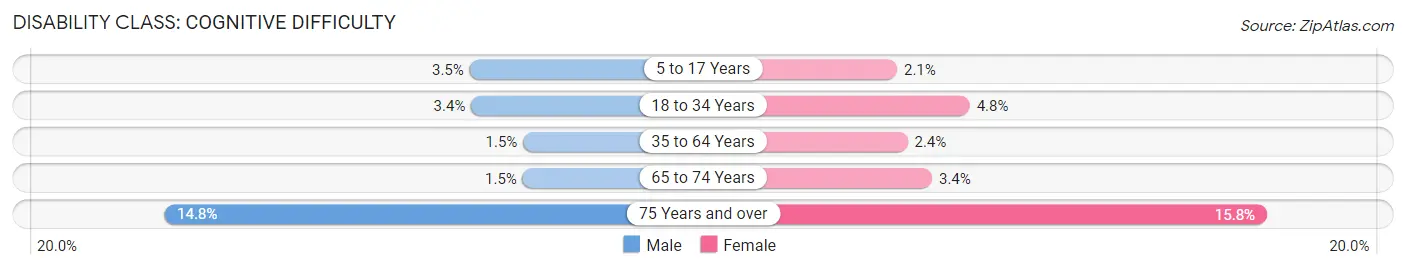
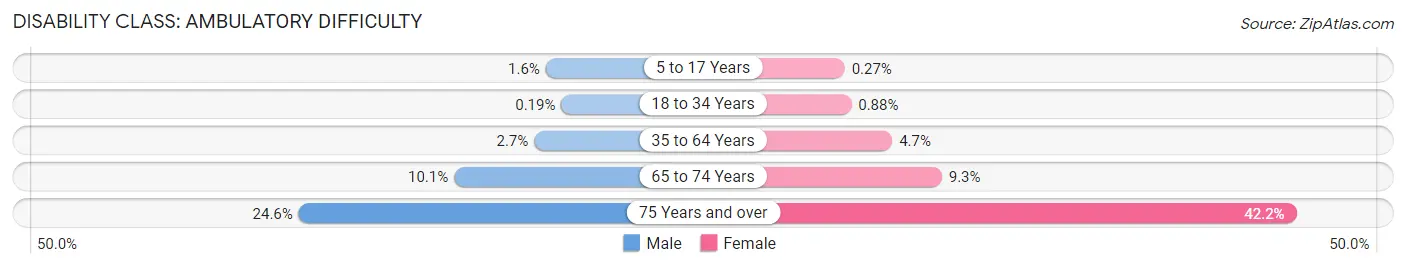
Disability Class by Sex by Age in Aspen Hill
Disability Class: Hearing Difficulty
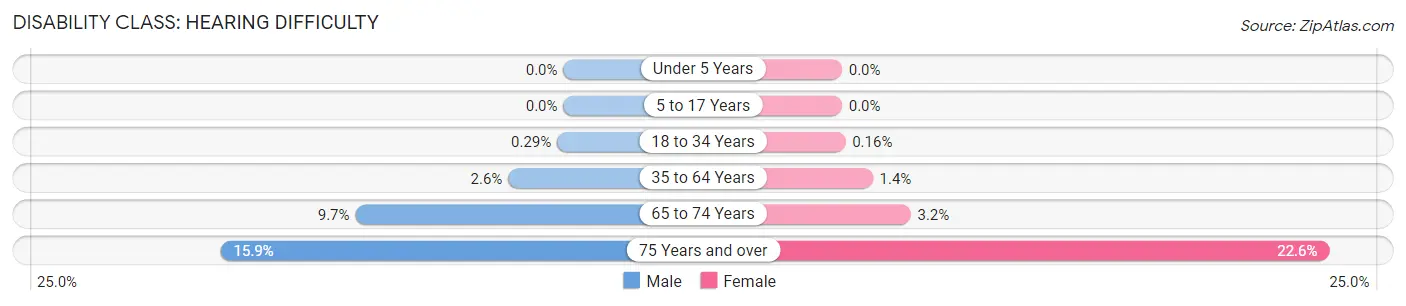
| Age Bracket | Male | Female |
| Under 5 Years | 0 (0.0%) | 0 (0.0%) |
| 5 to 17 Years | 0 (0.0%) | 0 (0.0%) |
| 18 to 34 Years | 17 (0.3%) | 10 (0.2%) |
| 35 to 64 Years | 265 (2.6%) | 150 (1.4%) |
| 65 to 74 Years | 179 (9.7%) | 78 (3.2%) |
| 75 Years and over | 204 (15.9%) | 430 (22.6%) |
Disability Class: Vision Difficulty
| Age Bracket | Male | Female |
| Under 5 Years | 0 (0.0%) | 0 (0.0%) |
| 5 to 17 Years | 31 (0.6%) | 0 (0.0%) |
| 18 to 34 Years | 73 (1.2%) | 147 (2.4%) |
| 35 to 64 Years | 49 (0.5%) | 86 (0.8%) |
| 65 to 74 Years | 62 (3.3%) | 36 (1.5%) |
| 75 Years and over | 85 (6.6%) | 92 (4.8%) |
Disability Class: Cognitive Difficulty
| Age Bracket | Male | Female |
| 5 to 17 Years | 187 (3.5%) | 100 (2.1%) |
| 18 to 34 Years | 201 (3.4%) | 291 (4.8%) |
| 35 to 64 Years | 154 (1.5%) | 256 (2.4%) |
| 65 to 74 Years | 28 (1.5%) | 82 (3.4%) |
| 75 Years and over | 190 (14.8%) | 300 (15.8%) |
Disability Class: Ambulatory Difficulty
| Age Bracket | Male | Female |
| 5 to 17 Years | 88 (1.6%) | 13 (0.3%) |
| 18 to 34 Years | 11 (0.2%) | 54 (0.9%) |
| 35 to 64 Years | 280 (2.7%) | 492 (4.7%) |
| 65 to 74 Years | 188 (10.1%) | 227 (9.3%) |
| 75 Years and over | 315 (24.6%) | 802 (42.2%) |
Disability Class: Self-Care Difficulty
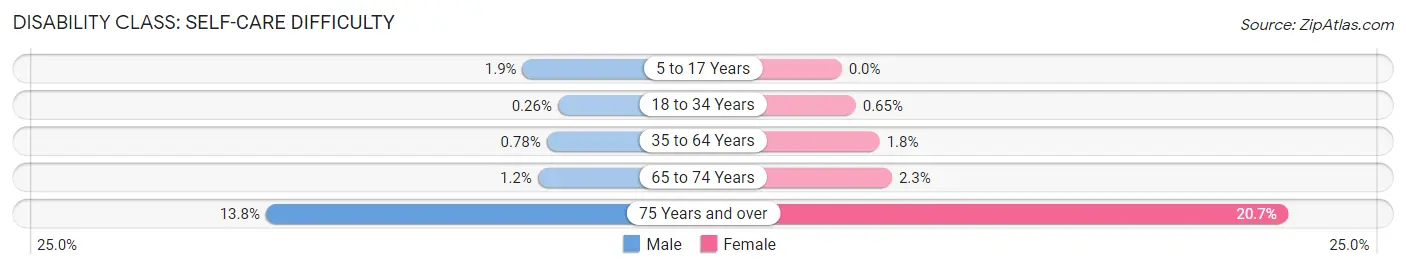
| Age Bracket | Male | Female |
| 5 to 17 Years | 102 (1.9%) | 0 (0.0%) |
| 18 to 34 Years | 15 (0.3%) | 40 (0.6%) |
| 35 to 64 Years | 81 (0.8%) | 185 (1.8%) |
| 65 to 74 Years | 22 (1.2%) | 57 (2.3%) |
| 75 Years and over | 177 (13.8%) | 394 (20.7%) |
Technology Access in Aspen Hill
Computing Device Access in Aspen Hill
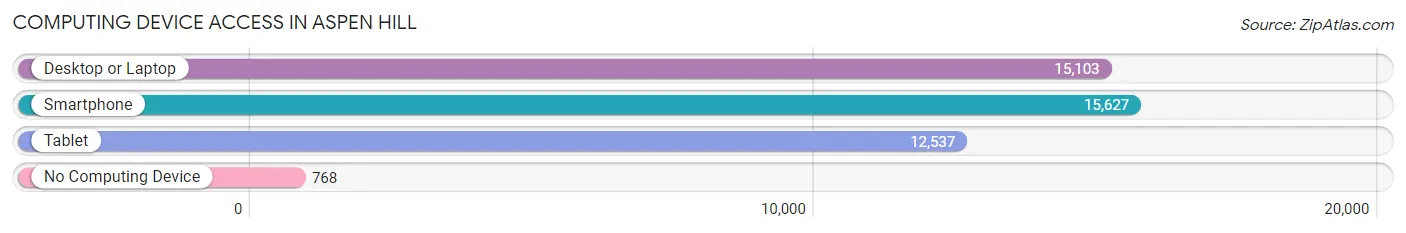
| Device Type | # Households | % Households |
| Desktop or Laptop | 15,103 | 87.0% |
| Smartphone | 15,627 | 90.0% |
| Tablet | 12,537 | 72.2% |
| No Computing Device | 768 | 4.4% |
| Total | 17,369 | 100.0% |
Internet Access in Aspen Hill
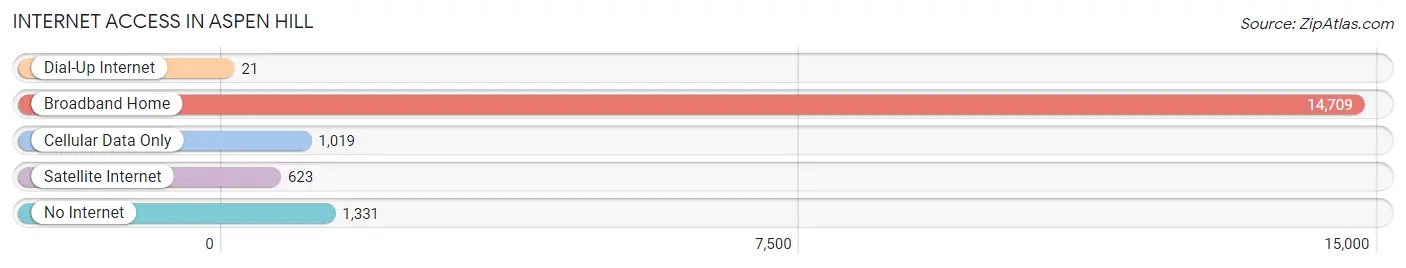
| Internet Type | # Households | % Households |
| Dial-Up Internet | 21 | 0.1% |
| Broadband Home | 14,709 | 84.7% |
| Cellular Data Only | 1,019 | 5.9% |
| Satellite Internet | 623 | 3.6% |
| No Internet | 1,331 | 7.7% |
| Total | 17,369 | 100.0% |
Aspen Hill Summary
Aspen Hill is an unincorporated area and census-designated place (CDP) located in Montgomery County, Maryland, United States. As of the 2010 census, the population of Aspen Hill was 48,759.
History
Aspen Hill was first settled in the early 19th century by farmers who were attracted to the area by its fertile soil and abundant water supply. The area was originally known as "Aspen Dale" and was part of the larger community of Rockville. In the late 19th century, the area was developed as a residential suburb of Washington, D.C. and was renamed Aspen Hill.
Geography
Aspen Hill is located at 39°5′17″N 77°5′17″W (39.0879, -77.0879). It is bordered by the city of Rockville to the north, the city of Silver Spring to the east, the city of Wheaton to the south, and the city of Olney to the west.
Aspen Hill is located in the Piedmont region of Maryland, which is characterized by rolling hills and valleys. The area is drained by the Rock Creek watershed.
Economy
Aspen Hill is home to a variety of businesses, including retail stores, restaurants, and professional services. The area is also home to several large employers, including the National Institutes of Health, the National Naval Medical Center, and the Walter Reed Army Medical Center.
Demographics
As of the 2010 census, the population of Aspen Hill was 48,759. The racial makeup of the area was 57.3% White, 22.2% African American, 0.4% Native American, 8.3% Asian, 0.1% Pacific Islander, 8.2% from other races, and 3.5% from two or more races. Hispanic or Latino of any race were 16.7% of the population.
The median household income in Aspen Hill was $76,845 in 2010. The per capita income was $35,945. About 8.3% of families and 11.2% of the population were below the poverty line, including 15.2% of those under age 18 and 8.2% of those age 65 or over.
Common Questions
What is Per Capita Income in Aspen Hill?
Per Capita income in Aspen Hill is $44,296.
What is the Median Family Income in Aspen Hill?
Median Family Income in Aspen Hill is $127,830.
What is the Median Household income in Aspen Hill?
Median Household Income in Aspen Hill is $104,582.
What is Income or Wage Gap in Aspen Hill?
Income or Wage Gap in Aspen Hill is 21.0%.
Women in Aspen Hill earn 79.0 cents for every dollar earned by a man.
What is Family Income Deficit in Aspen Hill?
Family Income Deficit in Aspen Hill is $11,943.
Families that are below poverty line in Aspen Hill earn $11,943 less on average than the poverty threshold level.
What is Inequality or Gini Index in Aspen Hill?
Inequality or Gini Index in Aspen Hill is 0.43.
What is the Total Population of Aspen Hill?
Total Population of Aspen Hill is 54,262.
What is the Total Male Population of Aspen Hill?
Total Male Population of Aspen Hill is 26,722.
What is the Total Female Population of Aspen Hill?
Total Female Population of Aspen Hill is 27,540.
What is the Ratio of Males per 100 Females in Aspen Hill?
There are 97.03 Males per 100 Females in Aspen Hill.
What is the Ratio of Females per 100 Males in Aspen Hill?
There are 103.06 Females per 100 Males in Aspen Hill.
What is the Median Population Age in Aspen Hill?
Median Population Age in Aspen Hill is 36.8 Years.
What is the Average Family Size in Aspen Hill
Average Family Size in Aspen Hill is 3.5 People.
What is the Average Household Size in Aspen Hill
Average Household Size in Aspen Hill is 3.1 People.
How Large is the Labor Force in Aspen Hill?
There are 31,002 People in the Labor Forcein in Aspen Hill.
What is the Percentage of People in the Labor Force in Aspen Hill?
73.0% of People are in the Labor Force in Aspen Hill.
What is the Unemployment Rate in Aspen Hill?
Unemployment Rate in Aspen Hill is 6.6%.