Leander, TX Map & Demographics
Leander Map
Leander Overview
$52,419
PER CAPITA INCOME
$144,973
AVG FAMILY INCOME
$129,684
AVG HOUSEHOLD INCOME
34.4%
WAGE / INCOME GAP [ % ]
65.6¢/ $1
WAGE / INCOME GAP [ $ ]
0.40
INEQUALITY / GINI INDEX
62,491
TOTAL POPULATION
30,844
MALE POPULATION
31,647
FEMALE POPULATION
97.46
MALES / 100 FEMALES
102.60
FEMALES / 100 MALES
35.5
MEDIAN AGE
3.3
AVG FAMILY SIZE
2.9
AVG HOUSEHOLD SIZE
35,237
LABOR FORCE [ PEOPLE ]
76.3%
PERCENT IN LABOR FORCE
3.7%
UNEMPLOYMENT RATE
Income in Leander
Income Overview in Leander
Per Capita Income in Leander is $52,419, while median incomes of families and households are $144,973 and $129,684 respectively.
| Characteristic | Number | Measure |
| Per Capita Income | 62,491 | $52,419 |
| Median Family Income | 17,010 | $144,973 |
| Mean Family Income | 17,010 | $166,542 |
| Median Household Income | 21,305 | $129,684 |
| Mean Household Income | 21,305 | $153,022 |
| Income Deficit | 17,010 | $0 |
| Wage / Income Gap (%) | 62,491 | 34.40% |
| Wage / Income Gap ($) | 62,491 | 65.60¢ per $1 |
| Gini / Inequality Index | 62,491 | 0.40 |
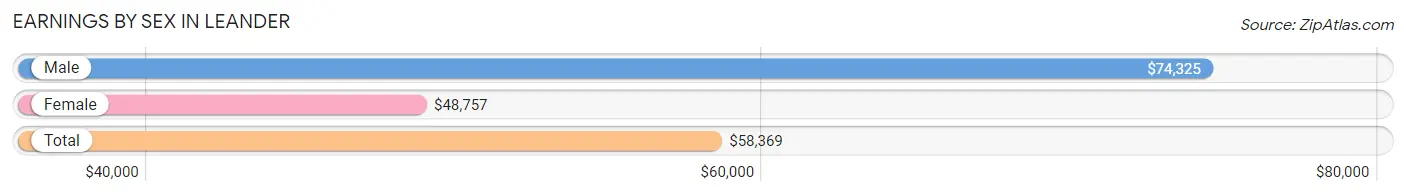
Earnings by Sex in Leander
Average Earnings in Leander are $58,369, $74,325 for men and $48,757 for women, a difference of 34.4%.
| Sex | Number | Average Earnings |
| Male | 19,972 (54.6%) | $74,325 |
| Female | 16,622 (45.4%) | $48,757 |
| Total | 36,594 (100.0%) | $58,369 |
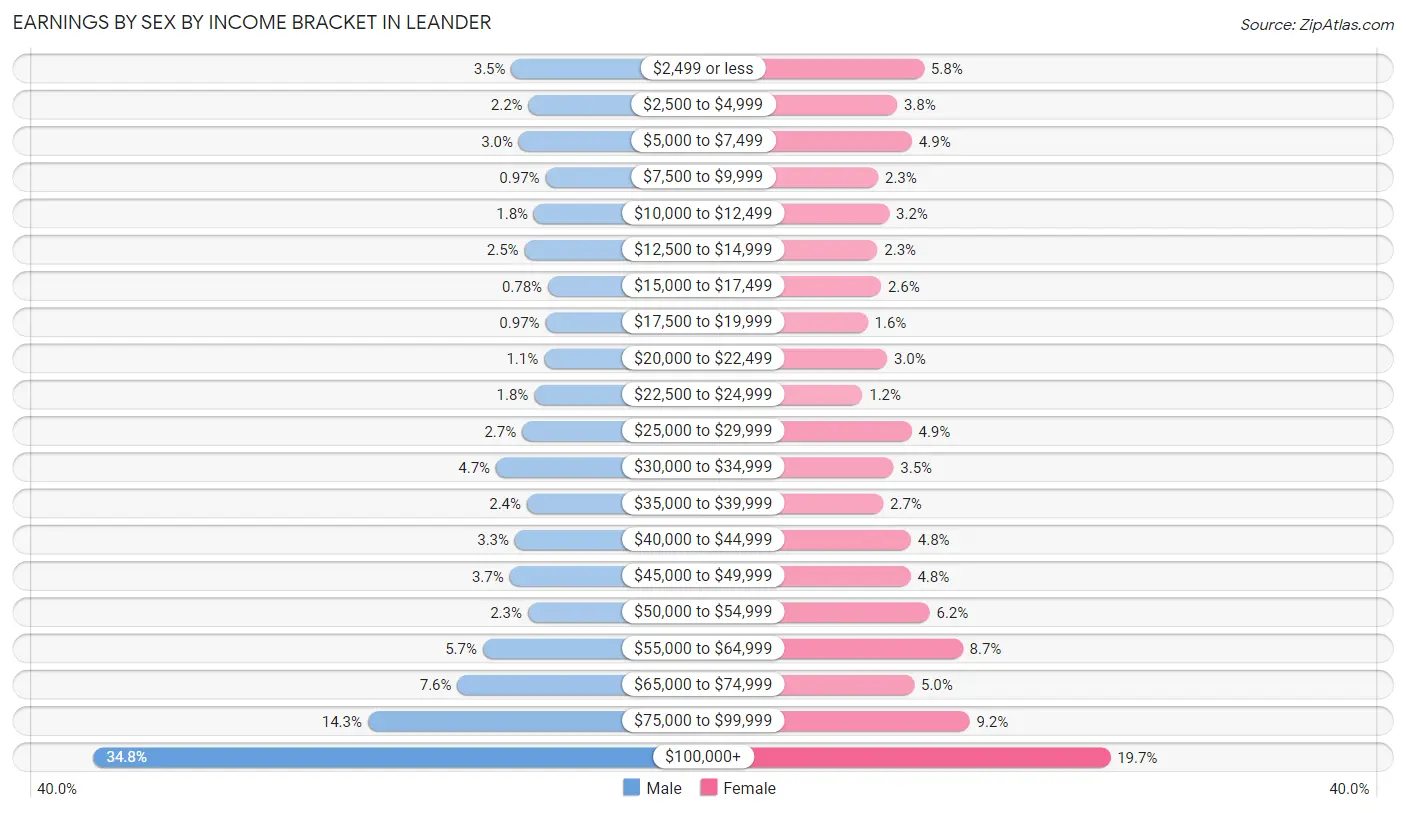
Earnings by Sex by Income Bracket in Leander
The most common earnings brackets in Leander are $100,000+ for men (6,957 | 34.8%) and $100,000+ for women (3,282 | 19.7%).
| Income | Male | Female |
| $2,499 or less | 704 (3.5%) | 960 (5.8%) |
| $2,500 to $4,999 | 448 (2.2%) | 625 (3.8%) |
| $5,000 to $7,499 | 591 (3.0%) | 811 (4.9%) |
| $7,500 to $9,999 | 194 (1.0%) | 389 (2.3%) |
| $10,000 to $12,499 | 366 (1.8%) | 527 (3.2%) |
| $12,500 to $14,999 | 507 (2.5%) | 381 (2.3%) |
| $15,000 to $17,499 | 156 (0.8%) | 426 (2.6%) |
| $17,500 to $19,999 | 193 (1.0%) | 260 (1.6%) |
| $20,000 to $22,499 | 213 (1.1%) | 501 (3.0%) |
| $22,500 to $24,999 | 361 (1.8%) | 192 (1.2%) |
| $25,000 to $29,999 | 543 (2.7%) | 806 (4.9%) |
| $30,000 to $34,999 | 935 (4.7%) | 580 (3.5%) |
| $35,000 to $39,999 | 471 (2.4%) | 452 (2.7%) |
| $40,000 to $44,999 | 652 (3.3%) | 798 (4.8%) |
| $45,000 to $49,999 | 730 (3.7%) | 793 (4.8%) |
| $50,000 to $54,999 | 457 (2.3%) | 1,030 (6.2%) |
| $55,000 to $64,999 | 1,130 (5.7%) | 1,442 (8.7%) |
| $65,000 to $74,999 | 1,512 (7.6%) | 838 (5.0%) |
| $75,000 to $99,999 | 2,852 (14.3%) | 1,529 (9.2%) |
| $100,000+ | 6,957 (34.8%) | 3,282 (19.7%) |
| Total | 19,972 (100.0%) | 16,622 (100.0%) |
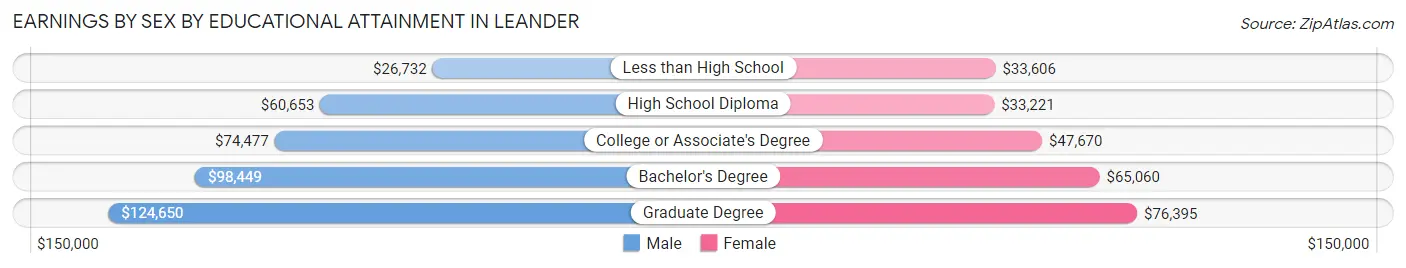
Earnings by Sex by Educational Attainment in Leander
Average earnings in Leander are $82,463 for men and $54,282 for women, a difference of 34.2%. Men with an educational attainment of graduate degree enjoy the highest average annual earnings of $124,650, while those with less than high school education earn the least with $26,732. Women with an educational attainment of graduate degree earn the most with the average annual earnings of $76,395, while those with high school diploma education have the smallest earnings of $33,221.
| Educational Attainment | Male Income | Female Income |
| Less than High School | $26,732 | $33,606 |
| High School Diploma | $60,653 | $33,221 |
| College or Associate's Degree | $74,477 | $47,670 |
| Bachelor's Degree | $98,449 | $65,060 |
| Graduate Degree | $124,650 | $76,395 |
| Total | $82,463 | $54,282 |
Family Income in Leander
Family Income Brackets in Leander
According to the Leander family income data, there are 4,338 families falling into the $200,000+ income range, which is the most common income bracket and makes up 25.5% of all families. Conversely, the $10,000 to $14,999 income bracket is the least frequent group with only 17 families (0.1%) belonging to this category.
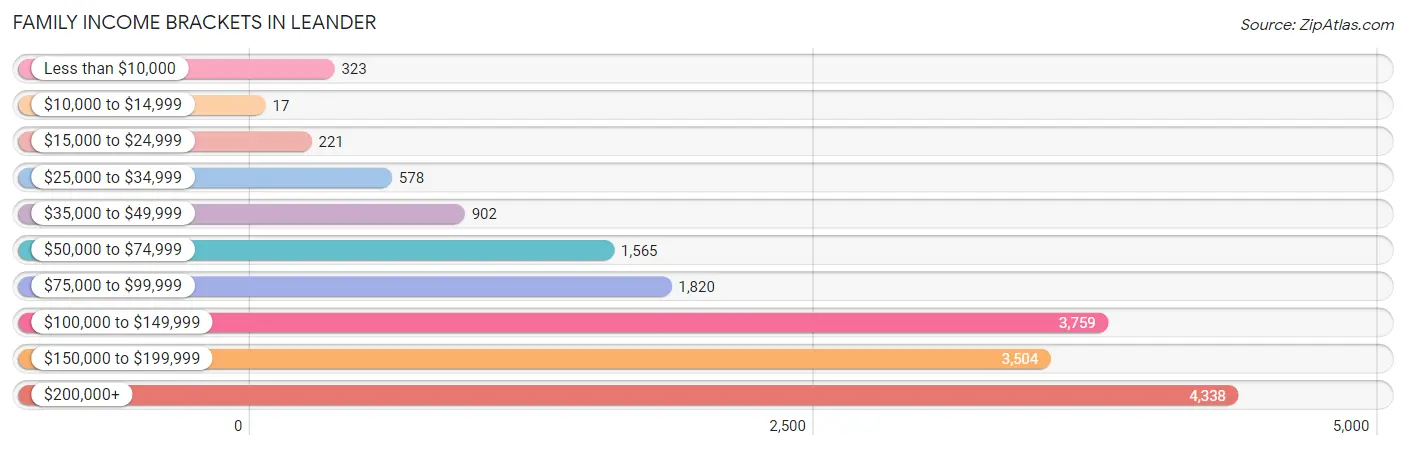
| Income Bracket | # Families | % Families |
| Less than $10,000 | 323 | 1.9% |
| $10,000 to $14,999 | 17 | 0.1% |
| $15,000 to $24,999 | 221 | 1.3% |
| $25,000 to $34,999 | 578 | 3.4% |
| $35,000 to $49,999 | 902 | 5.3% |
| $50,000 to $74,999 | 1,565 | 9.2% |
| $75,000 to $99,999 | 1,820 | 10.7% |
| $100,000 to $149,999 | 3,759 | 22.1% |
| $150,000 to $199,999 | 3,504 | 20.6% |
| $200,000+ | 4,338 | 25.5% |
Family Income by Famaliy Size in Leander
5-person families (1,690 | 9.9%) account for the highest median family income in Leander with $183,421 per family, while 2-person families (5,989 | 35.2%) have the highest median income of $61,770 per family member.
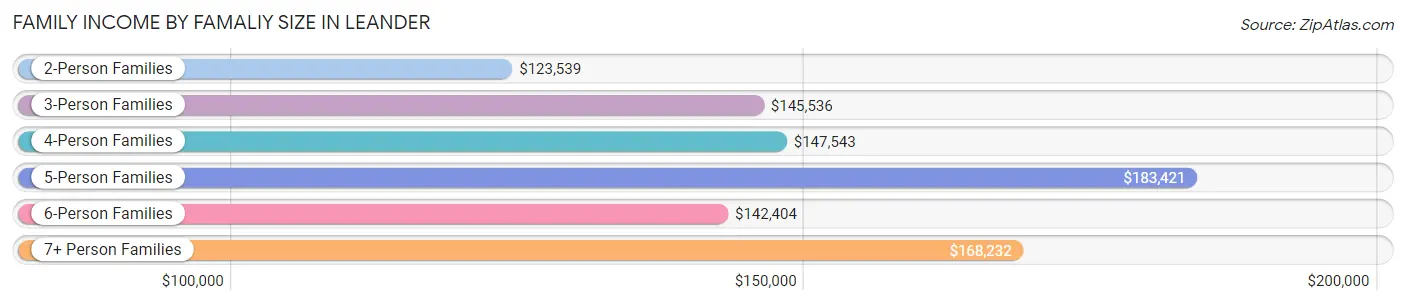
| Income Bracket | # Families | Median Income |
| 2-Person Families | 5,989 (35.2%) | $123,539 |
| 3-Person Families | 3,637 (21.4%) | $145,536 |
| 4-Person Families | 4,788 (28.1%) | $147,543 |
| 5-Person Families | 1,690 (9.9%) | $183,421 |
| 6-Person Families | 691 (4.1%) | $142,404 |
| 7+ Person Families | 215 (1.3%) | $168,232 |
| Total | 17,010 (100.0%) | $144,973 |
Family Income by Number of Earners in Leander
The median family income in Leander is $144,973, with families comprising 3+ earners (2,745) having the highest median family income of $169,792, while families with no earners (1,076) have the lowest median family income of $58,922, accounting for 16.1% and 6.3% of families, respectively.
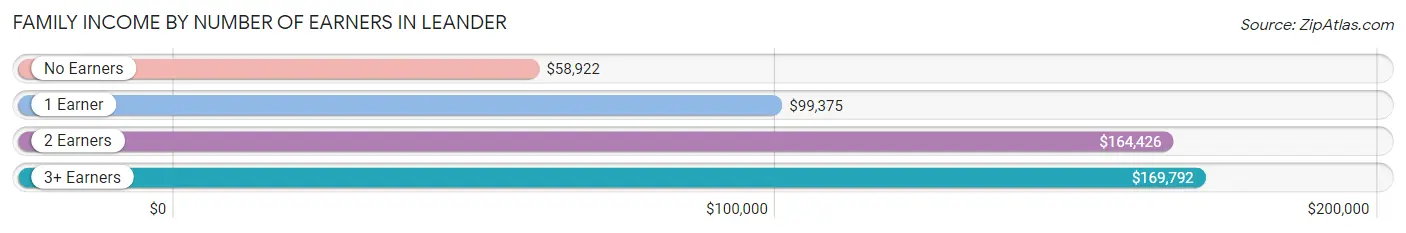
| Number of Earners | # Families | Median Income |
| No Earners | 1,076 (6.3%) | $58,922 |
| 1 Earner | 4,402 (25.9%) | $99,375 |
| 2 Earners | 8,787 (51.7%) | $164,426 |
| 3+ Earners | 2,745 (16.1%) | $169,792 |
| Total | 17,010 (100.0%) | $144,973 |
Household Income in Leander
Household Income Brackets in Leander
With 4,730 households falling in the category, the $100,000 to $149,999 income range is the most frequent in Leander, accounting for 22.2% of all households. In contrast, only 277 households (1.3%) fall into the $10,000 to $14,999 income bracket, making it the least populous group.
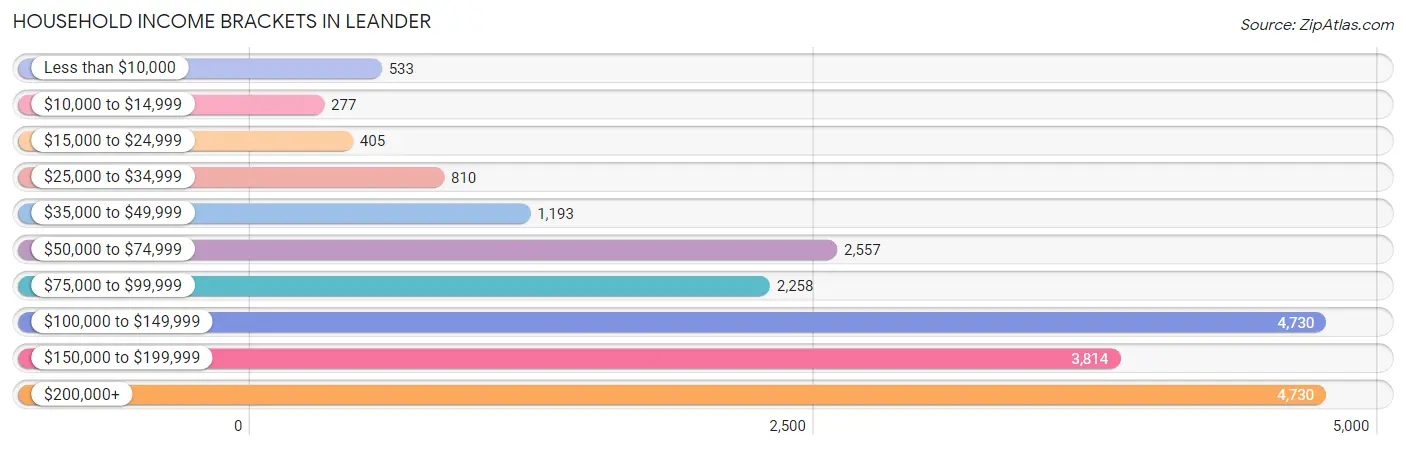
| Income Bracket | # Households | % Households |
| Less than $10,000 | 533 | 2.5% |
| $10,000 to $14,999 | 277 | 1.3% |
| $15,000 to $24,999 | 405 | 1.9% |
| $25,000 to $34,999 | 810 | 3.8% |
| $35,000 to $49,999 | 1,193 | 5.6% |
| $50,000 to $74,999 | 2,557 | 12.0% |
| $75,000 to $99,999 | 2,258 | 10.6% |
| $100,000 to $149,999 | 4,730 | 22.2% |
| $150,000 to $199,999 | 3,814 | 17.9% |
| $200,000+ | 4,730 | 22.2% |
Household Income by Householder Age in Leander
The median household income in Leander is $129,684, with the highest median household income of $144,092 found in the 25 to 44 years age bracket for the primary householder. A total of 9,429 households (44.3%) fall into this category. Meanwhile, the 15 to 24 years age bracket for the primary householder has the lowest median household income of $52,457, with 390 households (1.8%) in this group.
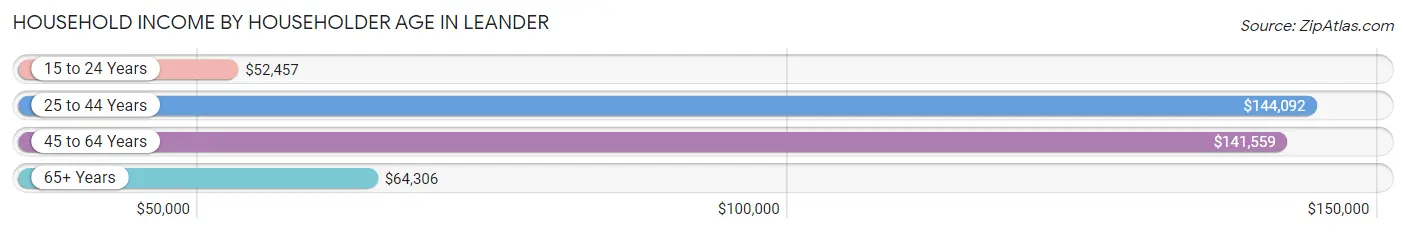
| Income Bracket | # Households | Median Income |
| 15 to 24 Years | 390 (1.8%) | $52,457 |
| 25 to 44 Years | 9,429 (44.3%) | $144,092 |
| 45 to 64 Years | 8,770 (41.2%) | $141,559 |
| 65+ Years | 2,716 (12.8%) | $64,306 |
| Total | 21,305 (100.0%) | $129,684 |
Poverty in Leander
Income Below Poverty by Sex and Age in Leander
With 3.7% poverty level for males and 5.4% for females among the residents of Leander, under 5 year old males and 65 to 74 year old females are the most vulnerable to poverty, with 174 males (7.5%) and 243 females (12.9%) in their respective age groups living below the poverty level.
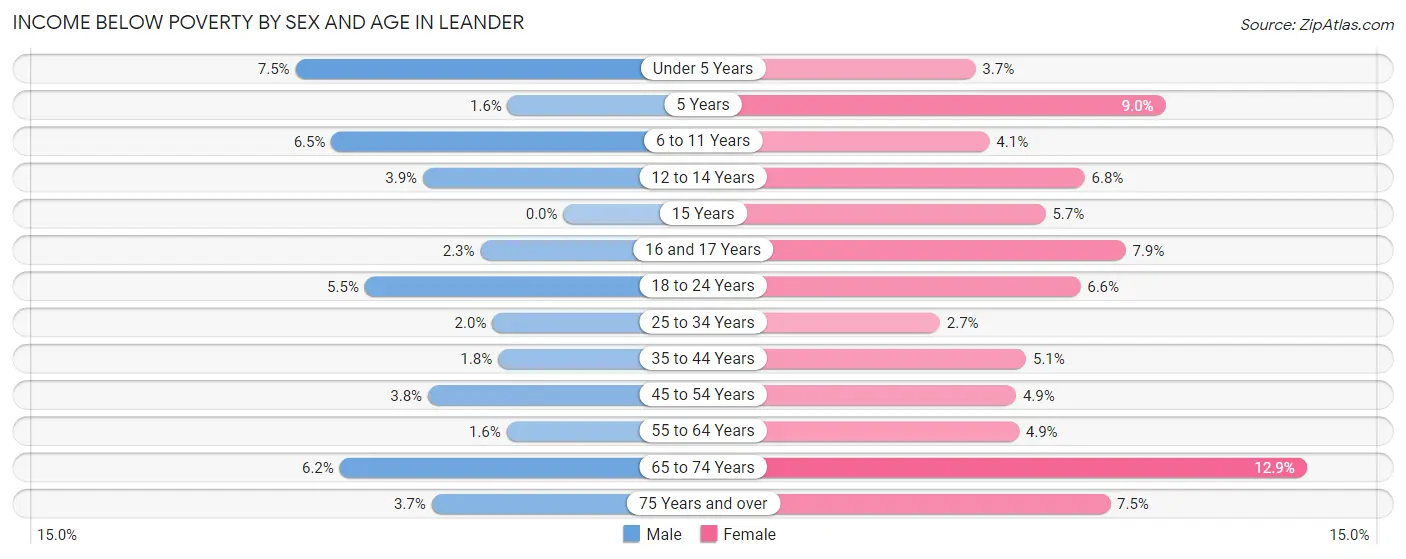
| Age Bracket | Male | Female |
| Under 5 Years | 174 (7.5%) | 80 (3.7%) |
| 5 Years | 6 (1.5%) | 31 (9.0%) |
| 6 to 11 Years | 196 (6.5%) | 126 (4.1%) |
| 12 to 14 Years | 64 (3.9%) | 136 (6.8%) |
| 15 Years | 0 (0.0%) | 30 (5.7%) |
| 16 and 17 Years | 22 (2.3%) | 68 (7.9%) |
| 18 to 24 Years | 132 (5.5%) | 159 (6.6%) |
| 25 to 34 Years | 71 (2.0%) | 112 (2.7%) |
| 35 to 44 Years | 100 (1.8%) | 313 (5.1%) |
| 45 to 54 Years | 209 (3.8%) | 206 (4.9%) |
| 55 to 64 Years | 47 (1.6%) | 141 (4.9%) |
| 65 to 74 Years | 80 (6.2%) | 243 (12.9%) |
| 75 Years and over | 23 (3.7%) | 67 (7.5%) |
| Total | 1,124 (3.7%) | 1,712 (5.4%) |
Income Above Poverty by Sex and Age in Leander
According to the poverty statistics in Leander, males aged 15 years and females aged 25 to 34 years are the age groups that are most secure financially, with 100.0% of males and 97.3% of females in these age groups living above the poverty line.
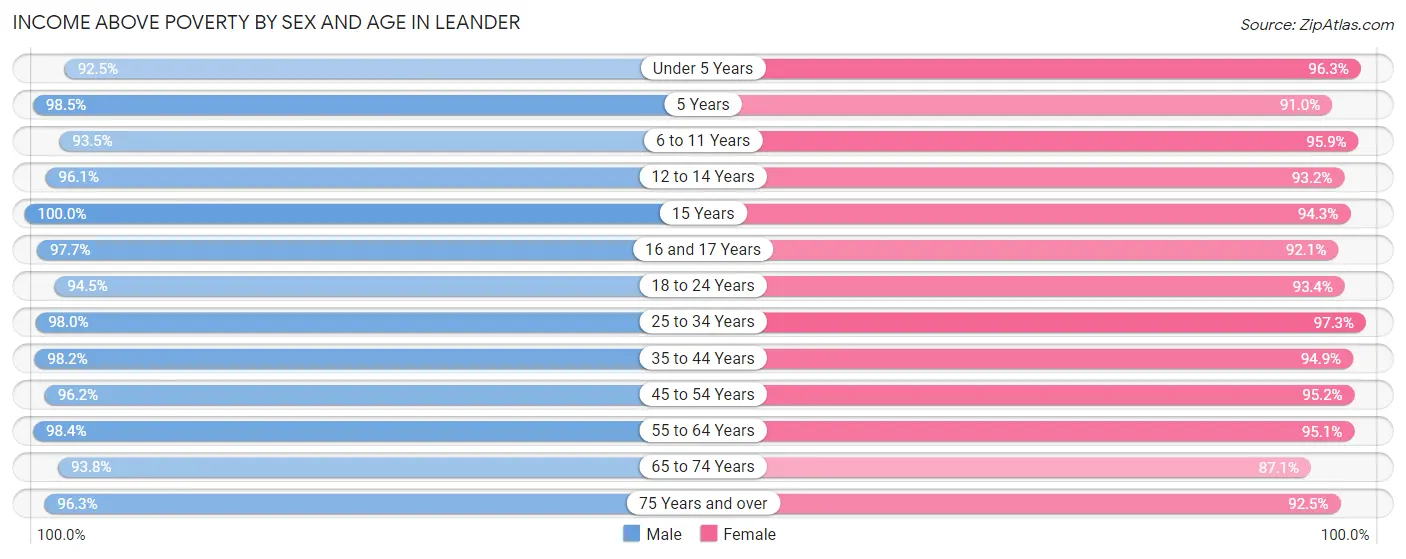
| Age Bracket | Male | Female |
| Under 5 Years | 2,159 (92.5%) | 2,071 (96.3%) |
| 5 Years | 381 (98.5%) | 313 (91.0%) |
| 6 to 11 Years | 2,837 (93.5%) | 2,940 (95.9%) |
| 12 to 14 Years | 1,572 (96.1%) | 1,876 (93.2%) |
| 15 Years | 506 (100.0%) | 499 (94.3%) |
| 16 and 17 Years | 929 (97.7%) | 793 (92.1%) |
| 18 to 24 Years | 2,256 (94.5%) | 2,237 (93.4%) |
| 25 to 34 Years | 3,506 (98.0%) | 3,994 (97.3%) |
| 35 to 44 Years | 5,381 (98.2%) | 5,793 (94.9%) |
| 45 to 54 Years | 5,335 (96.2%) | 4,039 (95.2%) |
| 55 to 64 Years | 2,926 (98.4%) | 2,720 (95.1%) |
| 65 to 74 Years | 1,205 (93.8%) | 1,635 (87.1%) |
| 75 Years and over | 603 (96.3%) | 830 (92.5%) |
| Total | 29,596 (96.3%) | 29,740 (94.6%) |
Income Below Poverty Among Married-Couple Families in Leander
The poverty statistics for married-couple families in Leander show that 1.7% or 243 of the total 14,255 families live below the poverty line. Families with 3 or 4 children have the highest poverty rate of 2.8%, comprising of 38 families. On the other hand, families with 5 or more children have the lowest poverty rate of 0.0%, which includes 0 families.
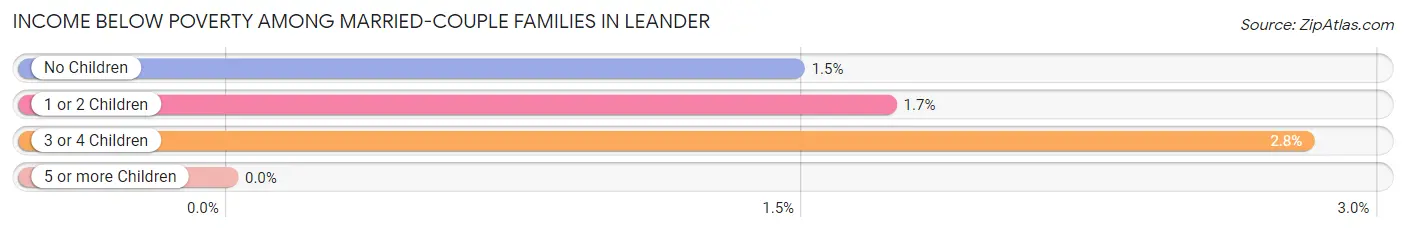
| Children | Above Poverty | Below Poverty |
| No Children | 5,978 (98.5%) | 90 (1.5%) |
| 1 or 2 Children | 6,587 (98.3%) | 115 (1.7%) |
| 3 or 4 Children | 1,316 (97.2%) | 38 (2.8%) |
| 5 or more Children | 131 (100.0%) | 0 (0.0%) |
| Total | 14,012 (98.3%) | 243 (1.7%) |
Income Below Poverty Among Single-Parent Households in Leander
According to the poverty data in Leander, 3.5% or 32 single-father households and 17.2% or 318 single-mother households are living below the poverty line. Among single-father households, those with 1 or 2 children have the highest poverty rate, with 32 households (8.1%) experiencing poverty. Likewise, among single-mother households, those with 3 or 4 children have the highest poverty rate, with 89 households (33.8%) falling below the poverty line.
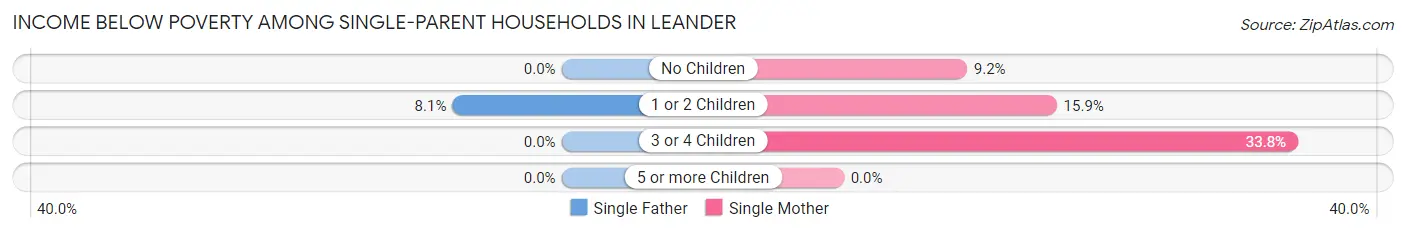
| Children | Single Father | Single Mother |
| No Children | 0 (0.0%) | 27 (9.2%) |
| 1 or 2 Children | 32 (8.1%) | 202 (15.9%) |
| 3 or 4 Children | 0 (0.0%) | 89 (33.8%) |
| 5 or more Children | 0 (0.0%) | 0 (0.0%) |
| Total | 32 (3.5%) | 318 (17.2%) |
Income Below Poverty Among Married-Couple vs Single-Parent Households in Leander
The poverty data for Leander shows that 243 of the married-couple family households (1.7%) and 350 of the single-parent households (12.7%) are living below the poverty level. Within the married-couple family households, those with 3 or 4 children have the highest poverty rate, with 38 households (2.8%) falling below the poverty line. Among the single-parent households, those with 3 or 4 children have the highest poverty rate, with 89 household (33.1%) living below poverty.
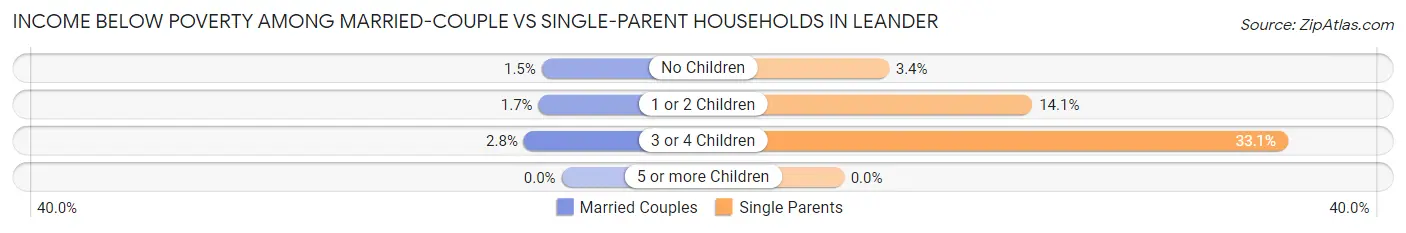
| Children | Married-Couple Families | Single-Parent Households |
| No Children | 90 (1.5%) | 27 (3.4%) |
| 1 or 2 Children | 115 (1.7%) | 234 (14.1%) |
| 3 or 4 Children | 38 (2.8%) | 89 (33.1%) |
| 5 or more Children | 0 (0.0%) | 0 (0.0%) |
| Total | 243 (1.7%) | 350 (12.7%) |
Race in Leander
The most populous races in Leander are White / Caucasian (41,891 | 67.0%), Hispanic or Latino (15,079 | 24.1%), and Two or more Races (8,303 | 13.3%).
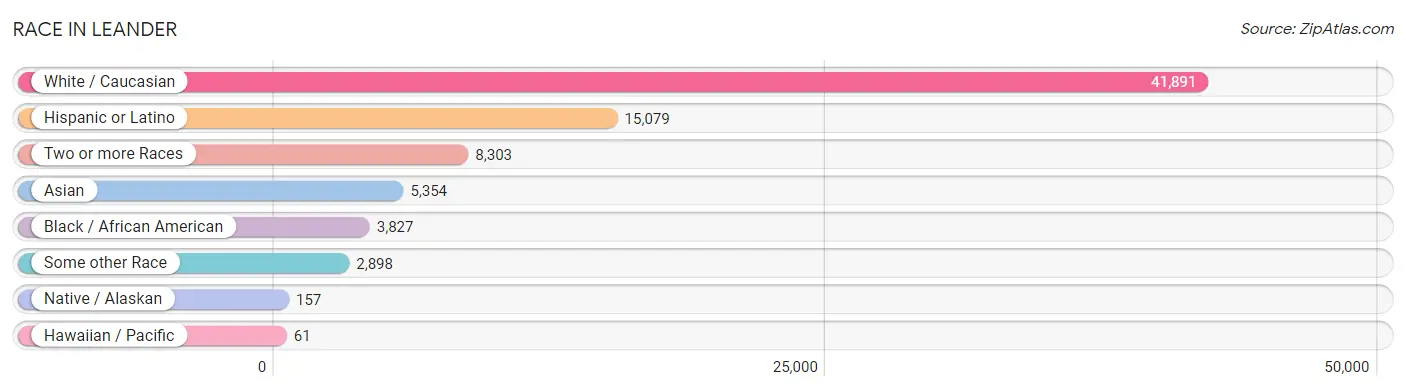
| Race | # Population | % Population |
| Asian | 5,354 | 8.6% |
| Black / African American | 3,827 | 6.1% |
| Hawaiian / Pacific | 61 | 0.1% |
| Hispanic or Latino | 15,079 | 24.1% |
| Native / Alaskan | 157 | 0.3% |
| White / Caucasian | 41,891 | 67.0% |
| Two or more Races | 8,303 | 13.3% |
| Some other Race | 2,898 | 4.6% |
| Total | 62,491 | 100.0% |
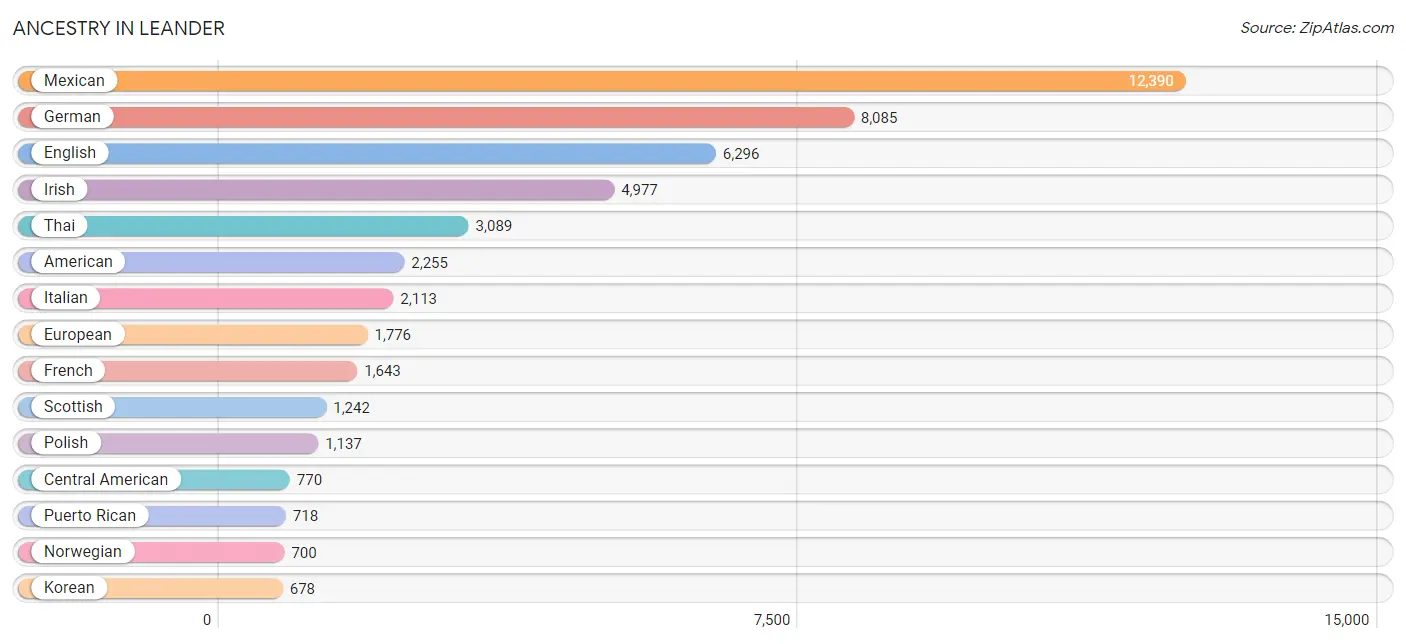
Ancestry in Leander
The most populous ancestries reported in Leander are Mexican (12,390 | 19.8%), German (8,085 | 12.9%), English (6,296 | 10.1%), Irish (4,977 | 8.0%), and Thai (3,089 | 4.9%), together accounting for 55.7% of all Leander residents.
| Ancestry | # Population | % Population |
| Afghan | 37 | 0.1% |
| African | 487 | 0.8% |
| Alsatian | 3 | 0.0% |
| American | 2,255 | 3.6% |
| Apache | 185 | 0.3% |
| Arab | 114 | 0.2% |
| Argentinean | 23 | 0.0% |
| Armenian | 13 | 0.0% |
| Austrian | 104 | 0.2% |
| Belgian | 93 | 0.2% |
| Bhutanese | 301 | 0.5% |
| Blackfeet | 5 | 0.0% |
| Brazilian | 147 | 0.2% |
| British | 489 | 0.8% |
| Burmese | 613 | 1.0% |
| Cajun | 64 | 0.1% |
| Cambodian | 19 | 0.0% |
| Canadian | 56 | 0.1% |
| Celtic | 83 | 0.1% |
| Central American | 770 | 1.2% |
| Cherokee | 114 | 0.2% |
| Chickasaw | 4 | 0.0% |
| Choctaw | 92 | 0.2% |
| Colombian | 34 | 0.1% |
| Costa Rican | 51 | 0.1% |
| Creek | 33 | 0.1% |
| Croatian | 37 | 0.1% |
| Cuban | 58 | 0.1% |
| Czech | 646 | 1.0% |
| Czechoslovakian | 50 | 0.1% |
| Danish | 233 | 0.4% |
| Dutch | 528 | 0.8% |
| Dutch West Indian | 7 | 0.0% |
| Eastern European | 178 | 0.3% |
| Ecuadorian | 19 | 0.0% |
| Egyptian | 67 | 0.1% |
| English | 6,296 | 10.1% |
| European | 1,776 | 2.8% |
| Filipino | 12 | 0.0% |
| Finnish | 30 | 0.1% |
| French | 1,643 | 2.6% |
| French Canadian | 221 | 0.4% |
| German | 8,085 | 12.9% |
| Greek | 297 | 0.5% |
| Guamanian / Chamorro | 115 | 0.2% |
| Guatemalan | 167 | 0.3% |
| Honduran | 240 | 0.4% |
| Hungarian | 69 | 0.1% |
| Indian (Asian) | 627 | 1.0% |
| Inupiat | 36 | 0.1% |
| Iranian | 221 | 0.4% |
| Irish | 4,977 | 8.0% |
| Italian | 2,113 | 3.4% |
| Jamaican | 88 | 0.1% |
| Japanese | 104 | 0.2% |
| Korean | 678 | 1.1% |
| Laotian | 50 | 0.1% |
| Lebanese | 41 | 0.1% |
| Lithuanian | 78 | 0.1% |
| Malaysian | 72 | 0.1% |
| Mexican | 12,390 | 19.8% |
| Mexican American Indian | 149 | 0.2% |
| Mongolian | 29 | 0.1% |
| Navajo | 25 | 0.0% |
| Nigerian | 80 | 0.1% |
| Northern European | 57 | 0.1% |
| Norwegian | 700 | 1.1% |
| Pakistani | 14 | 0.0% |
| Panamanian | 36 | 0.1% |
| Peruvian | 156 | 0.3% |
| Polish | 1,137 | 1.8% |
| Portuguese | 259 | 0.4% |
| Puerto Rican | 718 | 1.1% |
| Romanian | 81 | 0.1% |
| Russian | 346 | 0.5% |
| Salvadoran | 276 | 0.4% |
| Samoan | 23 | 0.0% |
| Scandinavian | 116 | 0.2% |
| Scotch-Irish | 571 | 0.9% |
| Scottish | 1,242 | 2.0% |
| Serbian | 43 | 0.1% |
| Slovak | 42 | 0.1% |
| Slovene | 26 | 0.0% |
| South American | 478 | 0.8% |
| Soviet Union | 6 | 0.0% |
| Spaniard | 197 | 0.3% |
| Spanish | 112 | 0.2% |
| Sri Lankan | 490 | 0.8% |
| Subsaharan African | 650 | 1.0% |
| Swedish | 548 | 0.9% |
| Swiss | 136 | 0.2% |
| Thai | 3,089 | 4.9% |
| Tongan | 23 | 0.0% |
| Turkish | 16 | 0.0% |
| Ukrainian | 128 | 0.2% |
| Venezuelan | 246 | 0.4% |
| Welsh | 264 | 0.4% |
| West Indian | 16 | 0.0% |
| Yugoslavian | 48 | 0.1% | View All 99 Rows |
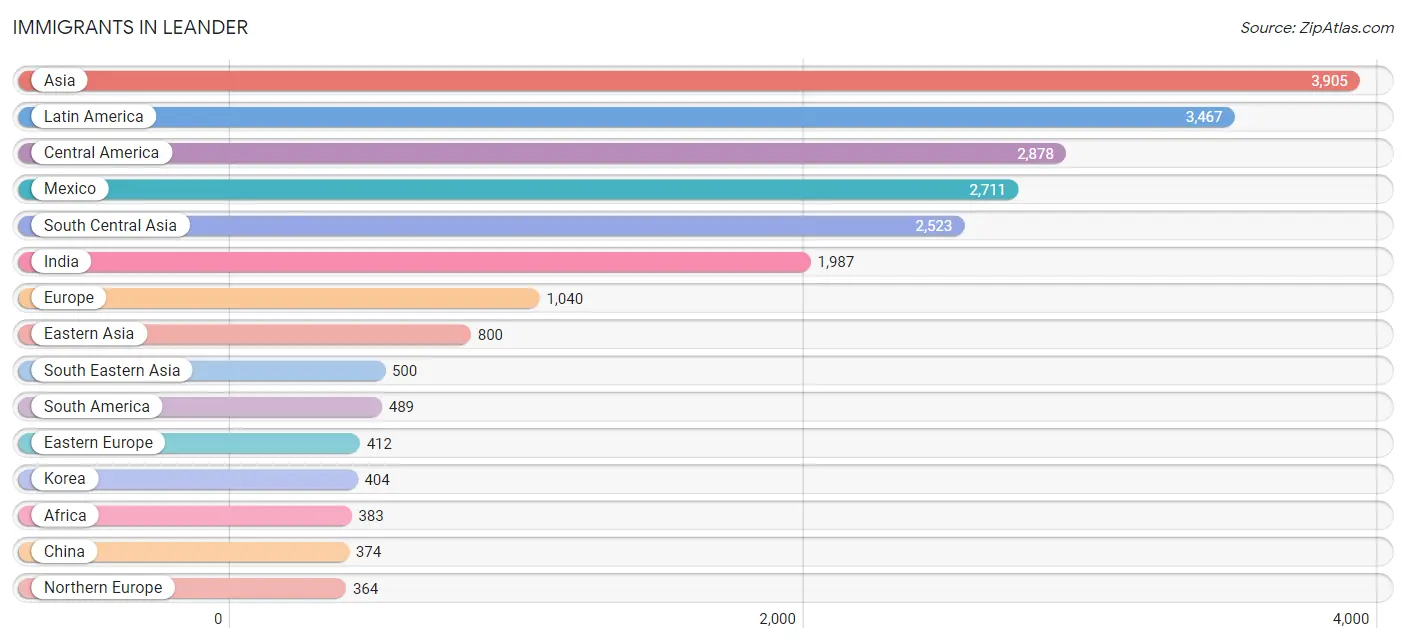
Immigrants in Leander
The most numerous immigrant groups reported in Leander came from Asia (3,905 | 6.2%), Latin America (3,467 | 5.6%), Central America (2,878 | 4.6%), Mexico (2,711 | 4.3%), and South Central Asia (2,523 | 4.0%), together accounting for 24.8% of all Leander residents.
| Immigration Origin | # Population | % Population |
| Afghanistan | 133 | 0.2% |
| Africa | 383 | 0.6% |
| Asia | 3,905 | 6.2% |
| Australia | 79 | 0.1% |
| Bahamas | 5 | 0.0% |
| Bangladesh | 77 | 0.1% |
| Belarus | 11 | 0.0% |
| Bosnia and Herzegovina | 19 | 0.0% |
| Brazil | 131 | 0.2% |
| Cambodia | 20 | 0.0% |
| Cameroon | 126 | 0.2% |
| Canada | 261 | 0.4% |
| Caribbean | 100 | 0.2% |
| Central America | 2,878 | 4.6% |
| China | 374 | 0.6% |
| Colombia | 14 | 0.0% |
| Cuba | 28 | 0.0% |
| Czechoslovakia | 20 | 0.0% |
| Denmark | 19 | 0.0% |
| Eastern Africa | 19 | 0.0% |
| Eastern Asia | 800 | 1.3% |
| Eastern Europe | 412 | 0.7% |
| Ecuador | 19 | 0.0% |
| El Salvador | 84 | 0.1% |
| England | 108 | 0.2% |
| Europe | 1,040 | 1.7% |
| France | 54 | 0.1% |
| Germany | 171 | 0.3% |
| Guatemala | 72 | 0.1% |
| India | 1,987 | 3.2% |
| Indonesia | 26 | 0.0% |
| Iran | 125 | 0.2% |
| Iraq | 13 | 0.0% |
| Ireland | 25 | 0.0% |
| Jamaica | 67 | 0.1% |
| Japan | 22 | 0.0% |
| Kazakhstan | 14 | 0.0% |
| Kenya | 8 | 0.0% |
| Korea | 404 | 0.6% |
| Kuwait | 31 | 0.1% |
| Laos | 24 | 0.0% |
| Latin America | 3,467 | 5.6% |
| Lebanon | 6 | 0.0% |
| Malaysia | 40 | 0.1% |
| Mexico | 2,711 | 4.3% |
| Middle Africa | 126 | 0.2% |
| Nepal | 81 | 0.1% |
| Nigeria | 76 | 0.1% |
| Northern Africa | 52 | 0.1% |
| Northern Europe | 364 | 0.6% |
| Norway | 17 | 0.0% |
| Oceania | 180 | 0.3% |
| Pakistan | 106 | 0.2% |
| Panama | 11 | 0.0% |
| Peru | 136 | 0.2% |
| Philippines | 195 | 0.3% |
| Poland | 192 | 0.3% |
| Portugal | 24 | 0.0% |
| Romania | 80 | 0.1% |
| Russia | 48 | 0.1% |
| Scotland | 76 | 0.1% |
| Senegal | 60 | 0.1% |
| Singapore | 17 | 0.0% |
| South America | 489 | 0.8% |
| South Central Asia | 2,523 | 4.0% |
| South Eastern Asia | 500 | 0.8% |
| Southern Europe | 39 | 0.1% |
| Spain | 15 | 0.0% |
| Sweden | 45 | 0.1% |
| Taiwan | 53 | 0.1% |
| Thailand | 10 | 0.0% |
| Ukraine | 42 | 0.1% |
| Venezuela | 189 | 0.3% |
| Vietnam | 168 | 0.3% |
| Western Africa | 186 | 0.3% |
| Western Asia | 65 | 0.1% |
| Western Europe | 225 | 0.4% | View All 77 Rows |
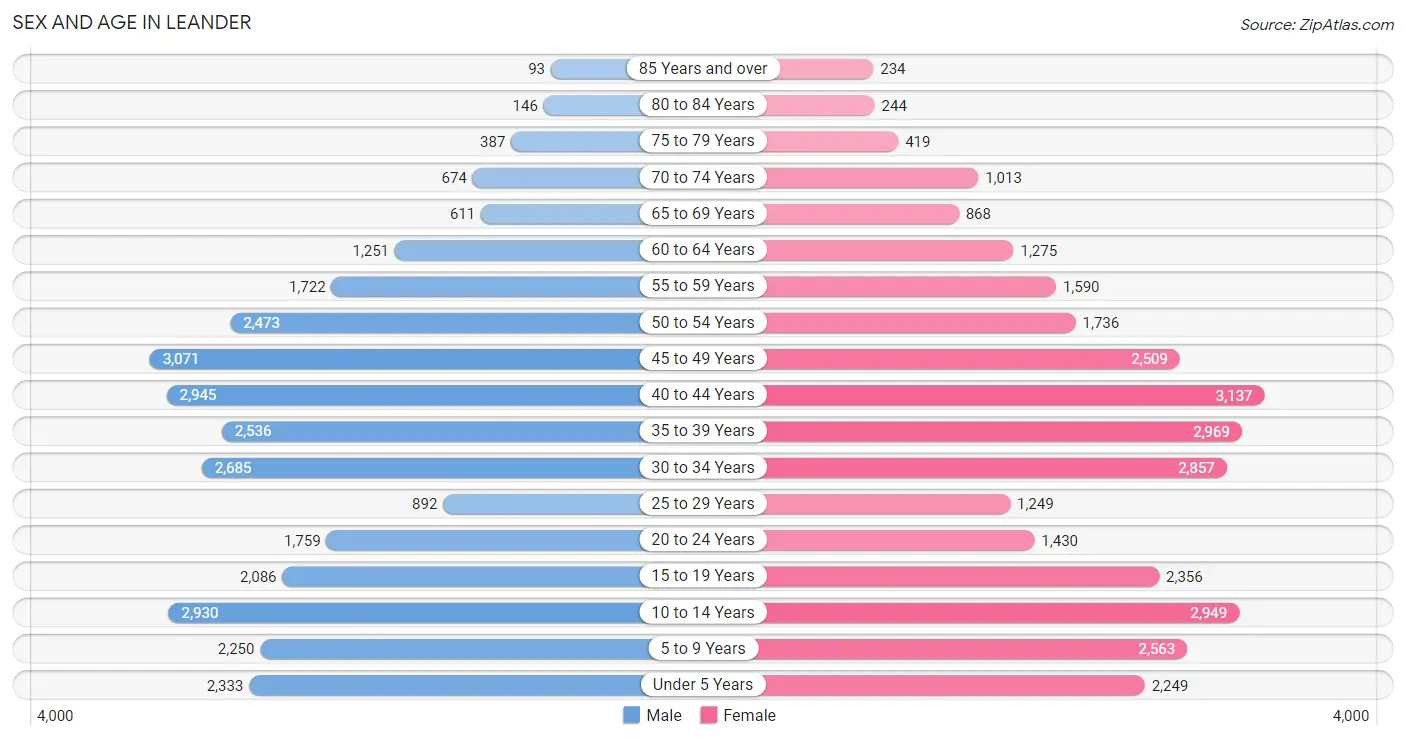
Sex and Age in Leander
Sex and Age in Leander
The most populous age groups in Leander are 45 to 49 Years (3,071 | 10.0%) for men and 40 to 44 Years (3,137 | 9.9%) for women.
| Age Bracket | Male | Female |
| Under 5 Years | 2,333 (7.6%) | 2,249 (7.1%) |
| 5 to 9 Years | 2,250 (7.3%) | 2,563 (8.1%) |
| 10 to 14 Years | 2,930 (9.5%) | 2,949 (9.3%) |
| 15 to 19 Years | 2,086 (6.8%) | 2,356 (7.4%) |
| 20 to 24 Years | 1,759 (5.7%) | 1,430 (4.5%) |
| 25 to 29 Years | 892 (2.9%) | 1,249 (4.0%) |
| 30 to 34 Years | 2,685 (8.7%) | 2,857 (9.0%) |
| 35 to 39 Years | 2,536 (8.2%) | 2,969 (9.4%) |
| 40 to 44 Years | 2,945 (9.6%) | 3,137 (9.9%) |
| 45 to 49 Years | 3,071 (10.0%) | 2,509 (7.9%) |
| 50 to 54 Years | 2,473 (8.0%) | 1,736 (5.5%) |
| 55 to 59 Years | 1,722 (5.6%) | 1,590 (5.0%) |
| 60 to 64 Years | 1,251 (4.1%) | 1,275 (4.0%) |
| 65 to 69 Years | 611 (2.0%) | 868 (2.7%) |
| 70 to 74 Years | 674 (2.2%) | 1,013 (3.2%) |
| 75 to 79 Years | 387 (1.3%) | 419 (1.3%) |
| 80 to 84 Years | 146 (0.5%) | 244 (0.8%) |
| 85 Years and over | 93 (0.3%) | 234 (0.7%) |
| Total | 30,844 (100.0%) | 31,647 (100.0%) |
Families and Households in Leander
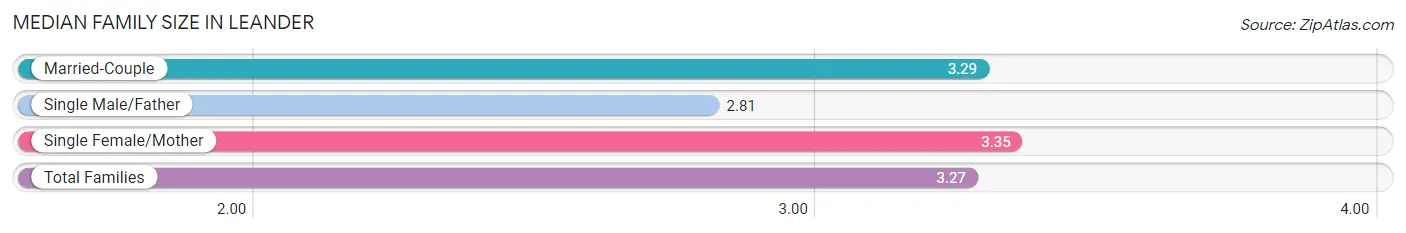
Median Family Size in Leander
The median family size in Leander is 3.27 persons per family, with single female/mother families (1,847 | 10.9%) accounting for the largest median family size of 3.35 persons per family. On the other hand, single male/father families (908 | 5.3%) represent the smallest median family size with 2.81 persons per family.
| Family Type | # Families | Family Size |
| Married-Couple | 14,255 (83.8%) | 3.29 |
| Single Male/Father | 908 (5.3%) | 2.81 |
| Single Female/Mother | 1,847 (10.9%) | 3.35 |
| Total Families | 17,010 (100.0%) | 3.27 |
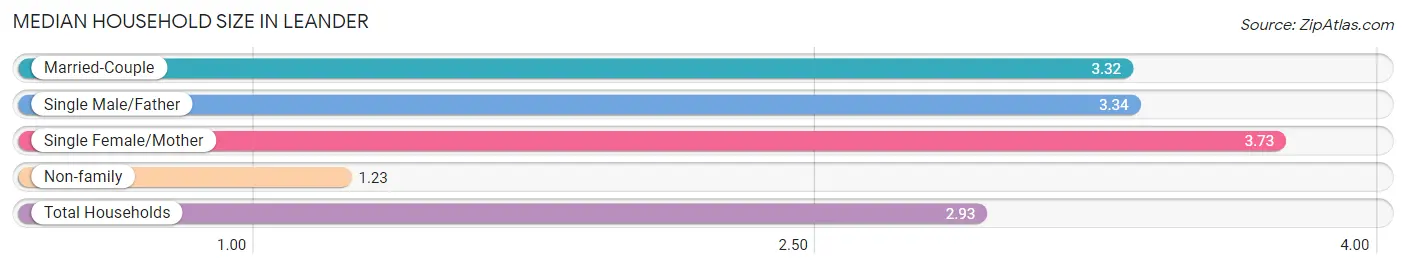
Median Household Size in Leander
The median household size in Leander is 2.93 persons per household, with single female/mother households (1,847 | 8.7%) accounting for the largest median household size of 3.73 persons per household. non-family households (4,295 | 20.2%) represent the smallest median household size with 1.23 persons per household.
| Household Type | # Households | Household Size |
| Married-Couple | 14,255 (66.9%) | 3.32 |
| Single Male/Father | 908 (4.3%) | 3.34 |
| Single Female/Mother | 1,847 (8.7%) | 3.73 |
| Non-family | 4,295 (20.2%) | 1.23 |
| Total Households | 21,305 (100.0%) | 2.93 |
Household Size by Marriage Status in Leander
Out of a total of 21,305 households in Leander, 17,010 (79.8%) are family households, while 4,295 (20.2%) are nonfamily households. The most numerous type of family households are 2-person households, comprising 5,646, and the most common type of nonfamily households are 1-person households, comprising 3,351.
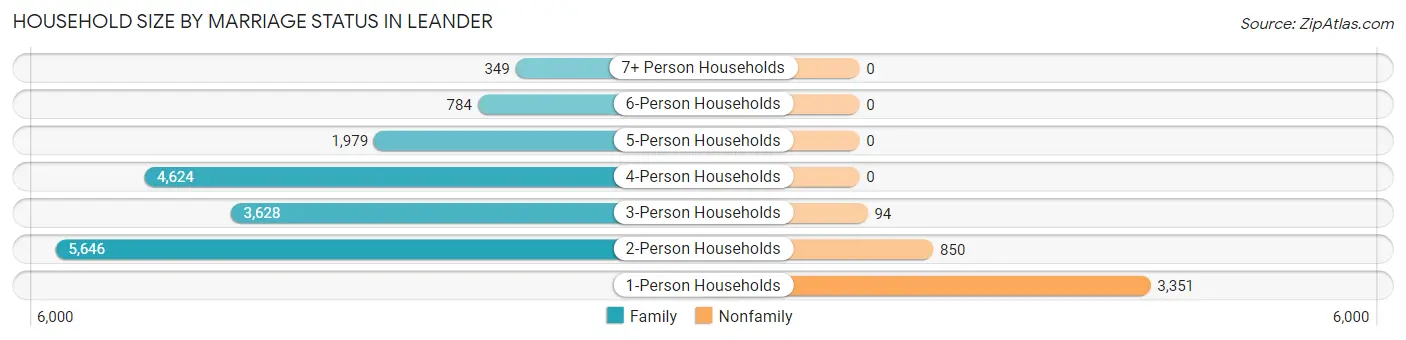
| Household Size | Family Households | Nonfamily Households |
| 1-Person Households | - | 3,351 (15.7%) |
| 2-Person Households | 5,646 (26.5%) | 850 (4.0%) |
| 3-Person Households | 3,628 (17.0%) | 94 (0.4%) |
| 4-Person Households | 4,624 (21.7%) | 0 (0.0%) |
| 5-Person Households | 1,979 (9.3%) | 0 (0.0%) |
| 6-Person Households | 784 (3.7%) | 0 (0.0%) |
| 7+ Person Households | 349 (1.6%) | 0 (0.0%) |
| Total | 17,010 (79.8%) | 4,295 (20.2%) |
Female Fertility in Leander
Fertility by Age in Leander
Average fertility rate in Leander is 63.0 births per 1,000 women. Women in the age bracket of 20 to 34 years have the highest fertility rate with 106.0 births per 1,000 women. Women in the age bracket of 20 to 34 years acount for 55.3% of all women with births.
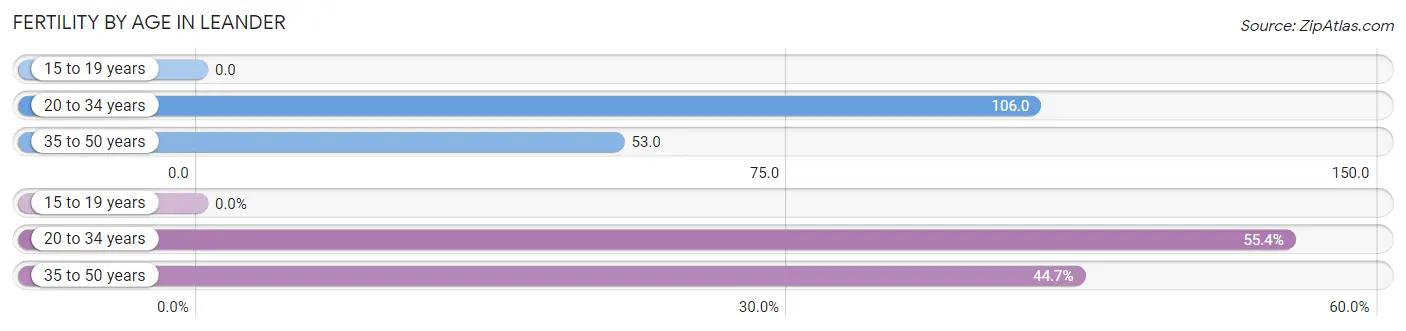
| Age Bracket | Women with Births | Births / 1,000 Women |
| 15 to 19 years | 0 (0.0%) | 0.0 |
| 20 to 34 years | 585 (55.3%) | 106.0 |
| 35 to 50 years | 472 (44.7%) | 53.0 |
| Total | 1,057 (100.0%) | 63.0 |
Fertility by Age by Marriage Status in Leander
94.5% of women with births (1,057) in Leander are married. The highest percentage of unmarried women with births falls into 20 to 34 years age bracket with 7.2% of them unmarried at the time of birth, while the lowest percentage of unmarried women with births belong to 35 to 50 years age bracket with 3.4% of them unmarried.
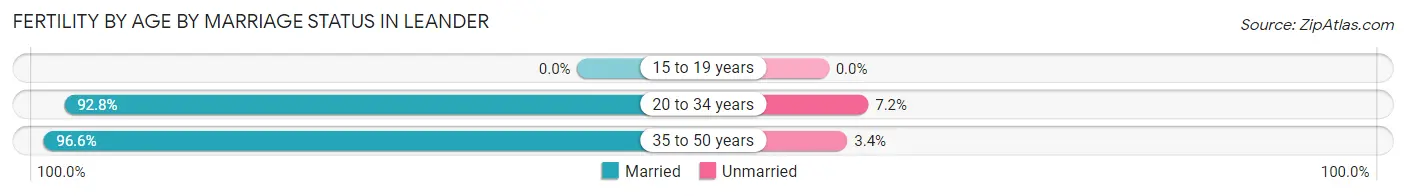
| Age Bracket | Married | Unmarried |
| 15 to 19 years | 0 (0.0%) | 0 (0.0%) |
| 20 to 34 years | 543 (92.8%) | 42 (7.2%) |
| 35 to 50 years | 456 (96.6%) | 16 (3.4%) |
| Total | 999 (94.5%) | 58 (5.5%) |
Fertility by Education in Leander
Average fertility rate in Leander is 63.0 births per 1,000 women. Women with the education attainment of graduate degree have the highest fertility rate of 94.0 births per 1,000 women, while women with the education attainment of less than high school have the lowest fertility at 28.0 births per 1,000 women. Women with the education attainment of bachelor's degree represent 32.5% of all women with births.
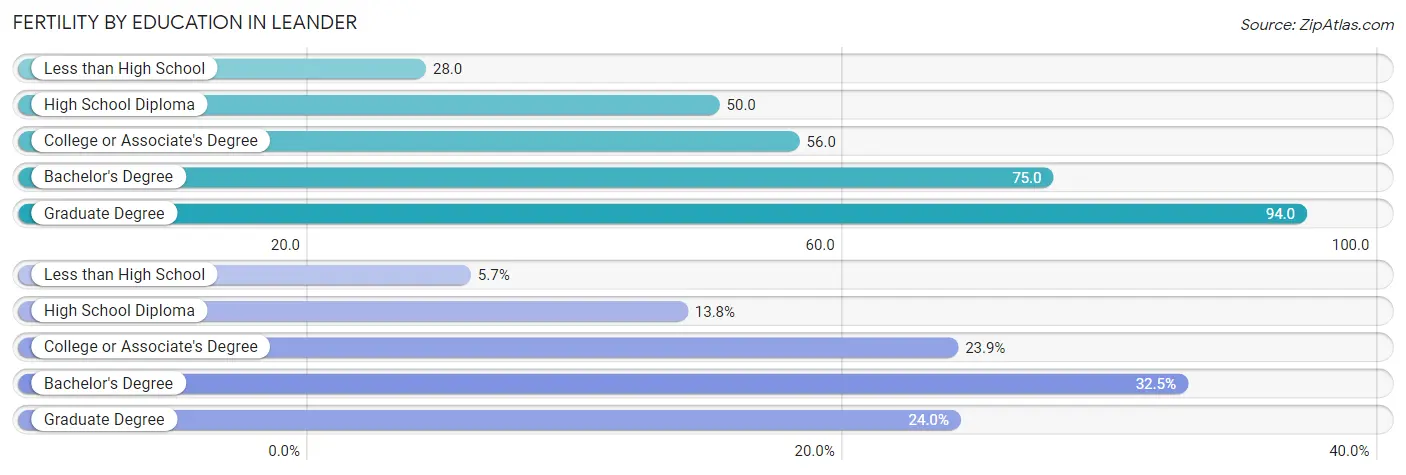
| Educational Attainment | Women with Births | Births / 1,000 Women |
| Less than High School | 60 (5.7%) | 28.0 |
| High School Diploma | 146 (13.8%) | 50.0 |
| College or Associate's Degree | 253 (23.9%) | 56.0 |
| Bachelor's Degree | 344 (32.5%) | 75.0 |
| Graduate Degree | 254 (24.0%) | 94.0 |
| Total | 1,057 (100.0%) | 63.0 |
Fertility by Education by Marriage Status in Leander
5.5% of women with births in Leander are unmarried. Women with the educational attainment of less than high school are most likely to be married with 100.0% of them married at childbirth, while women with the educational attainment of college or associate's degree are least likely to be married with 19.0% of them unmarried at childbirth.
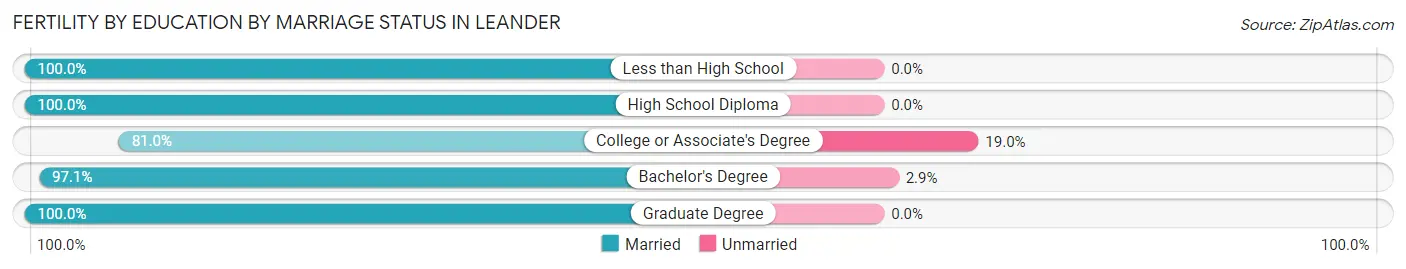
| Educational Attainment | Married | Unmarried |
| Less than High School | 60 (100.0%) | 0 (0.0%) |
| High School Diploma | 146 (100.0%) | 0 (0.0%) |
| College or Associate's Degree | 205 (81.0%) | 48 (19.0%) |
| Bachelor's Degree | 334 (97.1%) | 10 (2.9%) |
| Graduate Degree | 254 (100.0%) | 0 (0.0%) |
| Total | 999 (94.5%) | 58 (5.5%) |
Employment Characteristics in Leander
Employment by Class of Employer in Leander
Among the 33,634 employed individuals in Leander, private company employees (24,142 | 71.8%), local government employees (2,320 | 6.9%), and self-employed (not incorporated) (2,012 | 6.0%) make up the most common classes of employment.
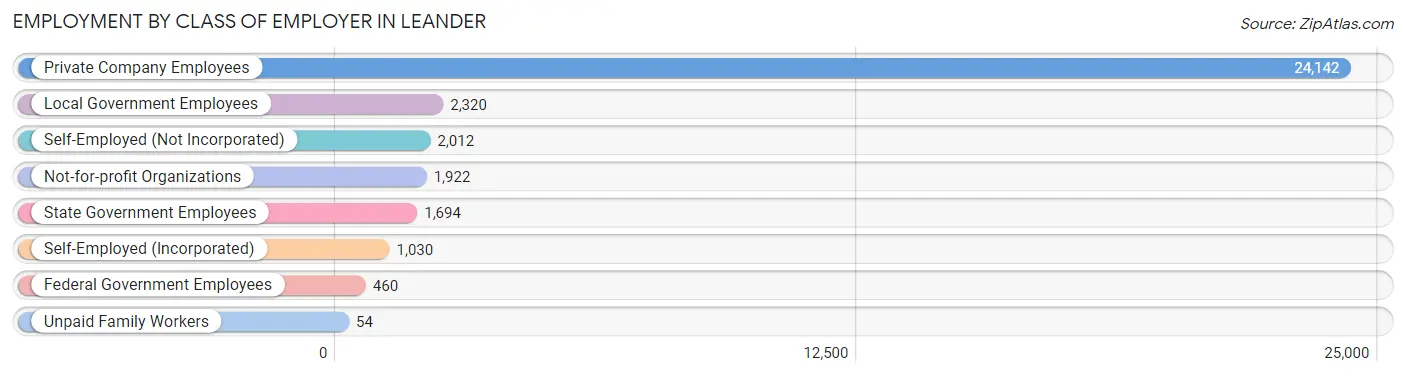
| Employer Class | # Employees | % Employees |
| Private Company Employees | 24,142 | 71.8% |
| Self-Employed (Incorporated) | 1,030 | 3.1% |
| Self-Employed (Not Incorporated) | 2,012 | 6.0% |
| Not-for-profit Organizations | 1,922 | 5.7% |
| Local Government Employees | 2,320 | 6.9% |
| State Government Employees | 1,694 | 5.0% |
| Federal Government Employees | 460 | 1.4% |
| Unpaid Family Workers | 54 | 0.2% |
| Total | 33,634 | 100.0% |
Employment Status by Age in Leander
According to the labor force statistics for Leander, out of the total population over 16 years of age (46,182), 76.3% or 35,237 individuals are in the labor force, with 3.7% or 1,304 of them unemployed. The age group with the highest labor force participation rate is 30 to 34 years, with 88.6% or 4,910 individuals in the labor force. Within the labor force, the 20 to 24 years age range has the highest percentage of unemployed individuals, with 11.4% or 308 of them being unemployed.
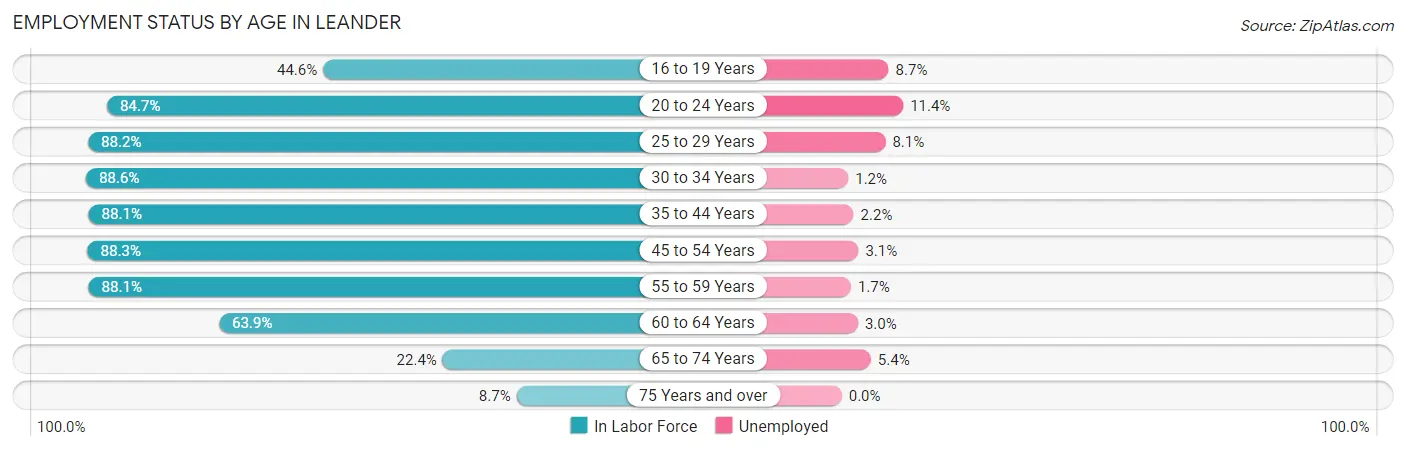
| Age Bracket | In Labor Force | Unemployed |
| 16 to 19 Years | 1,520 (44.6%) | 132 (8.7%) |
| 20 to 24 Years | 2,701 (84.7%) | 308 (11.4%) |
| 25 to 29 Years | 1,888 (88.2%) | 153 (8.1%) |
| 30 to 34 Years | 4,910 (88.6%) | 59 (1.2%) |
| 35 to 44 Years | 10,208 (88.1%) | 225 (2.2%) |
| 45 to 54 Years | 8,644 (88.3%) | 268 (3.1%) |
| 55 to 59 Years | 2,918 (88.1%) | 50 (1.7%) |
| 60 to 64 Years | 1,614 (63.9%) | 48 (3.0%) |
| 65 to 74 Years | 709 (22.4%) | 38 (5.4%) |
| 75 Years and over | 133 (8.7%) | 0 (0.0%) |
| Total | 35,237 (76.3%) | 1,304 (3.7%) |
Employment Status by Educational Attainment in Leander
According to labor force statistics for Leander, 86.5% of individuals (30,186) out of the total population between 25 and 64 years of age (34,897) are in the labor force, with 2.7% or 815 of them being unemployed. The group with the highest labor force participation rate are those with the educational attainment of bachelor's degree or higher, with 89.6% or 15,813 individuals in the labor force. Within the labor force, individuals with less than high school education have the highest percentage of unemployment, with 8.9% or 91 of them being unemployed.
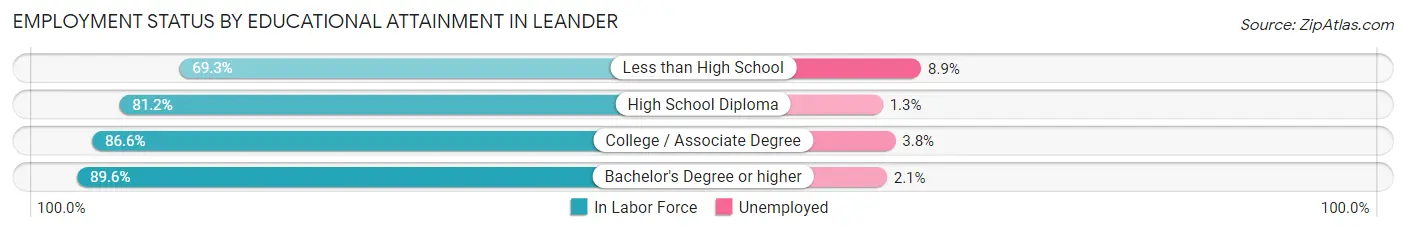
| Educational Attainment | In Labor Force | Unemployed |
| Less than High School | 1,021 (69.3%) | 131 (8.9%) |
| High School Diploma | 4,455 (81.2%) | 71 (1.3%) |
| College / Associate Degree | 8,910 (86.6%) | 391 (3.8%) |
| Bachelor's Degree or higher | 15,813 (89.6%) | 371 (2.1%) |
| Total | 30,186 (86.5%) | 942 (2.7%) |
Employment Occupations by Sex in Leander
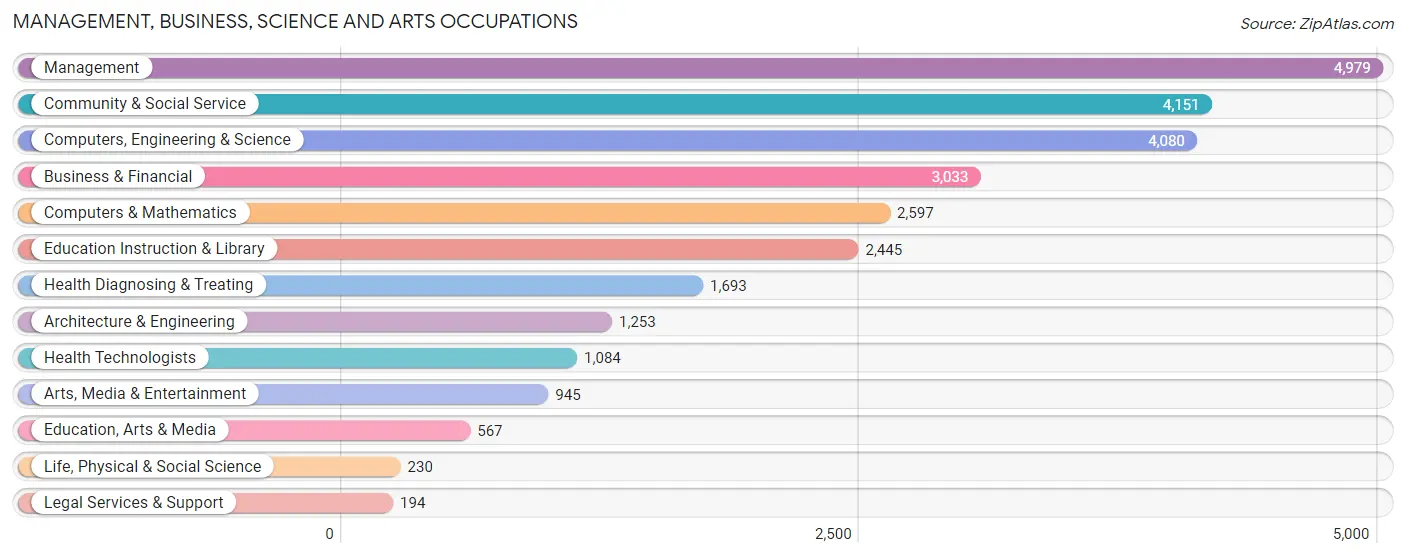
Management, Business, Science and Arts Occupations
The most common Management, Business, Science and Arts occupations in Leander are Management (4,979 | 14.7%), Community & Social Service (4,151 | 12.3%), Computers, Engineering & Science (4,080 | 12.0%), Business & Financial (3,033 | 9.0%), and Computers & Mathematics (2,597 | 7.7%).
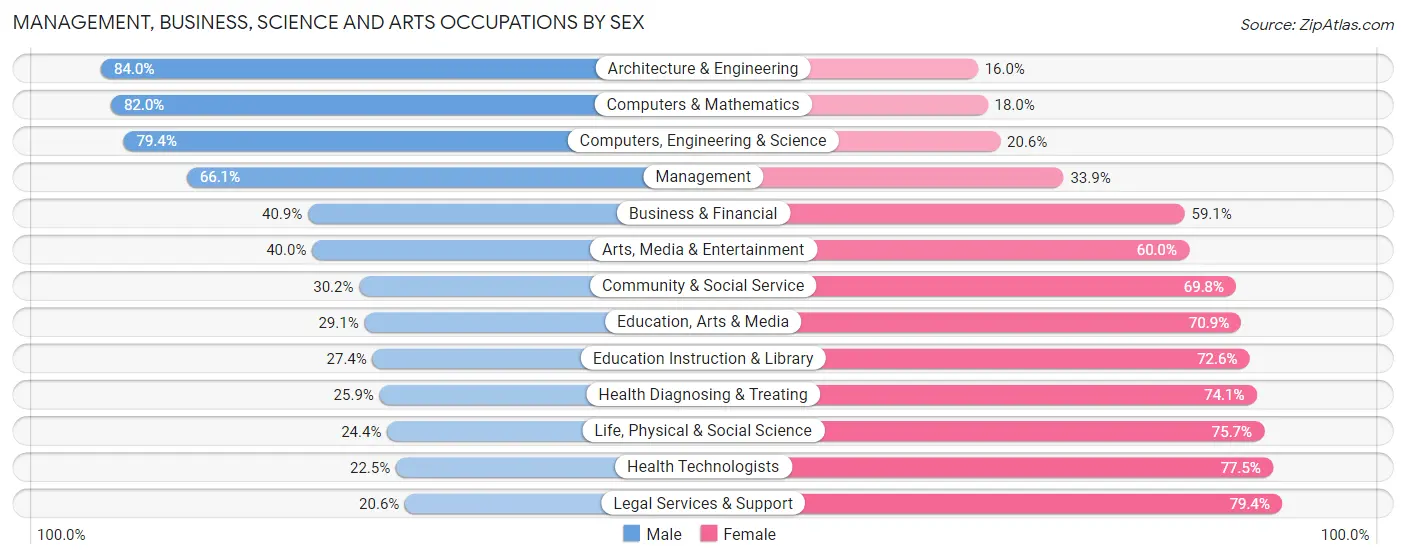
Management, Business, Science and Arts Occupations by Sex
Within the Management, Business, Science and Arts occupations in Leander, the most male-oriented occupations are Architecture & Engineering (84.0%), Computers & Mathematics (82.0%), and Computers, Engineering & Science (79.4%), while the most female-oriented occupations are Legal Services & Support (79.4%), Health Technologists (77.5%), and Life, Physical & Social Science (75.6%).
| Occupation | Male | Female |
| Management | 3,293 (66.1%) | 1,686 (33.9%) |
| Business & Financial | 1,240 (40.9%) | 1,793 (59.1%) |
| Computers, Engineering & Science | 3,238 (79.4%) | 842 (20.6%) |
| Computers & Mathematics | 2,129 (82.0%) | 468 (18.0%) |
| Architecture & Engineering | 1,053 (84.0%) | 200 (16.0%) |
| Life, Physical & Social Science | 56 (24.3%) | 174 (75.6%) |
| Community & Social Service | 1,253 (30.2%) | 2,898 (69.8%) |
| Education, Arts & Media | 165 (29.1%) | 402 (70.9%) |
| Legal Services & Support | 40 (20.6%) | 154 (79.4%) |
| Education Instruction & Library | 670 (27.4%) | 1,775 (72.6%) |
| Arts, Media & Entertainment | 378 (40.0%) | 567 (60.0%) |
| Health Diagnosing & Treating | 439 (25.9%) | 1,254 (74.1%) |
| Health Technologists | 244 (22.5%) | 840 (77.5%) |
| Total (Category) | 9,463 (52.8%) | 8,473 (47.2%) |
| Total (Overall) | 18,812 (55.6%) | 15,045 (44.4%) |
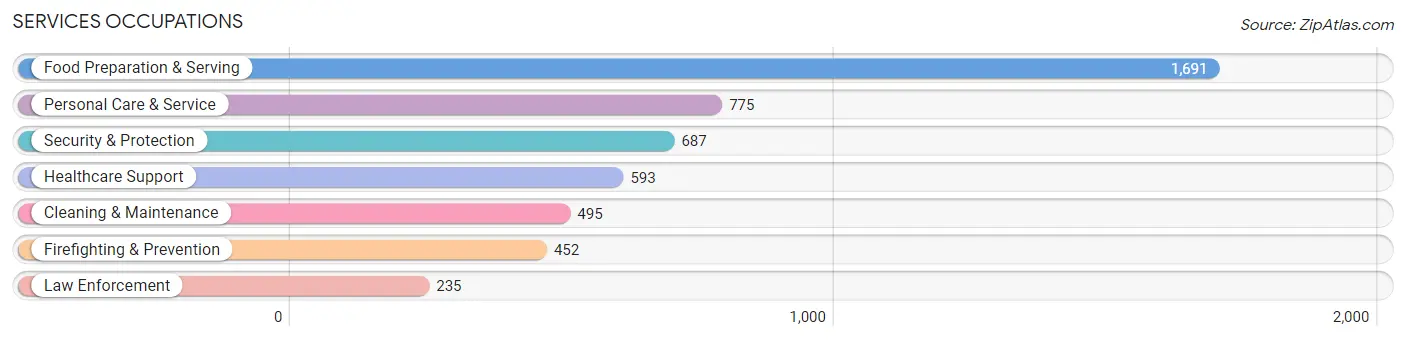
Services Occupations
The most common Services occupations in Leander are Food Preparation & Serving (1,691 | 5.0%), Personal Care & Service (775 | 2.3%), Security & Protection (687 | 2.0%), Healthcare Support (593 | 1.8%), and Cleaning & Maintenance (495 | 1.5%).
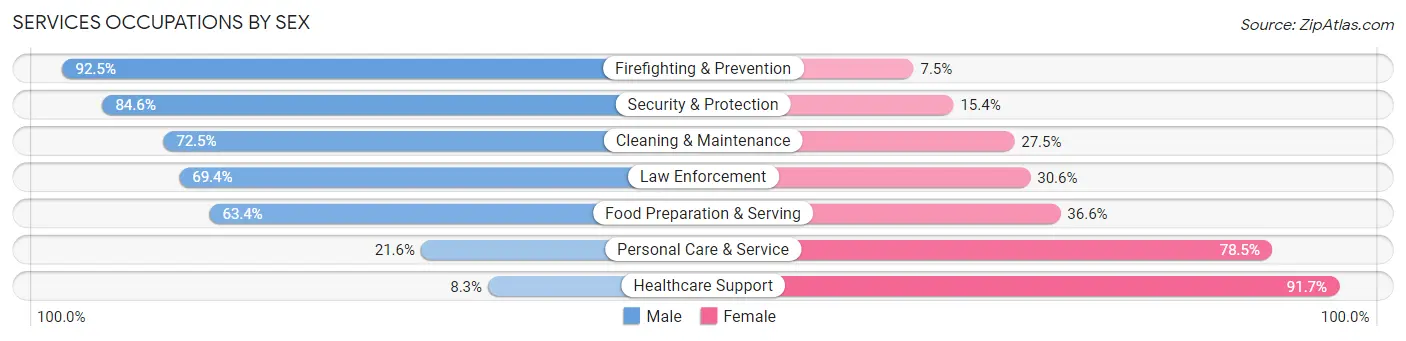
Services Occupations by Sex
Within the Services occupations in Leander, the most male-oriented occupations are Firefighting & Prevention (92.5%), Security & Protection (84.6%), and Cleaning & Maintenance (72.5%), while the most female-oriented occupations are Healthcare Support (91.7%), Personal Care & Service (78.4%), and Food Preparation & Serving (36.6%).
| Occupation | Male | Female |
| Healthcare Support | 49 (8.3%) | 544 (91.7%) |
| Security & Protection | 581 (84.6%) | 106 (15.4%) |
| Firefighting & Prevention | 418 (92.5%) | 34 (7.5%) |
| Law Enforcement | 163 (69.4%) | 72 (30.6%) |
| Food Preparation & Serving | 1,072 (63.4%) | 619 (36.6%) |
| Cleaning & Maintenance | 359 (72.5%) | 136 (27.5%) |
| Personal Care & Service | 167 (21.5%) | 608 (78.4%) |
| Total (Category) | 2,228 (52.5%) | 2,013 (47.5%) |
| Total (Overall) | 18,812 (55.6%) | 15,045 (44.4%) |
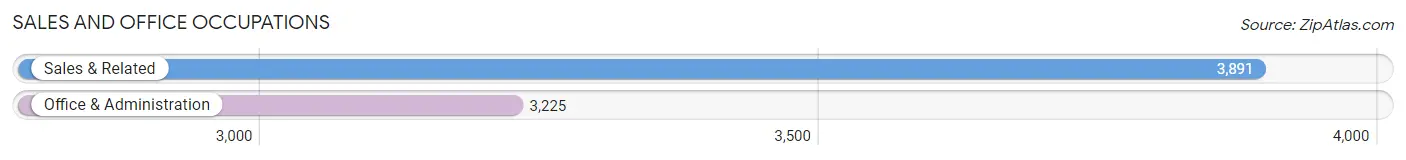
Sales and Office Occupations
The most common Sales and Office occupations in Leander are Sales & Related (3,891 | 11.5%), and Office & Administration (3,225 | 9.5%).
Sales and Office Occupations by Sex
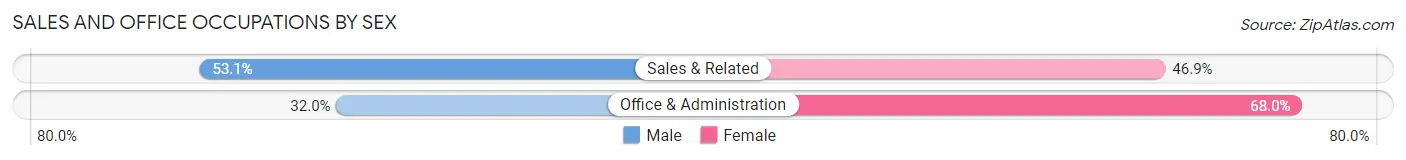
| Occupation | Male | Female |
| Sales & Related | 2,066 (53.1%) | 1,825 (46.9%) |
| Office & Administration | 1,033 (32.0%) | 2,192 (68.0%) |
| Total (Category) | 3,099 (43.5%) | 4,017 (56.5%) |
| Total (Overall) | 18,812 (55.6%) | 15,045 (44.4%) |
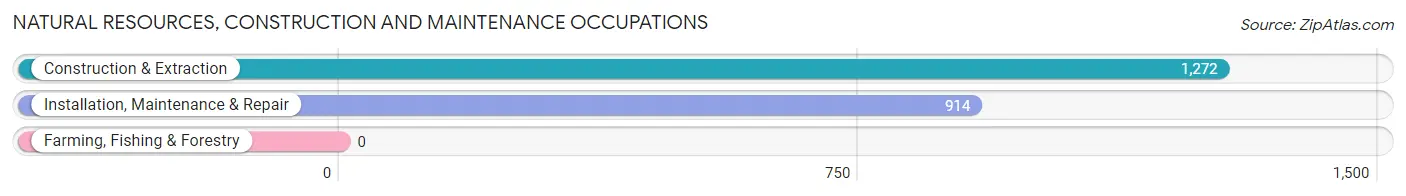
Natural Resources, Construction and Maintenance Occupations
The most common Natural Resources, Construction and Maintenance occupations in Leander are Construction & Extraction (1,272 | 3.8%), and Installation, Maintenance & Repair (914 | 2.7%).
Natural Resources, Construction and Maintenance Occupations by Sex
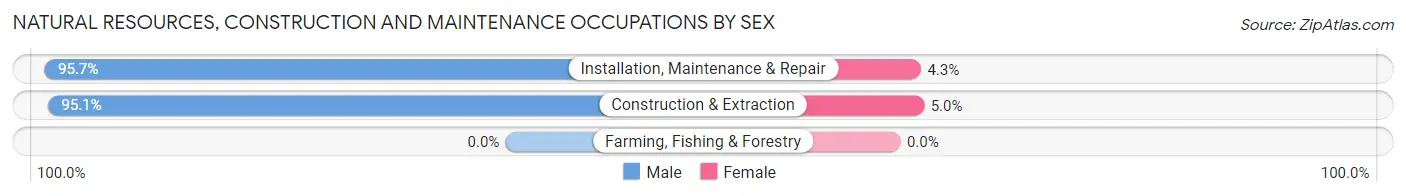
| Occupation | Male | Female |
| Farming, Fishing & Forestry | 0 (0.0%) | 0 (0.0%) |
| Construction & Extraction | 1,209 (95.1%) | 63 (5.0%) |
| Installation, Maintenance & Repair | 875 (95.7%) | 39 (4.3%) |
| Total (Category) | 2,084 (95.3%) | 102 (4.7%) |
| Total (Overall) | 18,812 (55.6%) | 15,045 (44.4%) |
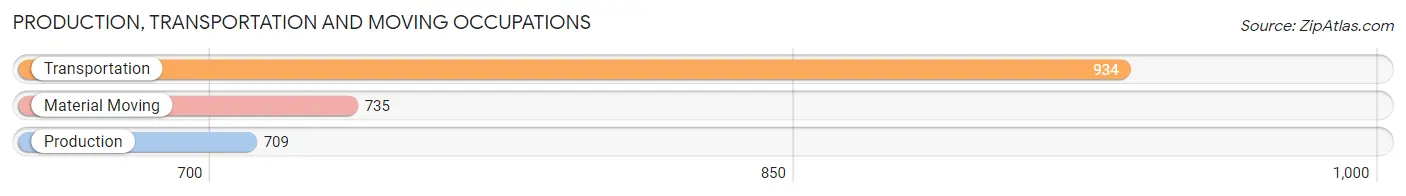
Production, Transportation and Moving Occupations
The most common Production, Transportation and Moving occupations in Leander are Transportation (934 | 2.8%), Material Moving (735 | 2.2%), and Production (709 | 2.1%).
Production, Transportation and Moving Occupations by Sex
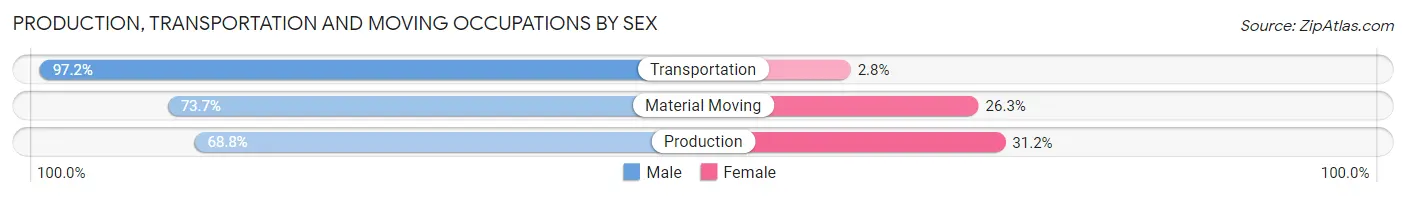
| Occupation | Male | Female |
| Production | 488 (68.8%) | 221 (31.2%) |
| Transportation | 908 (97.2%) | 26 (2.8%) |
| Material Moving | 542 (73.7%) | 193 (26.3%) |
| Total (Category) | 1,938 (81.5%) | 440 (18.5%) |
| Total (Overall) | 18,812 (55.6%) | 15,045 (44.4%) |
Employment Industries by Sex in Leander
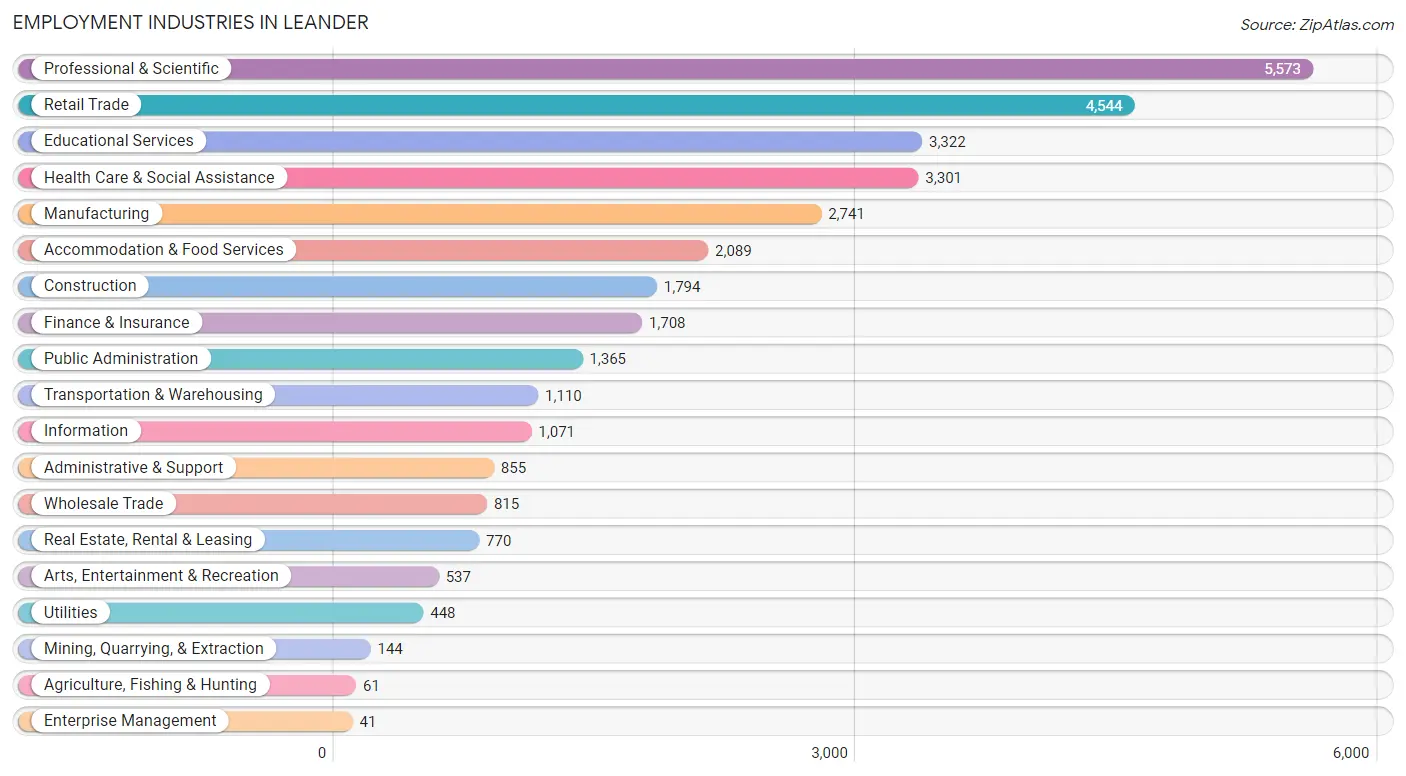
Employment Industries in Leander
The major employment industries in Leander include Professional & Scientific (5,573 | 16.5%), Retail Trade (4,544 | 13.4%), Educational Services (3,322 | 9.8%), Health Care & Social Assistance (3,301 | 9.8%), and Manufacturing (2,741 | 8.1%).
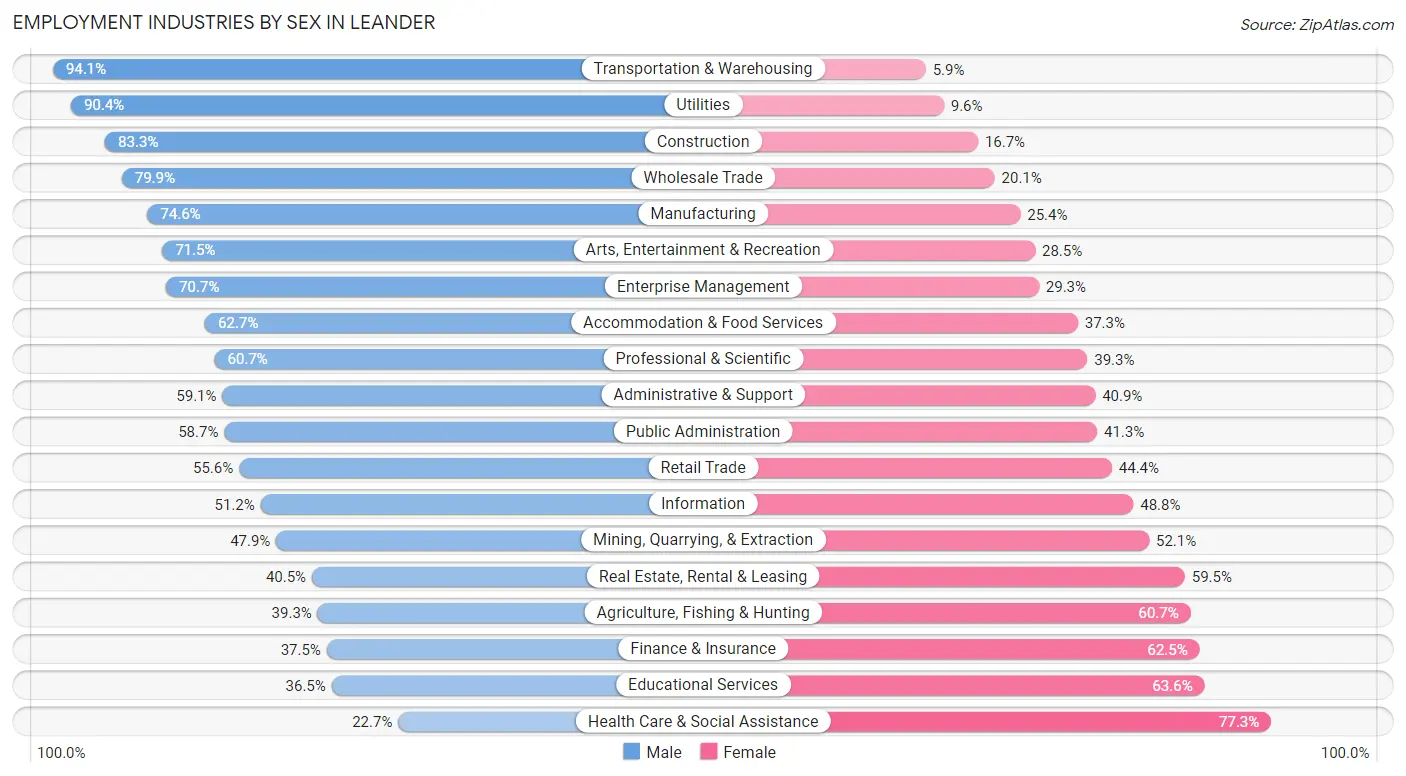
Employment Industries by Sex in Leander
The Leander industries that see more men than women are Transportation & Warehousing (94.1%), Utilities (90.4%), and Construction (83.3%), whereas the industries that tend to have a higher number of women are Health Care & Social Assistance (77.3%), Educational Services (63.5%), and Finance & Insurance (62.5%).
| Industry | Male | Female |
| Agriculture, Fishing & Hunting | 24 (39.3%) | 37 (60.7%) |
| Mining, Quarrying, & Extraction | 69 (47.9%) | 75 (52.1%) |
| Construction | 1,495 (83.3%) | 299 (16.7%) |
| Manufacturing | 2,044 (74.6%) | 697 (25.4%) |
| Wholesale Trade | 651 (79.9%) | 164 (20.1%) |
| Retail Trade | 2,527 (55.6%) | 2,017 (44.4%) |
| Transportation & Warehousing | 1,045 (94.1%) | 65 (5.9%) |
| Utilities | 405 (90.4%) | 43 (9.6%) |
| Information | 548 (51.2%) | 523 (48.8%) |
| Finance & Insurance | 640 (37.5%) | 1,068 (62.5%) |
| Real Estate, Rental & Leasing | 312 (40.5%) | 458 (59.5%) |
| Professional & Scientific | 3,383 (60.7%) | 2,190 (39.3%) |
| Enterprise Management | 29 (70.7%) | 12 (29.3%) |
| Administrative & Support | 505 (59.1%) | 350 (40.9%) |
| Educational Services | 1,211 (36.4%) | 2,111 (63.5%) |
| Health Care & Social Assistance | 748 (22.7%) | 2,553 (77.3%) |
| Arts, Entertainment & Recreation | 384 (71.5%) | 153 (28.5%) |
| Accommodation & Food Services | 1,309 (62.7%) | 780 (37.3%) |
| Public Administration | 801 (58.7%) | 564 (41.3%) |
| Total | 18,812 (55.6%) | 15,045 (44.4%) |
Education in Leander
School Enrollment in Leander
The most common levels of schooling among the 17,982 students in Leander are middle school (4,333 | 24.1%), high school (4,266 | 23.7%), and elementary school (3,963 | 22.0%).
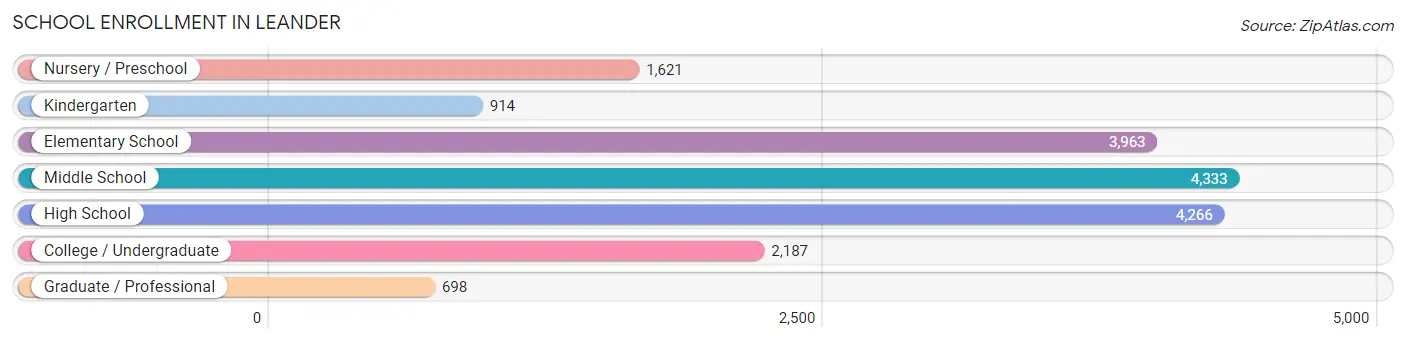
| School Level | # Students | % Students |
| Nursery / Preschool | 1,621 | 9.0% |
| Kindergarten | 914 | 5.1% |
| Elementary School | 3,963 | 22.0% |
| Middle School | 4,333 | 24.1% |
| High School | 4,266 | 23.7% |
| College / Undergraduate | 2,187 | 12.2% |
| Graduate / Professional | 698 | 3.9% |
| Total | 17,982 | 100.0% |
School Enrollment by Age by Funding Source in Leander
Out of a total of 17,982 students who are enrolled in schools in Leander, 2,410 (13.4%) attend a private institution, while the remaining 15,572 (86.6%) are enrolled in public schools. The age group of 3 to 4 year olds has the highest likelihood of being enrolled in private schools, with 674 (50.0% in the age bracket) enrolled. Conversely, the age group of 18 to 19 year olds has the lowest likelihood of being enrolled in a private school, with 1,099 (96.5% in the age bracket) attending a public institution.
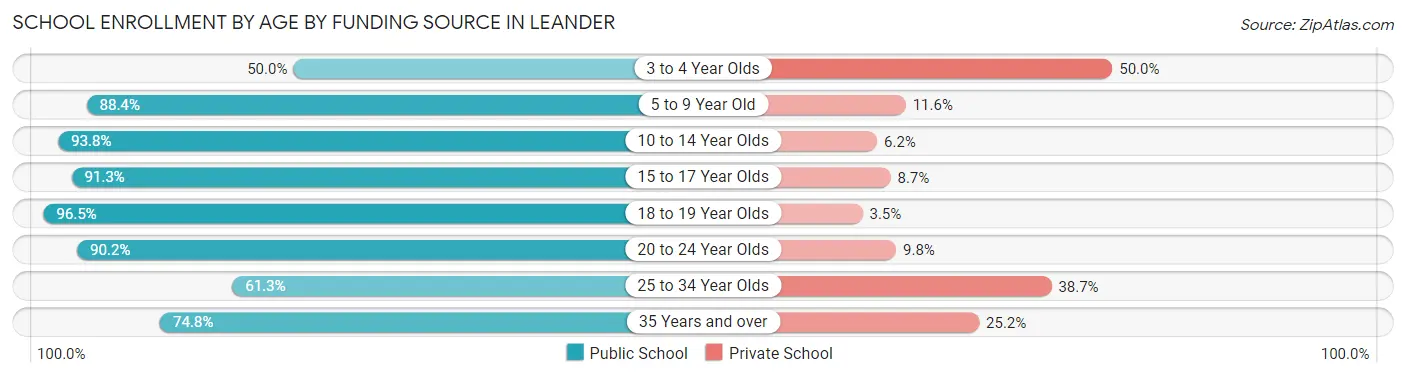
| Age Bracket | Public School | Private School |
| 3 to 4 Year Olds | 673 (50.0%) | 674 (50.0%) |
| 5 to 9 Year Old | 4,069 (88.4%) | 532 (11.6%) |
| 10 to 14 Year Olds | 5,150 (93.8%) | 342 (6.2%) |
| 15 to 17 Year Olds | 2,552 (91.3%) | 244 (8.7%) |
| 18 to 19 Year Olds | 1,099 (96.5%) | 40 (3.5%) |
| 20 to 24 Year Olds | 868 (90.2%) | 94 (9.8%) |
| 25 to 34 Year Olds | 282 (61.3%) | 178 (38.7%) |
| 35 Years and over | 886 (74.8%) | 299 (25.2%) |
| Total | 15,572 (86.6%) | 2,410 (13.4%) |
Educational Attainment by Field of Study in Leander
Business (4,020 | 19.2%), engineering (2,809 | 13.4%), education (2,279 | 10.9%), computers & mathematics (1,967 | 9.4%), and science & technology (1,393 | 6.7%) are the most common fields of study among 20,953 individuals in Leander who have obtained a bachelor's degree or higher.
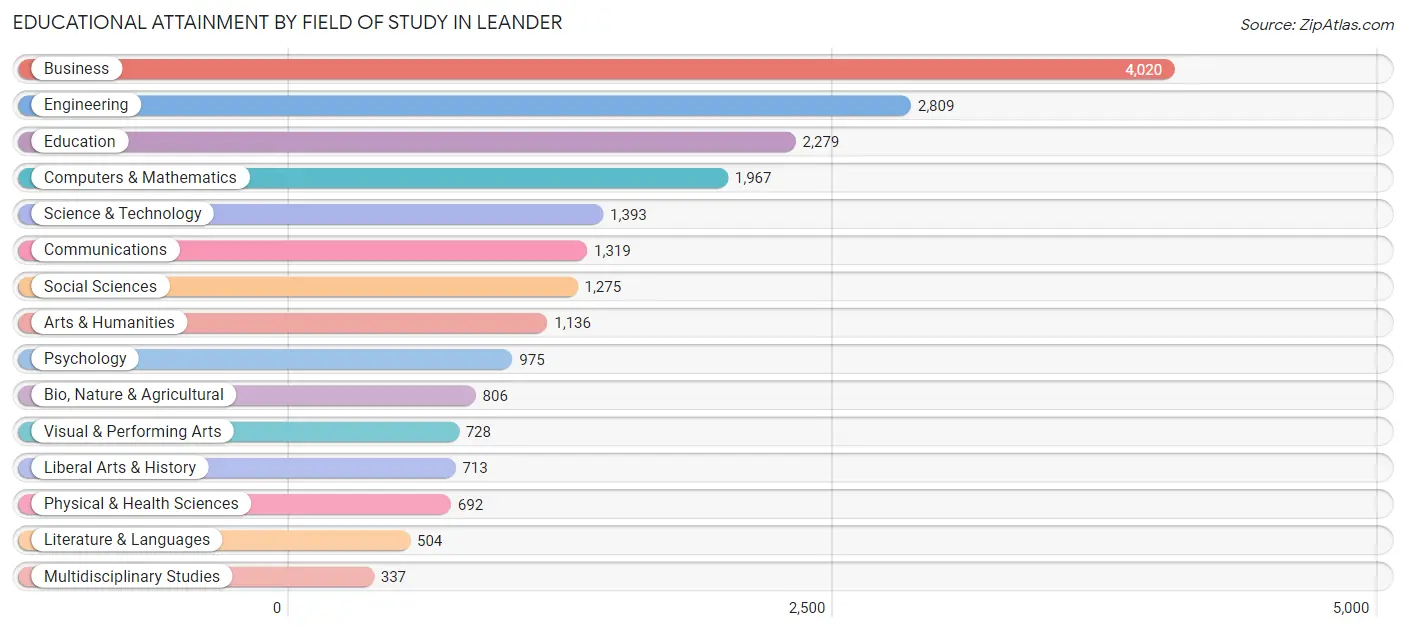
| Field of Study | # Graduates | % Graduates |
| Computers & Mathematics | 1,967 | 9.4% |
| Bio, Nature & Agricultural | 806 | 3.8% |
| Physical & Health Sciences | 692 | 3.3% |
| Psychology | 975 | 4.6% |
| Social Sciences | 1,275 | 6.1% |
| Engineering | 2,809 | 13.4% |
| Multidisciplinary Studies | 337 | 1.6% |
| Science & Technology | 1,393 | 6.7% |
| Business | 4,020 | 19.2% |
| Education | 2,279 | 10.9% |
| Literature & Languages | 504 | 2.4% |
| Liberal Arts & History | 713 | 3.4% |
| Visual & Performing Arts | 728 | 3.5% |
| Communications | 1,319 | 6.3% |
| Arts & Humanities | 1,136 | 5.4% |
| Total | 20,953 | 100.0% |
Transportation & Commute in Leander
Vehicle Availability by Sex in Leander
The most prevalent vehicle ownership categories in Leander are males with 2 vehicles (9,576, accounting for 51.2%) and females with 2 vehicles (7,827, making up 64.2%).
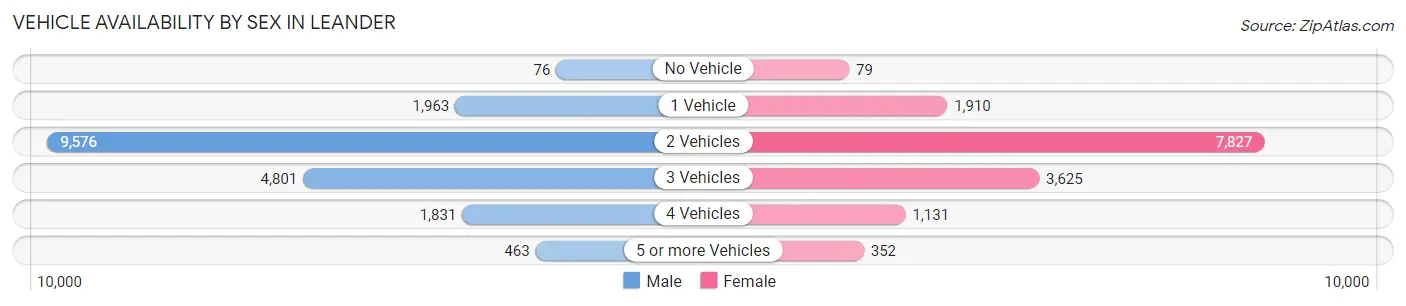
| Vehicles Available | Male | Female |
| No Vehicle | 76 (0.4%) | 79 (0.5%) |
| 1 Vehicle | 1,963 (10.5%) | 1,910 (12.8%) |
| 2 Vehicles | 9,576 (51.2%) | 7,827 (52.4%) |
| 3 Vehicles | 4,801 (25.7%) | 3,625 (24.3%) |
| 4 Vehicles | 1,831 (9.8%) | 1,131 (7.6%) |
| 5 or more Vehicles | 463 (2.5%) | 352 (2.4%) |
| Total | 18,710 (100.0%) | 14,924 (100.0%) |
Commute Time in Leander
The most frequently occuring commute durations in Leander are 30 to 34 minutes (4,593 commuters, 18.4%), 15 to 19 minutes (3,144 commuters, 12.6%), and 45 to 59 minutes (2,948 commuters, 11.8%).
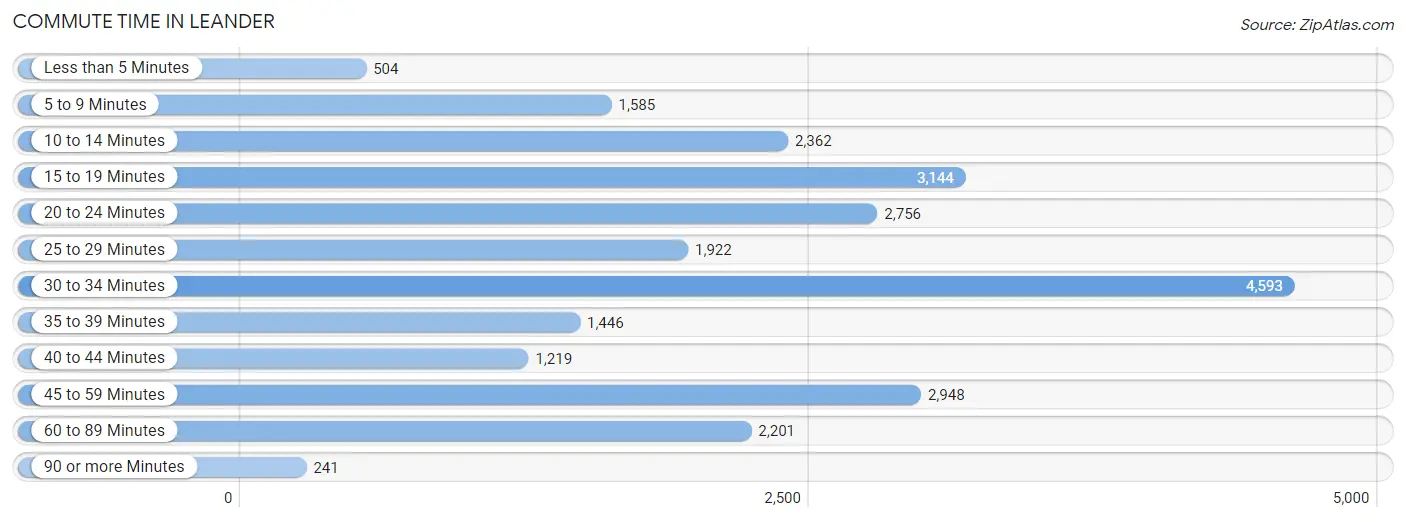
| Commute Time | # Commuters | % Commuters |
| Less than 5 Minutes | 504 | 2.0% |
| 5 to 9 Minutes | 1,585 | 6.4% |
| 10 to 14 Minutes | 2,362 | 9.5% |
| 15 to 19 Minutes | 3,144 | 12.6% |
| 20 to 24 Minutes | 2,756 | 11.1% |
| 25 to 29 Minutes | 1,922 | 7.7% |
| 30 to 34 Minutes | 4,593 | 18.4% |
| 35 to 39 Minutes | 1,446 | 5.8% |
| 40 to 44 Minutes | 1,219 | 4.9% |
| 45 to 59 Minutes | 2,948 | 11.8% |
| 60 to 89 Minutes | 2,201 | 8.8% |
| 90 or more Minutes | 241 | 1.0% |
Commute Time by Sex in Leander
The most common commute times in Leander are 30 to 34 minutes (2,862 commuters, 20.2%) for males and 30 to 34 minutes (1,731 commuters, 16.1%) for females.
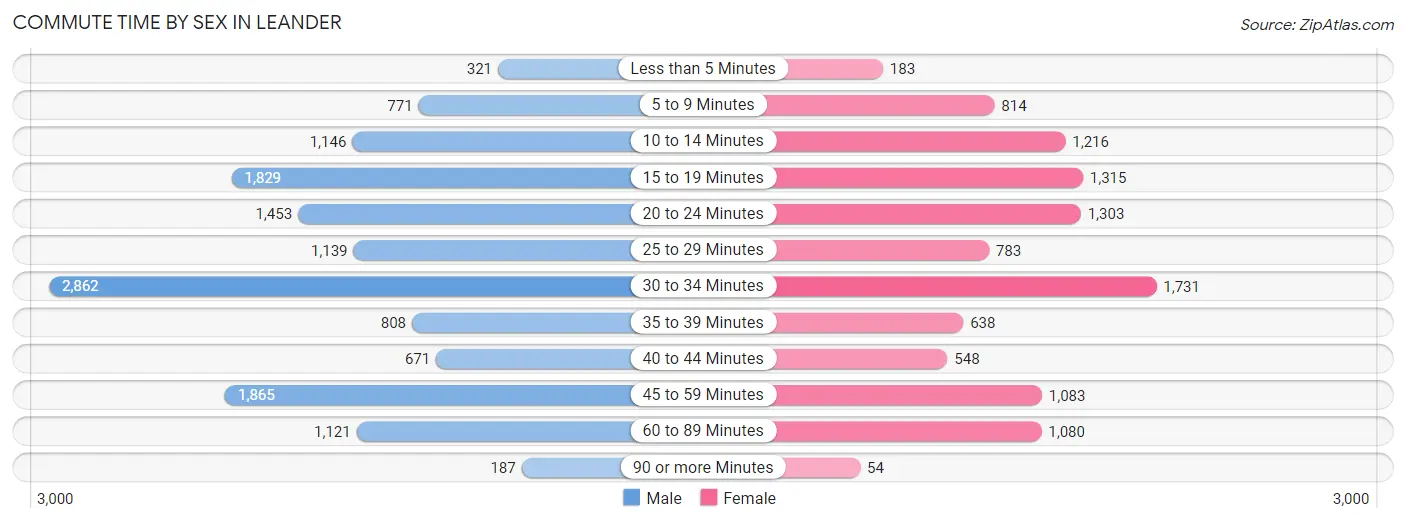
| Commute Time | Male | Female |
| Less than 5 Minutes | 321 (2.3%) | 183 (1.7%) |
| 5 to 9 Minutes | 771 (5.4%) | 814 (7.6%) |
| 10 to 14 Minutes | 1,146 (8.1%) | 1,216 (11.3%) |
| 15 to 19 Minutes | 1,829 (12.9%) | 1,315 (12.2%) |
| 20 to 24 Minutes | 1,453 (10.2%) | 1,303 (12.1%) |
| 25 to 29 Minutes | 1,139 (8.0%) | 783 (7.3%) |
| 30 to 34 Minutes | 2,862 (20.2%) | 1,731 (16.1%) |
| 35 to 39 Minutes | 808 (5.7%) | 638 (5.9%) |
| 40 to 44 Minutes | 671 (4.7%) | 548 (5.1%) |
| 45 to 59 Minutes | 1,865 (13.2%) | 1,083 (10.1%) |
| 60 to 89 Minutes | 1,121 (7.9%) | 1,080 (10.1%) |
| 90 or more Minutes | 187 (1.3%) | 54 (0.5%) |
Time of Departure to Work by Sex in Leander
The most frequent times of departure to work in Leander are 7:00 AM to 7:29 AM (2,063, 14.6%) for males and 7:00 AM to 7:29 AM (1,926, 17.9%) for females.
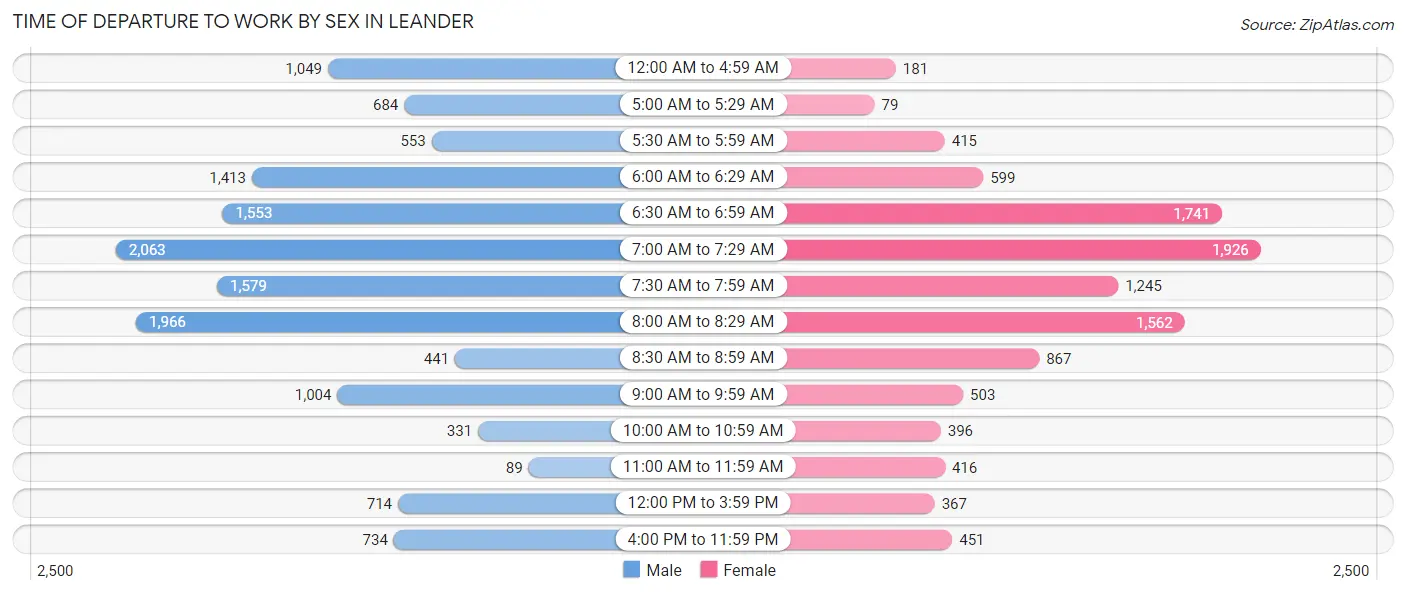
| Time of Departure | Male | Female |
| 12:00 AM to 4:59 AM | 1,049 (7.4%) | 181 (1.7%) |
| 5:00 AM to 5:29 AM | 684 (4.8%) | 79 (0.7%) |
| 5:30 AM to 5:59 AM | 553 (3.9%) | 415 (3.9%) |
| 6:00 AM to 6:29 AM | 1,413 (10.0%) | 599 (5.6%) |
| 6:30 AM to 6:59 AM | 1,553 (11.0%) | 1,741 (16.2%) |
| 7:00 AM to 7:29 AM | 2,063 (14.6%) | 1,926 (17.9%) |
| 7:30 AM to 7:59 AM | 1,579 (11.1%) | 1,245 (11.6%) |
| 8:00 AM to 8:29 AM | 1,966 (13.9%) | 1,562 (14.5%) |
| 8:30 AM to 8:59 AM | 441 (3.1%) | 867 (8.1%) |
| 9:00 AM to 9:59 AM | 1,004 (7.1%) | 503 (4.7%) |
| 10:00 AM to 10:59 AM | 331 (2.3%) | 396 (3.7%) |
| 11:00 AM to 11:59 AM | 89 (0.6%) | 416 (3.9%) |
| 12:00 PM to 3:59 PM | 714 (5.0%) | 367 (3.4%) |
| 4:00 PM to 11:59 PM | 734 (5.2%) | 451 (4.2%) |
| Total | 14,173 (100.0%) | 10,748 (100.0%) |
Housing Occupancy in Leander
Occupancy by Ownership in Leander
Of the total 21,305 dwellings in Leander, owner-occupied units account for 16,276 (76.4%), while renter-occupied units make up 5,029 (23.6%).
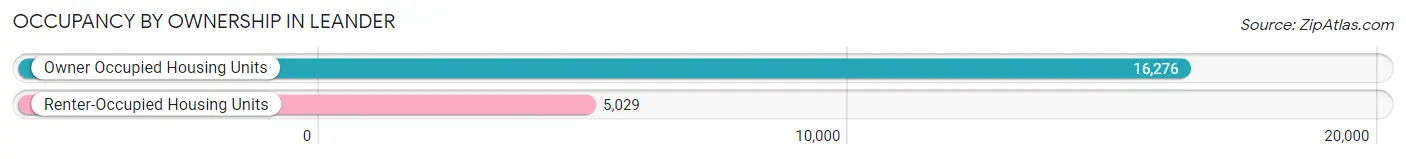
| Occupancy | # Housing Units | % Housing Units |
| Owner Occupied Housing Units | 16,276 | 76.4% |
| Renter-Occupied Housing Units | 5,029 | 23.6% |
| Total Occupied Housing Units | 21,305 | 100.0% |
Occupancy by Household Size in Leander
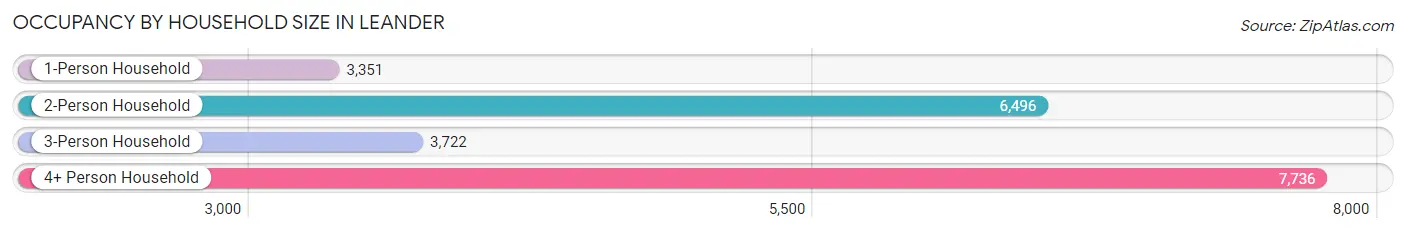
| Household Size | # Housing Units | % Housing Units |
| 1-Person Household | 3,351 | 15.7% |
| 2-Person Household | 6,496 | 30.5% |
| 3-Person Household | 3,722 | 17.5% |
| 4+ Person Household | 7,736 | 36.3% |
| Total Housing Units | 21,305 | 100.0% |
Occupancy by Ownership by Household Size in Leander
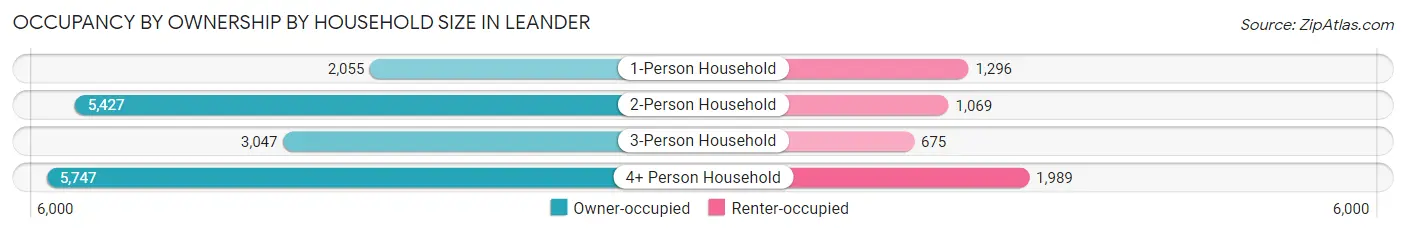
| Household Size | Owner-occupied | Renter-occupied |
| 1-Person Household | 2,055 (61.3%) | 1,296 (38.7%) |
| 2-Person Household | 5,427 (83.5%) | 1,069 (16.5%) |
| 3-Person Household | 3,047 (81.9%) | 675 (18.1%) |
| 4+ Person Household | 5,747 (74.3%) | 1,989 (25.7%) |
| Total Housing Units | 16,276 (76.4%) | 5,029 (23.6%) |
Occupancy by Educational Attainment in Leander
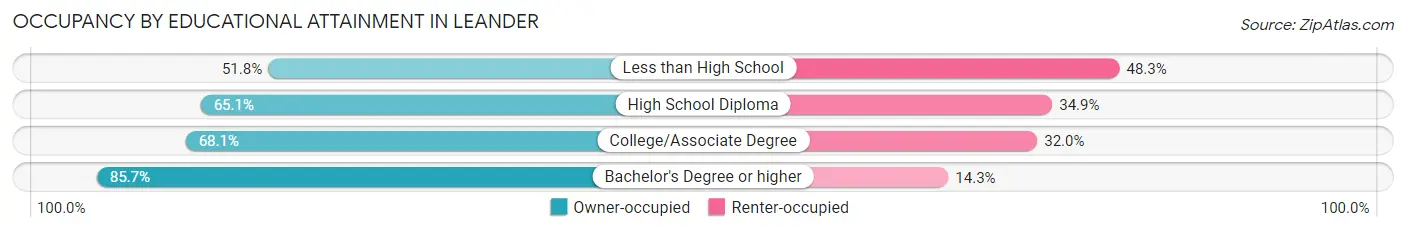
| Household Size | Owner-occupied | Renter-occupied |
| Less than High School | 295 (51.7%) | 275 (48.2%) |
| High School Diploma | 2,093 (65.1%) | 1,123 (34.9%) |
| College/Associate Degree | 4,335 (68.0%) | 2,035 (32.0%) |
| Bachelor's Degree or higher | 9,553 (85.7%) | 1,596 (14.3%) |
Occupancy by Age of Householder in Leander
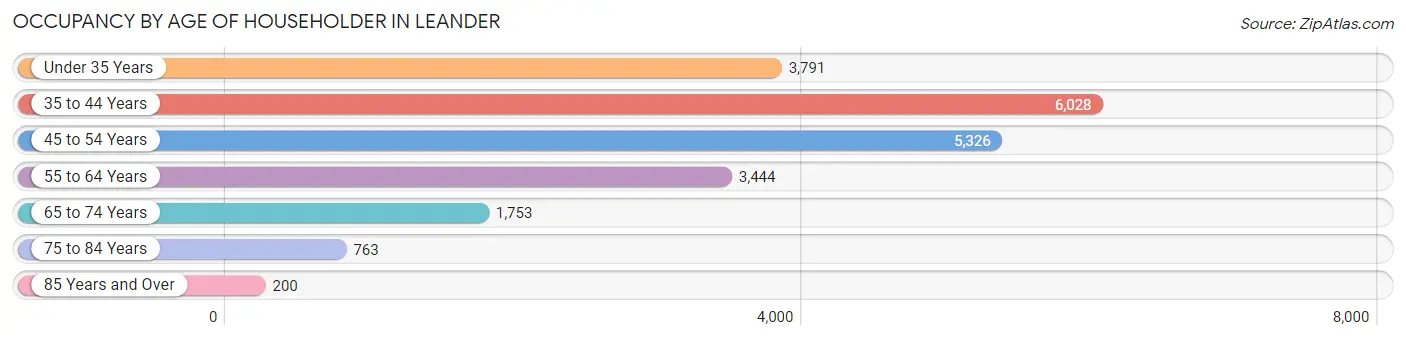
| Age Bracket | # Households | % Households |
| Under 35 Years | 3,791 | 17.8% |
| 35 to 44 Years | 6,028 | 28.3% |
| 45 to 54 Years | 5,326 | 25.0% |
| 55 to 64 Years | 3,444 | 16.2% |
| 65 to 74 Years | 1,753 | 8.2% |
| 75 to 84 Years | 763 | 3.6% |
| 85 Years and Over | 200 | 0.9% |
| Total | 21,305 | 100.0% |
Housing Finances in Leander
Median Income by Occupancy in Leander
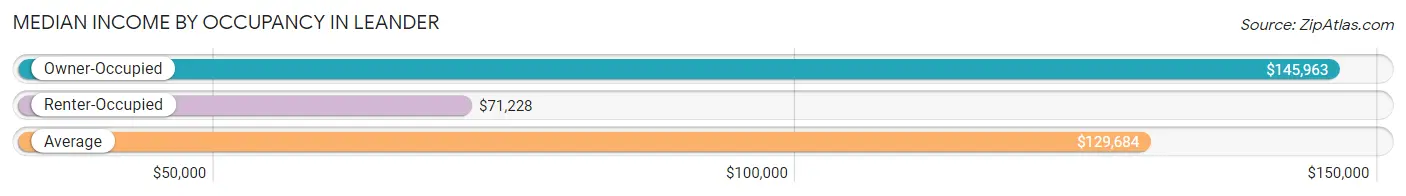
| Occupancy Type | # Households | Median Income |
| Owner-Occupied | 16,276 (76.4%) | $145,963 |
| Renter-Occupied | 5,029 (23.6%) | $71,228 |
| Average | 21,305 (100.0%) | $129,684 |
Occupancy by Householder Income Bracket in Leander
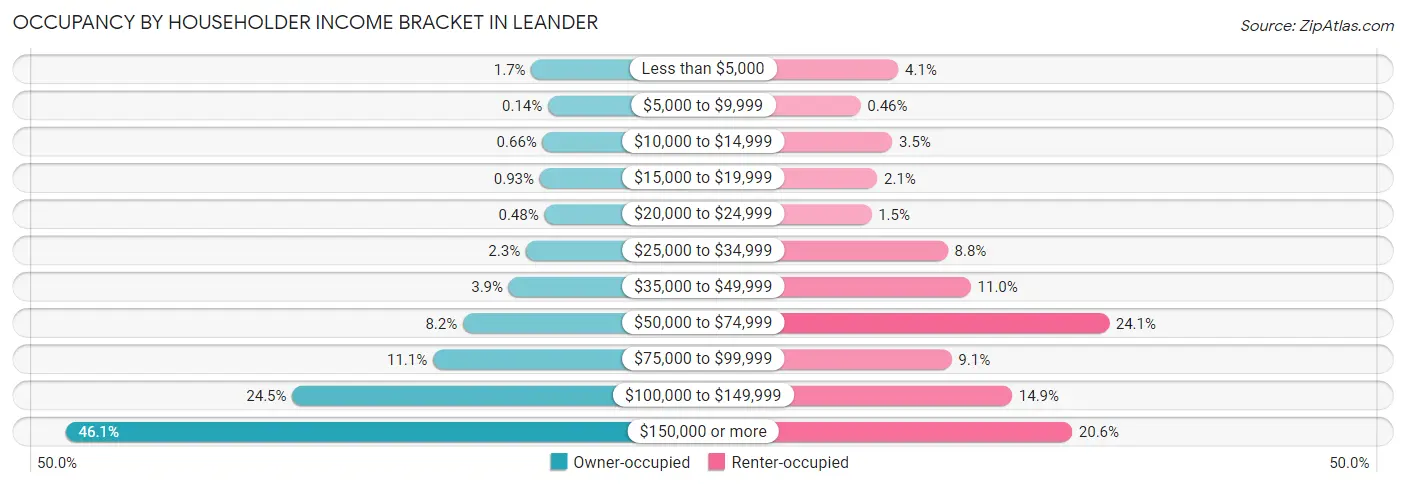
| Income Bracket | Owner-occupied | Renter-occupied |
| Less than $5,000 | 282 (1.7%) | 204 (4.1%) |
| $5,000 to $9,999 | 22 (0.1%) | 23 (0.5%) |
| $10,000 to $14,999 | 107 (0.7%) | 175 (3.5%) |
| $15,000 to $19,999 | 152 (0.9%) | 103 (2.1%) |
| $20,000 to $24,999 | 78 (0.5%) | 75 (1.5%) |
| $25,000 to $34,999 | 367 (2.2%) | 441 (8.8%) |
| $35,000 to $49,999 | 632 (3.9%) | 551 (11.0%) |
| $50,000 to $74,999 | 1,341 (8.2%) | 1,213 (24.1%) |
| $75,000 to $99,999 | 1,807 (11.1%) | 459 (9.1%) |
| $100,000 to $149,999 | 3,987 (24.5%) | 749 (14.9%) |
| $150,000 or more | 7,501 (46.1%) | 1,036 (20.6%) |
| Total | 16,276 (100.0%) | 5,029 (100.0%) |
Monthly Housing Cost Tiers in Leander
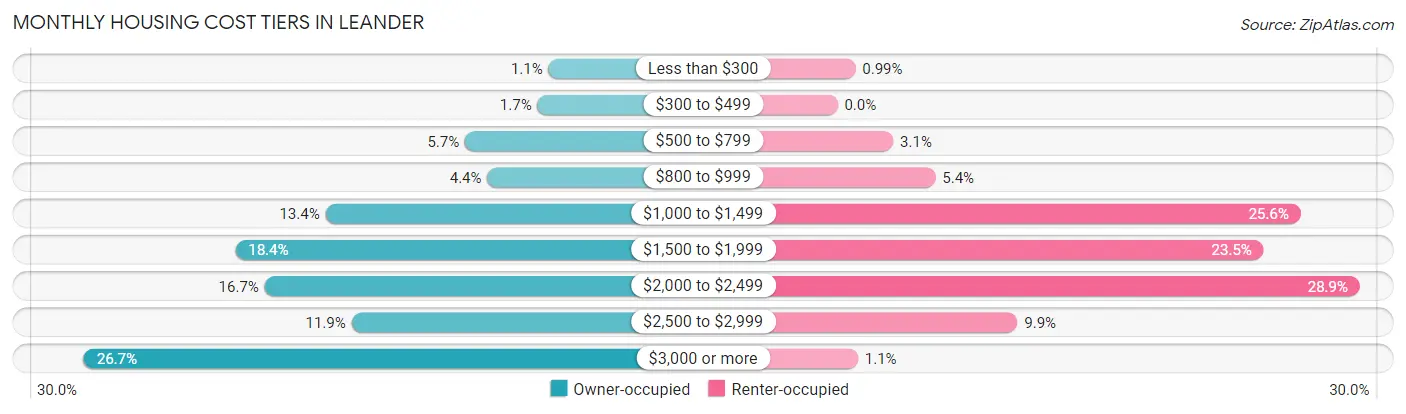
| Monthly Cost | Owner-occupied | Renter-occupied |
| Less than $300 | 173 (1.1%) | 50 (1.0%) |
| $300 to $499 | 271 (1.7%) | 0 (0.0%) |
| $500 to $799 | 923 (5.7%) | 155 (3.1%) |
| $800 to $999 | 723 (4.4%) | 272 (5.4%) |
| $1,000 to $1,499 | 2,178 (13.4%) | 1,287 (25.6%) |
| $1,500 to $1,999 | 2,989 (18.4%) | 1,184 (23.5%) |
| $2,000 to $2,499 | 2,725 (16.7%) | 1,451 (28.8%) |
| $2,500 to $2,999 | 1,943 (11.9%) | 500 (9.9%) |
| $3,000 or more | 4,351 (26.7%) | 57 (1.1%) |
| Total | 16,276 (100.0%) | 5,029 (100.0%) |
Physical Housing Characteristics in Leander
Housing Structures in Leander
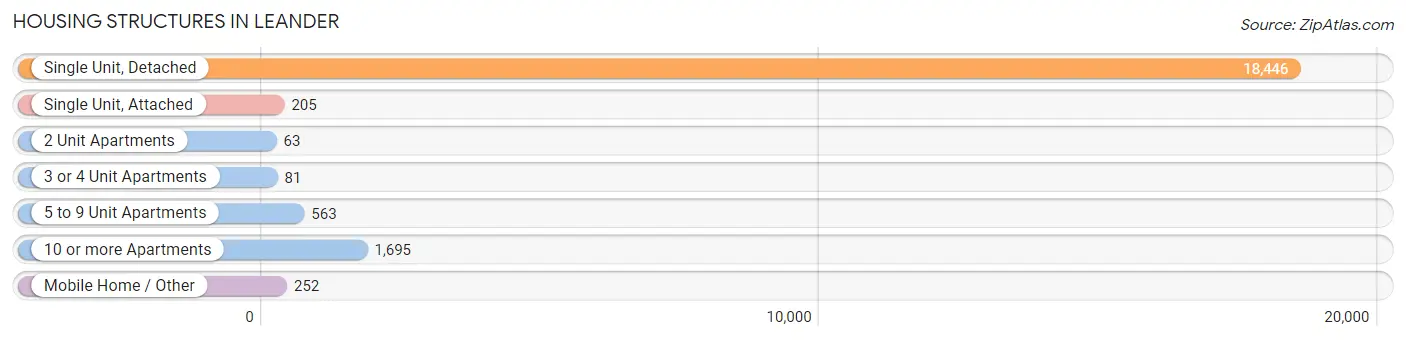
| Structure Type | # Housing Units | % Housing Units |
| Single Unit, Detached | 18,446 | 86.6% |
| Single Unit, Attached | 205 | 1.0% |
| 2 Unit Apartments | 63 | 0.3% |
| 3 or 4 Unit Apartments | 81 | 0.4% |
| 5 to 9 Unit Apartments | 563 | 2.6% |
| 10 or more Apartments | 1,695 | 8.0% |
| Mobile Home / Other | 252 | 1.2% |
| Total | 21,305 | 100.0% |
Housing Structures by Occupancy in Leander
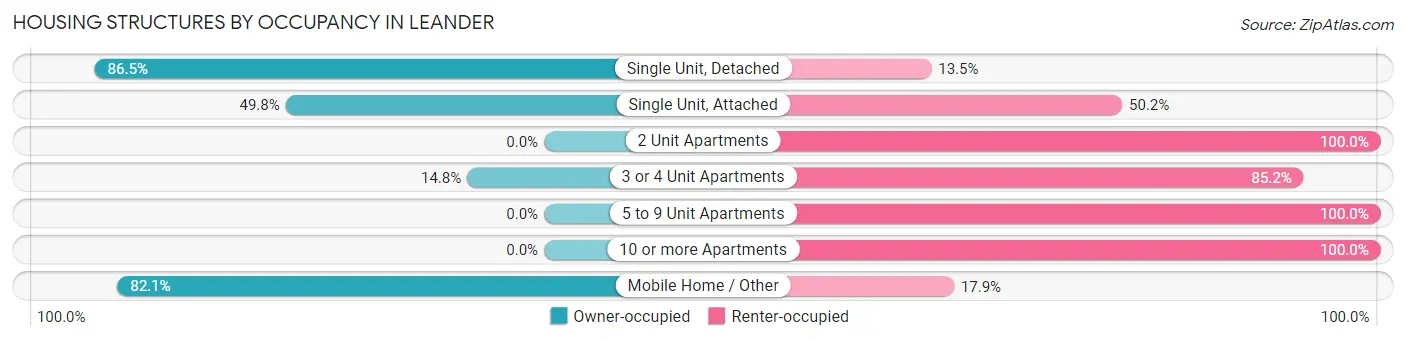
| Structure Type | Owner-occupied | Renter-occupied |
| Single Unit, Detached | 15,955 (86.5%) | 2,491 (13.5%) |
| Single Unit, Attached | 102 (49.8%) | 103 (50.2%) |
| 2 Unit Apartments | 0 (0.0%) | 63 (100.0%) |
| 3 or 4 Unit Apartments | 12 (14.8%) | 69 (85.2%) |
| 5 to 9 Unit Apartments | 0 (0.0%) | 563 (100.0%) |
| 10 or more Apartments | 0 (0.0%) | 1,695 (100.0%) |
| Mobile Home / Other | 207 (82.1%) | 45 (17.9%) |
| Total | 16,276 (76.4%) | 5,029 (23.6%) |
Housing Structures by Number of Rooms in Leander
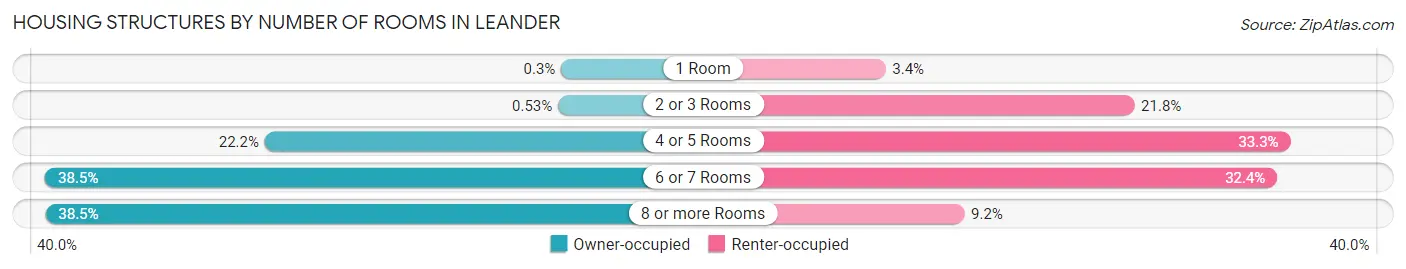
| Number of Rooms | Owner-occupied | Renter-occupied |
| 1 Room | 49 (0.3%) | 169 (3.4%) |
| 2 or 3 Rooms | 86 (0.5%) | 1,095 (21.8%) |
| 4 or 5 Rooms | 3,618 (22.2%) | 1,676 (33.3%) |
| 6 or 7 Rooms | 6,263 (38.5%) | 1,627 (32.4%) |
| 8 or more Rooms | 6,260 (38.5%) | 462 (9.2%) |
| Total | 16,276 (100.0%) | 5,029 (100.0%) |
Housing Structure by Heating Type in Leander
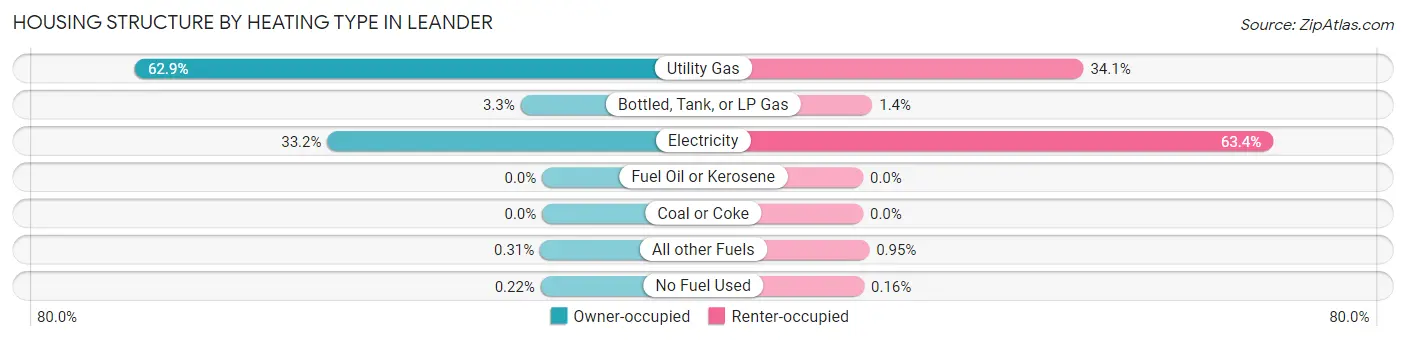
| Heating Type | Owner-occupied | Renter-occupied |
| Utility Gas | 10,242 (62.9%) | 1,714 (34.1%) |
| Bottled, Tank, or LP Gas | 542 (3.3%) | 72 (1.4%) |
| Electricity | 5,406 (33.2%) | 3,187 (63.4%) |
| Fuel Oil or Kerosene | 0 (0.0%) | 0 (0.0%) |
| Coal or Coke | 0 (0.0%) | 0 (0.0%) |
| All other Fuels | 51 (0.3%) | 48 (0.9%) |
| No Fuel Used | 35 (0.2%) | 8 (0.2%) |
| Total | 16,276 (100.0%) | 5,029 (100.0%) |
Household Vehicle Usage in Leander
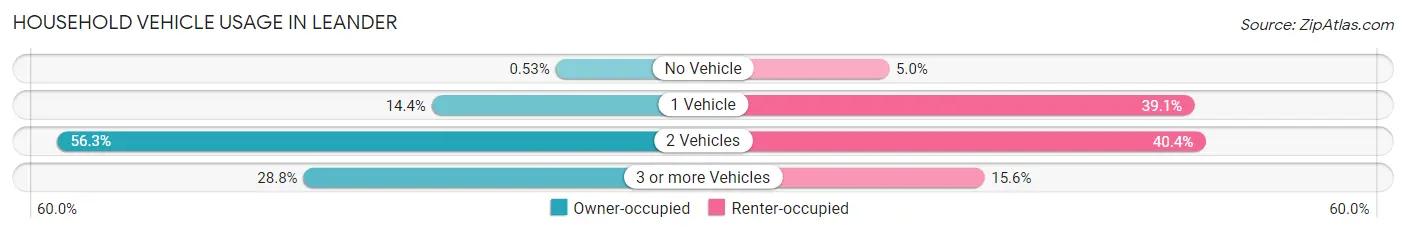
| Vehicles per Household | Owner-occupied | Renter-occupied |
| No Vehicle | 87 (0.5%) | 249 (5.0%) |
| 1 Vehicle | 2,343 (14.4%) | 1,966 (39.1%) |
| 2 Vehicles | 9,163 (56.3%) | 2,029 (40.4%) |
| 3 or more Vehicles | 4,683 (28.8%) | 785 (15.6%) |
| Total | 16,276 (100.0%) | 5,029 (100.0%) |
Real Estate & Mortgages in Leander
Real Estate and Mortgage Overview in Leander
| Characteristic | Without Mortgage | With Mortgage |
| Housing Units | 3,376 | 12,900 |
| Median Property Value | $365,200 | $423,800 |
| Median Household Income | $112,100 | $6,633 |
| Monthly Housing Costs | $971 | $4,326 |
| Real Estate Taxes | $7,361 | $301 |
Property Value by Mortgage Status in Leander
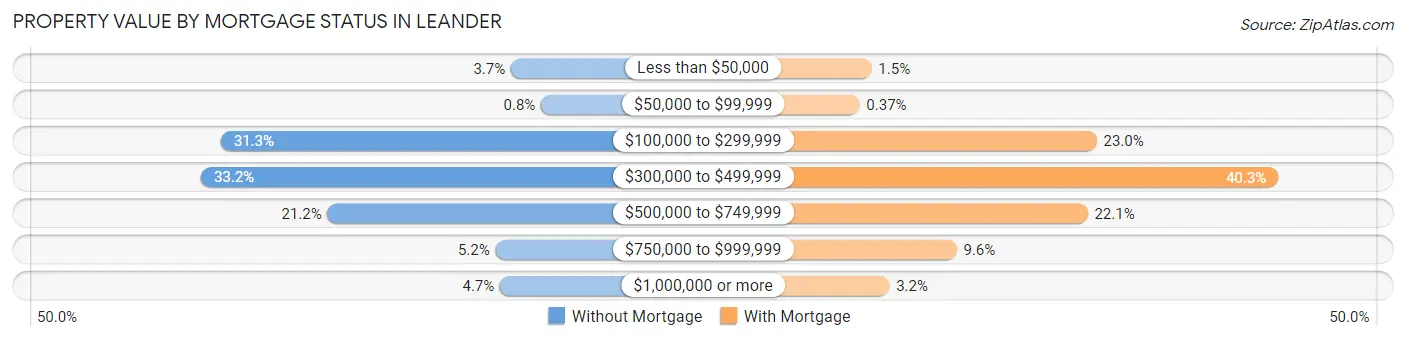
| Property Value | Without Mortgage | With Mortgage |
| Less than $50,000 | 124 (3.7%) | 195 (1.5%) |
| $50,000 to $99,999 | 27 (0.8%) | 48 (0.4%) |
| $100,000 to $299,999 | 1,057 (31.3%) | 2,961 (23.0%) |
| $300,000 to $499,999 | 1,121 (33.2%) | 5,192 (40.3%) |
| $500,000 to $749,999 | 714 (21.1%) | 2,849 (22.1%) |
| $750,000 to $999,999 | 174 (5.1%) | 1,241 (9.6%) |
| $1,000,000 or more | 159 (4.7%) | 414 (3.2%) |
| Total | 3,376 (100.0%) | 12,900 (100.0%) |
Household Income by Mortgage Status in Leander
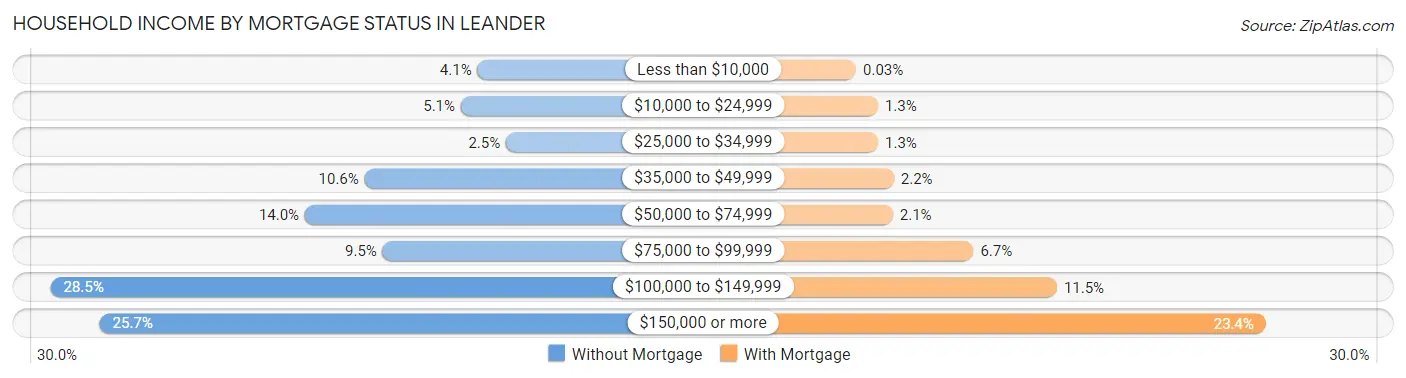
| Household Income | Without Mortgage | With Mortgage |
| Less than $10,000 | 139 (4.1%) | 4 (0.0%) |
| $10,000 to $24,999 | 171 (5.1%) | 165 (1.3%) |
| $25,000 to $34,999 | 84 (2.5%) | 166 (1.3%) |
| $35,000 to $49,999 | 357 (10.6%) | 283 (2.2%) |
| $50,000 to $74,999 | 472 (14.0%) | 275 (2.1%) |
| $75,000 to $99,999 | 322 (9.5%) | 869 (6.7%) |
| $100,000 to $149,999 | 963 (28.5%) | 1,485 (11.5%) |
| $150,000 or more | 868 (25.7%) | 3,024 (23.4%) |
| Total | 3,376 (100.0%) | 12,900 (100.0%) |
Property Value to Household Income Ratio in Leander
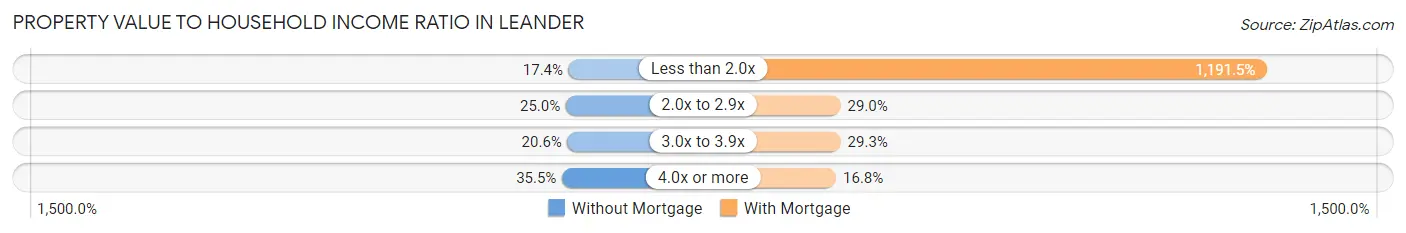
| Value-to-Income Ratio | Without Mortgage | With Mortgage |
| Less than 2.0x | 586 (17.4%) | 153,700 (1,191.5%) |
| 2.0x to 2.9x | 845 (25.0%) | 3,738 (29.0%) |
| 3.0x to 3.9x | 695 (20.6%) | 3,773 (29.2%) |
| 4.0x or more | 1,197 (35.5%) | 2,170 (16.8%) |
| Total | 3,376 (100.0%) | 12,900 (100.0%) |
Real Estate Taxes by Mortgage Status in Leander
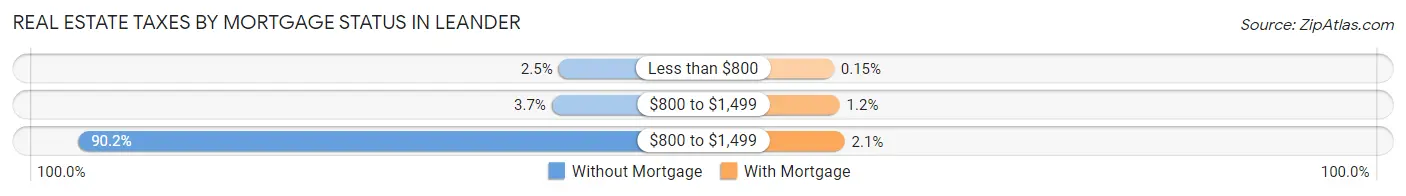
| Property Taxes | Without Mortgage | With Mortgage |
| Less than $800 | 84 (2.5%) | 19 (0.2%) |
| $800 to $1,499 | 126 (3.7%) | 156 (1.2%) |
| $800 to $1,499 | 3,045 (90.2%) | 272 (2.1%) |
| Total | 3,376 (100.0%) | 12,900 (100.0%) |
Health & Disability in Leander
Health Insurance Coverage by Age in Leander
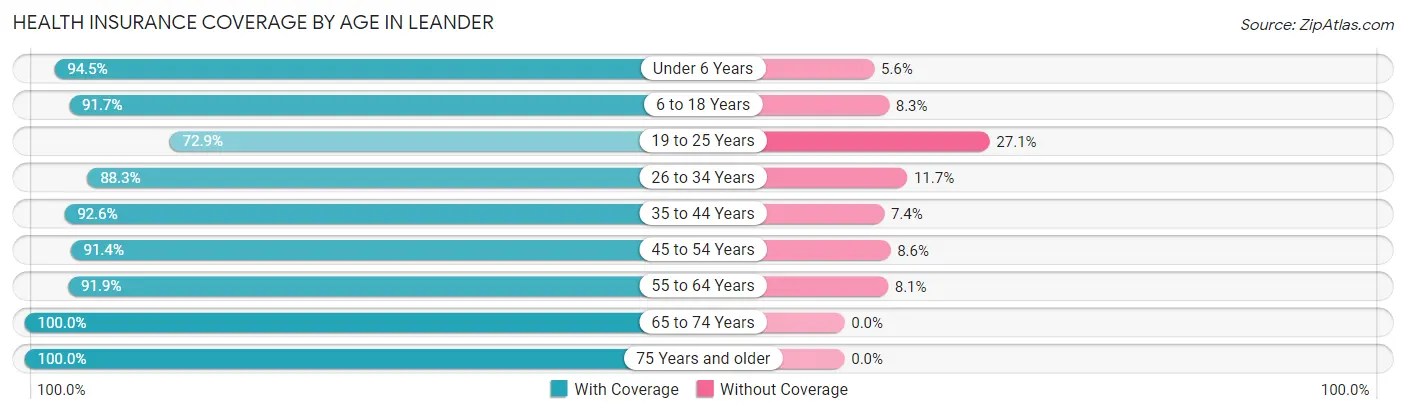
| Age Bracket | With Coverage | Without Coverage |
| Under 6 Years | 5,018 (94.5%) | 295 (5.6%) |
| 6 to 18 Years | 12,662 (91.7%) | 1,146 (8.3%) |
| 19 to 25 Years | 2,938 (72.9%) | 1,090 (27.1%) |
| 26 to 34 Years | 6,519 (88.3%) | 863 (11.7%) |
| 35 to 44 Years | 10,702 (92.6%) | 855 (7.4%) |
| 45 to 54 Years | 8,932 (91.4%) | 837 (8.6%) |
| 55 to 64 Years | 5,361 (91.9%) | 473 (8.1%) |
| 65 to 74 Years | 3,163 (100.0%) | 0 (0.0%) |
| 75 Years and older | 1,523 (100.0%) | 0 (0.0%) |
| Total | 56,818 (91.1%) | 5,559 (8.9%) |
Health Insurance Coverage by Citizenship Status in Leander
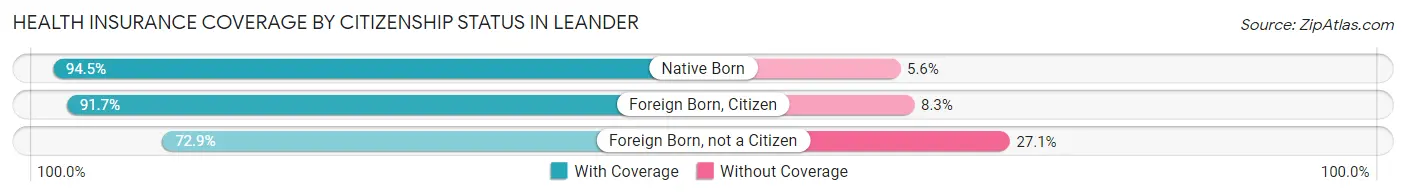
| Citizenship Status | With Coverage | Without Coverage |
| Native Born | 5,018 (94.5%) | 295 (5.6%) |
| Foreign Born, Citizen | 12,662 (91.7%) | 1,146 (8.3%) |
| Foreign Born, not a Citizen | 2,938 (72.9%) | 1,090 (27.1%) |
Health Insurance Coverage by Household Income in Leander
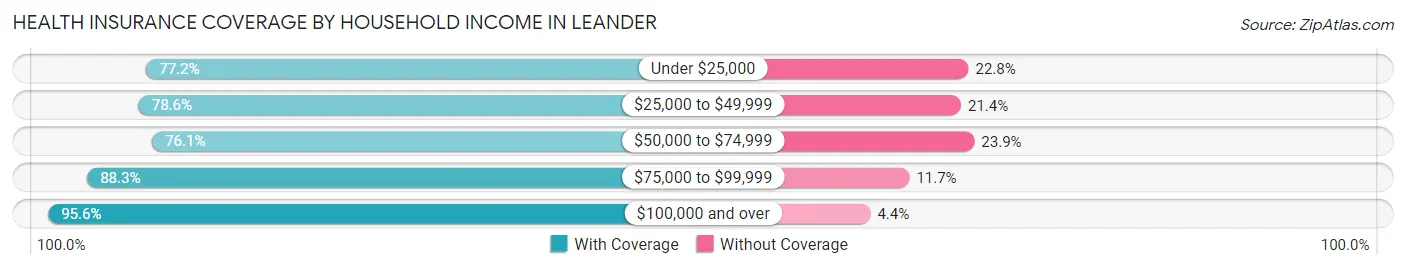
| Household Income | With Coverage | Without Coverage |
| Under $25,000 | 1,712 (77.2%) | 506 (22.8%) |
| $25,000 to $49,999 | 3,623 (78.6%) | 987 (21.4%) |
| $50,000 to $74,999 | 4,356 (76.1%) | 1,369 (23.9%) |
| $75,000 to $99,999 | 5,904 (88.3%) | 785 (11.7%) |
| $100,000 and over | 41,213 (95.6%) | 1,912 (4.4%) |
Public vs Private Health Insurance Coverage by Age in Leander
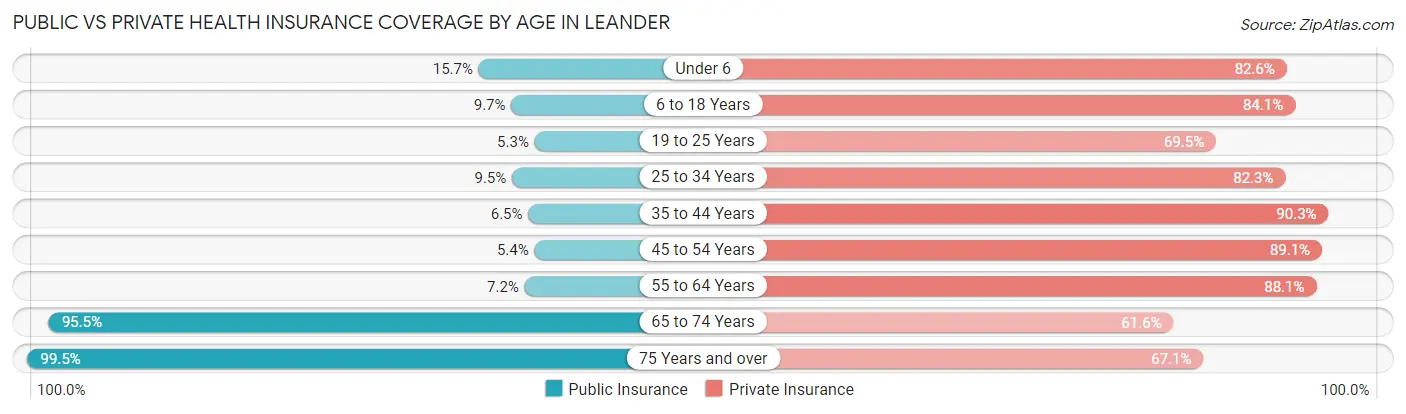
| Age Bracket | Public Insurance | Private Insurance |
| Under 6 | 834 (15.7%) | 4,387 (82.6%) |
| 6 to 18 Years | 1,333 (9.7%) | 11,615 (84.1%) |
| 19 to 25 Years | 214 (5.3%) | 2,798 (69.5%) |
| 25 to 34 Years | 702 (9.5%) | 6,076 (82.3%) |
| 35 to 44 Years | 751 (6.5%) | 10,438 (90.3%) |
| 45 to 54 Years | 523 (5.3%) | 8,706 (89.1%) |
| 55 to 64 Years | 419 (7.2%) | 5,138 (88.1%) |
| 65 to 74 Years | 3,021 (95.5%) | 1,947 (61.6%) |
| 75 Years and over | 1,515 (99.5%) | 1,022 (67.1%) |
| Total | 9,312 (14.9%) | 52,127 (83.6%) |
Disability Status by Sex by Age in Leander
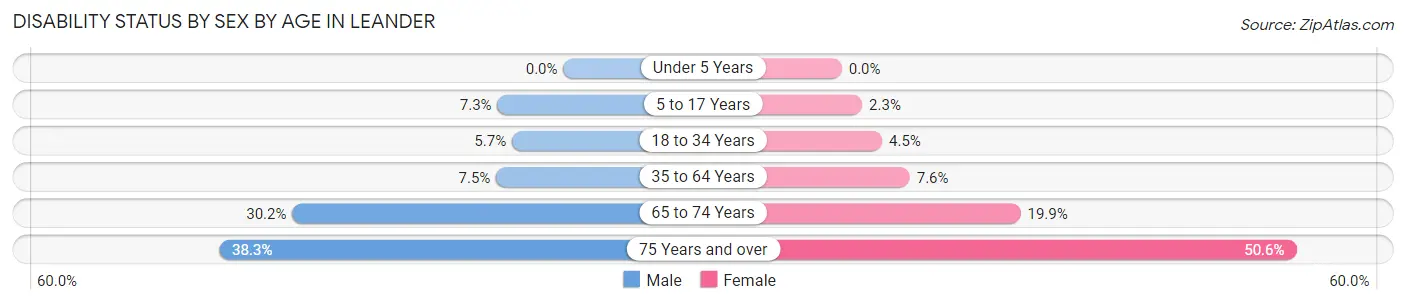
| Age Bracket | Male | Female |
| Under 5 Years | 0 (0.0%) | 0 (0.0%) |
| 5 to 17 Years | 487 (7.3%) | 157 (2.3%) |
| 18 to 34 Years | 338 (5.7%) | 292 (4.5%) |
| 35 to 64 Years | 1,044 (7.5%) | 1,000 (7.6%) |
| 65 to 74 Years | 388 (30.2%) | 374 (19.9%) |
| 75 Years and over | 240 (38.3%) | 454 (50.6%) |
Disability Class by Sex by Age in Leander
Disability Class: Hearing Difficulty
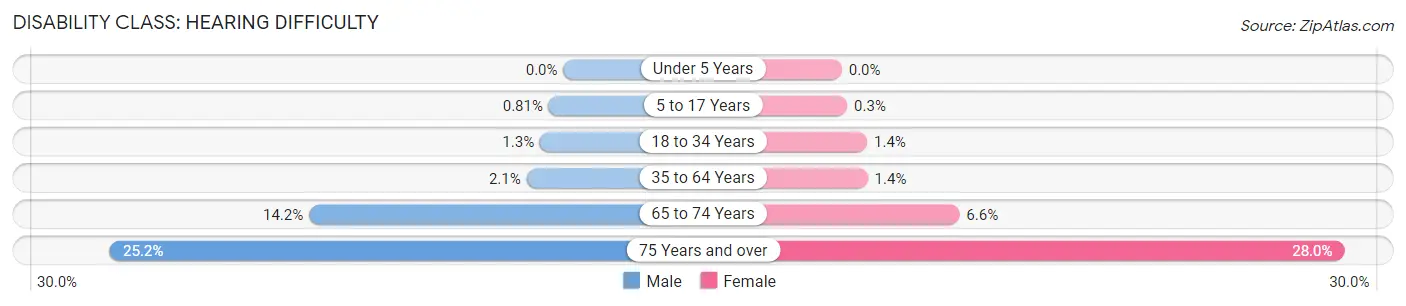
| Age Bracket | Male | Female |
| Under 5 Years | 0 (0.0%) | 0 (0.0%) |
| 5 to 17 Years | 54 (0.8%) | 21 (0.3%) |
| 18 to 34 Years | 77 (1.3%) | 92 (1.4%) |
| 35 to 64 Years | 286 (2.1%) | 190 (1.4%) |
| 65 to 74 Years | 182 (14.2%) | 123 (6.6%) |
| 75 Years and over | 158 (25.2%) | 251 (28.0%) |
Disability Class: Vision Difficulty
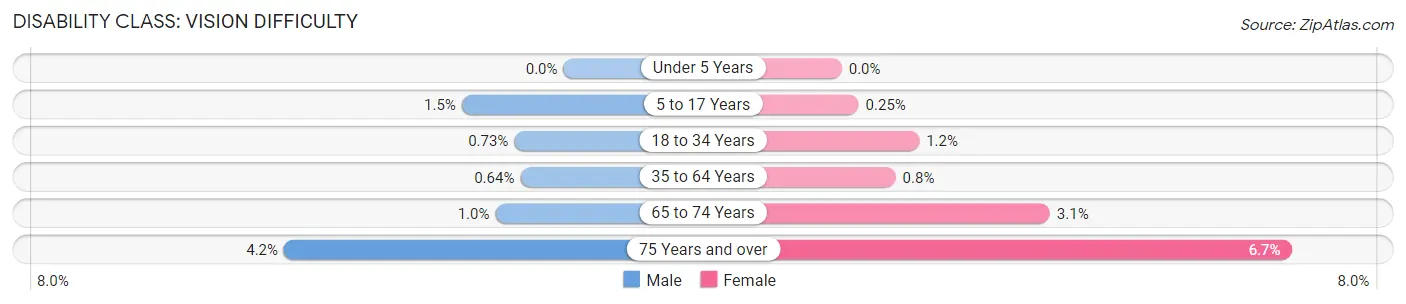
| Age Bracket | Male | Female |
| Under 5 Years | 0 (0.0%) | 0 (0.0%) |
| 5 to 17 Years | 100 (1.5%) | 17 (0.3%) |
| 18 to 34 Years | 43 (0.7%) | 75 (1.1%) |
| 35 to 64 Years | 89 (0.6%) | 106 (0.8%) |
| 65 to 74 Years | 13 (1.0%) | 58 (3.1%) |
| 75 Years and over | 26 (4.2%) | 60 (6.7%) |
Disability Class: Cognitive Difficulty
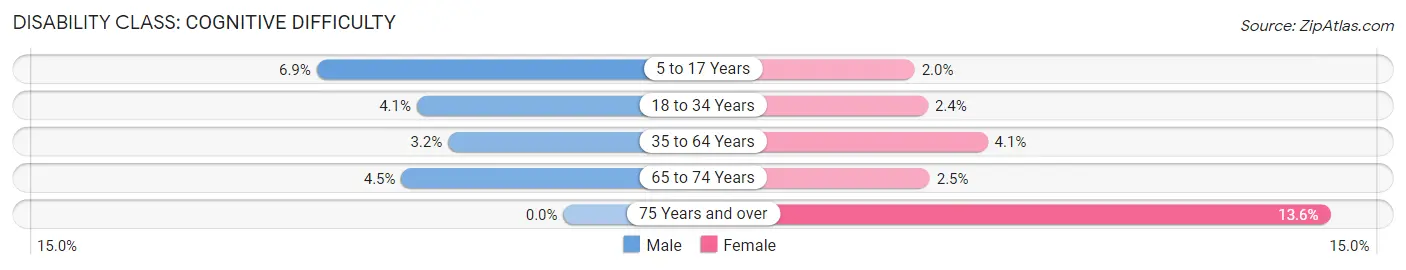
| Age Bracket | Male | Female |
| 5 to 17 Years | 456 (6.9%) | 140 (2.0%) |
| 18 to 34 Years | 241 (4.1%) | 156 (2.4%) |
| 35 to 64 Years | 448 (3.2%) | 536 (4.1%) |
| 65 to 74 Years | 58 (4.5%) | 46 (2.5%) |
| 75 Years and over | 0 (0.0%) | 122 (13.6%) |
Disability Class: Ambulatory Difficulty
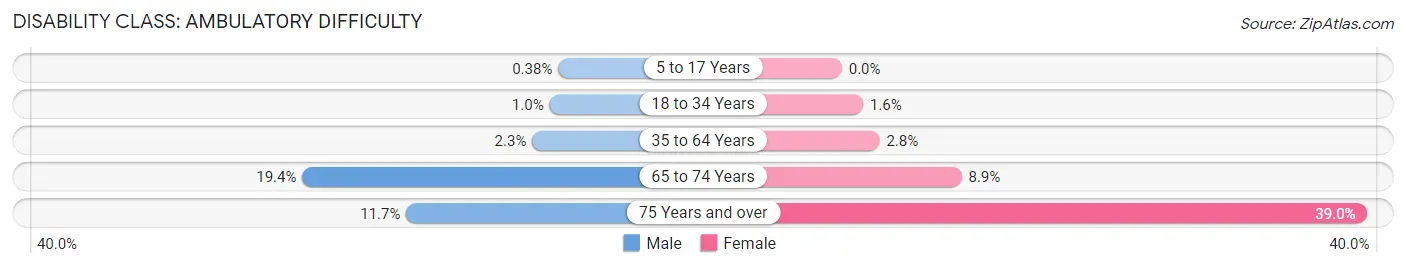
| Age Bracket | Male | Female |
| 5 to 17 Years | 25 (0.4%) | 0 (0.0%) |
| 18 to 34 Years | 61 (1.0%) | 102 (1.6%) |
| 35 to 64 Years | 322 (2.3%) | 370 (2.8%) |
| 65 to 74 Years | 249 (19.4%) | 167 (8.9%) |
| 75 Years and over | 73 (11.7%) | 350 (39.0%) |
Disability Class: Self-Care Difficulty
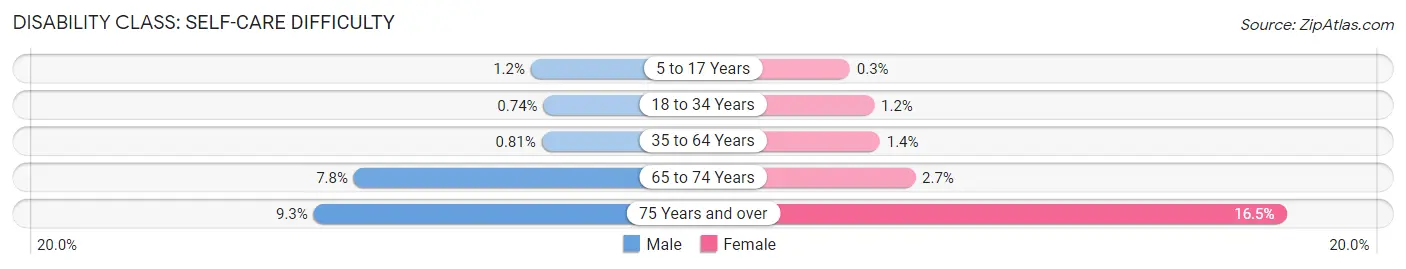
| Age Bracket | Male | Female |
| 5 to 17 Years | 80 (1.2%) | 21 (0.3%) |
| 18 to 34 Years | 44 (0.7%) | 78 (1.2%) |
| 35 to 64 Years | 113 (0.8%) | 186 (1.4%) |
| 65 to 74 Years | 100 (7.8%) | 51 (2.7%) |
| 75 Years and over | 58 (9.3%) | 148 (16.5%) |
Technology Access in Leander
Computing Device Access in Leander
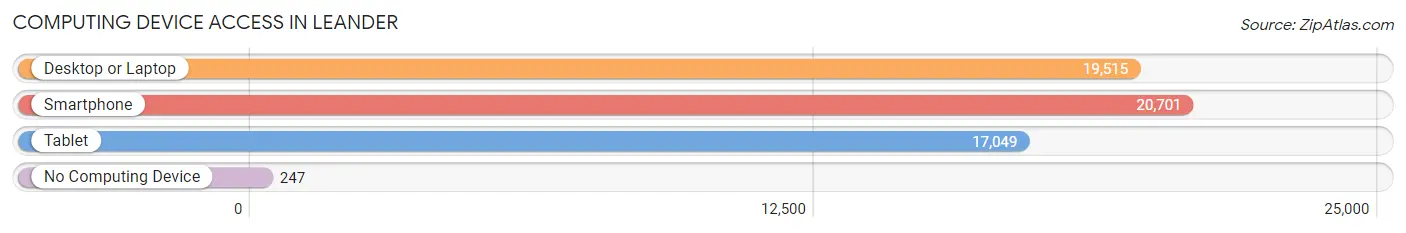
| Device Type | # Households | % Households |
| Desktop or Laptop | 19,515 | 91.6% |
| Smartphone | 20,701 | 97.2% |
| Tablet | 17,049 | 80.0% |
| No Computing Device | 247 | 1.2% |
| Total | 21,305 | 100.0% |
Internet Access in Leander
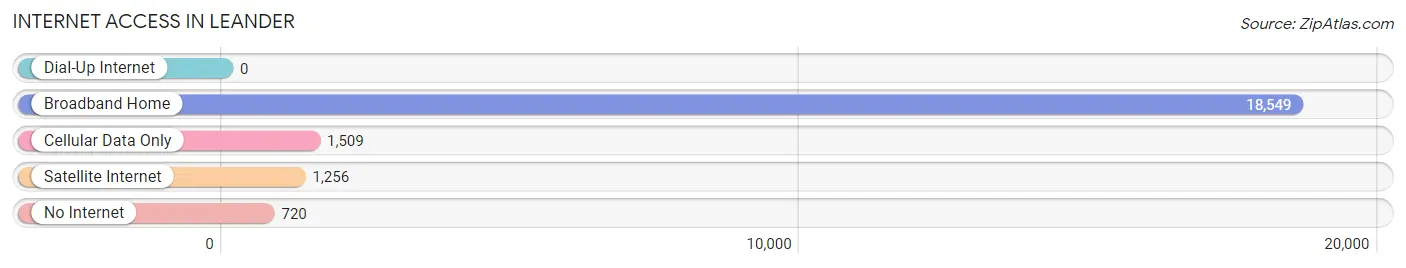
| Internet Type | # Households | % Households |
| Dial-Up Internet | 0 | 0.0% |
| Broadband Home | 18,549 | 87.1% |
| Cellular Data Only | 1,509 | 7.1% |
| Satellite Internet | 1,256 | 5.9% |
| No Internet | 720 | 3.4% |
| Total | 21,305 | 100.0% |
Leander Summary
Leander, Texas is a city located in Williamson County, Texas, United States. It is a suburb of Austin, the state capital, and is part of the Greater Austin metropolitan area. The population was 26,521 at the 2010 census, and it is one of the fastest-growing cities in the state.
History
The area that is now Leander was first settled in the 1840s by settlers from the nearby town of Liberty Hill. The town was originally known as Bagdad, but was renamed Leander in 1882 after Leander Brown, one of the original settlers. The town was officially incorporated in 1882, and the first post office was established in 1883.
The town grew slowly until the arrival of the Austin and Northwestern Railroad in 1882, which connected Leander to Austin and other towns in the area. This allowed the town to become a major shipping center for the surrounding area, and the population began to grow rapidly.
In the early 1900s, Leander was a thriving agricultural community, with cotton, corn, and other crops being grown in the area. The town also had several businesses, including a cotton gin, a grist mill, and a blacksmith shop.
Geography
Leander is located in Williamson County, Texas, about 25 miles northwest of Austin. It is situated on the banks of the San Gabriel River, and is surrounded by rolling hills and wooded areas. The city covers an area of about 18 square miles, and has an elevation of about 800 feet.
The climate in Leander is generally mild, with hot summers and mild winters. The average annual temperature is about 68 degrees Fahrenheit, and the average annual precipitation is about 33 inches.
Economy
Leander’s economy is largely based on the service industry, with many residents employed in retail, healthcare, and other service-related jobs. The city is also home to several technology companies, including Dell, National Instruments, and Samsung.
The city is also home to several educational institutions, including the University of Texas at Austin, Austin Community College, and Concordia University.
Demographics
As of the 2010 census, the population of Leander was 26,521. The racial makeup of the city was 79.3% White, 8.2% African American, 0.5% Native American, 4.2% Asian, and 6.7% from other races. Hispanic or Latino of any race were 18.2% of the population.
The median household income in Leander was $68,845, and the median family income was $76,945. The per capita income was $27,945. About 8.2% of families and 10.3% of the population were below the poverty line.
Leander is a rapidly growing city, and its population is expected to continue to increase in the coming years. The city is home to a diverse population, and offers a variety of amenities and attractions for residents and visitors alike.
Common Questions
What is Per Capita Income in Leander?
Per Capita income in Leander is $52,419.
What is the Median Family Income in Leander?
Median Family Income in Leander is $144,973.
What is the Median Household income in Leander?
Median Household Income in Leander is $129,684.
What is Income or Wage Gap in Leander?
Income or Wage Gap in Leander is 34.4%.
Women in Leander earn 65.6 cents for every dollar earned by a man.
What is Inequality or Gini Index in Leander?
Inequality or Gini Index in Leander is 0.40.
What is the Total Population of Leander?
Total Population of Leander is 62,491.
What is the Total Male Population of Leander?
Total Male Population of Leander is 30,844.
What is the Total Female Population of Leander?
Total Female Population of Leander is 31,647.
What is the Ratio of Males per 100 Females in Leander?
There are 97.46 Males per 100 Females in Leander.
What is the Ratio of Females per 100 Males in Leander?
There are 102.60 Females per 100 Males in Leander.
What is the Median Population Age in Leander?
Median Population Age in Leander is 35.5 Years.
What is the Average Family Size in Leander
Average Family Size in Leander is 3.3 People.
What is the Average Household Size in Leander
Average Household Size in Leander is 2.9 People.
How Large is the Labor Force in Leander?
There are 35,237 People in the Labor Forcein in Leander.
What is the Percentage of People in the Labor Force in Leander?
76.3% of People are in the Labor Force in Leander.
What is the Unemployment Rate in Leander?
Unemployment Rate in Leander is 3.7%.