Buckeye, AZ Map & Demographics
Buckeye Map
Buckeye Overview
$32,141
PER CAPITA INCOME
$96,448
AVG FAMILY INCOME
$94,188
AVG HOUSEHOLD INCOME
32.2%
WAGE / INCOME GAP [ % ]
67.8¢/ $1
WAGE / INCOME GAP [ $ ]
$14,024
FAMILY INCOME DEFICIT
0.35
INEQUALITY / GINI INDEX
95,042
TOTAL POPULATION
50,213
MALE POPULATION
44,829
FEMALE POPULATION
112.01
MALES / 100 FEMALES
89.28
FEMALES / 100 MALES
34.7
MEDIAN AGE
3.5
AVG FAMILY SIZE
3.2
AVG HOUSEHOLD SIZE
41,074
LABOR FORCE [ PEOPLE ]
58.2%
PERCENT IN LABOR FORCE
5.0%
UNEMPLOYMENT RATE
Buckeye Area Codes
Income in Buckeye
Income Overview in Buckeye
Per Capita Income in Buckeye is $32,141, while median incomes of families and households are $96,448 and $94,188 respectively.
| Characteristic | Number | Measure |
| Per Capita Income | 95,042 | $32,141 |
| Median Family Income | 22,619 | $96,448 |
| Mean Family Income | 22,619 | $110,155 |
| Median Household Income | 28,105 | $94,188 |
| Mean Household Income | 28,105 | $106,777 |
| Income Deficit | 22,619 | $14,024 |
| Wage / Income Gap (%) | 95,042 | 32.21% |
| Wage / Income Gap ($) | 95,042 | 67.79¢ per $1 |
| Gini / Inequality Index | 95,042 | 0.35 |
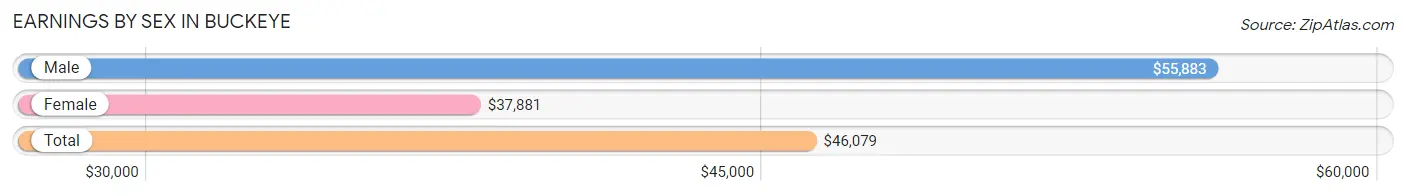
Earnings by Sex in Buckeye
Average Earnings in Buckeye are $46,079, $55,883 for men and $37,881 for women, a difference of 32.2%.
| Sex | Number | Average Earnings |
| Male | 23,607 (55.4%) | $55,883 |
| Female | 19,033 (44.6%) | $37,881 |
| Total | 42,640 (100.0%) | $46,079 |
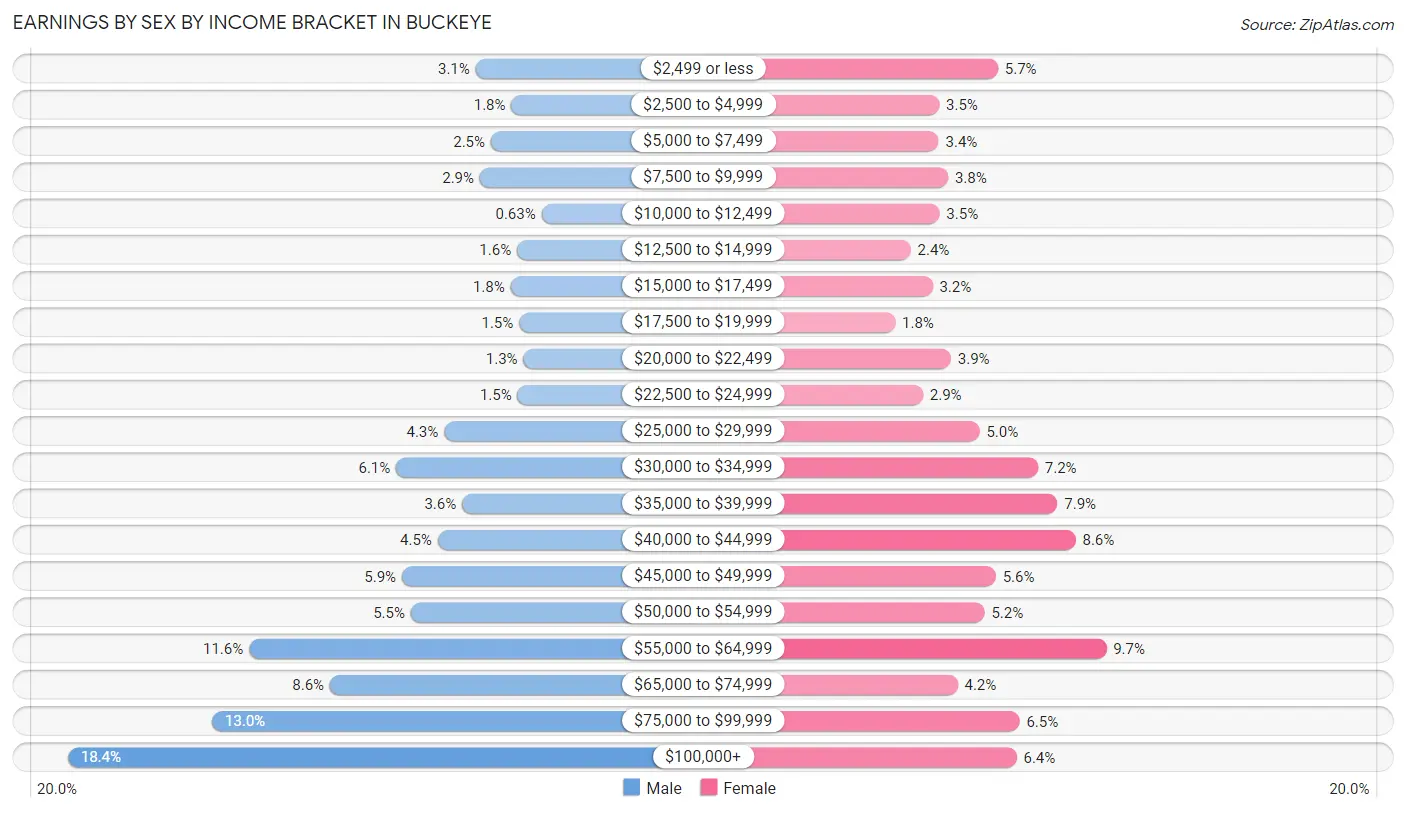
Earnings by Sex by Income Bracket in Buckeye
The most common earnings brackets in Buckeye are $100,000+ for men (4,338 | 18.4%) and $55,000 to $64,999 for women (1,850 | 9.7%).
| Income | Male | Female |
| $2,499 or less | 731 (3.1%) | 1,077 (5.7%) |
| $2,500 to $4,999 | 416 (1.8%) | 659 (3.5%) |
| $5,000 to $7,499 | 598 (2.5%) | 654 (3.4%) |
| $7,500 to $9,999 | 694 (2.9%) | 721 (3.8%) |
| $10,000 to $12,499 | 148 (0.6%) | 661 (3.5%) |
| $12,500 to $14,999 | 365 (1.5%) | 454 (2.4%) |
| $15,000 to $17,499 | 422 (1.8%) | 611 (3.2%) |
| $17,500 to $19,999 | 346 (1.5%) | 344 (1.8%) |
| $20,000 to $22,499 | 310 (1.3%) | 742 (3.9%) |
| $22,500 to $24,999 | 362 (1.5%) | 542 (2.9%) |
| $25,000 to $29,999 | 1,010 (4.3%) | 946 (5.0%) |
| $30,000 to $34,999 | 1,436 (6.1%) | 1,363 (7.2%) |
| $35,000 to $39,999 | 852 (3.6%) | 1,501 (7.9%) |
| $40,000 to $44,999 | 1,068 (4.5%) | 1,632 (8.6%) |
| $45,000 to $49,999 | 1,383 (5.9%) | 1,062 (5.6%) |
| $50,000 to $54,999 | 1,305 (5.5%) | 983 (5.2%) |
| $55,000 to $64,999 | 2,737 (11.6%) | 1,850 (9.7%) |
| $65,000 to $74,999 | 2,021 (8.6%) | 789 (4.2%) |
| $75,000 to $99,999 | 3,065 (13.0%) | 1,231 (6.5%) |
| $100,000+ | 4,338 (18.4%) | 1,211 (6.4%) |
| Total | 23,607 (100.0%) | 19,033 (100.0%) |
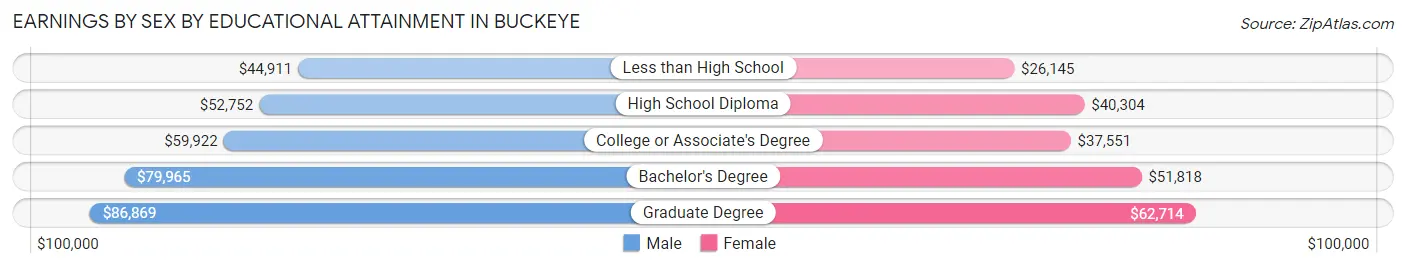
Earnings by Sex by Educational Attainment in Buckeye
Average earnings in Buckeye are $59,450 for men and $40,848 for women, a difference of 31.3%. Men with an educational attainment of graduate degree enjoy the highest average annual earnings of $86,869, while those with less than high school education earn the least with $44,911. Women with an educational attainment of graduate degree earn the most with the average annual earnings of $62,714, while those with less than high school education have the smallest earnings of $26,145.
| Educational Attainment | Male Income | Female Income |
| Less than High School | $44,911 | $26,145 |
| High School Diploma | $52,752 | $40,304 |
| College or Associate's Degree | $59,922 | $37,551 |
| Bachelor's Degree | $79,965 | $51,818 |
| Graduate Degree | $86,869 | $62,714 |
| Total | $59,450 | $40,848 |
Family Income in Buckeye
Family Income Brackets in Buckeye
According to the Buckeye family income data, there are 5,790 families falling into the $100,000 to $149,999 income range, which is the most common income bracket and makes up 25.6% of all families. Conversely, the $10,000 to $14,999 income bracket is the least frequent group with only 158 families (0.7%) belonging to this category.
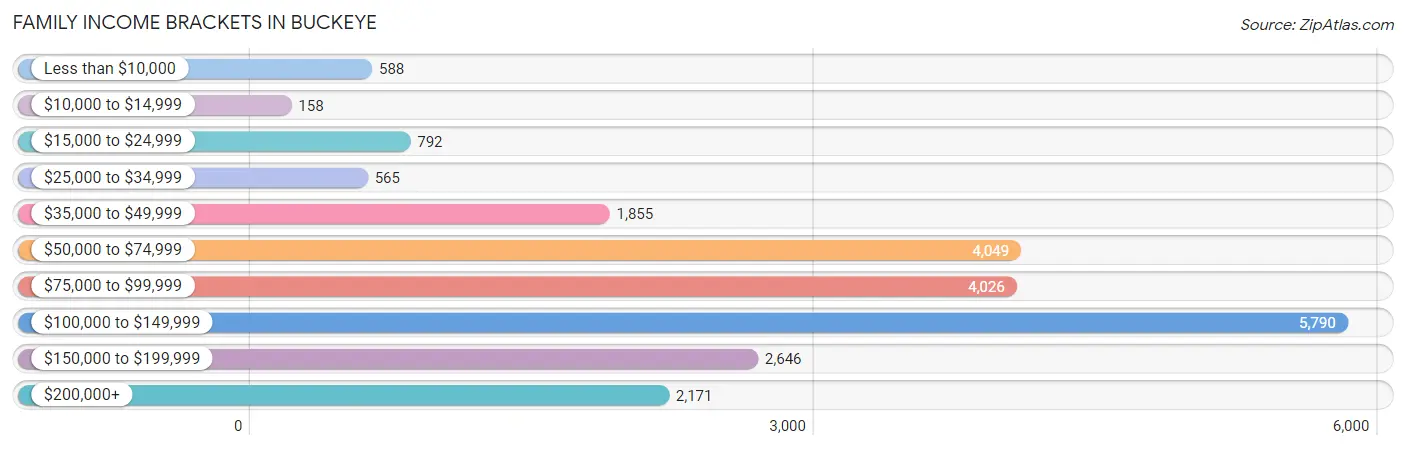
| Income Bracket | # Families | % Families |
| Less than $10,000 | 588 | 2.6% |
| $10,000 to $14,999 | 158 | 0.7% |
| $15,000 to $24,999 | 792 | 3.5% |
| $25,000 to $34,999 | 565 | 2.5% |
| $35,000 to $49,999 | 1,855 | 8.2% |
| $50,000 to $74,999 | 4,049 | 17.9% |
| $75,000 to $99,999 | 4,026 | 17.8% |
| $100,000 to $149,999 | 5,790 | 25.6% |
| $150,000 to $199,999 | 2,646 | 11.7% |
| $200,000+ | 2,171 | 9.6% |
Family Income by Famaliy Size in Buckeye
7+ person families (1,262 | 5.6%) account for the highest median family income in Buckeye with $141,786 per family, while 2-person families (9,019 | 39.9%) have the highest median income of $42,234 per family member.
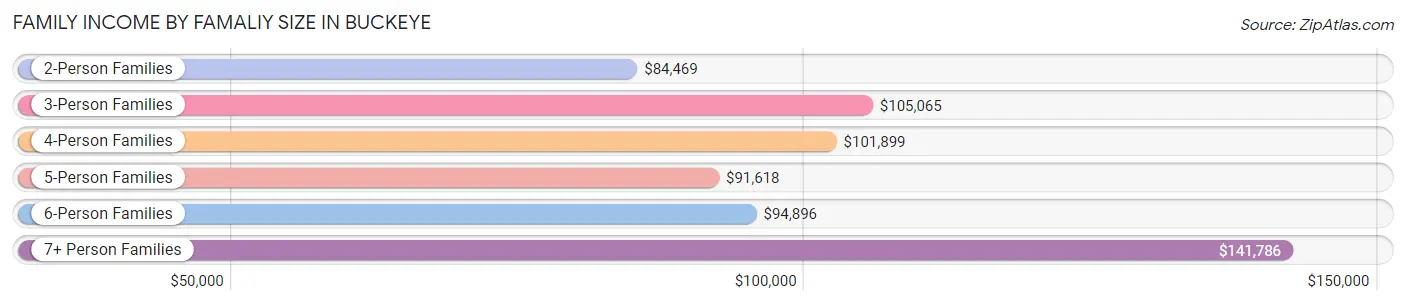
| Income Bracket | # Families | Median Income |
| 2-Person Families | 9,019 (39.9%) | $84,469 |
| 3-Person Families | 4,048 (17.9%) | $105,065 |
| 4-Person Families | 4,111 (18.2%) | $101,899 |
| 5-Person Families | 2,668 (11.8%) | $91,618 |
| 6-Person Families | 1,511 (6.7%) | $94,896 |
| 7+ Person Families | 1,262 (5.6%) | $141,786 |
| Total | 22,619 (100.0%) | $96,448 |
Family Income by Number of Earners in Buckeye
The median family income in Buckeye is $96,448, with families comprising 3+ earners (2,898) having the highest median family income of $134,779, while families with no earners (3,816) have the lowest median family income of $66,600, accounting for 12.8% and 16.9% of families, respectively.
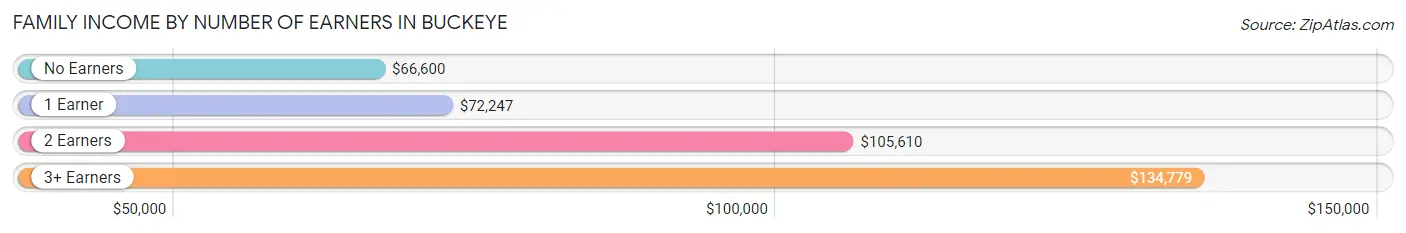
| Number of Earners | # Families | Median Income |
| No Earners | 3,816 (16.9%) | $66,600 |
| 1 Earner | 7,327 (32.4%) | $72,247 |
| 2 Earners | 8,578 (37.9%) | $105,610 |
| 3+ Earners | 2,898 (12.8%) | $134,779 |
| Total | 22,619 (100.0%) | $96,448 |
Household Income in Buckeye
Household Income Brackets in Buckeye
With 7,167 households falling in the category, the $100,000 to $149,999 income range is the most frequent in Buckeye, accounting for 25.5% of all households. In contrast, only 281 households (1.0%) fall into the $10,000 to $14,999 income bracket, making it the least populous group.
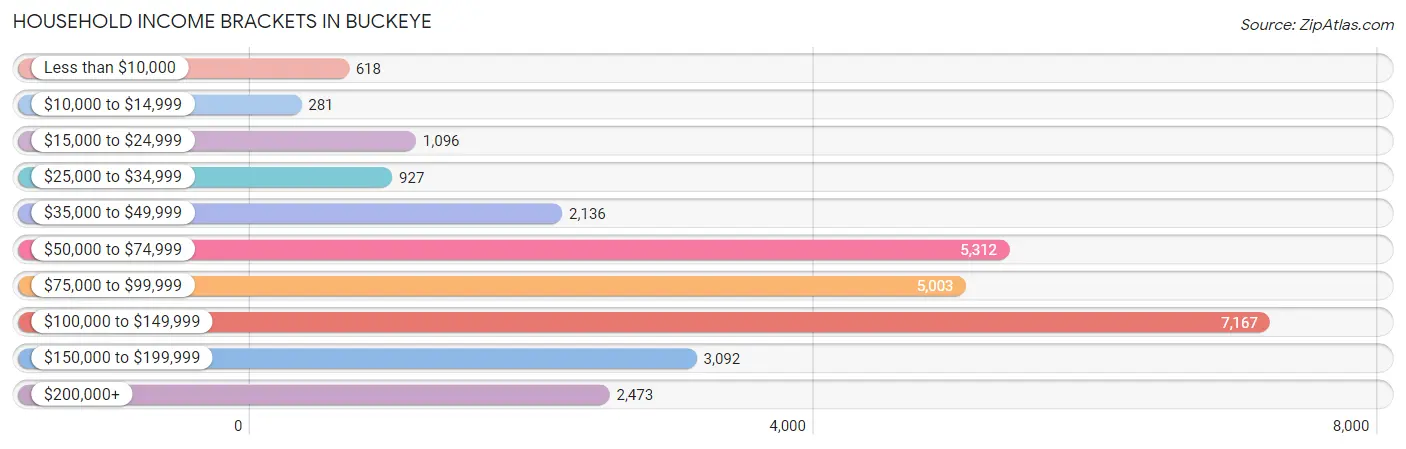
| Income Bracket | # Households | % Households |
| Less than $10,000 | 618 | 2.2% |
| $10,000 to $14,999 | 281 | 1.0% |
| $15,000 to $24,999 | 1,096 | 3.9% |
| $25,000 to $34,999 | 927 | 3.3% |
| $35,000 to $49,999 | 2,136 | 7.6% |
| $50,000 to $74,999 | 5,312 | 18.9% |
| $75,000 to $99,999 | 5,003 | 17.8% |
| $100,000 to $149,999 | 7,167 | 25.5% |
| $150,000 to $199,999 | 3,092 | 11.0% |
| $200,000+ | 2,473 | 8.8% |
Household Income by Householder Age in Buckeye
The median household income in Buckeye is $94,188, with the highest median household income of $104,140 found in the 45 to 64 years age bracket for the primary householder. A total of 10,038 households (35.7%) fall into this category. Meanwhile, the 65+ years age bracket for the primary householder has the lowest median household income of $74,771, with 6,302 households (22.4%) in this group.
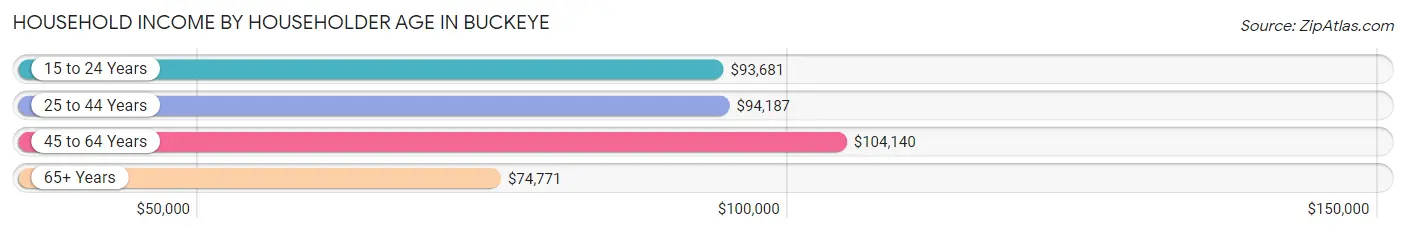
| Income Bracket | # Households | Median Income |
| 15 to 24 Years | 417 (1.5%) | $93,681 |
| 25 to 44 Years | 11,348 (40.4%) | $94,187 |
| 45 to 64 Years | 10,038 (35.7%) | $104,140 |
| 65+ Years | 6,302 (22.4%) | $74,771 |
| Total | 28,105 (100.0%) | $94,188 |
Poverty in Buckeye
Income Below Poverty by Sex and Age in Buckeye
With 7.4% poverty level for males and 8.4% for females among the residents of Buckeye, 15 year old males and 5 year old females are the most vulnerable to poverty, with 229 males (22.1%) and 89 females (14.3%) in their respective age groups living below the poverty level.
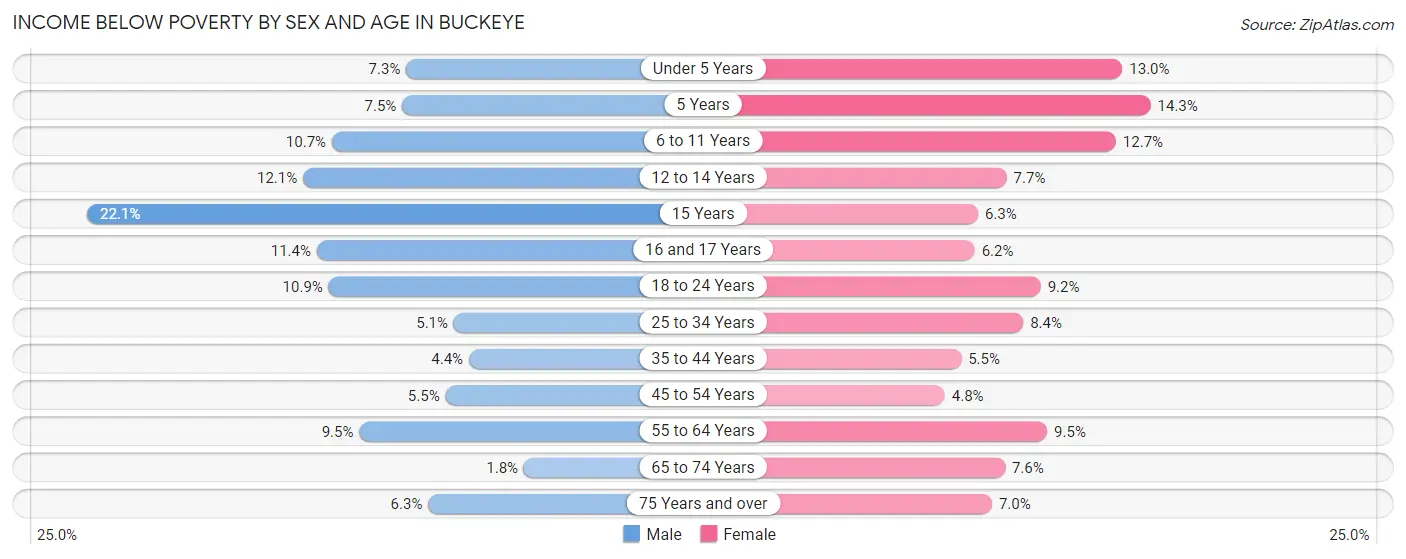
| Age Bracket | Male | Female |
| Under 5 Years | 272 (7.3%) | 483 (13.0%) |
| 5 Years | 38 (7.5%) | 89 (14.3%) |
| 6 to 11 Years | 561 (10.7%) | 517 (12.7%) |
| 12 to 14 Years | 245 (12.1%) | 194 (7.6%) |
| 15 Years | 229 (22.1%) | 42 (6.3%) |
| 16 and 17 Years | 129 (11.4%) | 91 (6.2%) |
| 18 to 24 Years | 342 (10.9%) | 258 (9.2%) |
| 25 to 34 Years | 310 (5.1%) | 559 (8.4%) |
| 35 to 44 Years | 266 (4.4%) | 361 (5.5%) |
| 45 to 54 Years | 279 (5.5%) | 221 (4.8%) |
| 55 to 64 Years | 386 (9.5%) | 440 (9.5%) |
| 65 to 74 Years | 77 (1.8%) | 337 (7.6%) |
| 75 Years and over | 97 (6.3%) | 135 (7.0%) |
| Total | 3,231 (7.4%) | 3,727 (8.4%) |
Income Above Poverty by Sex and Age in Buckeye
According to the poverty statistics in Buckeye, males aged 65 to 74 years and females aged 45 to 54 years are the age groups that are most secure financially, with 98.2% of males and 95.2% of females in these age groups living above the poverty line.
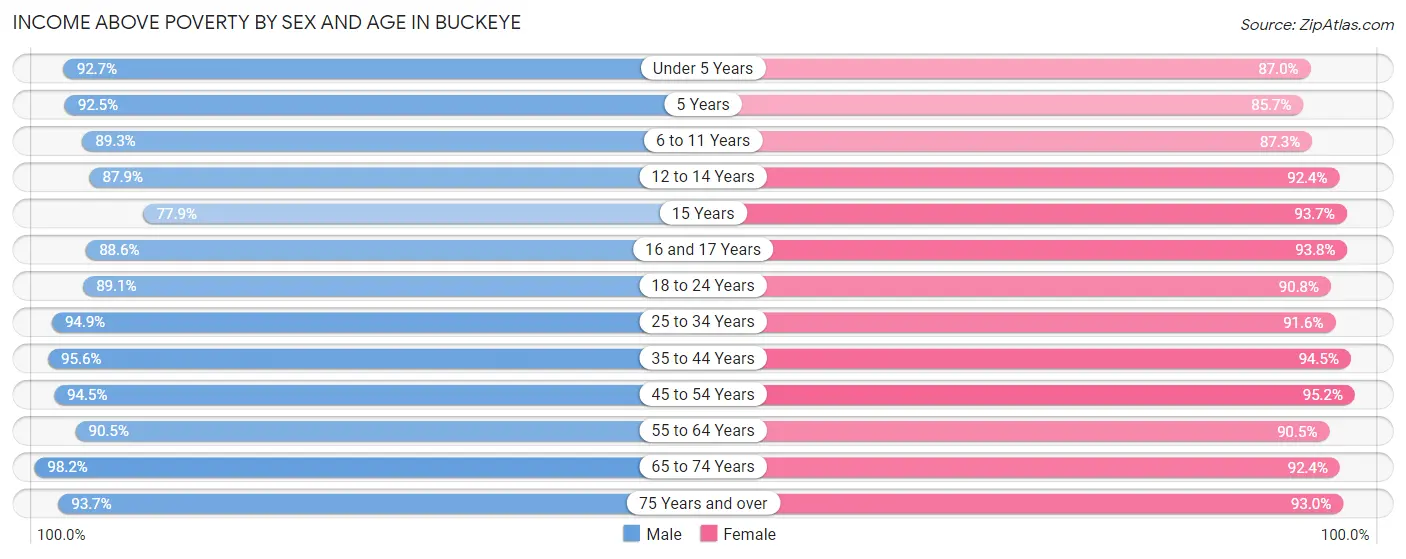
| Age Bracket | Male | Female |
| Under 5 Years | 3,461 (92.7%) | 3,228 (87.0%) |
| 5 Years | 470 (92.5%) | 532 (85.7%) |
| 6 to 11 Years | 4,663 (89.3%) | 3,546 (87.3%) |
| 12 to 14 Years | 1,783 (87.9%) | 2,341 (92.3%) |
| 15 Years | 807 (77.9%) | 623 (93.7%) |
| 16 and 17 Years | 999 (88.6%) | 1,384 (93.8%) |
| 18 to 24 Years | 2,798 (89.1%) | 2,537 (90.8%) |
| 25 to 34 Years | 5,787 (94.9%) | 6,082 (91.6%) |
| 35 to 44 Years | 5,810 (95.6%) | 6,155 (94.5%) |
| 45 to 54 Years | 4,820 (94.5%) | 4,402 (95.2%) |
| 55 to 64 Years | 3,691 (90.5%) | 4,175 (90.5%) |
| 65 to 74 Years | 4,136 (98.2%) | 4,117 (92.4%) |
| 75 Years and over | 1,449 (93.7%) | 1,801 (93.0%) |
| Total | 40,674 (92.6%) | 40,923 (91.6%) |
Income Below Poverty Among Married-Couple Families in Buckeye
The poverty statistics for married-couple families in Buckeye show that 3.8% or 689 of the total 18,319 families live below the poverty line. Families with 5 or more children have the highest poverty rate of 10.5%, comprising of 68 families. On the other hand, families with 1 or 2 children have the lowest poverty rate of 2.9%, which includes 171 families.
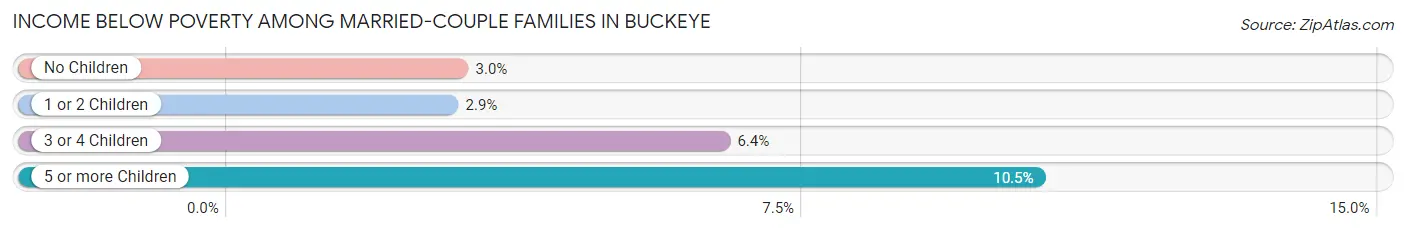
| Children | Above Poverty | Below Poverty |
| No Children | 8,641 (97.0%) | 268 (3.0%) |
| 1 or 2 Children | 5,765 (97.1%) | 171 (2.9%) |
| 3 or 4 Children | 2,647 (93.6%) | 182 (6.4%) |
| 5 or more Children | 577 (89.5%) | 68 (10.5%) |
| Total | 17,630 (96.2%) | 689 (3.8%) |
Income Below Poverty Among Single-Parent Households in Buckeye
According to the poverty data in Buckeye, 10.1% or 141 single-father households and 18.6% or 542 single-mother households are living below the poverty line. Among single-father households, those with 3 or 4 children have the highest poverty rate, with 95 households (65.1%) experiencing poverty. Likewise, among single-mother households, those with 3 or 4 children have the highest poverty rate, with 206 households (59.4%) falling below the poverty line.
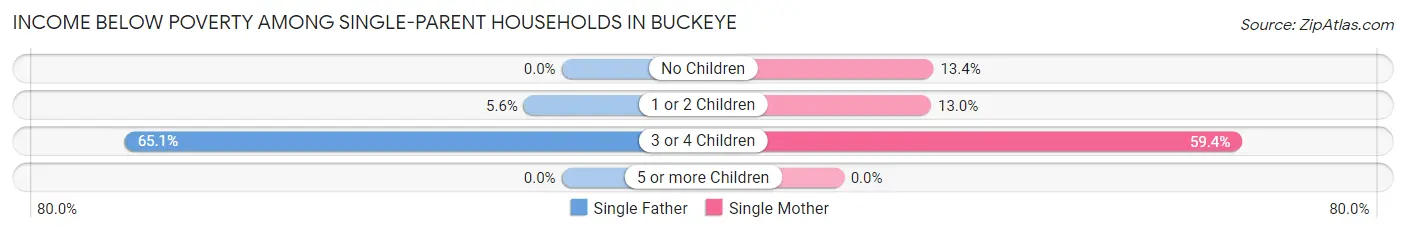
| Children | Single Father | Single Mother |
| No Children | 0 (0.0%) | 95 (13.4%) |
| 1 or 2 Children | 46 (5.6%) | 241 (13.0%) |
| 3 or 4 Children | 95 (65.1%) | 206 (59.4%) |
| 5 or more Children | 0 (0.0%) | 0 (0.0%) |
| Total | 141 (10.1%) | 542 (18.6%) |
Income Below Poverty Among Married-Couple vs Single-Parent Households in Buckeye
The poverty data for Buckeye shows that 689 of the married-couple family households (3.8%) and 683 of the single-parent households (15.9%) are living below the poverty level. Within the married-couple family households, those with 5 or more children have the highest poverty rate, with 68 households (10.5%) falling below the poverty line. Among the single-parent households, those with 3 or 4 children have the highest poverty rate, with 301 household (61.1%) living below poverty.
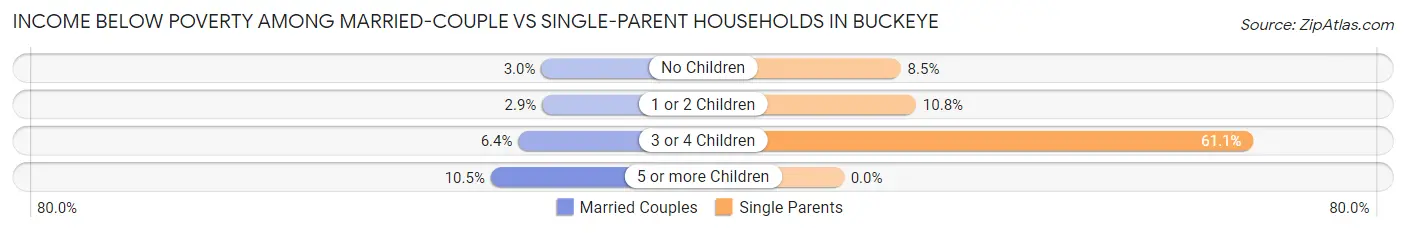
| Children | Married-Couple Families | Single-Parent Households |
| No Children | 268 (3.0%) | 95 (8.5%) |
| 1 or 2 Children | 171 (2.9%) | 287 (10.8%) |
| 3 or 4 Children | 182 (6.4%) | 301 (61.1%) |
| 5 or more Children | 68 (10.5%) | 0 (0.0%) |
| Total | 689 (3.8%) | 683 (15.9%) |
Race in Buckeye
The most populous races in Buckeye are White / Caucasian (61,518 | 64.7%), Hispanic or Latino (42,435 | 44.7%), and Two or more Races (12,972 | 13.7%).
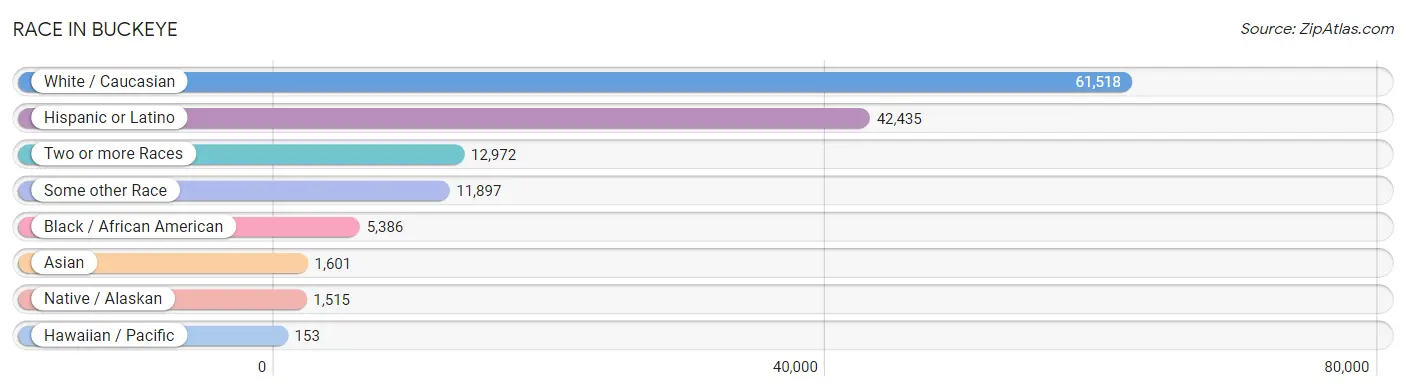
| Race | # Population | % Population |
| Asian | 1,601 | 1.7% |
| Black / African American | 5,386 | 5.7% |
| Hawaiian / Pacific | 153 | 0.2% |
| Hispanic or Latino | 42,435 | 44.7% |
| Native / Alaskan | 1,515 | 1.6% |
| White / Caucasian | 61,518 | 64.7% |
| Two or more Races | 12,972 | 13.7% |
| Some other Race | 11,897 | 12.5% |
| Total | 95,042 | 100.0% |
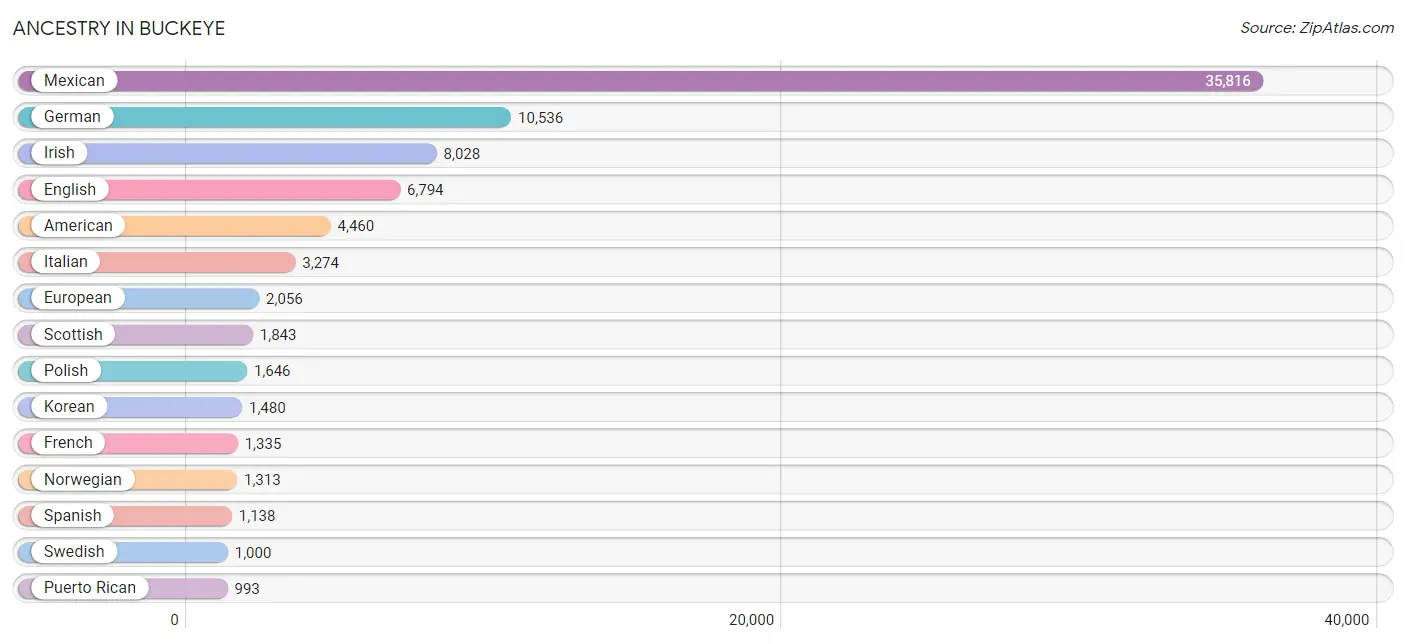
Ancestry in Buckeye
The most populous ancestries reported in Buckeye are Mexican (35,816 | 37.7%), German (10,536 | 11.1%), Irish (8,028 | 8.5%), English (6,794 | 7.1%), and American (4,460 | 4.7%), together accounting for 69.1% of all Buckeye residents.
| Ancestry | # Population | % Population |
| African | 162 | 0.2% |
| Albanian | 8 | 0.0% |
| American | 4,460 | 4.7% |
| Apache | 67 | 0.1% |
| Arab | 354 | 0.4% |
| Argentinean | 150 | 0.2% |
| Armenian | 59 | 0.1% |
| Australian | 12 | 0.0% |
| Austrian | 91 | 0.1% |
| Basque | 14 | 0.0% |
| Belgian | 95 | 0.1% |
| Bhutanese | 338 | 0.4% |
| Brazilian | 34 | 0.0% |
| British | 526 | 0.5% |
| Burmese | 105 | 0.1% |
| Cambodian | 7 | 0.0% |
| Canadian | 11 | 0.0% |
| Celtic | 4 | 0.0% |
| Central American | 968 | 1.0% |
| Central American Indian | 13 | 0.0% |
| Cherokee | 146 | 0.2% |
| Chippewa | 8 | 0.0% |
| Choctaw | 166 | 0.2% |
| Colombian | 182 | 0.2% |
| Costa Rican | 28 | 0.0% |
| Croatian | 32 | 0.0% |
| Cuban | 171 | 0.2% |
| Czech | 371 | 0.4% |
| Czechoslovakian | 58 | 0.1% |
| Danish | 319 | 0.3% |
| Delaware | 17 | 0.0% |
| Dominican | 337 | 0.4% |
| Dutch | 800 | 0.8% |
| Eastern European | 62 | 0.1% |
| Ecuadorian | 15 | 0.0% |
| Egyptian | 25 | 0.0% |
| English | 6,794 | 7.1% |
| Ethiopian | 8 | 0.0% |
| European | 2,056 | 2.2% |
| Finnish | 399 | 0.4% |
| French | 1,335 | 1.4% |
| French Canadian | 285 | 0.3% |
| German | 10,536 | 11.1% |
| Greek | 262 | 0.3% |
| Guamanian / Chamorro | 78 | 0.1% |
| Guatemalan | 383 | 0.4% |
| Haitian | 8 | 0.0% |
| Honduran | 82 | 0.1% |
| Hopi | 10 | 0.0% |
| Hungarian | 83 | 0.1% |
| Icelander | 8 | 0.0% |
| Indian (Asian) | 303 | 0.3% |
| Inupiat | 9 | 0.0% |
| Iraqi | 43 | 0.1% |
| Irish | 8,028 | 8.5% |
| Iroquois | 13 | 0.0% |
| Israeli | 10 | 0.0% |
| Italian | 3,274 | 3.4% |
| Jamaican | 163 | 0.2% |
| Korean | 1,480 | 1.6% |
| Laotian | 24 | 0.0% |
| Lebanese | 42 | 0.0% |
| Liberian | 5 | 0.0% |
| Lithuanian | 117 | 0.1% |
| Malaysian | 15 | 0.0% |
| Mexican | 35,816 | 37.7% |
| Mexican American Indian | 33 | 0.0% |
| Native Hawaiian | 404 | 0.4% |
| Navajo | 271 | 0.3% |
| Nicaraguan | 15 | 0.0% |
| Nigerian | 57 | 0.1% |
| Northern European | 112 | 0.1% |
| Norwegian | 1,313 | 1.4% |
| Paiute | 20 | 0.0% |
| Pakistani | 20 | 0.0% |
| Pennsylvania German | 28 | 0.0% |
| Peruvian | 109 | 0.1% |
| Pima | 187 | 0.2% |
| Polish | 1,646 | 1.7% |
| Portuguese | 339 | 0.4% |
| Potawatomi | 12 | 0.0% |
| Pueblo | 10 | 0.0% |
| Puerto Rican | 993 | 1.0% |
| Romanian | 37 | 0.0% |
| Russian | 468 | 0.5% |
| Salvadoran | 429 | 0.4% |
| Samoan | 118 | 0.1% |
| Scandinavian | 307 | 0.3% |
| Scotch-Irish | 347 | 0.4% |
| Scottish | 1,843 | 1.9% |
| Serbian | 6 | 0.0% |
| Shoshone | 168 | 0.2% |
| Slovak | 78 | 0.1% |
| Slovene | 166 | 0.2% |
| South African | 9 | 0.0% |
| South American | 655 | 0.7% |
| South American Indian | 41 | 0.0% |
| Spaniard | 805 | 0.9% |
| Spanish | 1,138 | 1.2% |
| Spanish American | 49 | 0.1% |
| Sri Lankan | 672 | 0.7% |
| Subsaharan African | 344 | 0.4% |
| Sudanese | 9 | 0.0% |
| Swedish | 1,000 | 1.1% |
| Swiss | 121 | 0.1% |
| Syrian | 44 | 0.1% |
| Thai | 72 | 0.1% |
| Tohono O'Odham | 59 | 0.1% |
| Tongan | 13 | 0.0% |
| Trinidadian and Tobagonian | 5 | 0.0% |
| Turkish | 17 | 0.0% |
| Ukrainian | 162 | 0.2% |
| Uruguayan | 23 | 0.0% |
| Venezuelan | 110 | 0.1% |
| Welsh | 476 | 0.5% |
| West Indian | 41 | 0.0% |
| Yaqui | 282 | 0.3% |
| Yugoslavian | 23 | 0.0% |
| Yuman | 229 | 0.2% | View All 119 Rows |
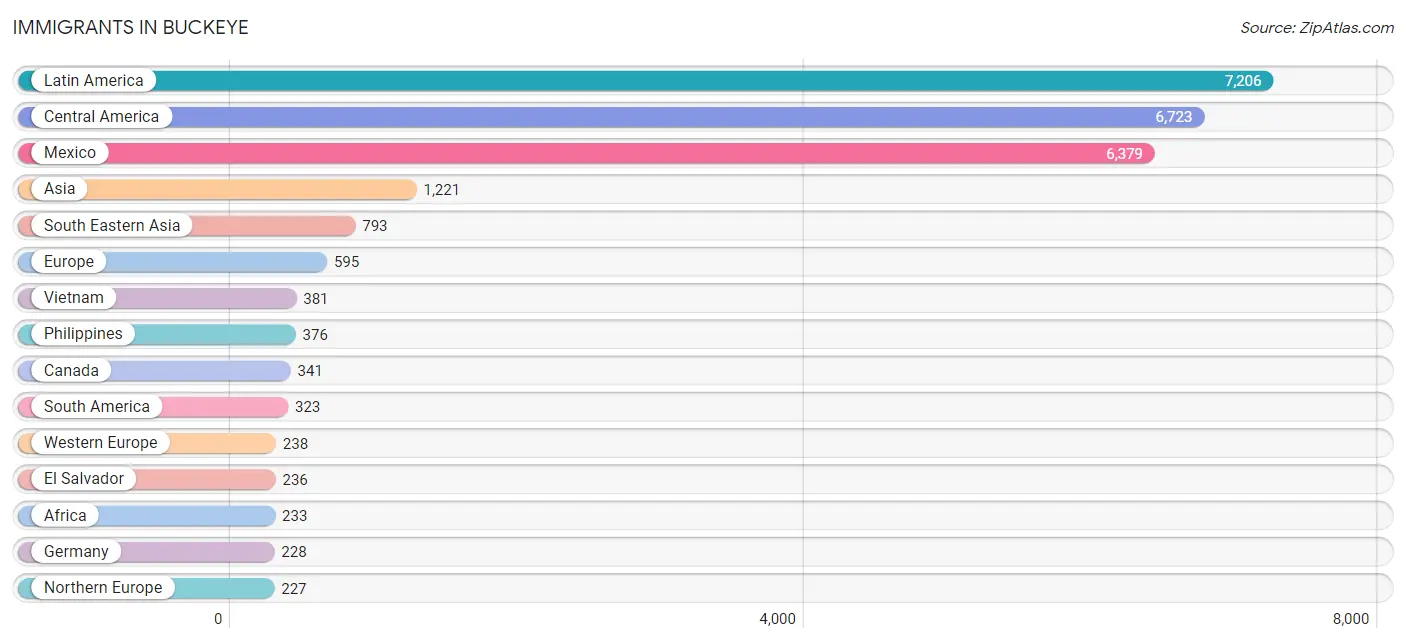
Immigrants in Buckeye
The most numerous immigrant groups reported in Buckeye came from Latin America (7,206 | 7.6%), Central America (6,723 | 7.1%), Mexico (6,379 | 6.7%), Asia (1,221 | 1.3%), and South Eastern Asia (793 | 0.8%), together accounting for 23.5% of all Buckeye residents.
| Immigration Origin | # Population | % Population |
| Africa | 233 | 0.3% |
| Argentina | 17 | 0.0% |
| Asia | 1,221 | 1.3% |
| Belgium | 10 | 0.0% |
| Brazil | 34 | 0.0% |
| Cameroon | 100 | 0.1% |
| Canada | 341 | 0.4% |
| Caribbean | 160 | 0.2% |
| Central America | 6,723 | 7.1% |
| China | 103 | 0.1% |
| Colombia | 110 | 0.1% |
| Croatia | 23 | 0.0% |
| Cuba | 17 | 0.0% |
| Czechoslovakia | 91 | 0.1% |
| Dominican Republic | 87 | 0.1% |
| Eastern Africa | 8 | 0.0% |
| Eastern Asia | 225 | 0.2% |
| Eastern Europe | 130 | 0.1% |
| Ecuador | 15 | 0.0% |
| Egypt | 25 | 0.0% |
| El Salvador | 236 | 0.3% |
| England | 124 | 0.1% |
| Ethiopia | 8 | 0.0% |
| Europe | 595 | 0.6% |
| Germany | 228 | 0.2% |
| Guatemala | 64 | 0.1% |
| Indonesia | 9 | 0.0% |
| Iran | 12 | 0.0% |
| Iraq | 38 | 0.0% |
| Japan | 89 | 0.1% |
| Kazakhstan | 43 | 0.1% |
| Korea | 33 | 0.0% |
| Latin America | 7,206 | 7.6% |
| Lebanon | 7 | 0.0% |
| Liberia | 2 | 0.0% |
| Mexico | 6,379 | 6.7% |
| Middle Africa | 139 | 0.2% |
| Nicaragua | 44 | 0.1% |
| Nigeria | 50 | 0.1% |
| Northern Africa | 34 | 0.0% |
| Northern Europe | 227 | 0.2% |
| Oceania | 19 | 0.0% |
| Peru | 41 | 0.0% |
| Philippines | 376 | 0.4% |
| Poland | 2 | 0.0% |
| Romania | 14 | 0.0% |
| Saudi Arabia | 22 | 0.0% |
| Scotland | 8 | 0.0% |
| South America | 323 | 0.3% |
| South Central Asia | 108 | 0.1% |
| South Eastern Asia | 793 | 0.8% |
| Sri Lanka | 53 | 0.1% |
| Sudan | 9 | 0.0% |
| Sweden | 63 | 0.1% |
| Taiwan | 26 | 0.0% |
| Thailand | 27 | 0.0% |
| Trinidad and Tobago | 34 | 0.0% |
| Turkey | 9 | 0.0% |
| Venezuela | 106 | 0.1% |
| Vietnam | 381 | 0.4% |
| Western Africa | 52 | 0.1% |
| Western Asia | 95 | 0.1% |
| Western Europe | 238 | 0.3% |
| Zaire | 39 | 0.0% | View All 64 Rows |
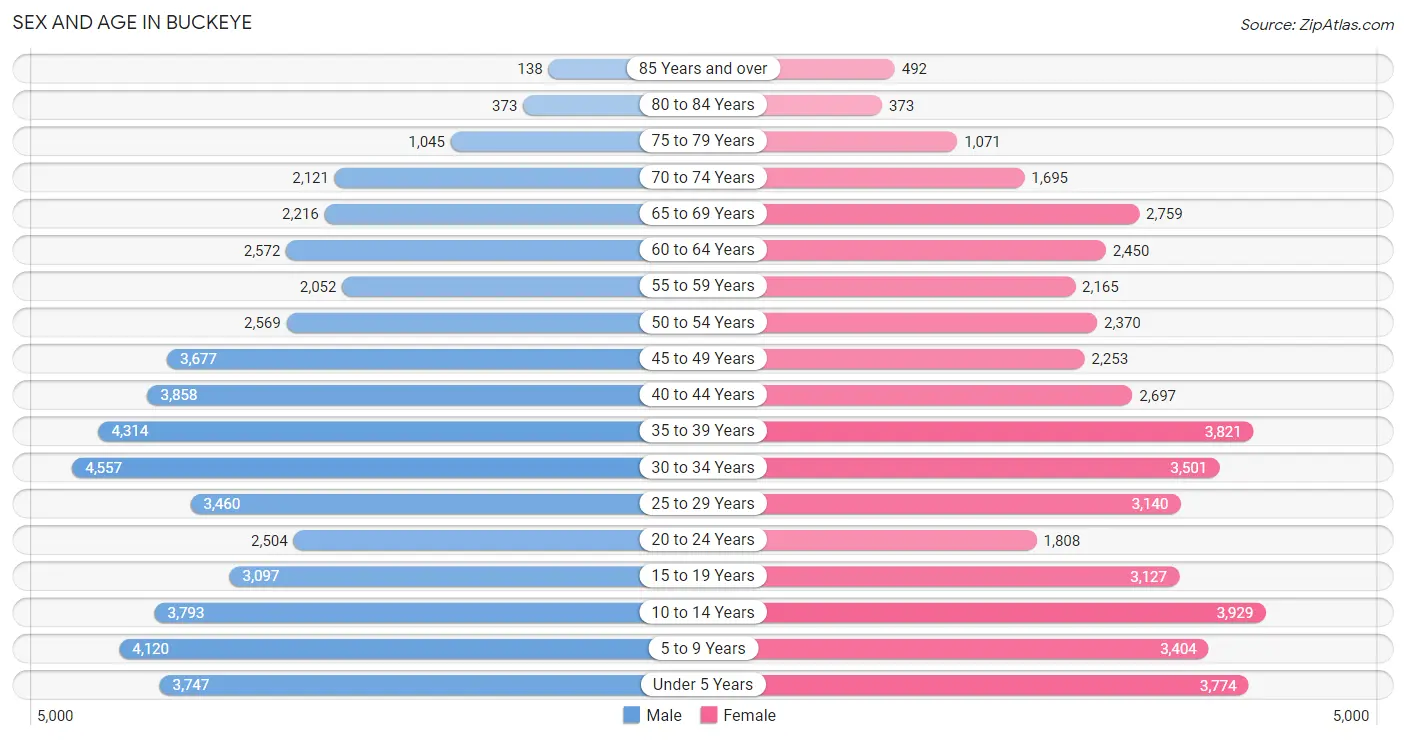
Sex and Age in Buckeye
Sex and Age in Buckeye
The most populous age groups in Buckeye are 30 to 34 Years (4,557 | 9.1%) for men and 10 to 14 Years (3,929 | 8.8%) for women.
| Age Bracket | Male | Female |
| Under 5 Years | 3,747 (7.5%) | 3,774 (8.4%) |
| 5 to 9 Years | 4,120 (8.2%) | 3,404 (7.6%) |
| 10 to 14 Years | 3,793 (7.5%) | 3,929 (8.8%) |
| 15 to 19 Years | 3,097 (6.2%) | 3,127 (7.0%) |
| 20 to 24 Years | 2,504 (5.0%) | 1,808 (4.0%) |
| 25 to 29 Years | 3,460 (6.9%) | 3,140 (7.0%) |
| 30 to 34 Years | 4,557 (9.1%) | 3,501 (7.8%) |
| 35 to 39 Years | 4,314 (8.6%) | 3,821 (8.5%) |
| 40 to 44 Years | 3,858 (7.7%) | 2,697 (6.0%) |
| 45 to 49 Years | 3,677 (7.3%) | 2,253 (5.0%) |
| 50 to 54 Years | 2,569 (5.1%) | 2,370 (5.3%) |
| 55 to 59 Years | 2,052 (4.1%) | 2,165 (4.8%) |
| 60 to 64 Years | 2,572 (5.1%) | 2,450 (5.5%) |
| 65 to 69 Years | 2,216 (4.4%) | 2,759 (6.1%) |
| 70 to 74 Years | 2,121 (4.2%) | 1,695 (3.8%) |
| 75 to 79 Years | 1,045 (2.1%) | 1,071 (2.4%) |
| 80 to 84 Years | 373 (0.7%) | 373 (0.8%) |
| 85 Years and over | 138 (0.3%) | 492 (1.1%) |
| Total | 50,213 (100.0%) | 44,829 (100.0%) |
Families and Households in Buckeye
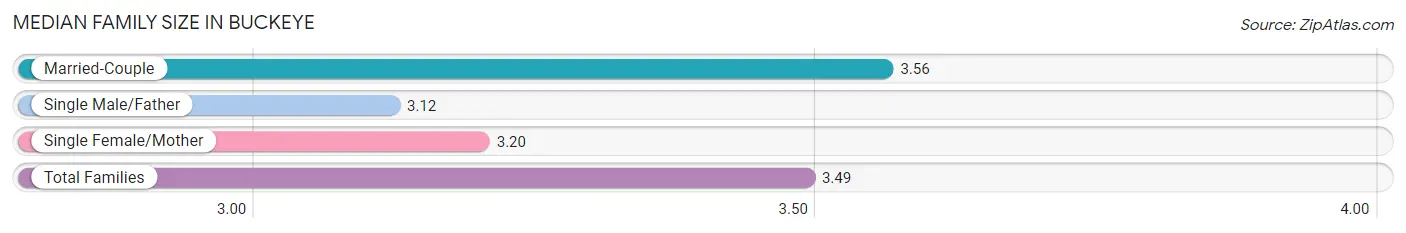
Median Family Size in Buckeye
The median family size in Buckeye is 3.49 persons per family, with married-couple families (18,319 | 81.0%) accounting for the largest median family size of 3.56 persons per family. On the other hand, single male/father families (1,392 | 6.1%) represent the smallest median family size with 3.12 persons per family.
| Family Type | # Families | Family Size |
| Married-Couple | 18,319 (81.0%) | 3.56 |
| Single Male/Father | 1,392 (6.1%) | 3.12 |
| Single Female/Mother | 2,908 (12.9%) | 3.20 |
| Total Families | 22,619 (100.0%) | 3.49 |
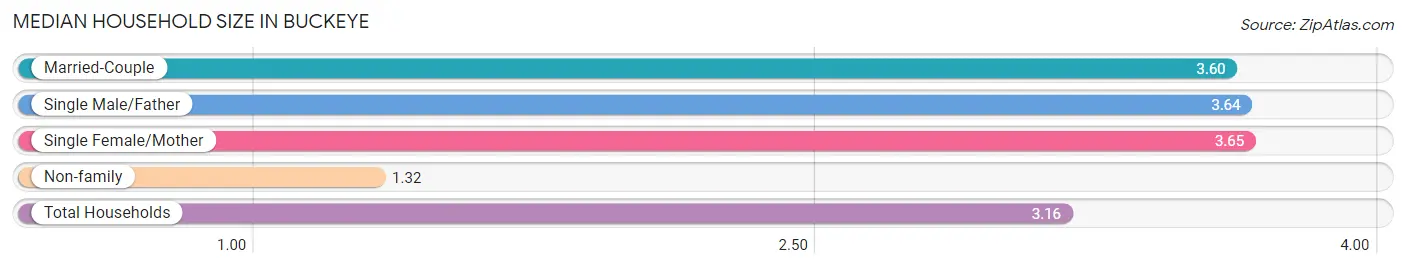
Median Household Size in Buckeye
The median household size in Buckeye is 3.16 persons per household, with single female/mother households (2,908 | 10.3%) accounting for the largest median household size of 3.65 persons per household. non-family households (5,486 | 19.5%) represent the smallest median household size with 1.32 persons per household.
| Household Type | # Households | Household Size |
| Married-Couple | 18,319 (65.2%) | 3.60 |
| Single Male/Father | 1,392 (5.0%) | 3.64 |
| Single Female/Mother | 2,908 (10.3%) | 3.65 |
| Non-family | 5,486 (19.5%) | 1.32 |
| Total Households | 28,105 (100.0%) | 3.16 |
Household Size by Marriage Status in Buckeye
Out of a total of 28,105 households in Buckeye, 22,619 (80.5%) are family households, while 5,486 (19.5%) are nonfamily households. The most numerous type of family households are 2-person households, comprising 7,970, and the most common type of nonfamily households are 1-person households, comprising 4,011.
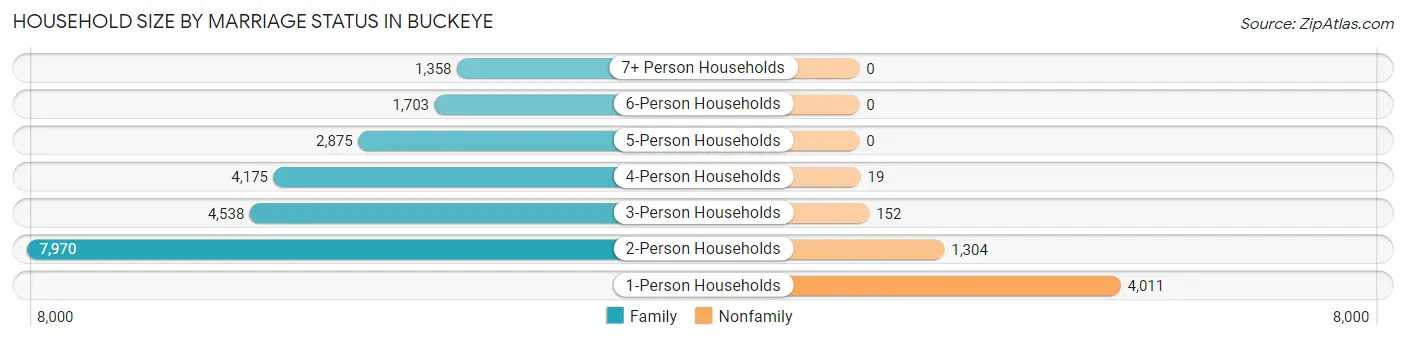
| Household Size | Family Households | Nonfamily Households |
| 1-Person Households | - | 4,011 (14.3%) |
| 2-Person Households | 7,970 (28.4%) | 1,304 (4.6%) |
| 3-Person Households | 4,538 (16.2%) | 152 (0.5%) |
| 4-Person Households | 4,175 (14.9%) | 19 (0.1%) |
| 5-Person Households | 2,875 (10.2%) | 0 (0.0%) |
| 6-Person Households | 1,703 (6.1%) | 0 (0.0%) |
| 7+ Person Households | 1,358 (4.8%) | 0 (0.0%) |
| Total | 22,619 (80.5%) | 5,486 (19.5%) |
Female Fertility in Buckeye
Fertility by Age in Buckeye
Average fertility rate in Buckeye is 79.0 births per 1,000 women. Women in the age bracket of 20 to 34 years have the highest fertility rate with 119.0 births per 1,000 women. Women in the age bracket of 20 to 34 years acount for 60.9% of all women with births.
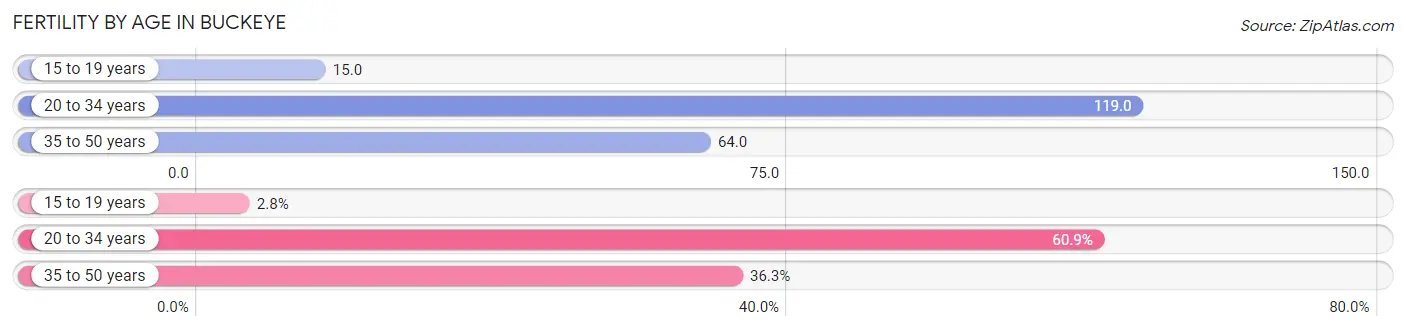
| Age Bracket | Women with Births | Births / 1,000 Women |
| 15 to 19 years | 47 (2.8%) | 15.0 |
| 20 to 34 years | 1,007 (60.9%) | 119.0 |
| 35 to 50 years | 601 (36.3%) | 64.0 |
| Total | 1,655 (100.0%) | 79.0 |
Fertility by Age by Marriage Status in Buckeye
75.5% of women with births (1,655) in Buckeye are married. The highest percentage of unmarried women with births falls into 15 to 19 years age bracket with 100.0% of them unmarried at the time of birth, while the lowest percentage of unmarried women with births belong to 35 to 50 years age bracket with 3.5% of them unmarried.
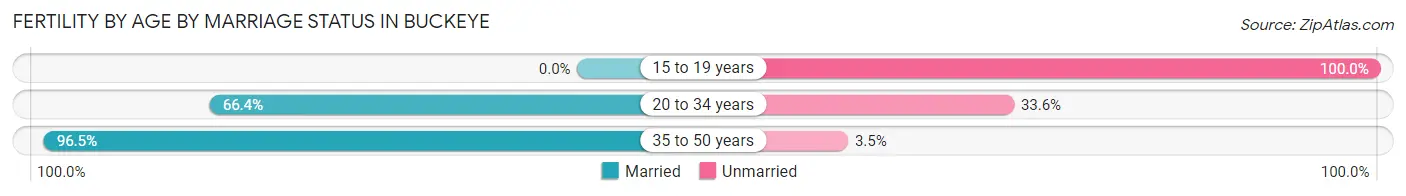
| Age Bracket | Married | Unmarried |
| 15 to 19 years | 0 (0.0%) | 47 (100.0%) |
| 20 to 34 years | 669 (66.4%) | 338 (33.6%) |
| 35 to 50 years | 580 (96.5%) | 21 (3.5%) |
| Total | 1,250 (75.5%) | 405 (24.5%) |
Fertility by Education in Buckeye
Average fertility rate in Buckeye is 79.0 births per 1,000 women. Women with the education attainment of college or associate's degree have the highest fertility rate of 115.0 births per 1,000 women, while women with the education attainment of less than high school have the lowest fertility at 6.0 births per 1,000 women. Women with the education attainment of college or associate's degree represent 52.7% of all women with births.
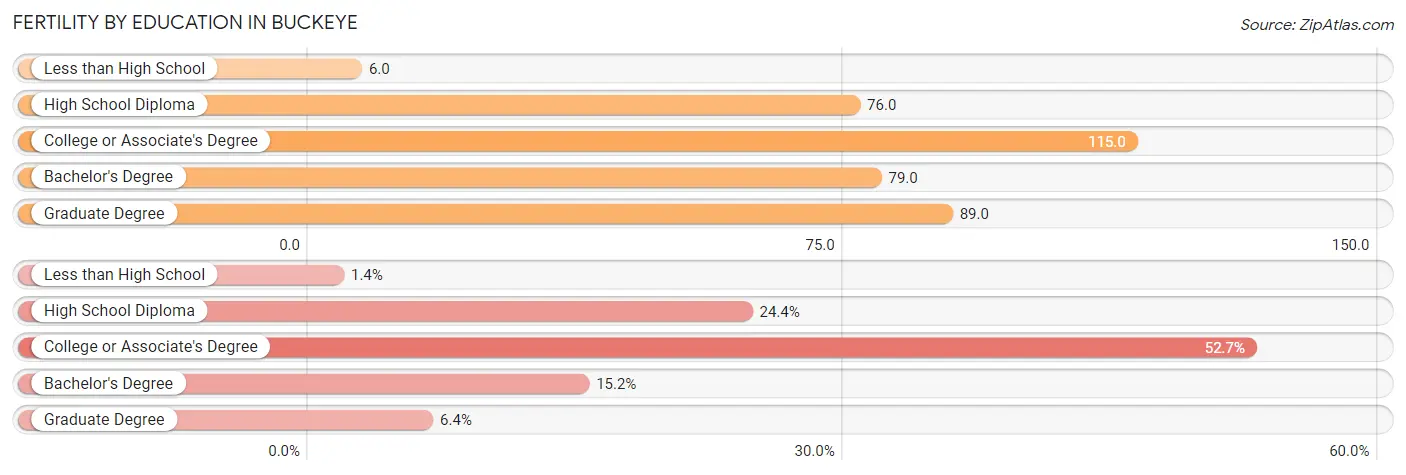
| Educational Attainment | Women with Births | Births / 1,000 Women |
| Less than High School | 23 (1.4%) | 6.0 |
| High School Diploma | 403 (24.3%) | 76.0 |
| College or Associate's Degree | 872 (52.7%) | 115.0 |
| Bachelor's Degree | 251 (15.2%) | 79.0 |
| Graduate Degree | 106 (6.4%) | 89.0 |
| Total | 1,655 (100.0%) | 79.0 |
Fertility by Education by Marriage Status in Buckeye
24.5% of women with births in Buckeye are unmarried. Women with the educational attainment of less than high school are most likely to be married with 100.0% of them married at childbirth, while women with the educational attainment of high school diploma are least likely to be married with 64.8% of them unmarried at childbirth.
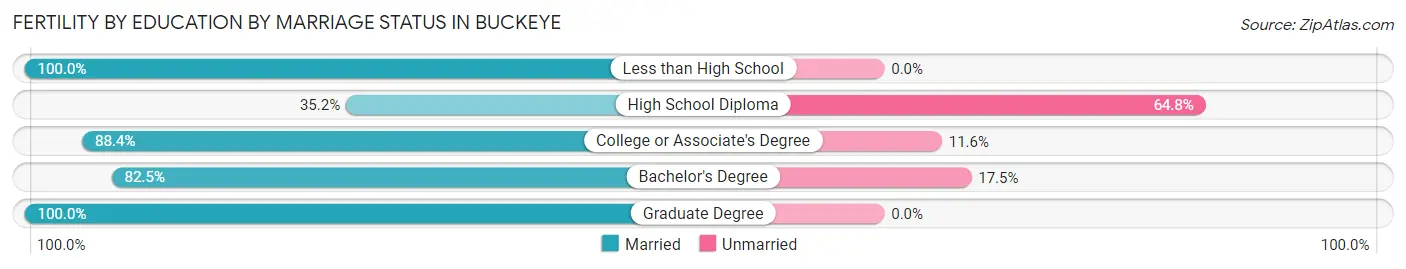
| Educational Attainment | Married | Unmarried |
| Less than High School | 23 (100.0%) | 0 (0.0%) |
| High School Diploma | 142 (35.2%) | 261 (64.8%) |
| College or Associate's Degree | 771 (88.4%) | 101 (11.6%) |
| Bachelor's Degree | 207 (82.5%) | 44 (17.5%) |
| Graduate Degree | 106 (100.0%) | 0 (0.0%) |
| Total | 1,250 (75.5%) | 405 (24.5%) |
Employment Characteristics in Buckeye
Employment by Class of Employer in Buckeye
Among the 38,469 employed individuals in Buckeye, private company employees (27,100 | 70.5%), local government employees (2,599 | 6.8%), and not-for-profit organizations (2,250 | 5.9%) make up the most common classes of employment.
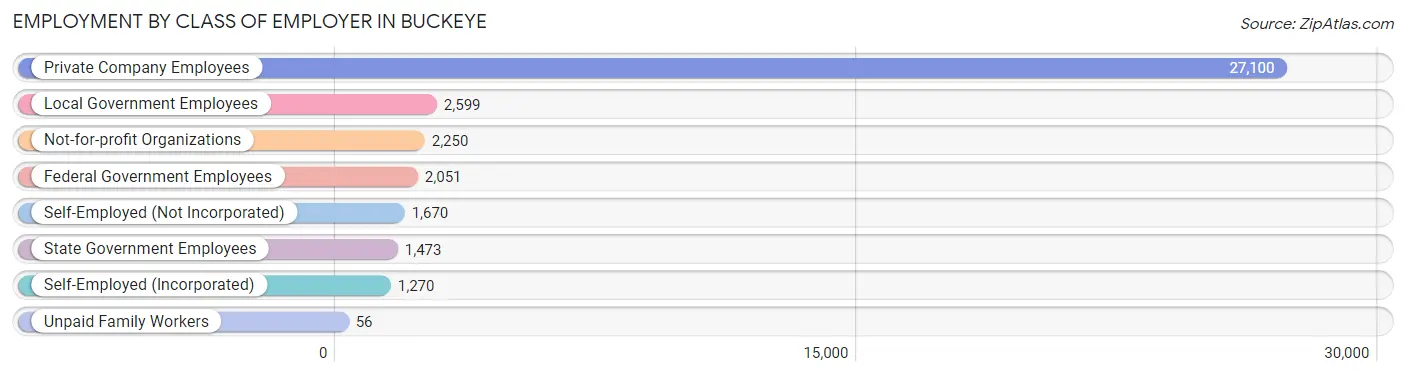
| Employer Class | # Employees | % Employees |
| Private Company Employees | 27,100 | 70.5% |
| Self-Employed (Incorporated) | 1,270 | 3.3% |
| Self-Employed (Not Incorporated) | 1,670 | 4.3% |
| Not-for-profit Organizations | 2,250 | 5.9% |
| Local Government Employees | 2,599 | 6.8% |
| State Government Employees | 1,473 | 3.8% |
| Federal Government Employees | 2,051 | 5.3% |
| Unpaid Family Workers | 56 | 0.2% |
| Total | 38,469 | 100.0% |
Employment Status by Age in Buckeye
According to the labor force statistics for Buckeye, out of the total population over 16 years of age (70,574), 58.2% or 41,074 individuals are in the labor force, with 5.0% or 2,054 of them unemployed. The age group with the highest labor force participation rate is 20 to 24 years, with 78.1% or 3,368 individuals in the labor force. Within the labor force, the 16 to 19 years age range has the highest percentage of unemployed individuals, with 20.6% or 388 of them being unemployed.
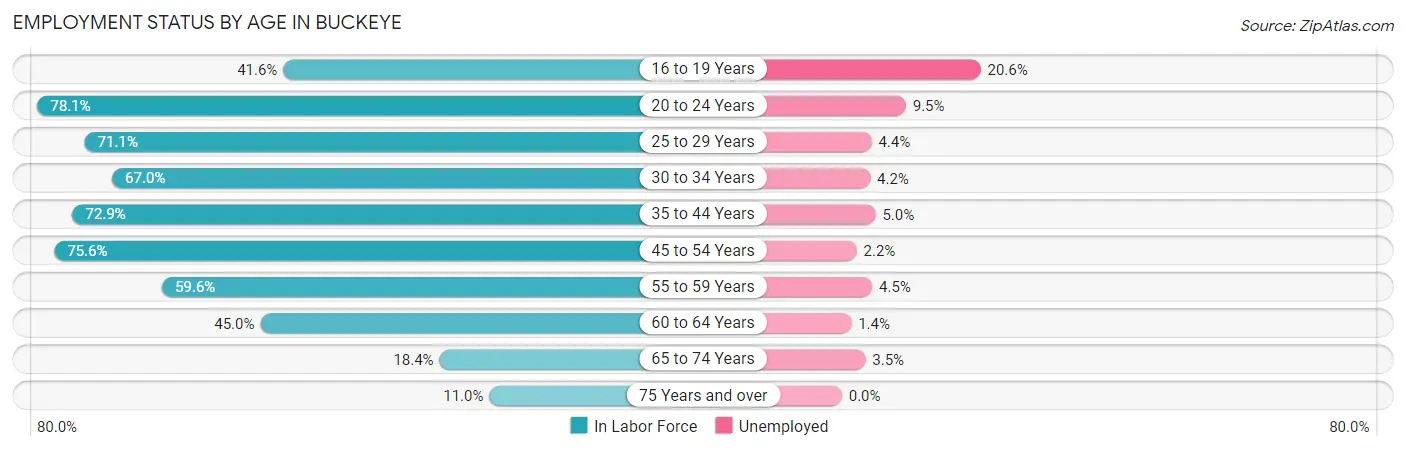
| Age Bracket | In Labor Force | Unemployed |
| 16 to 19 Years | 1,882 (41.6%) | 388 (20.6%) |
| 20 to 24 Years | 3,368 (78.1%) | 320 (9.5%) |
| 25 to 29 Years | 4,693 (71.1%) | 206 (4.4%) |
| 30 to 34 Years | 5,399 (67.0%) | 227 (4.2%) |
| 35 to 44 Years | 10,709 (72.9%) | 535 (5.0%) |
| 45 to 54 Years | 8,217 (75.6%) | 181 (2.2%) |
| 55 to 59 Years | 2,513 (59.6%) | 113 (4.5%) |
| 60 to 64 Years | 2,260 (45.0%) | 32 (1.4%) |
| 65 to 74 Years | 1,618 (18.4%) | 57 (3.5%) |
| 75 Years and over | 384 (11.0%) | 0 (0.0%) |
| Total | 41,074 (58.2%) | 2,054 (5.0%) |
Employment Status by Educational Attainment in Buckeye
According to labor force statistics for Buckeye, 68.3% of individuals (33,778) out of the total population between 25 and 64 years of age (49,456) are in the labor force, with 3.9% or 1,317 of them being unemployed. The group with the highest labor force participation rate are those with the educational attainment of bachelor's degree or higher, with 82.6% or 8,837 individuals in the labor force. Within the labor force, individuals with less than high school education have the highest percentage of unemployment, with 6.3% or 184 of them being unemployed.
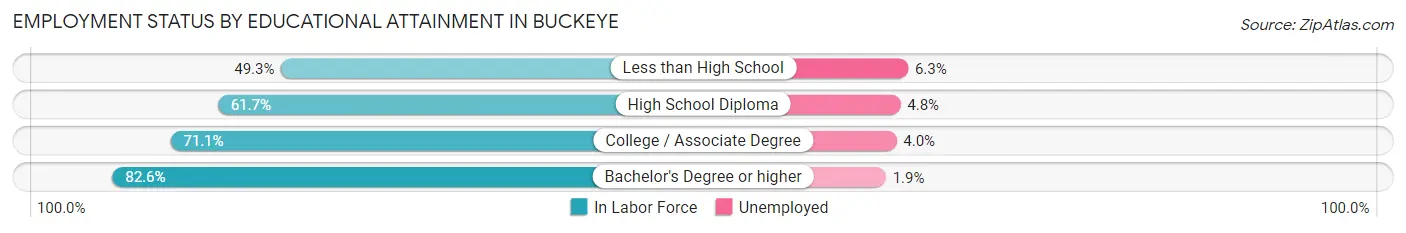
| Educational Attainment | In Labor Force | Unemployed |
| Less than High School | 2,917 (49.3%) | 373 (6.3%) |
| High School Diploma | 8,567 (61.7%) | 666 (4.8%) |
| College / Associate Degree | 13,477 (71.1%) | 758 (4.0%) |
| Bachelor's Degree or higher | 8,837 (82.6%) | 203 (1.9%) |
| Total | 33,778 (68.3%) | 1,929 (3.9%) |
Employment Occupations by Sex in Buckeye
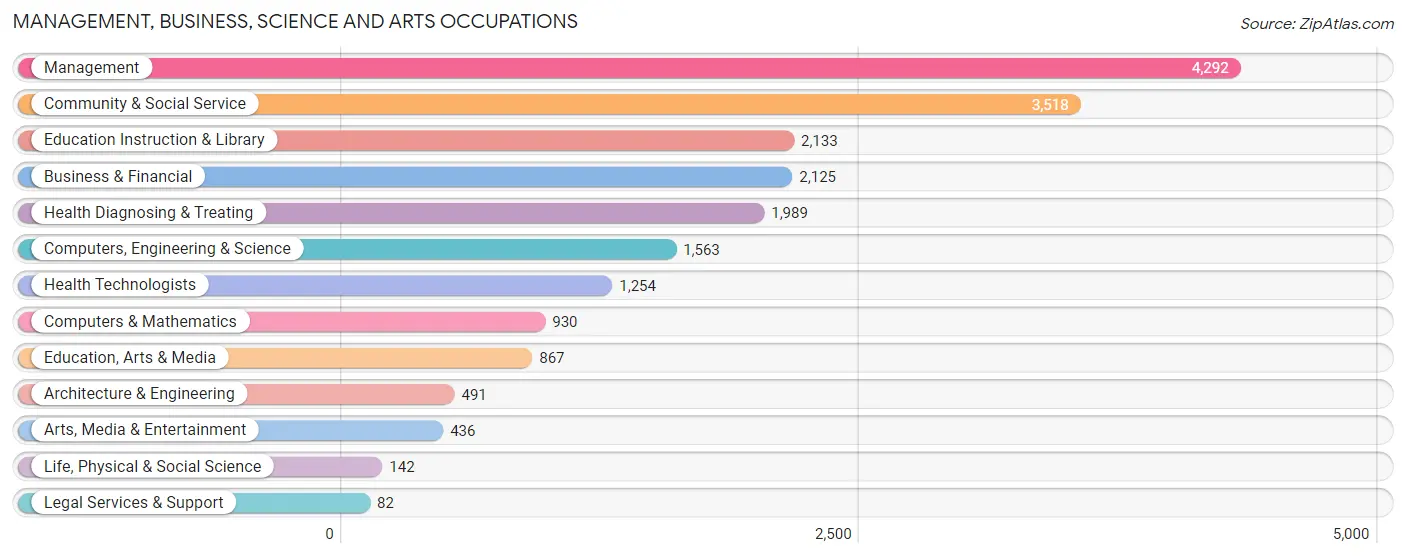
Management, Business, Science and Arts Occupations
The most common Management, Business, Science and Arts occupations in Buckeye are Management (4,292 | 11.2%), Community & Social Service (3,518 | 9.1%), Education Instruction & Library (2,133 | 5.6%), Business & Financial (2,125 | 5.5%), and Health Diagnosing & Treating (1,989 | 5.2%).
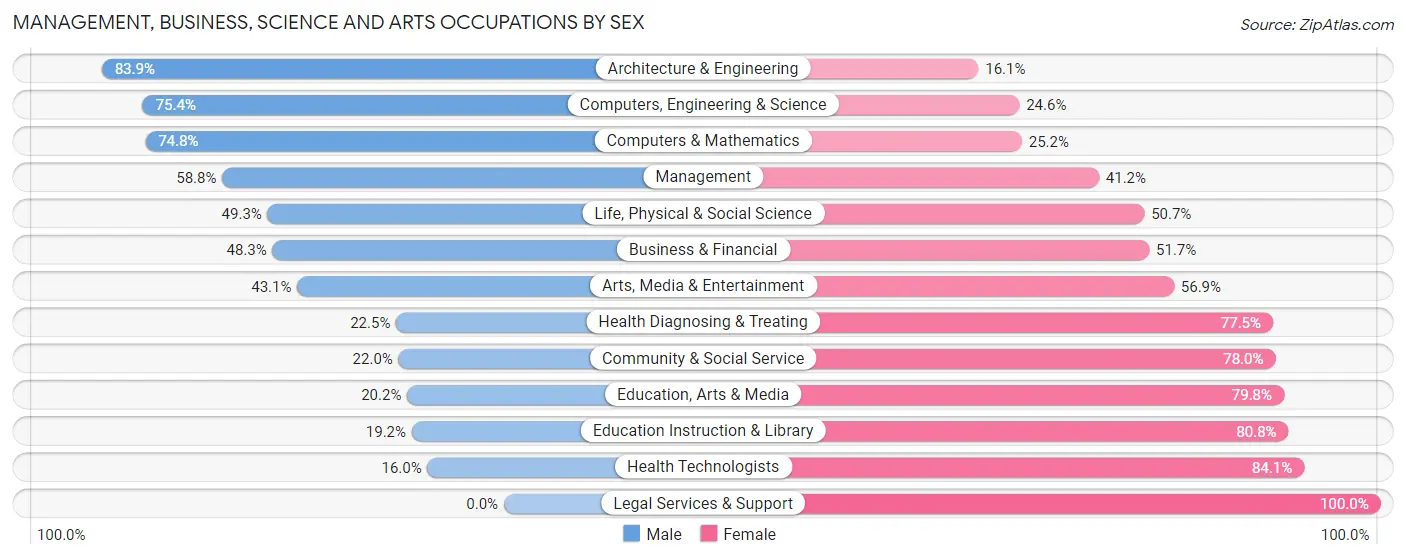
Management, Business, Science and Arts Occupations by Sex
Within the Management, Business, Science and Arts occupations in Buckeye, the most male-oriented occupations are Architecture & Engineering (83.9%), Computers, Engineering & Science (75.4%), and Computers & Mathematics (74.8%), while the most female-oriented occupations are Legal Services & Support (100.0%), Health Technologists (84.1%), and Education Instruction & Library (80.8%).
| Occupation | Male | Female |
| Management | 2,522 (58.8%) | 1,770 (41.2%) |
| Business & Financial | 1,026 (48.3%) | 1,099 (51.7%) |
| Computers, Engineering & Science | 1,178 (75.4%) | 385 (24.6%) |
| Computers & Mathematics | 696 (74.8%) | 234 (25.2%) |
| Architecture & Engineering | 412 (83.9%) | 79 (16.1%) |
| Life, Physical & Social Science | 70 (49.3%) | 72 (50.7%) |
| Community & Social Service | 773 (22.0%) | 2,745 (78.0%) |
| Education, Arts & Media | 175 (20.2%) | 692 (79.8%) |
| Legal Services & Support | 0 (0.0%) | 82 (100.0%) |
| Education Instruction & Library | 410 (19.2%) | 1,723 (80.8%) |
| Arts, Media & Entertainment | 188 (43.1%) | 248 (56.9%) |
| Health Diagnosing & Treating | 447 (22.5%) | 1,542 (77.5%) |
| Health Technologists | 200 (16.0%) | 1,054 (84.1%) |
| Total (Category) | 5,946 (44.1%) | 7,541 (55.9%) |
| Total (Overall) | 21,037 (54.7%) | 17,401 (45.3%) |
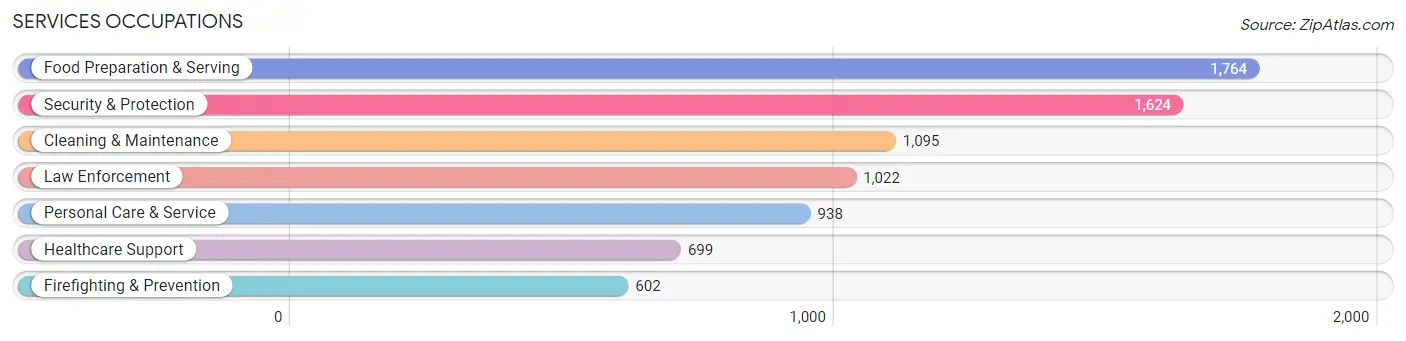
Services Occupations
The most common Services occupations in Buckeye are Food Preparation & Serving (1,764 | 4.6%), Security & Protection (1,624 | 4.2%), Cleaning & Maintenance (1,095 | 2.9%), Law Enforcement (1,022 | 2.7%), and Personal Care & Service (938 | 2.4%).
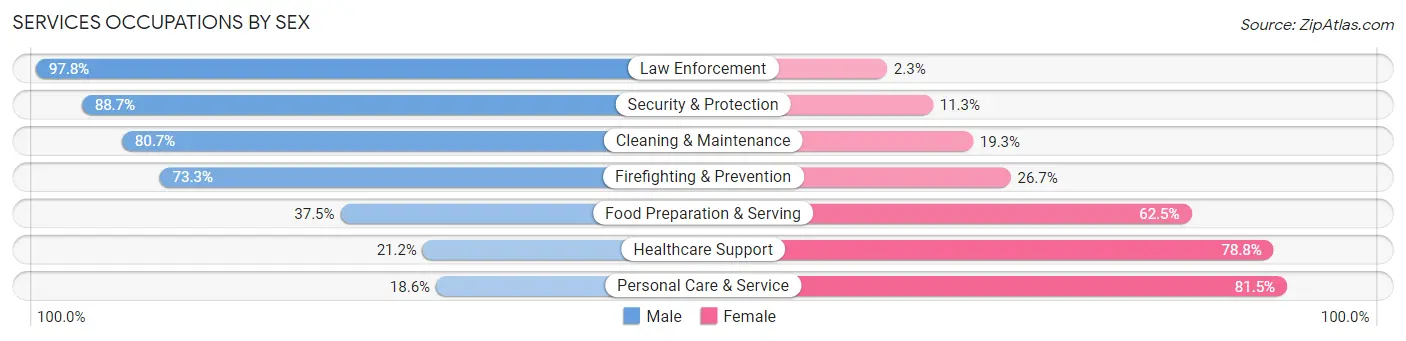
Services Occupations by Sex
Within the Services occupations in Buckeye, the most male-oriented occupations are Law Enforcement (97.8%), Security & Protection (88.7%), and Cleaning & Maintenance (80.7%), while the most female-oriented occupations are Personal Care & Service (81.5%), Healthcare Support (78.8%), and Food Preparation & Serving (62.5%).
| Occupation | Male | Female |
| Healthcare Support | 148 (21.2%) | 551 (78.8%) |
| Security & Protection | 1,440 (88.7%) | 184 (11.3%) |
| Firefighting & Prevention | 441 (73.3%) | 161 (26.7%) |
| Law Enforcement | 999 (97.8%) | 23 (2.2%) |
| Food Preparation & Serving | 661 (37.5%) | 1,103 (62.5%) |
| Cleaning & Maintenance | 884 (80.7%) | 211 (19.3%) |
| Personal Care & Service | 174 (18.5%) | 764 (81.5%) |
| Total (Category) | 3,307 (54.0%) | 2,813 (46.0%) |
| Total (Overall) | 21,037 (54.7%) | 17,401 (45.3%) |
Sales and Office Occupations
The most common Sales and Office occupations in Buckeye are Office & Administration (4,865 | 12.7%), and Sales & Related (3,938 | 10.2%).
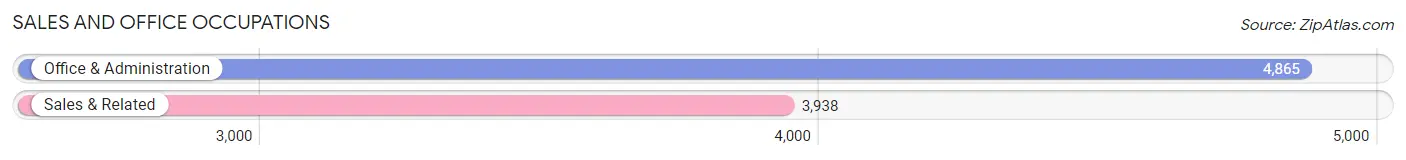
Sales and Office Occupations by Sex
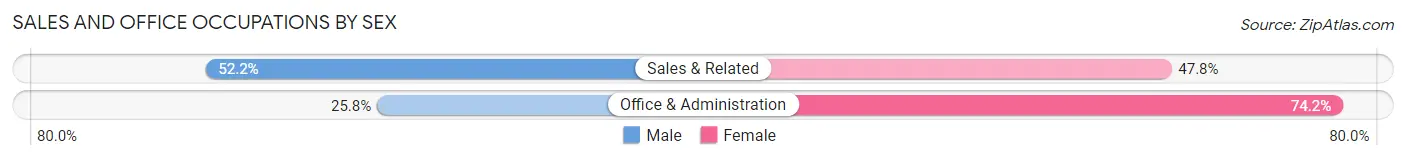
| Occupation | Male | Female |
| Sales & Related | 2,055 (52.2%) | 1,883 (47.8%) |
| Office & Administration | 1,254 (25.8%) | 3,611 (74.2%) |
| Total (Category) | 3,309 (37.6%) | 5,494 (62.4%) |
| Total (Overall) | 21,037 (54.7%) | 17,401 (45.3%) |
Natural Resources, Construction and Maintenance Occupations
The most common Natural Resources, Construction and Maintenance occupations in Buckeye are Construction & Extraction (2,578 | 6.7%), Installation, Maintenance & Repair (1,947 | 5.1%), and Farming, Fishing & Forestry (109 | 0.3%).
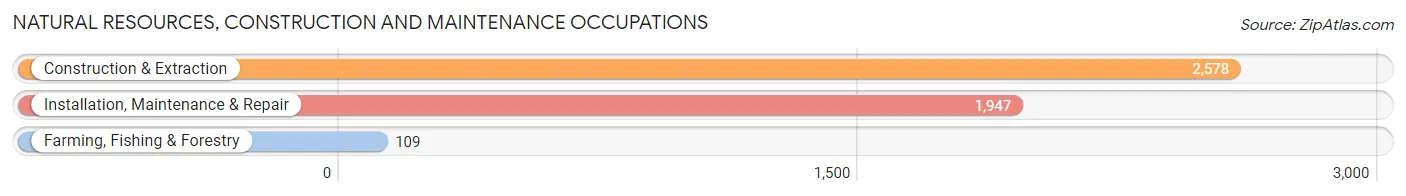
Natural Resources, Construction and Maintenance Occupations by Sex
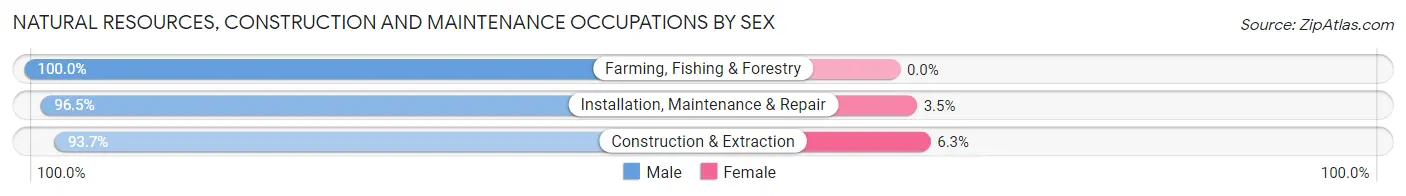
| Occupation | Male | Female |
| Farming, Fishing & Forestry | 109 (100.0%) | 0 (0.0%) |
| Construction & Extraction | 2,415 (93.7%) | 163 (6.3%) |
| Installation, Maintenance & Repair | 1,879 (96.5%) | 68 (3.5%) |
| Total (Category) | 4,403 (95.0%) | 231 (5.0%) |
| Total (Overall) | 21,037 (54.7%) | 17,401 (45.3%) |
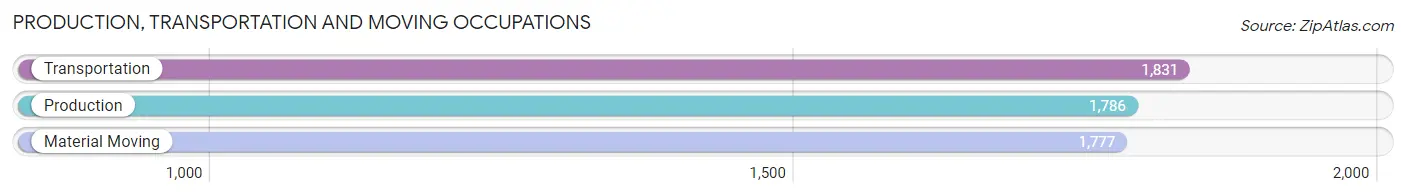
Production, Transportation and Moving Occupations
The most common Production, Transportation and Moving occupations in Buckeye are Transportation (1,831 | 4.8%), Production (1,786 | 4.6%), and Material Moving (1,777 | 4.6%).
Production, Transportation and Moving Occupations by Sex
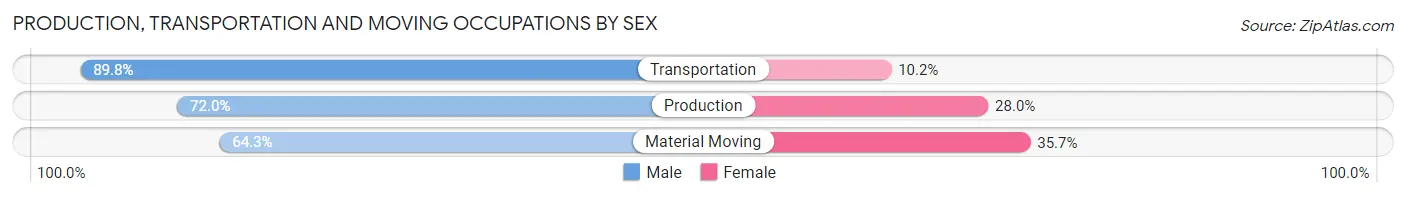
| Occupation | Male | Female |
| Production | 1,286 (72.0%) | 500 (28.0%) |
| Transportation | 1,644 (89.8%) | 187 (10.2%) |
| Material Moving | 1,142 (64.3%) | 635 (35.7%) |
| Total (Category) | 4,072 (75.5%) | 1,322 (24.5%) |
| Total (Overall) | 21,037 (54.7%) | 17,401 (45.3%) |
Employment Industries by Sex in Buckeye
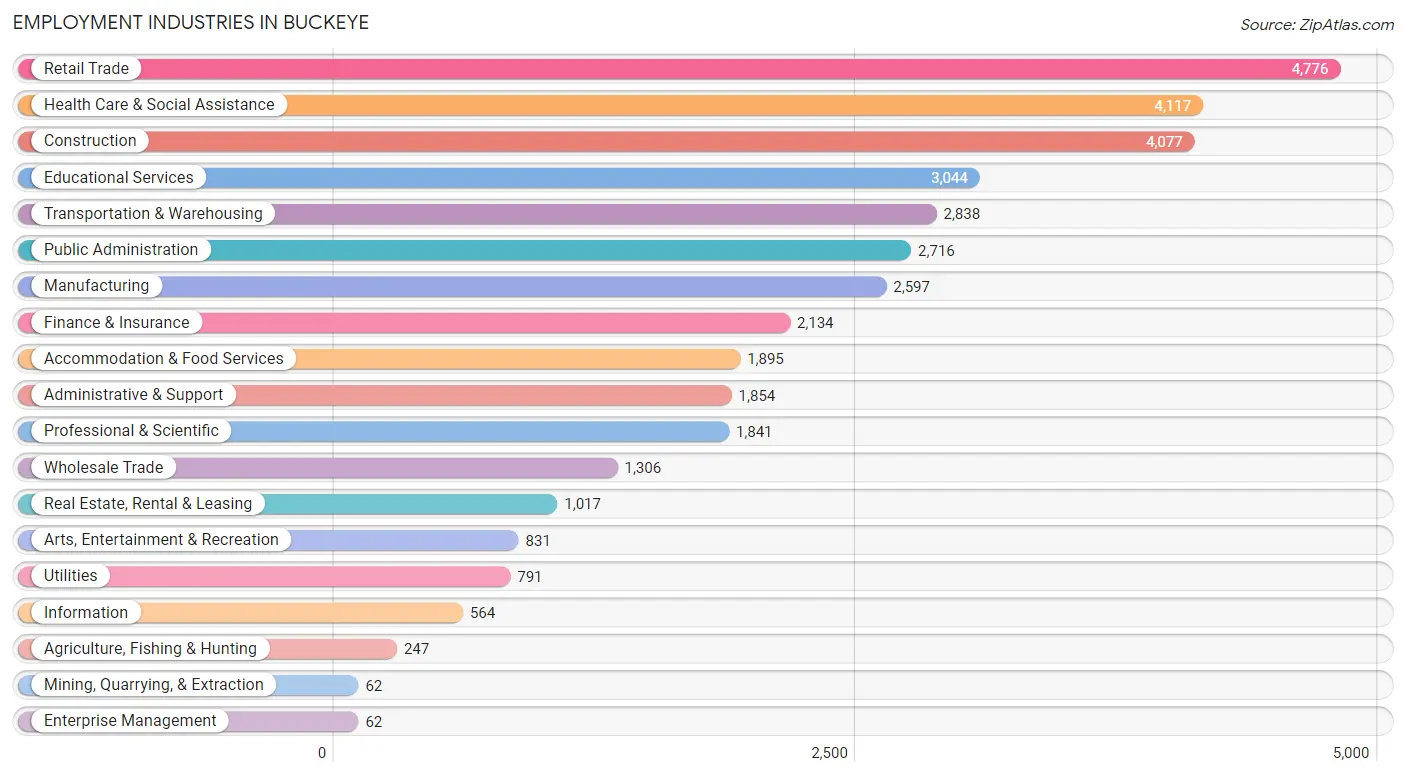
Employment Industries in Buckeye
The major employment industries in Buckeye include Retail Trade (4,776 | 12.4%), Health Care & Social Assistance (4,117 | 10.7%), Construction (4,077 | 10.6%), Educational Services (3,044 | 7.9%), and Transportation & Warehousing (2,838 | 7.4%).
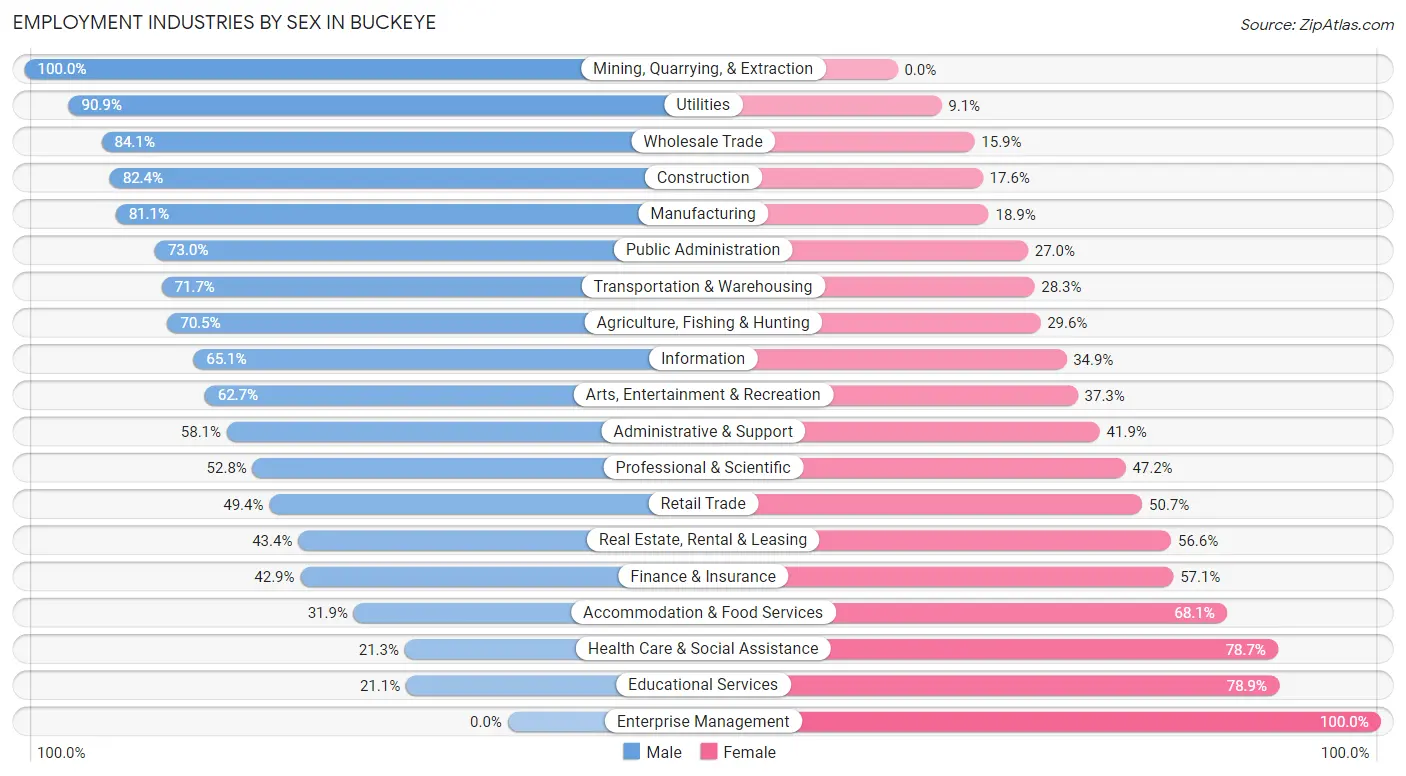
Employment Industries by Sex in Buckeye
The Buckeye industries that see more men than women are Mining, Quarrying, & Extraction (100.0%), Utilities (90.9%), and Wholesale Trade (84.1%), whereas the industries that tend to have a higher number of women are Enterprise Management (100.0%), Educational Services (78.9%), and Health Care & Social Assistance (78.7%).
| Industry | Male | Female |
| Agriculture, Fishing & Hunting | 174 (70.5%) | 73 (29.5%) |
| Mining, Quarrying, & Extraction | 62 (100.0%) | 0 (0.0%) |
| Construction | 3,358 (82.4%) | 719 (17.6%) |
| Manufacturing | 2,107 (81.1%) | 490 (18.9%) |
| Wholesale Trade | 1,098 (84.1%) | 208 (15.9%) |
| Retail Trade | 2,357 (49.3%) | 2,419 (50.6%) |
| Transportation & Warehousing | 2,034 (71.7%) | 804 (28.3%) |
| Utilities | 719 (90.9%) | 72 (9.1%) |
| Information | 367 (65.1%) | 197 (34.9%) |
| Finance & Insurance | 916 (42.9%) | 1,218 (57.1%) |
| Real Estate, Rental & Leasing | 441 (43.4%) | 576 (56.6%) |
| Professional & Scientific | 972 (52.8%) | 869 (47.2%) |
| Enterprise Management | 0 (0.0%) | 62 (100.0%) |
| Administrative & Support | 1,078 (58.1%) | 776 (41.9%) |
| Educational Services | 641 (21.1%) | 2,403 (78.9%) |
| Health Care & Social Assistance | 877 (21.3%) | 3,240 (78.7%) |
| Arts, Entertainment & Recreation | 521 (62.7%) | 310 (37.3%) |
| Accommodation & Food Services | 604 (31.9%) | 1,291 (68.1%) |
| Public Administration | 1,983 (73.0%) | 733 (27.0%) |
| Total | 21,037 (54.7%) | 17,401 (45.3%) |
Education in Buckeye
School Enrollment in Buckeye
The most common levels of schooling among the 24,474 students in Buckeye are middle school (6,162 | 25.2%), elementary school (5,963 | 24.4%), and high school (5,655 | 23.1%).
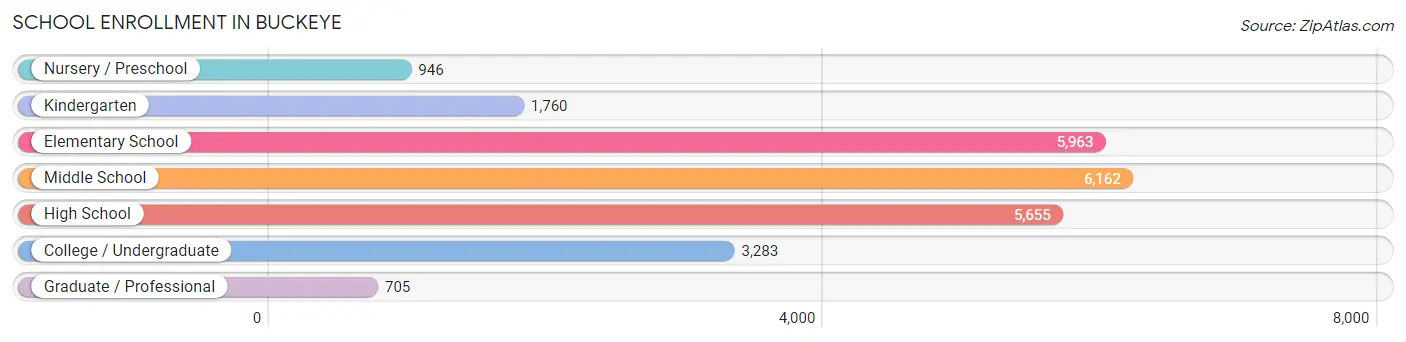
| School Level | # Students | % Students |
| Nursery / Preschool | 946 | 3.9% |
| Kindergarten | 1,760 | 7.2% |
| Elementary School | 5,963 | 24.4% |
| Middle School | 6,162 | 25.2% |
| High School | 5,655 | 23.1% |
| College / Undergraduate | 3,283 | 13.4% |
| Graduate / Professional | 705 | 2.9% |
| Total | 24,474 | 100.0% |
School Enrollment by Age by Funding Source in Buckeye
Out of a total of 24,474 students who are enrolled in schools in Buckeye, 2,863 (11.7%) attend a private institution, while the remaining 21,611 (88.3%) are enrolled in public schools. The age group of 3 to 4 year olds has the highest likelihood of being enrolled in private schools, with 249 (27.4% in the age bracket) enrolled. Conversely, the age group of 15 to 17 year olds has the lowest likelihood of being enrolled in a private school, with 4,042 (95.8% in the age bracket) attending a public institution.
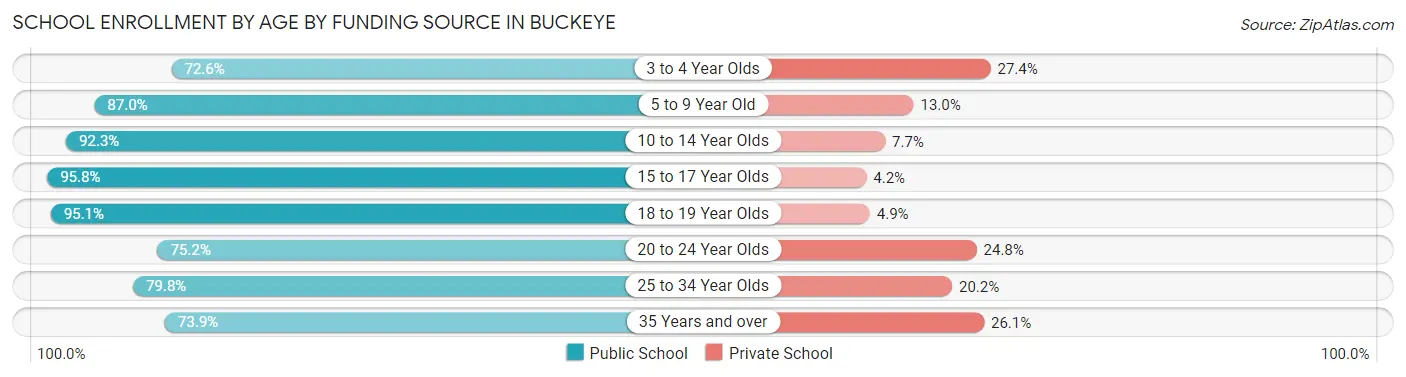
| Age Bracket | Public School | Private School |
| 3 to 4 Year Olds | 661 (72.6%) | 249 (27.4%) |
| 5 to 9 Year Old | 6,284 (87.0%) | 940 (13.0%) |
| 10 to 14 Year Olds | 6,930 (92.3%) | 579 (7.7%) |
| 15 to 17 Year Olds | 4,042 (95.8%) | 178 (4.2%) |
| 18 to 19 Year Olds | 860 (95.1%) | 44 (4.9%) |
| 20 to 24 Year Olds | 872 (75.2%) | 287 (24.8%) |
| 25 to 34 Year Olds | 1,075 (79.8%) | 272 (20.2%) |
| 35 Years and over | 887 (73.9%) | 314 (26.1%) |
| Total | 21,611 (88.3%) | 2,863 (11.7%) |
Educational Attainment by Field of Study in Buckeye
Business (3,620 | 24.2%), education (1,995 | 13.4%), science & technology (1,668 | 11.2%), arts & humanities (1,390 | 9.3%), and psychology (1,106 | 7.4%) are the most common fields of study among 14,939 individuals in Buckeye who have obtained a bachelor's degree or higher.
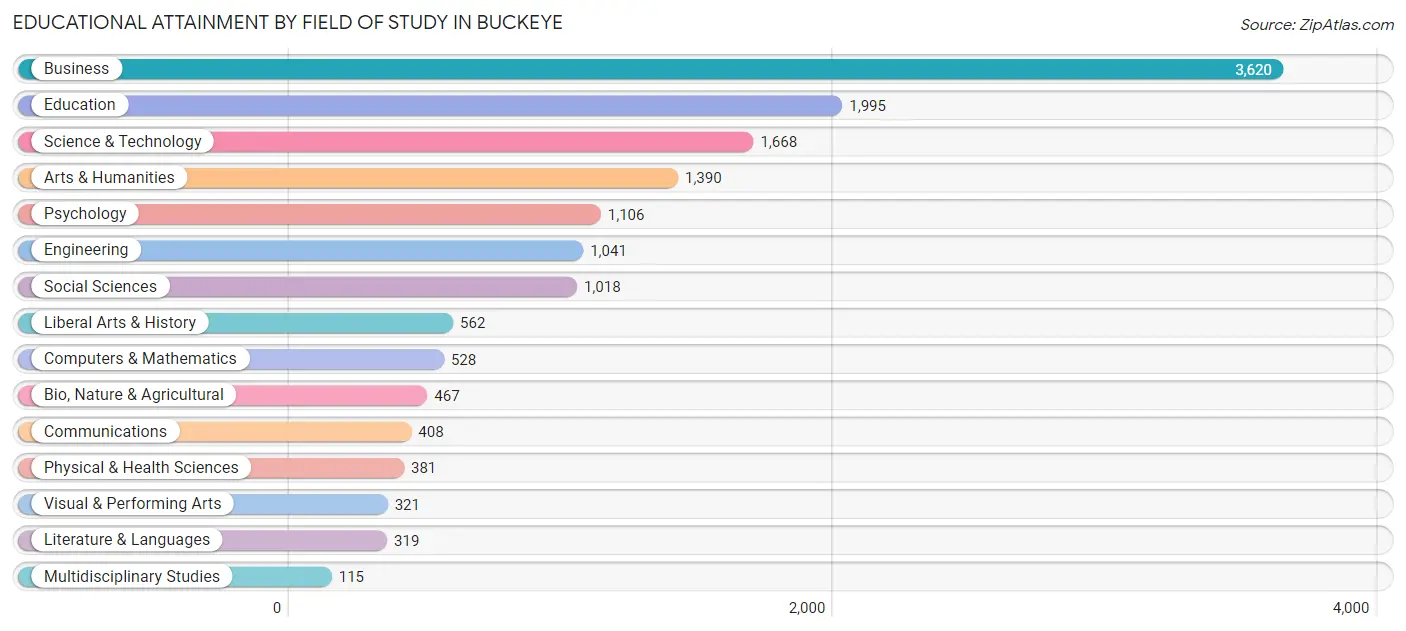
| Field of Study | # Graduates | % Graduates |
| Computers & Mathematics | 528 | 3.5% |
| Bio, Nature & Agricultural | 467 | 3.1% |
| Physical & Health Sciences | 381 | 2.5% |
| Psychology | 1,106 | 7.4% |
| Social Sciences | 1,018 | 6.8% |
| Engineering | 1,041 | 7.0% |
| Multidisciplinary Studies | 115 | 0.8% |
| Science & Technology | 1,668 | 11.2% |
| Business | 3,620 | 24.2% |
| Education | 1,995 | 13.4% |
| Literature & Languages | 319 | 2.1% |
| Liberal Arts & History | 562 | 3.8% |
| Visual & Performing Arts | 321 | 2.1% |
| Communications | 408 | 2.7% |
| Arts & Humanities | 1,390 | 9.3% |
| Total | 14,939 | 100.0% |
Transportation & Commute in Buckeye
Vehicle Availability by Sex in Buckeye
The most prevalent vehicle ownership categories in Buckeye are males with 2 vehicles (9,457, accounting for 44.2%) and females with 2 vehicles (7,517, making up 55.4%).
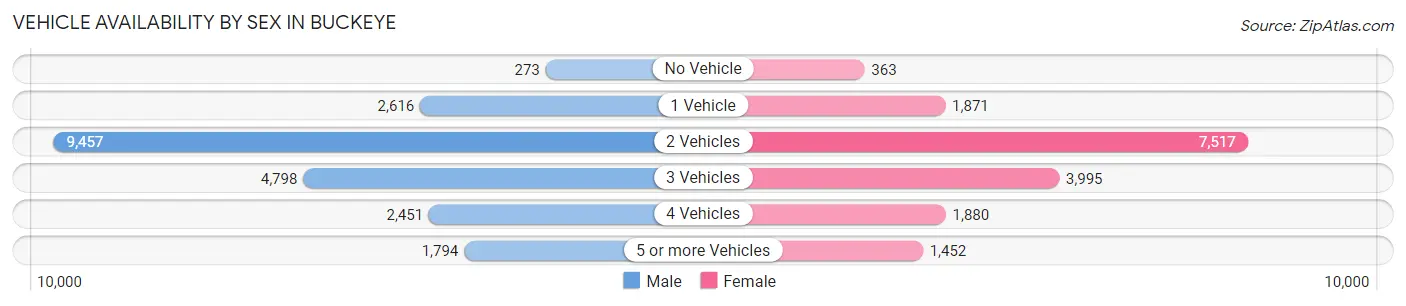
| Vehicles Available | Male | Female |
| No Vehicle | 273 (1.3%) | 363 (2.1%) |
| 1 Vehicle | 2,616 (12.2%) | 1,871 (11.0%) |
| 2 Vehicles | 9,457 (44.2%) | 7,517 (44.0%) |
| 3 Vehicles | 4,798 (22.4%) | 3,995 (23.4%) |
| 4 Vehicles | 2,451 (11.5%) | 1,880 (11.0%) |
| 5 or more Vehicles | 1,794 (8.4%) | 1,452 (8.5%) |
| Total | 21,389 (100.0%) | 17,078 (100.0%) |
Commute Time in Buckeye
The most frequently occuring commute durations in Buckeye are 45 to 59 minutes (5,083 commuters, 15.4%), 30 to 34 minutes (5,072 commuters, 15.4%), and 15 to 19 minutes (3,580 commuters, 10.8%).
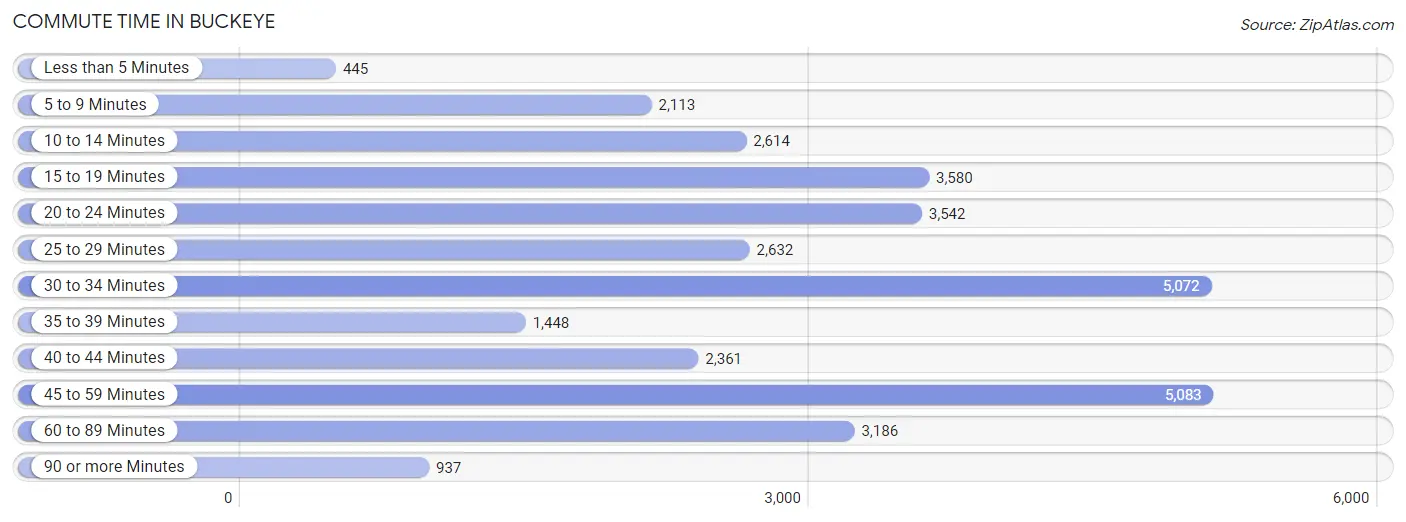
| Commute Time | # Commuters | % Commuters |
| Less than 5 Minutes | 445 | 1.3% |
| 5 to 9 Minutes | 2,113 | 6.4% |
| 10 to 14 Minutes | 2,614 | 7.9% |
| 15 to 19 Minutes | 3,580 | 10.8% |
| 20 to 24 Minutes | 3,542 | 10.7% |
| 25 to 29 Minutes | 2,632 | 8.0% |
| 30 to 34 Minutes | 5,072 | 15.4% |
| 35 to 39 Minutes | 1,448 | 4.4% |
| 40 to 44 Minutes | 2,361 | 7.1% |
| 45 to 59 Minutes | 5,083 | 15.4% |
| 60 to 89 Minutes | 3,186 | 9.7% |
| 90 or more Minutes | 937 | 2.8% |
Commute Time by Sex in Buckeye
The most common commute times in Buckeye are 30 to 34 minutes (3,020 commuters, 16.1%) for males and 45 to 59 minutes (2,148 commuters, 15.0%) for females.
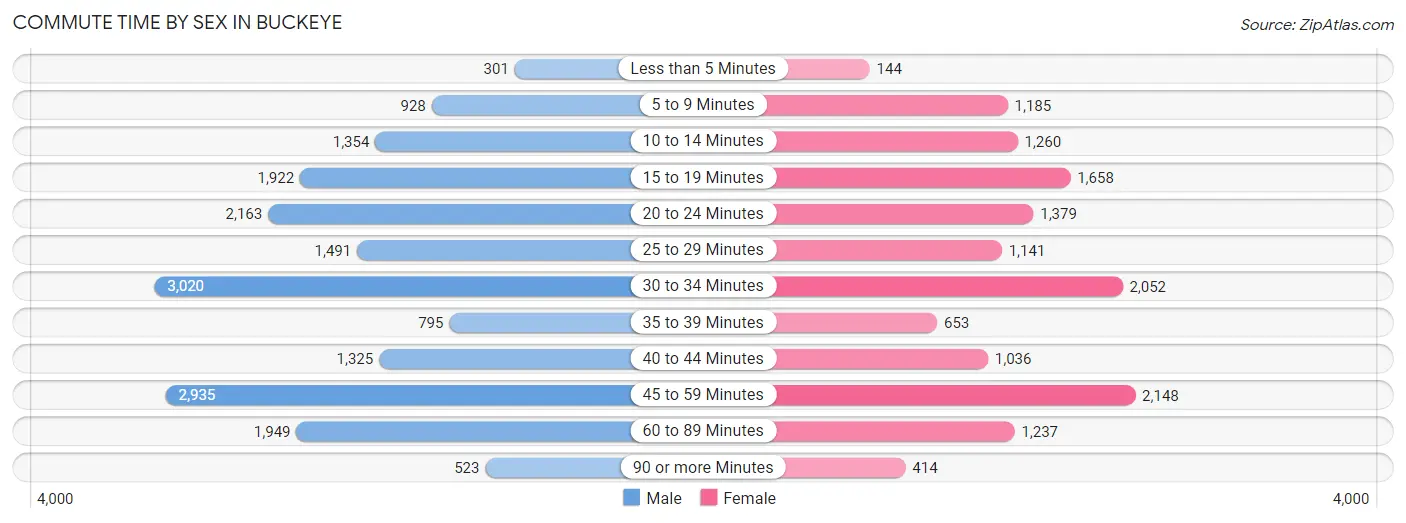
| Commute Time | Male | Female |
| Less than 5 Minutes | 301 (1.6%) | 144 (1.0%) |
| 5 to 9 Minutes | 928 (5.0%) | 1,185 (8.3%) |
| 10 to 14 Minutes | 1,354 (7.2%) | 1,260 (8.8%) |
| 15 to 19 Minutes | 1,922 (10.3%) | 1,658 (11.6%) |
| 20 to 24 Minutes | 2,163 (11.6%) | 1,379 (9.6%) |
| 25 to 29 Minutes | 1,491 (8.0%) | 1,141 (8.0%) |
| 30 to 34 Minutes | 3,020 (16.1%) | 2,052 (14.3%) |
| 35 to 39 Minutes | 795 (4.3%) | 653 (4.6%) |
| 40 to 44 Minutes | 1,325 (7.1%) | 1,036 (7.2%) |
| 45 to 59 Minutes | 2,935 (15.7%) | 2,148 (15.0%) |
| 60 to 89 Minutes | 1,949 (10.4%) | 1,237 (8.6%) |
| 90 or more Minutes | 523 (2.8%) | 414 (2.9%) |
Time of Departure to Work by Sex in Buckeye
The most frequent times of departure to work in Buckeye are 12:00 AM to 4:59 AM (3,663, 19.6%) for males and 6:00 AM to 6:29 AM (1,744, 12.2%) for females.
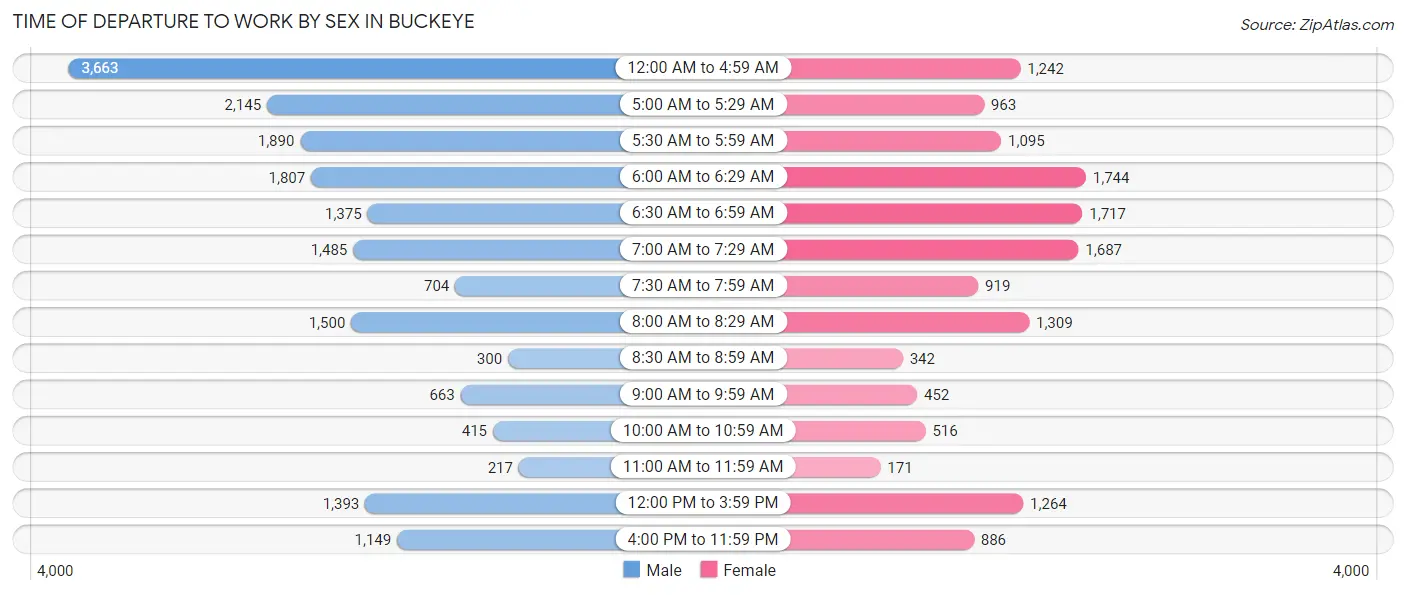
| Time of Departure | Male | Female |
| 12:00 AM to 4:59 AM | 3,663 (19.6%) | 1,242 (8.7%) |
| 5:00 AM to 5:29 AM | 2,145 (11.5%) | 963 (6.7%) |
| 5:30 AM to 5:59 AM | 1,890 (10.1%) | 1,095 (7.6%) |
| 6:00 AM to 6:29 AM | 1,807 (9.7%) | 1,744 (12.2%) |
| 6:30 AM to 6:59 AM | 1,375 (7.3%) | 1,717 (12.0%) |
| 7:00 AM to 7:29 AM | 1,485 (7.9%) | 1,687 (11.8%) |
| 7:30 AM to 7:59 AM | 704 (3.8%) | 919 (6.4%) |
| 8:00 AM to 8:29 AM | 1,500 (8.0%) | 1,309 (9.1%) |
| 8:30 AM to 8:59 AM | 300 (1.6%) | 342 (2.4%) |
| 9:00 AM to 9:59 AM | 663 (3.5%) | 452 (3.2%) |
| 10:00 AM to 10:59 AM | 415 (2.2%) | 516 (3.6%) |
| 11:00 AM to 11:59 AM | 217 (1.2%) | 171 (1.2%) |
| 12:00 PM to 3:59 PM | 1,393 (7.4%) | 1,264 (8.8%) |
| 4:00 PM to 11:59 PM | 1,149 (6.1%) | 886 (6.2%) |
| Total | 18,706 (100.0%) | 14,307 (100.0%) |
Housing Occupancy in Buckeye
Occupancy by Ownership in Buckeye
Of the total 28,105 dwellings in Buckeye, owner-occupied units account for 23,964 (85.3%), while renter-occupied units make up 4,141 (14.7%).
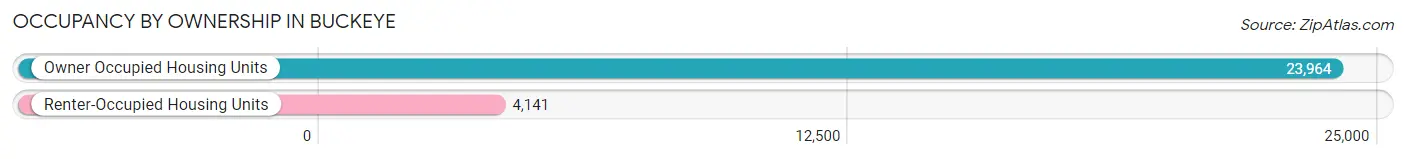
| Occupancy | # Housing Units | % Housing Units |
| Owner Occupied Housing Units | 23,964 | 85.3% |
| Renter-Occupied Housing Units | 4,141 | 14.7% |
| Total Occupied Housing Units | 28,105 | 100.0% |
Occupancy by Household Size in Buckeye
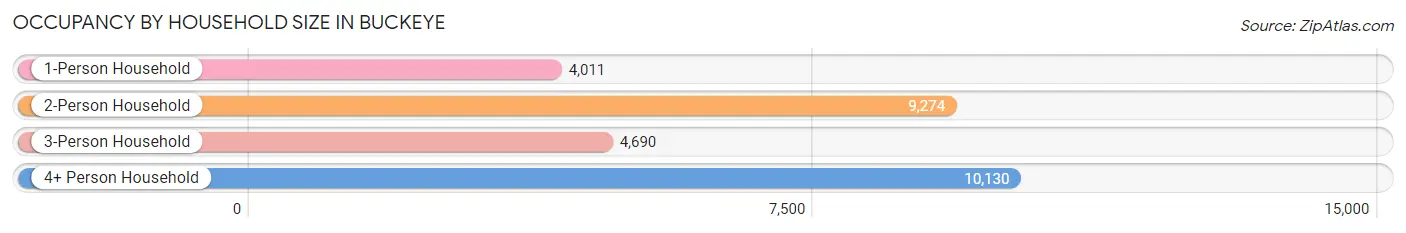
| Household Size | # Housing Units | % Housing Units |
| 1-Person Household | 4,011 | 14.3% |
| 2-Person Household | 9,274 | 33.0% |
| 3-Person Household | 4,690 | 16.7% |
| 4+ Person Household | 10,130 | 36.0% |
| Total Housing Units | 28,105 | 100.0% |
Occupancy by Ownership by Household Size in Buckeye
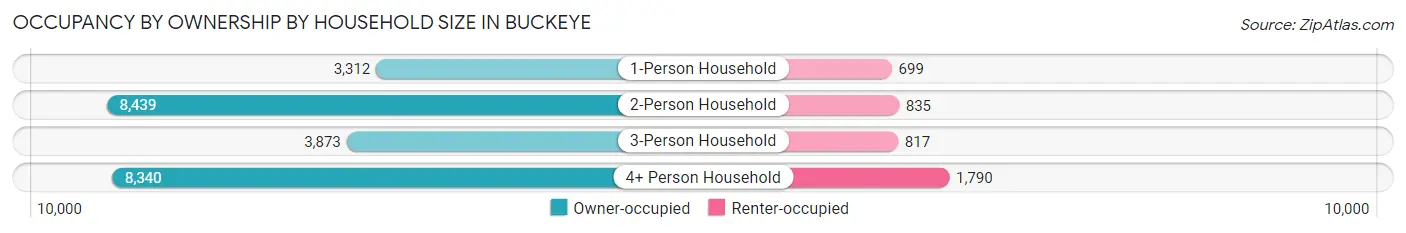
| Household Size | Owner-occupied | Renter-occupied |
| 1-Person Household | 3,312 (82.6%) | 699 (17.4%) |
| 2-Person Household | 8,439 (91.0%) | 835 (9.0%) |
| 3-Person Household | 3,873 (82.6%) | 817 (17.4%) |
| 4+ Person Household | 8,340 (82.3%) | 1,790 (17.7%) |
| Total Housing Units | 23,964 (85.3%) | 4,141 (14.7%) |
Occupancy by Educational Attainment in Buckeye
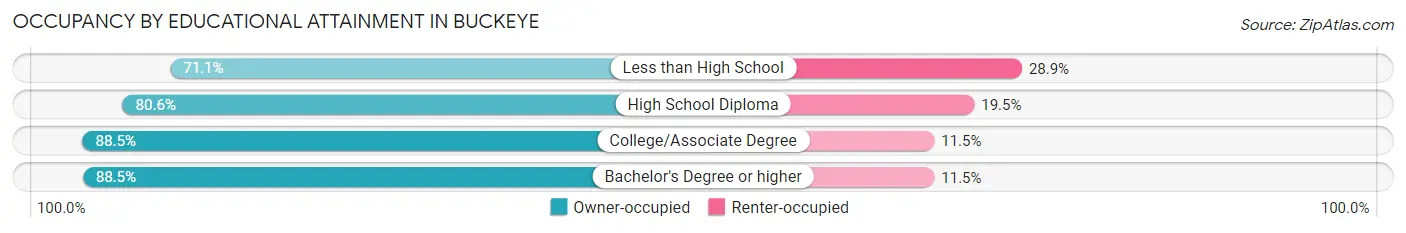
| Household Size | Owner-occupied | Renter-occupied |
| Less than High School | 1,678 (71.1%) | 682 (28.9%) |
| High School Diploma | 4,986 (80.5%) | 1,204 (19.5%) |
| College/Associate Degree | 9,791 (88.5%) | 1,275 (11.5%) |
| Bachelor's Degree or higher | 7,509 (88.5%) | 980 (11.5%) |
Occupancy by Age of Householder in Buckeye
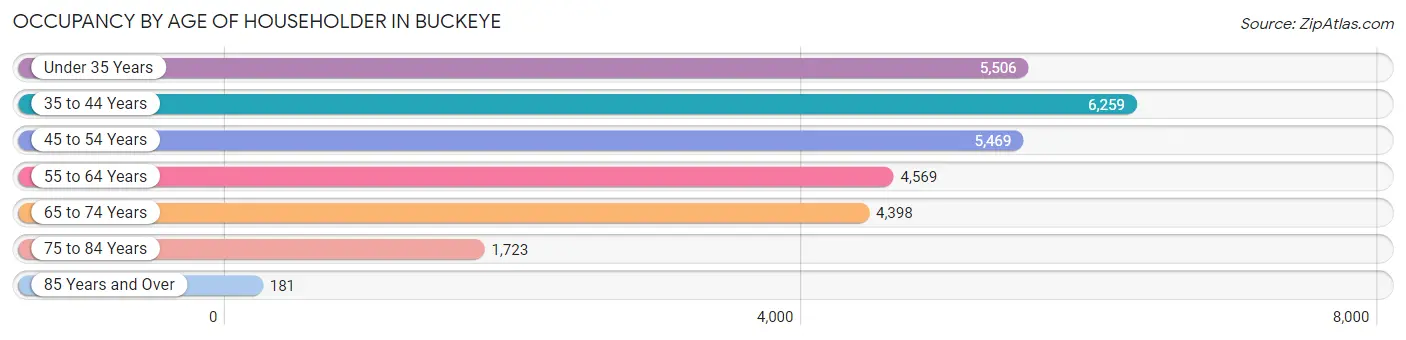
| Age Bracket | # Households | % Households |
| Under 35 Years | 5,506 | 19.6% |
| 35 to 44 Years | 6,259 | 22.3% |
| 45 to 54 Years | 5,469 | 19.5% |
| 55 to 64 Years | 4,569 | 16.3% |
| 65 to 74 Years | 4,398 | 15.7% |
| 75 to 84 Years | 1,723 | 6.1% |
| 85 Years and Over | 181 | 0.6% |
| Total | 28,105 | 100.0% |
Housing Finances in Buckeye
Median Income by Occupancy in Buckeye
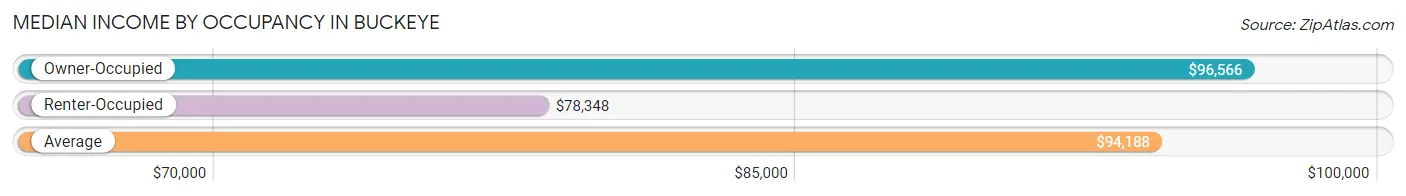
| Occupancy Type | # Households | Median Income |
| Owner-Occupied | 23,964 (85.3%) | $96,566 |
| Renter-Occupied | 4,141 (14.7%) | $78,348 |
| Average | 28,105 (100.0%) | $94,188 |
Occupancy by Householder Income Bracket in Buckeye
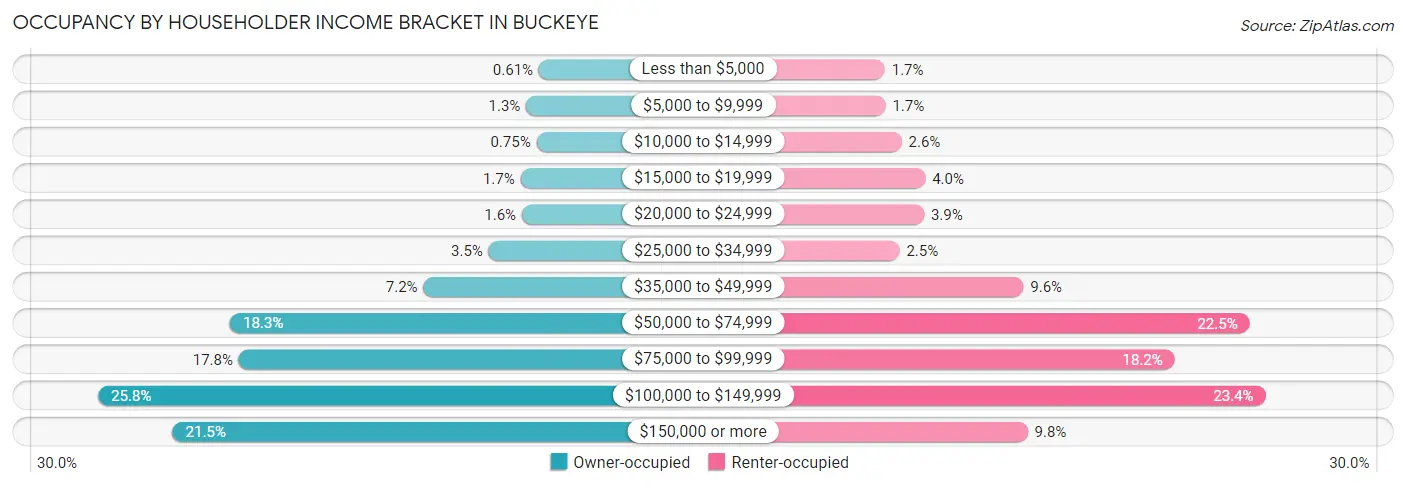
| Income Bracket | Owner-occupied | Renter-occupied |
| Less than $5,000 | 147 (0.6%) | 69 (1.7%) |
| $5,000 to $9,999 | 322 (1.3%) | 71 (1.7%) |
| $10,000 to $14,999 | 180 (0.7%) | 109 (2.6%) |
| $15,000 to $19,999 | 399 (1.7%) | 165 (4.0%) |
| $20,000 to $24,999 | 379 (1.6%) | 162 (3.9%) |
| $25,000 to $34,999 | 833 (3.5%) | 104 (2.5%) |
| $35,000 to $49,999 | 1,727 (7.2%) | 397 (9.6%) |
| $50,000 to $74,999 | 4,377 (18.3%) | 932 (22.5%) |
| $75,000 to $99,999 | 4,256 (17.8%) | 755 (18.2%) |
| $100,000 to $149,999 | 6,183 (25.8%) | 970 (23.4%) |
| $150,000 or more | 5,161 (21.5%) | 407 (9.8%) |
| Total | 23,964 (100.0%) | 4,141 (100.0%) |
Monthly Housing Cost Tiers in Buckeye
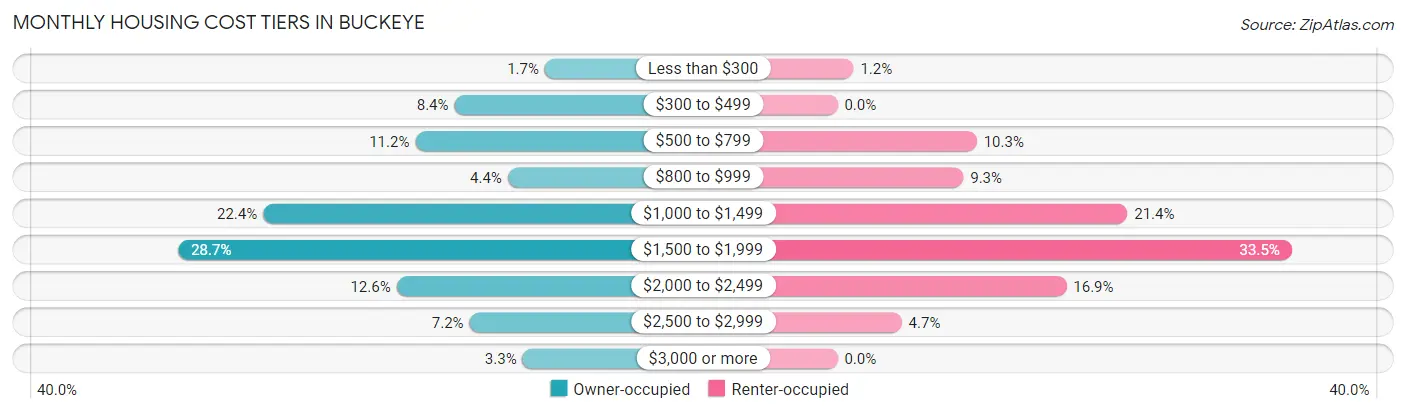
| Monthly Cost | Owner-occupied | Renter-occupied |
| Less than $300 | 405 (1.7%) | 49 (1.2%) |
| $300 to $499 | 2,002 (8.4%) | 0 (0.0%) |
| $500 to $799 | 2,690 (11.2%) | 425 (10.3%) |
| $800 to $999 | 1,059 (4.4%) | 384 (9.3%) |
| $1,000 to $1,499 | 5,377 (22.4%) | 884 (21.3%) |
| $1,500 to $1,999 | 6,878 (28.7%) | 1,385 (33.5%) |
| $2,000 to $2,499 | 3,021 (12.6%) | 698 (16.9%) |
| $2,500 to $2,999 | 1,735 (7.2%) | 196 (4.7%) |
| $3,000 or more | 797 (3.3%) | 0 (0.0%) |
| Total | 23,964 (100.0%) | 4,141 (100.0%) |
Physical Housing Characteristics in Buckeye
Housing Structures in Buckeye
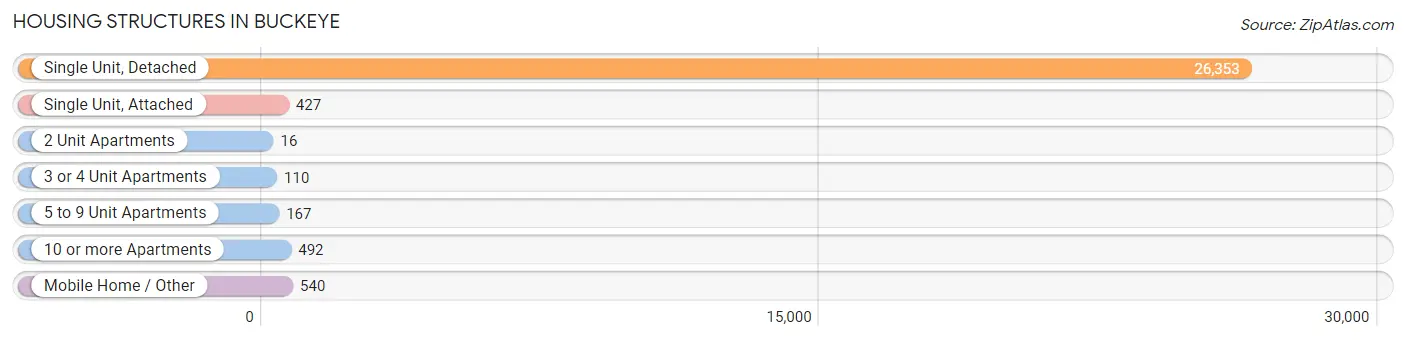
| Structure Type | # Housing Units | % Housing Units |
| Single Unit, Detached | 26,353 | 93.8% |
| Single Unit, Attached | 427 | 1.5% |
| 2 Unit Apartments | 16 | 0.1% |
| 3 or 4 Unit Apartments | 110 | 0.4% |
| 5 to 9 Unit Apartments | 167 | 0.6% |
| 10 or more Apartments | 492 | 1.8% |
| Mobile Home / Other | 540 | 1.9% |
| Total | 28,105 | 100.0% |
Housing Structures by Occupancy in Buckeye
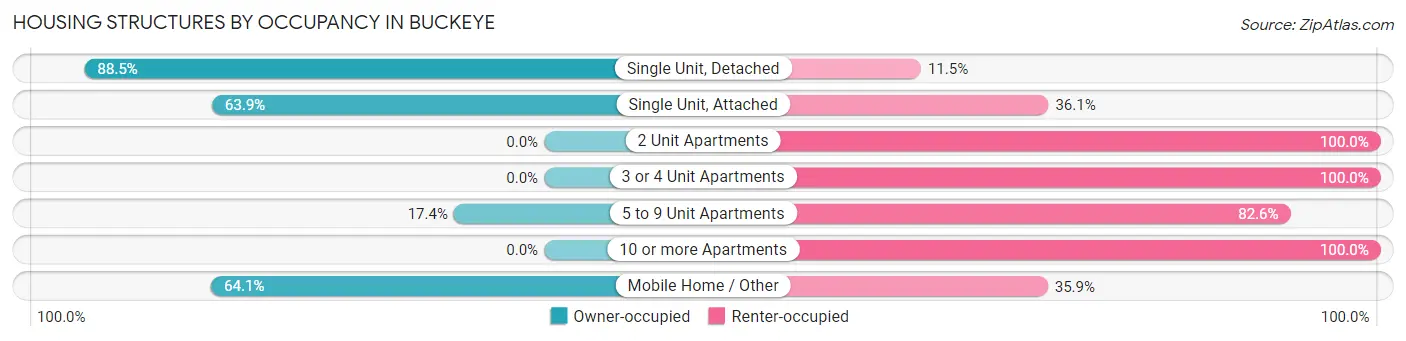
| Structure Type | Owner-occupied | Renter-occupied |
| Single Unit, Detached | 23,316 (88.5%) | 3,037 (11.5%) |
| Single Unit, Attached | 273 (63.9%) | 154 (36.1%) |
| 2 Unit Apartments | 0 (0.0%) | 16 (100.0%) |
| 3 or 4 Unit Apartments | 0 (0.0%) | 110 (100.0%) |
| 5 to 9 Unit Apartments | 29 (17.4%) | 138 (82.6%) |
| 10 or more Apartments | 0 (0.0%) | 492 (100.0%) |
| Mobile Home / Other | 346 (64.1%) | 194 (35.9%) |
| Total | 23,964 (85.3%) | 4,141 (14.7%) |
Housing Structures by Number of Rooms in Buckeye
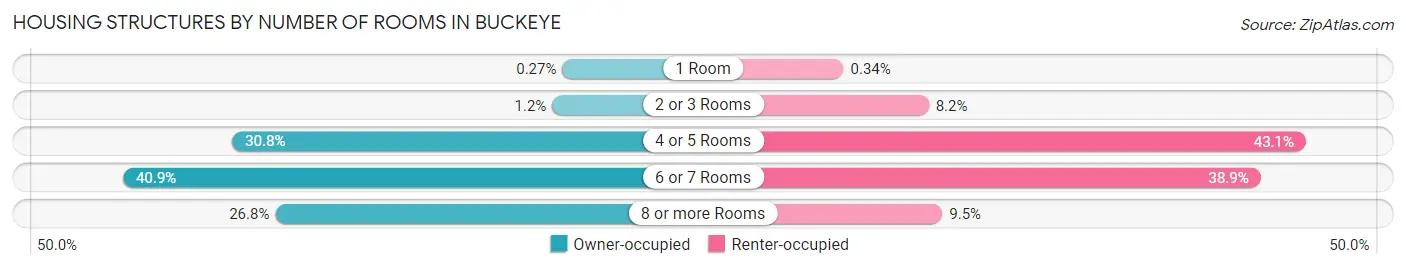
| Number of Rooms | Owner-occupied | Renter-occupied |
| 1 Room | 65 (0.3%) | 14 (0.3%) |
| 2 or 3 Rooms | 290 (1.2%) | 340 (8.2%) |
| 4 or 5 Rooms | 7,381 (30.8%) | 1,784 (43.1%) |
| 6 or 7 Rooms | 9,801 (40.9%) | 1,611 (38.9%) |
| 8 or more Rooms | 6,427 (26.8%) | 392 (9.5%) |
| Total | 23,964 (100.0%) | 4,141 (100.0%) |
Housing Structure by Heating Type in Buckeye
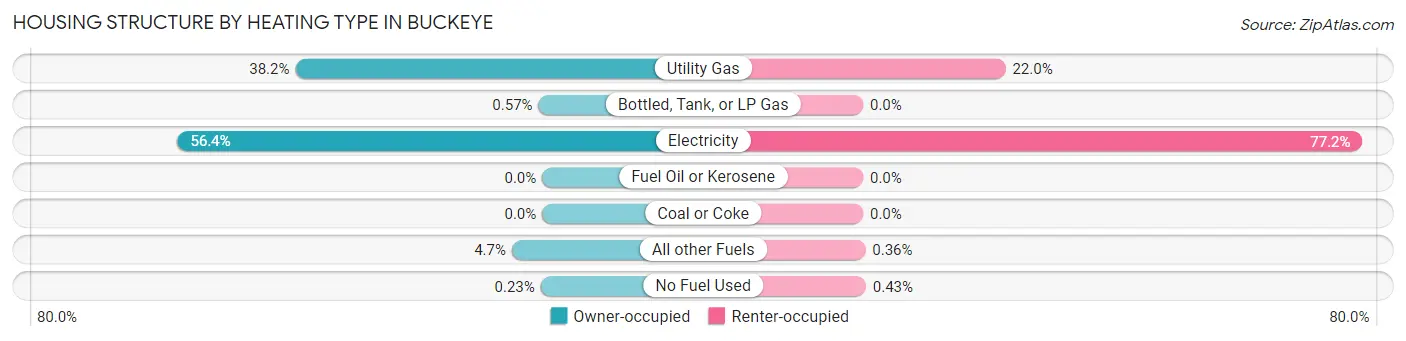
| Heating Type | Owner-occupied | Renter-occupied |
| Utility Gas | 9,143 (38.2%) | 912 (22.0%) |
| Bottled, Tank, or LP Gas | 136 (0.6%) | 0 (0.0%) |
| Electricity | 13,510 (56.4%) | 3,196 (77.2%) |
| Fuel Oil or Kerosene | 0 (0.0%) | 0 (0.0%) |
| Coal or Coke | 0 (0.0%) | 0 (0.0%) |
| All other Fuels | 1,121 (4.7%) | 15 (0.4%) |
| No Fuel Used | 54 (0.2%) | 18 (0.4%) |
| Total | 23,964 (100.0%) | 4,141 (100.0%) |
Household Vehicle Usage in Buckeye
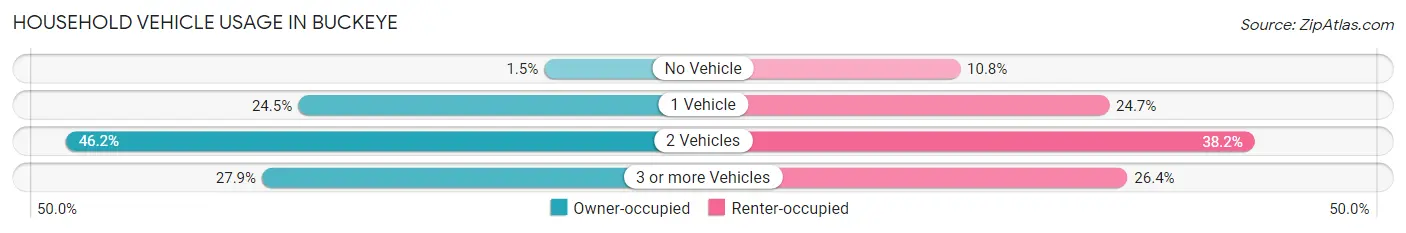
| Vehicles per Household | Owner-occupied | Renter-occupied |
| No Vehicle | 362 (1.5%) | 445 (10.7%) |
| 1 Vehicle | 5,867 (24.5%) | 1,021 (24.7%) |
| 2 Vehicles | 11,062 (46.2%) | 1,583 (38.2%) |
| 3 or more Vehicles | 6,673 (27.9%) | 1,092 (26.4%) |
| Total | 23,964 (100.0%) | 4,141 (100.0%) |
Real Estate & Mortgages in Buckeye
Real Estate and Mortgage Overview in Buckeye
| Characteristic | Without Mortgage | With Mortgage |
| Housing Units | 5,356 | 18,608 |
| Median Property Value | $330,100 | $343,900 |
| Median Household Income | $72,381 | $4,254 |
| Monthly Housing Costs | $533 | $786 |
| Real Estate Taxes | $2,389 | $813 |
Property Value by Mortgage Status in Buckeye
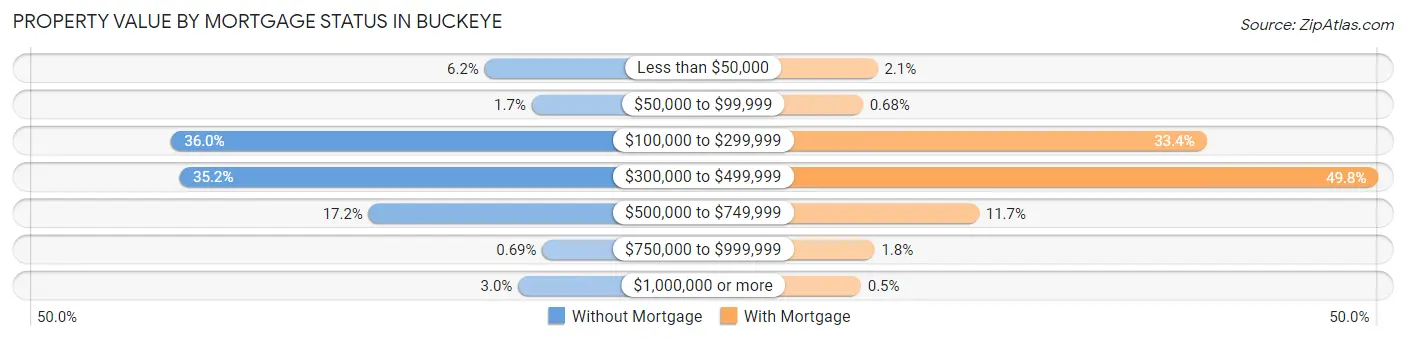
| Property Value | Without Mortgage | With Mortgage |
| Less than $50,000 | 331 (6.2%) | 388 (2.1%) |
| $50,000 to $99,999 | 91 (1.7%) | 127 (0.7%) |
| $100,000 to $299,999 | 1,929 (36.0%) | 6,218 (33.4%) |
| $300,000 to $499,999 | 1,885 (35.2%) | 9,263 (49.8%) |
| $500,000 to $749,999 | 923 (17.2%) | 2,184 (11.7%) |
| $750,000 to $999,999 | 37 (0.7%) | 335 (1.8%) |
| $1,000,000 or more | 160 (3.0%) | 93 (0.5%) |
| Total | 5,356 (100.0%) | 18,608 (100.0%) |
Household Income by Mortgage Status in Buckeye
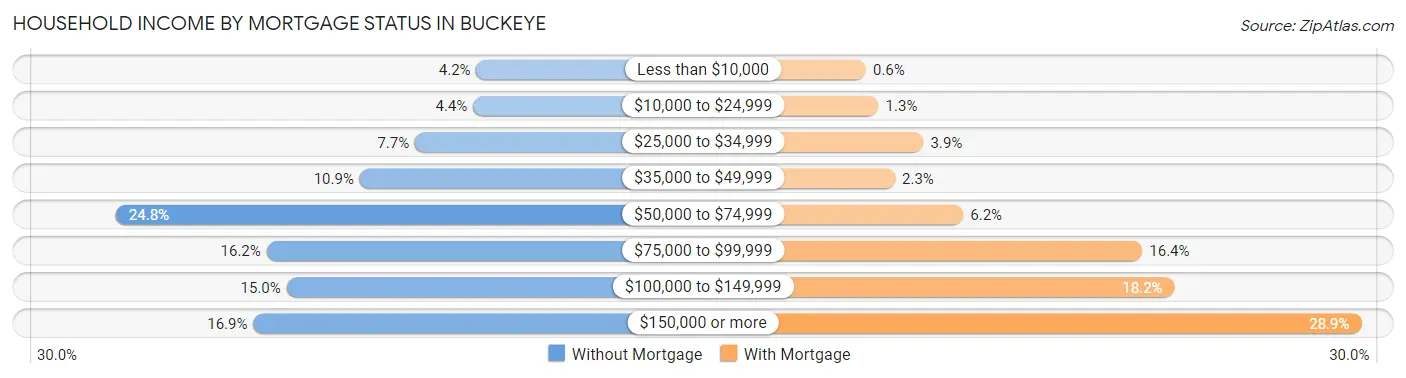
| Household Income | Without Mortgage | With Mortgage |
| Less than $10,000 | 224 (4.2%) | 111 (0.6%) |
| $10,000 to $24,999 | 234 (4.4%) | 245 (1.3%) |
| $25,000 to $34,999 | 412 (7.7%) | 724 (3.9%) |
| $35,000 to $49,999 | 581 (10.8%) | 421 (2.3%) |
| $50,000 to $74,999 | 1,327 (24.8%) | 1,146 (6.2%) |
| $75,000 to $99,999 | 866 (16.2%) | 3,050 (16.4%) |
| $100,000 to $149,999 | 805 (15.0%) | 3,390 (18.2%) |
| $150,000 or more | 907 (16.9%) | 5,378 (28.9%) |
| Total | 5,356 (100.0%) | 18,608 (100.0%) |
Property Value to Household Income Ratio in Buckeye
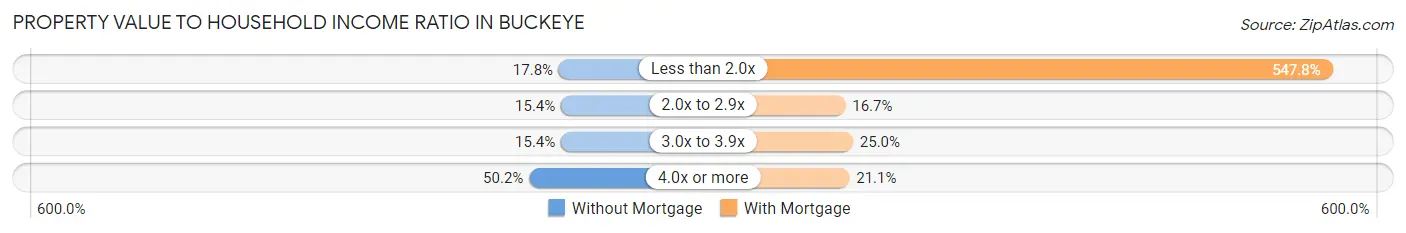
| Value-to-Income Ratio | Without Mortgage | With Mortgage |
| Less than 2.0x | 953 (17.8%) | 101,925 (547.8%) |
| 2.0x to 2.9x | 822 (15.3%) | 3,110 (16.7%) |
| 3.0x to 3.9x | 824 (15.4%) | 4,656 (25.0%) |
| 4.0x or more | 2,689 (50.2%) | 3,927 (21.1%) |
| Total | 5,356 (100.0%) | 18,608 (100.0%) |
Real Estate Taxes by Mortgage Status in Buckeye
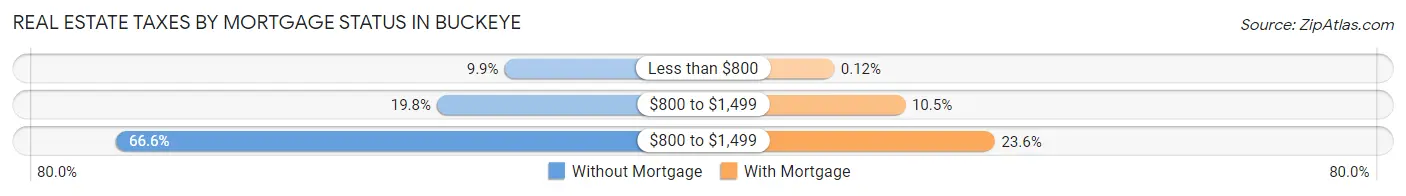
| Property Taxes | Without Mortgage | With Mortgage |
| Less than $800 | 530 (9.9%) | 22 (0.1%) |
| $800 to $1,499 | 1,059 (19.8%) | 1,955 (10.5%) |
| $800 to $1,499 | 3,568 (66.6%) | 4,390 (23.6%) |
| Total | 5,356 (100.0%) | 18,608 (100.0%) |
Health & Disability in Buckeye
Health Insurance Coverage by Age in Buckeye
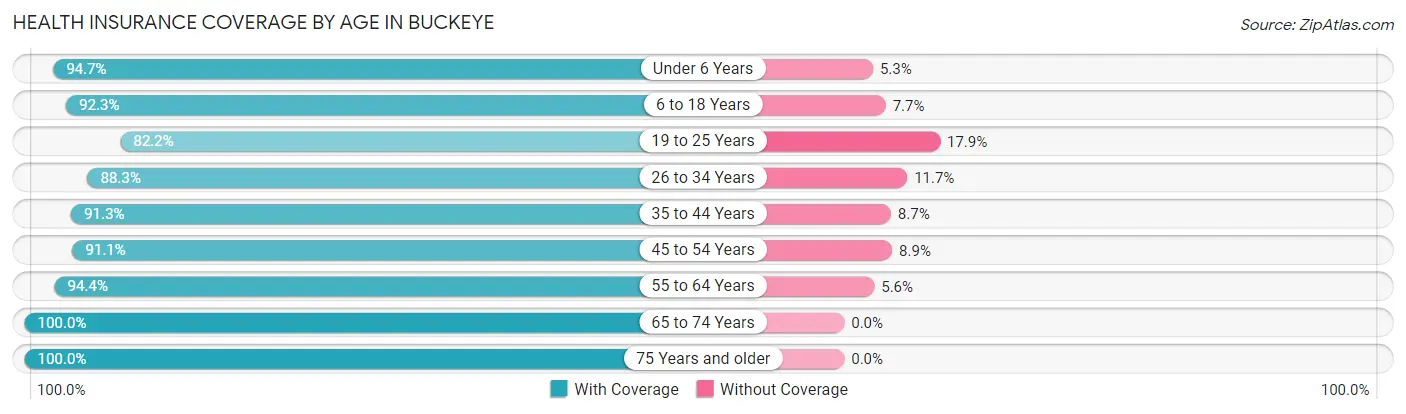
| Age Bracket | With Coverage | Without Coverage |
| Under 6 Years | 8,203 (94.7%) | 463 (5.3%) |
| 6 to 18 Years | 17,832 (92.3%) | 1,493 (7.7%) |
| 19 to 25 Years | 4,735 (82.2%) | 1,029 (17.8%) |
| 26 to 34 Years | 10,192 (88.3%) | 1,355 (11.7%) |
| 35 to 44 Years | 11,398 (91.3%) | 1,085 (8.7%) |
| 45 to 54 Years | 8,827 (91.1%) | 865 (8.9%) |
| 55 to 64 Years | 8,206 (94.4%) | 486 (5.6%) |
| 65 to 74 Years | 8,667 (100.0%) | 0 (0.0%) |
| 75 Years and older | 3,482 (100.0%) | 0 (0.0%) |
| Total | 81,542 (92.3%) | 6,776 (7.7%) |
Health Insurance Coverage by Citizenship Status in Buckeye
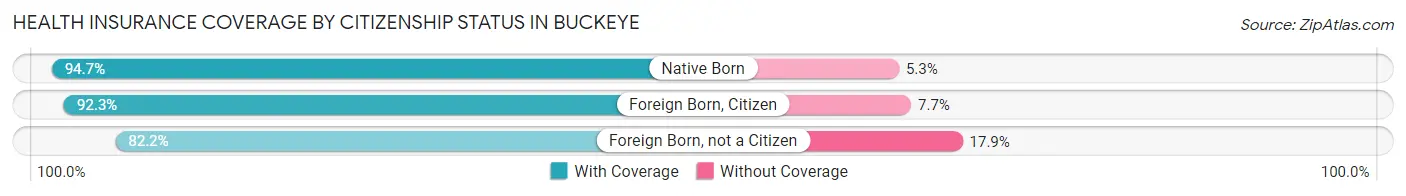
| Citizenship Status | With Coverage | Without Coverage |
| Native Born | 8,203 (94.7%) | 463 (5.3%) |
| Foreign Born, Citizen | 17,832 (92.3%) | 1,493 (7.7%) |
| Foreign Born, not a Citizen | 4,735 (82.2%) | 1,029 (17.8%) |
Health Insurance Coverage by Household Income in Buckeye
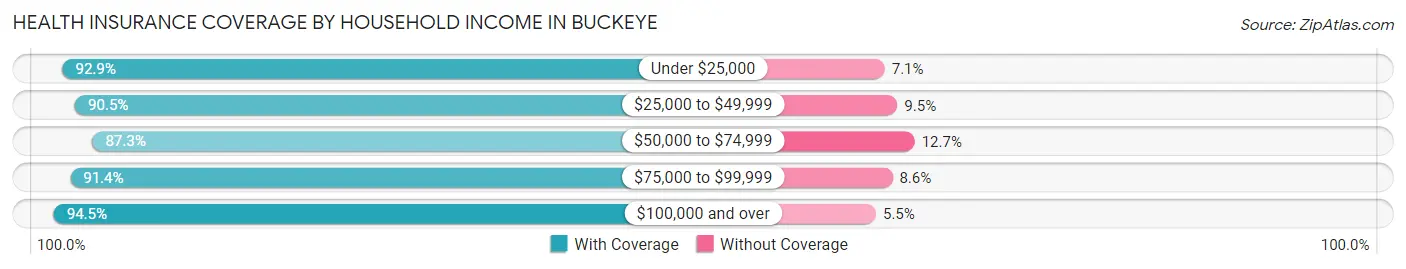
| Household Income | With Coverage | Without Coverage |
| Under $25,000 | 4,851 (92.9%) | 372 (7.1%) |
| $25,000 to $49,999 | 6,825 (90.5%) | 715 (9.5%) |
| $50,000 to $74,999 | 12,689 (87.3%) | 1,851 (12.7%) |
| $75,000 to $99,999 | 14,556 (91.4%) | 1,363 (8.6%) |
| $100,000 and over | 42,608 (94.5%) | 2,471 (5.5%) |
Public vs Private Health Insurance Coverage by Age in Buckeye
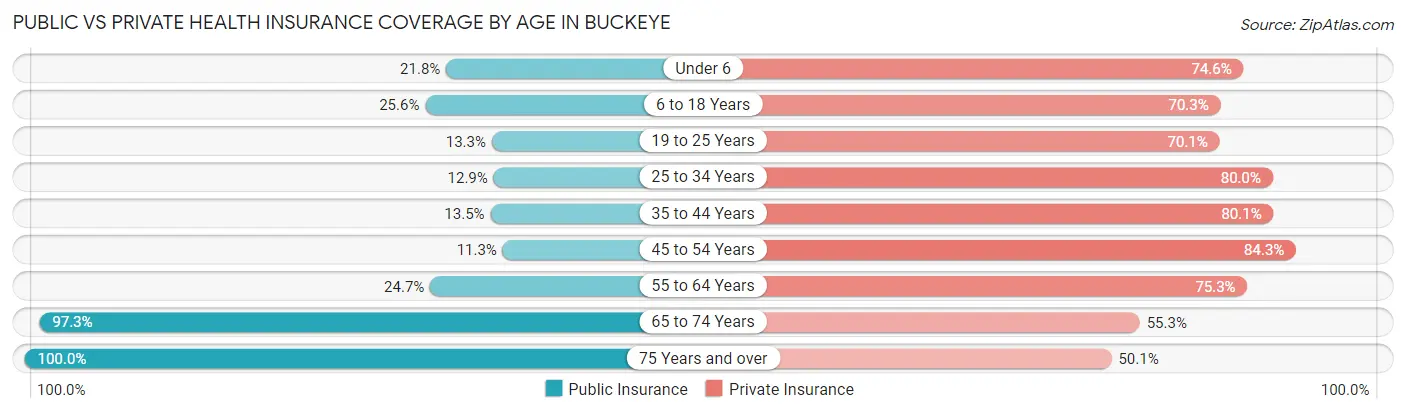
| Age Bracket | Public Insurance | Private Insurance |
| Under 6 | 1,885 (21.7%) | 6,461 (74.6%) |
| 6 to 18 Years | 4,955 (25.6%) | 13,584 (70.3%) |
| 19 to 25 Years | 766 (13.3%) | 4,042 (70.1%) |
| 25 to 34 Years | 1,494 (12.9%) | 9,237 (80.0%) |
| 35 to 44 Years | 1,690 (13.5%) | 10,001 (80.1%) |
| 45 to 54 Years | 1,091 (11.3%) | 8,173 (84.3%) |
| 55 to 64 Years | 2,149 (24.7%) | 6,544 (75.3%) |
| 65 to 74 Years | 8,429 (97.3%) | 4,793 (55.3%) |
| 75 Years and over | 3,482 (100.0%) | 1,743 (50.1%) |
| Total | 25,941 (29.4%) | 64,578 (73.1%) |
Disability Status by Sex by Age in Buckeye
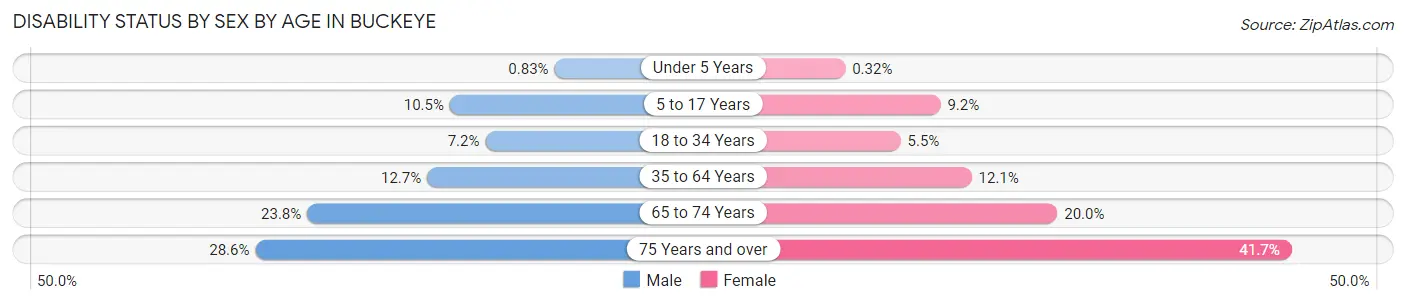
| Age Bracket | Male | Female |
| Under 5 Years | 31 (0.8%) | 12 (0.3%) |
| 5 to 17 Years | 1,062 (10.5%) | 868 (9.2%) |
| 18 to 34 Years | 643 (7.2%) | 511 (5.5%) |
| 35 to 64 Years | 1,912 (12.7%) | 1,899 (12.0%) |
| 65 to 74 Years | 1,002 (23.8%) | 891 (20.0%) |
| 75 Years and over | 442 (28.6%) | 808 (41.7%) |
Disability Class by Sex by Age in Buckeye
Disability Class: Hearing Difficulty
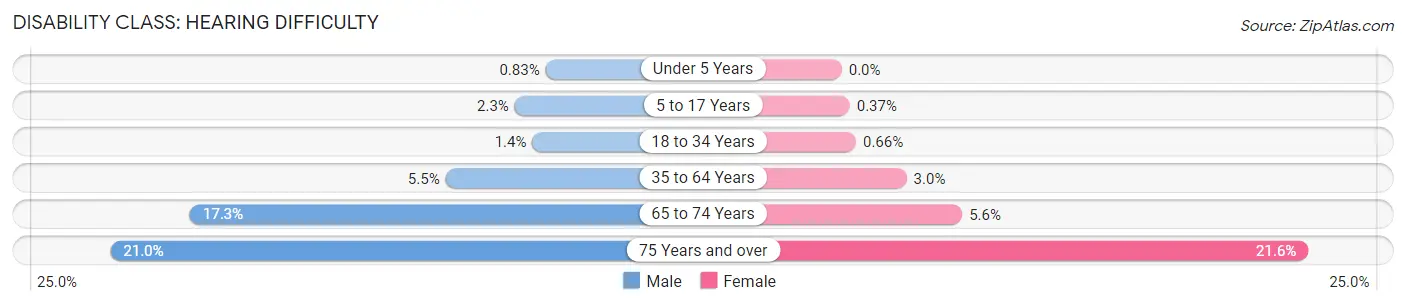
| Age Bracket | Male | Female |
| Under 5 Years | 31 (0.8%) | 0 (0.0%) |
| 5 to 17 Years | 228 (2.3%) | 35 (0.4%) |
| 18 to 34 Years | 128 (1.4%) | 62 (0.7%) |
| 35 to 64 Years | 826 (5.5%) | 474 (3.0%) |
| 65 to 74 Years | 730 (17.3%) | 249 (5.6%) |
| 75 Years and over | 325 (21.0%) | 419 (21.6%) |
Disability Class: Vision Difficulty
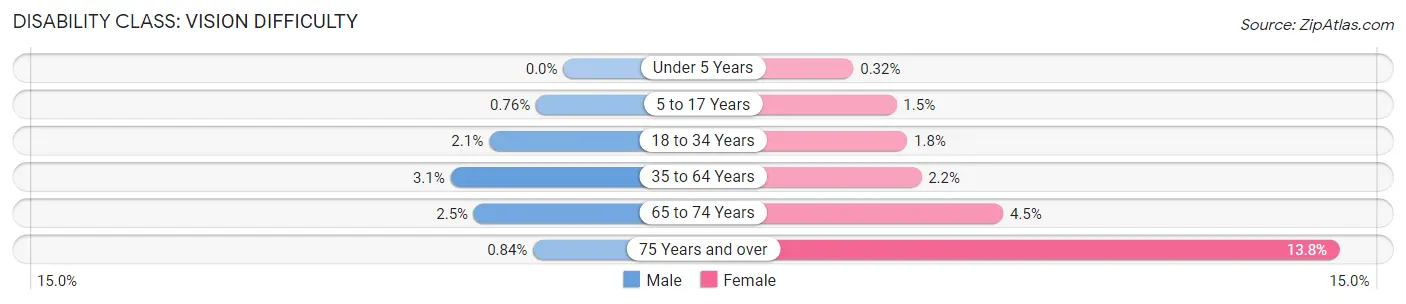
| Age Bracket | Male | Female |
| Under 5 Years | 0 (0.0%) | 12 (0.3%) |
| 5 to 17 Years | 77 (0.8%) | 144 (1.5%) |
| 18 to 34 Years | 184 (2.1%) | 170 (1.8%) |
| 35 to 64 Years | 475 (3.1%) | 348 (2.2%) |
| 65 to 74 Years | 105 (2.5%) | 200 (4.5%) |
| 75 Years and over | 13 (0.8%) | 268 (13.8%) |
Disability Class: Cognitive Difficulty
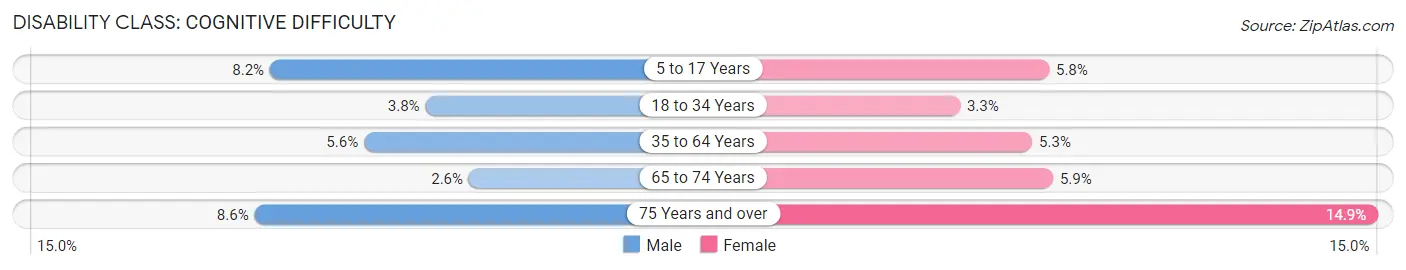
| Age Bracket | Male | Female |
| 5 to 17 Years | 823 (8.2%) | 547 (5.8%) |
| 18 to 34 Years | 341 (3.8%) | 308 (3.3%) |
| 35 to 64 Years | 839 (5.6%) | 835 (5.3%) |
| 65 to 74 Years | 111 (2.6%) | 262 (5.9%) |
| 75 Years and over | 133 (8.6%) | 289 (14.9%) |
Disability Class: Ambulatory Difficulty
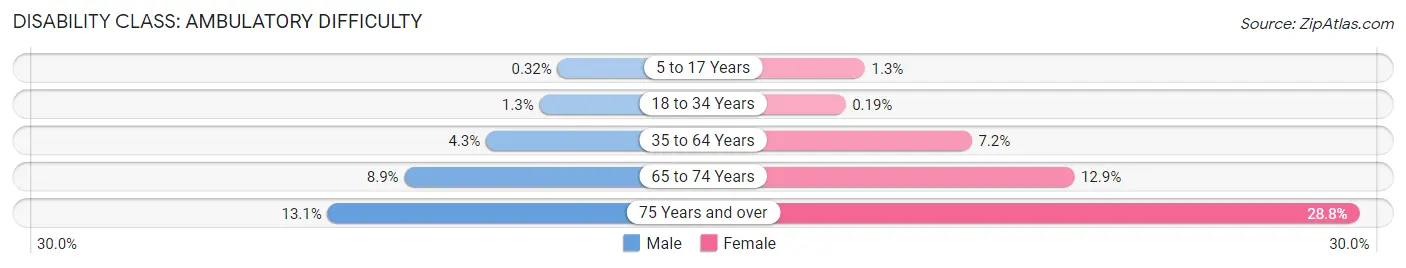
| Age Bracket | Male | Female |
| 5 to 17 Years | 32 (0.3%) | 120 (1.3%) |
| 18 to 34 Years | 118 (1.3%) | 18 (0.2%) |
| 35 to 64 Years | 650 (4.3%) | 1,138 (7.2%) |
| 65 to 74 Years | 373 (8.8%) | 576 (12.9%) |
| 75 Years and over | 203 (13.1%) | 558 (28.8%) |
Disability Class: Self-Care Difficulty
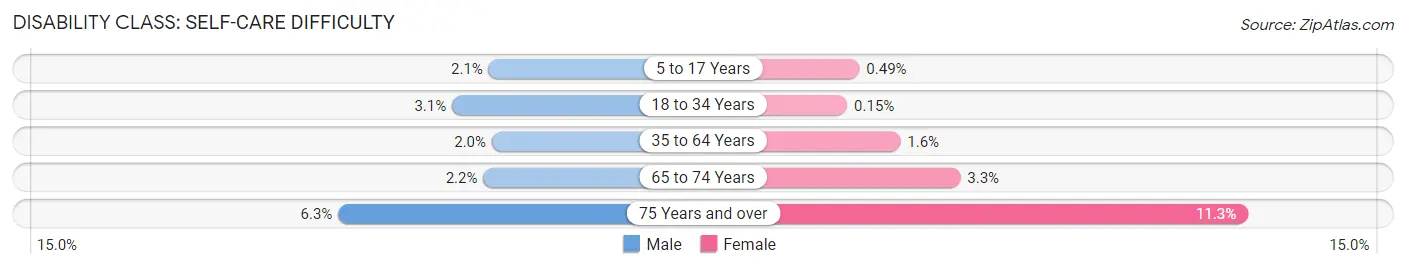
| Age Bracket | Male | Female |
| 5 to 17 Years | 210 (2.1%) | 46 (0.5%) |
| 18 to 34 Years | 275 (3.1%) | 14 (0.2%) |
| 35 to 64 Years | 300 (2.0%) | 257 (1.6%) |
| 65 to 74 Years | 94 (2.2%) | 147 (3.3%) |
| 75 Years and over | 97 (6.3%) | 219 (11.3%) |
Technology Access in Buckeye
Computing Device Access in Buckeye
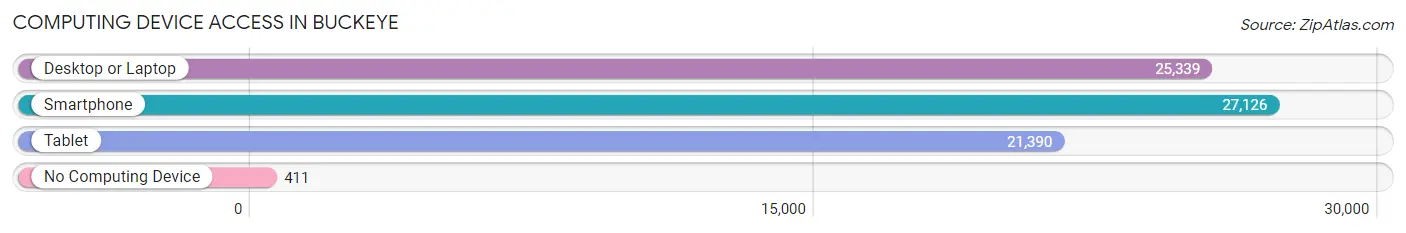
| Device Type | # Households | % Households |
| Desktop or Laptop | 25,339 | 90.2% |
| Smartphone | 27,126 | 96.5% |
| Tablet | 21,390 | 76.1% |
| No Computing Device | 411 | 1.5% |
| Total | 28,105 | 100.0% |
Internet Access in Buckeye
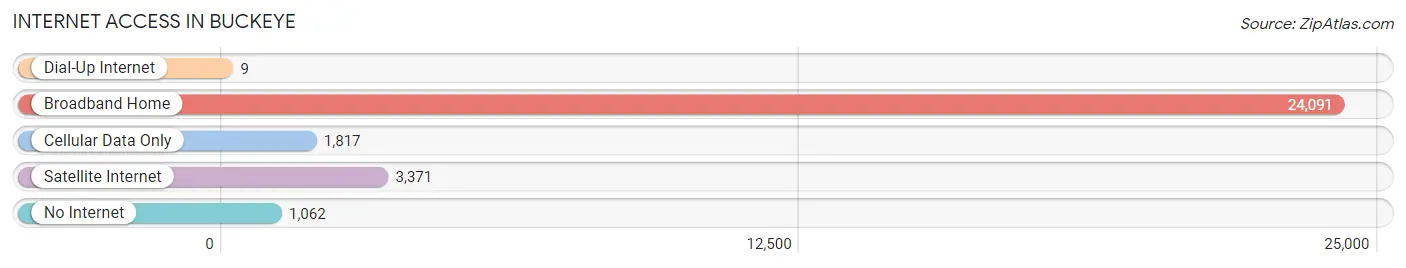
| Internet Type | # Households | % Households |
| Dial-Up Internet | 9 | 0.0% |
| Broadband Home | 24,091 | 85.7% |
| Cellular Data Only | 1,817 | 6.5% |
| Satellite Internet | 3,371 | 12.0% |
| No Internet | 1,062 | 3.8% |
| Total | 28,105 | 100.0% |
Buckeye Summary
Buckeye, Arizona is a city located in Maricopa County, Arizona, United States. It is located about 30 miles west of Phoenix and is part of the Phoenix metropolitan area. The city was incorporated in 1929 and has a population of about 68,000 people as of 2020.
Geography
Buckeye is located in the Sonoran Desert, at an elevation of 1,100 feet. The city is located in the western part of Maricopa County, and is bordered by the cities of Goodyear, Avondale, and Litchfield Park. The city covers an area of about 120 square miles, and is located in the Gila River Valley. The city is located near the confluence of the Gila and Agua Fria Rivers. The city is also located near the White Tank Mountains, which are part of the Sonoran Desert.
Climate
Buckeye has a hot desert climate, with hot summers and mild winters. The average high temperature in the summer is around 100°F, and the average low temperature in the winter is around 40°F. The city receives an average of 8.5 inches of precipitation per year, with most of it falling in the summer months.
Demographics
As of the 2020 census, the population of Buckeye was 68,000. The racial makeup of the city was 73.3% White, 4.3% African American, 0.7% Native American, 1.2% Asian, 0.2% Pacific Islander, 17.2% from other races, and 3.3% from two or more races. Hispanic or Latino of any race were 33.2% of the population.
Economy
Buckeye is home to a variety of businesses, including manufacturing, retail, and service industries. The city is home to several large employers, including Honeywell, Walmart, and Amazon. The city is also home to several smaller businesses, including restaurants, shops, and other services.
The city is also home to several educational institutions, including Buckeye Union High School, Buckeye Elementary School District, and Estrella Mountain Community College.
History
Buckeye was founded in 1888 by William John Murphy, who named the city after the Buckeye tree, which is native to the area. The city was incorporated in 1929, and the population grew steadily throughout the 20th century. In the 1950s, the city began to experience rapid growth, and by the 1970s, the population had grown to over 10,000 people.
In the 1980s, the city began to experience a population boom, and by the 2000s, the population had grown to over 50,000 people. The city has continued to experience population growth, and as of 2020, the population is over 68,000 people.
Buckeye is a rapidly growing city, and is home to a variety of businesses, educational institutions, and recreational activities. The city is also home to a variety of cultural attractions, including the Buckeye Museum of History and the Buckeye Valley Museum. The city is also home to several parks, including the Buckeye Community Park and the Buckeye Lake Park.
Common Questions
What is Per Capita Income in Buckeye?
Per Capita income in Buckeye is $32,141.
What is the Median Family Income in Buckeye?
Median Family Income in Buckeye is $96,448.
What is the Median Household income in Buckeye?
Median Household Income in Buckeye is $94,188.
What is Income or Wage Gap in Buckeye?
Income or Wage Gap in Buckeye is 32.2%.
Women in Buckeye earn 67.8 cents for every dollar earned by a man.
What is Family Income Deficit in Buckeye?
Family Income Deficit in Buckeye is $14,024.
Families that are below poverty line in Buckeye earn $14,024 less on average than the poverty threshold level.
What is Inequality or Gini Index in Buckeye?
Inequality or Gini Index in Buckeye is 0.35.
What is the Total Population of Buckeye?
Total Population of Buckeye is 95,042.
What is the Total Male Population of Buckeye?
Total Male Population of Buckeye is 50,213.
What is the Total Female Population of Buckeye?
Total Female Population of Buckeye is 44,829.
What is the Ratio of Males per 100 Females in Buckeye?
There are 112.01 Males per 100 Females in Buckeye.
What is the Ratio of Females per 100 Males in Buckeye?
There are 89.28 Females per 100 Males in Buckeye.
What is the Median Population Age in Buckeye?
Median Population Age in Buckeye is 34.7 Years.
What is the Average Family Size in Buckeye
Average Family Size in Buckeye is 3.5 People.
What is the Average Household Size in Buckeye
Average Household Size in Buckeye is 3.2 People.
How Large is the Labor Force in Buckeye?
There are 41,074 People in the Labor Forcein in Buckeye.
What is the Percentage of People in the Labor Force in Buckeye?
58.2% of People are in the Labor Force in Buckeye.
What is the Unemployment Rate in Buckeye?
Unemployment Rate in Buckeye is 5.0%.