Frisco, TX Map & Demographics
Frisco Map
Frisco Overview
$63,571
PER CAPITA INCOME
$172,003
AVG FAMILY INCOME
$144,567
AVG HOUSEHOLD INCOME
46.0%
WAGE / INCOME GAP [ % ]
54.0¢/ $1
WAGE / INCOME GAP [ $ ]
0.42
INEQUALITY / GINI INDEX
202,075
TOTAL POPULATION
99,822
MALE POPULATION
102,253
FEMALE POPULATION
97.62
MALES / 100 FEMALES
102.44
FEMALES / 100 MALES
37.8
MEDIAN AGE
3.4
AVG FAMILY SIZE
2.9
AVG HOUSEHOLD SIZE
109,332
LABOR FORCE [ PEOPLE ]
71.7%
PERCENT IN LABOR FORCE
3.9%
UNEMPLOYMENT RATE
Income in Frisco
Income Overview in Frisco
Per Capita Income in Frisco is $63,571, while median incomes of families and households are $172,003 and $144,567 respectively.
| Characteristic | Number | Measure |
| Per Capita Income | 202,075 | $63,571 |
| Median Family Income | 52,874 | $172,003 |
| Mean Family Income | 52,874 | $208,867 |
| Median Household Income | 70,502 | $144,567 |
| Mean Household Income | 70,502 | $180,808 |
| Income Deficit | 52,874 | $0 |
| Wage / Income Gap (%) | 202,075 | 45.99% |
| Wage / Income Gap ($) | 202,075 | 54.01¢ per $1 |
| Gini / Inequality Index | 202,075 | 0.42 |
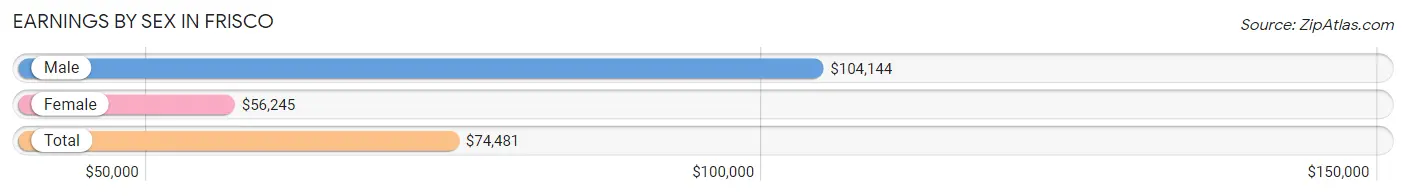
Earnings by Sex in Frisco
Average Earnings in Frisco are $74,481, $104,144 for men and $56,245 for women, a difference of 46.0%.
| Sex | Number | Average Earnings |
| Male | 61,117 (54.2%) | $104,144 |
| Female | 51,605 (45.8%) | $56,245 |
| Total | 112,722 (100.0%) | $74,481 |
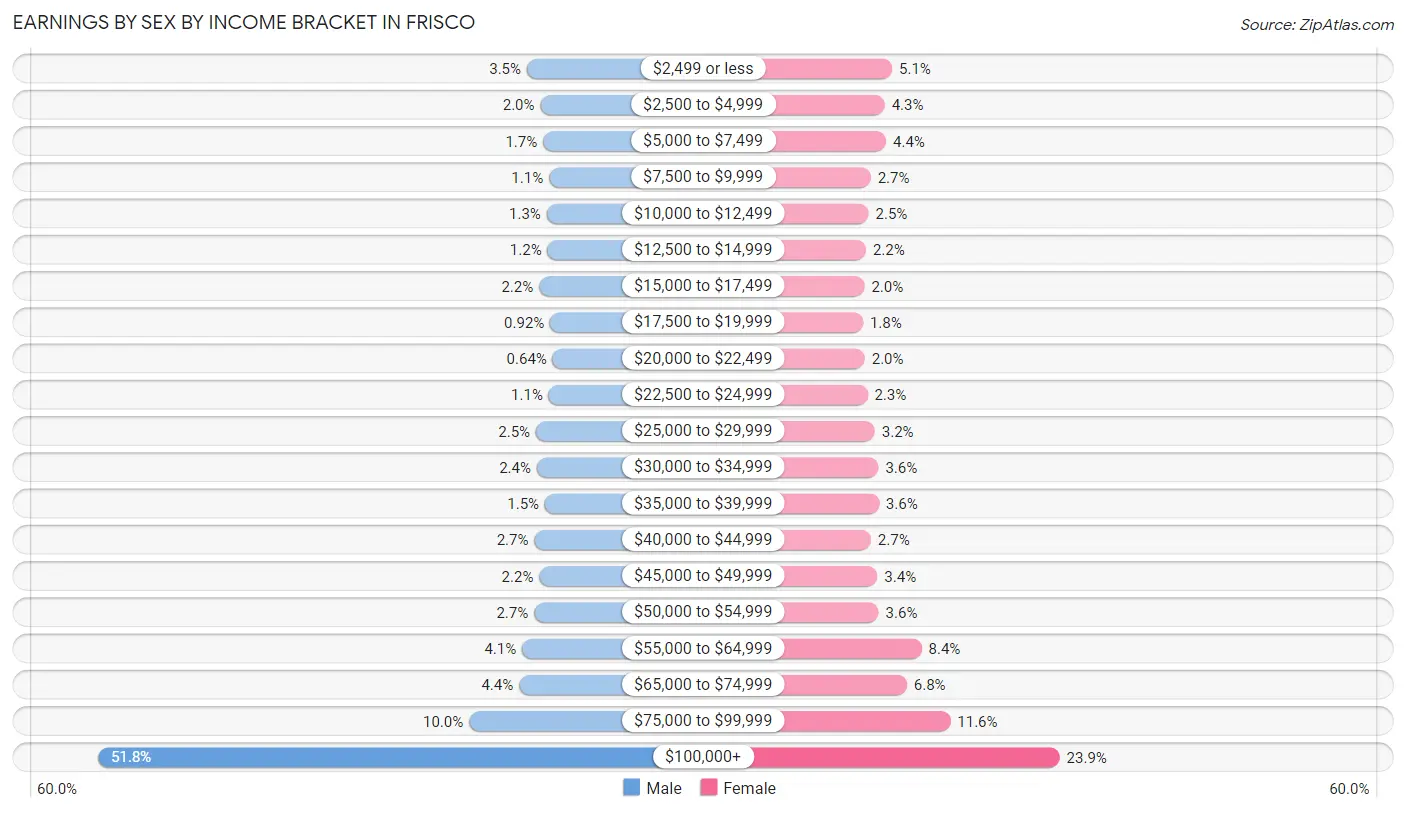
Earnings by Sex by Income Bracket in Frisco
The most common earnings brackets in Frisco are $100,000+ for men (31,631 | 51.7%) and $100,000+ for women (12,348 | 23.9%).
| Income | Male | Female |
| $2,499 or less | 2,162 (3.5%) | 2,626 (5.1%) |
| $2,500 to $4,999 | 1,235 (2.0%) | 2,200 (4.3%) |
| $5,000 to $7,499 | 1,054 (1.7%) | 2,281 (4.4%) |
| $7,500 to $9,999 | 644 (1.1%) | 1,387 (2.7%) |
| $10,000 to $12,499 | 799 (1.3%) | 1,264 (2.5%) |
| $12,500 to $14,999 | 744 (1.2%) | 1,117 (2.2%) |
| $15,000 to $17,499 | 1,327 (2.2%) | 1,025 (2.0%) |
| $17,500 to $19,999 | 565 (0.9%) | 939 (1.8%) |
| $20,000 to $22,499 | 392 (0.6%) | 1,043 (2.0%) |
| $22,500 to $24,999 | 660 (1.1%) | 1,197 (2.3%) |
| $25,000 to $29,999 | 1,541 (2.5%) | 1,623 (3.2%) |
| $30,000 to $34,999 | 1,478 (2.4%) | 1,835 (3.6%) |
| $35,000 to $39,999 | 922 (1.5%) | 1,863 (3.6%) |
| $40,000 to $44,999 | 1,653 (2.7%) | 1,401 (2.7%) |
| $45,000 to $49,999 | 1,311 (2.1%) | 1,775 (3.4%) |
| $50,000 to $54,999 | 1,669 (2.7%) | 1,848 (3.6%) |
| $55,000 to $64,999 | 2,495 (4.1%) | 4,342 (8.4%) |
| $65,000 to $74,999 | 2,699 (4.4%) | 3,485 (6.8%) |
| $75,000 to $99,999 | 6,136 (10.0%) | 6,006 (11.6%) |
| $100,000+ | 31,631 (51.7%) | 12,348 (23.9%) |
| Total | 61,117 (100.0%) | 51,605 (100.0%) |
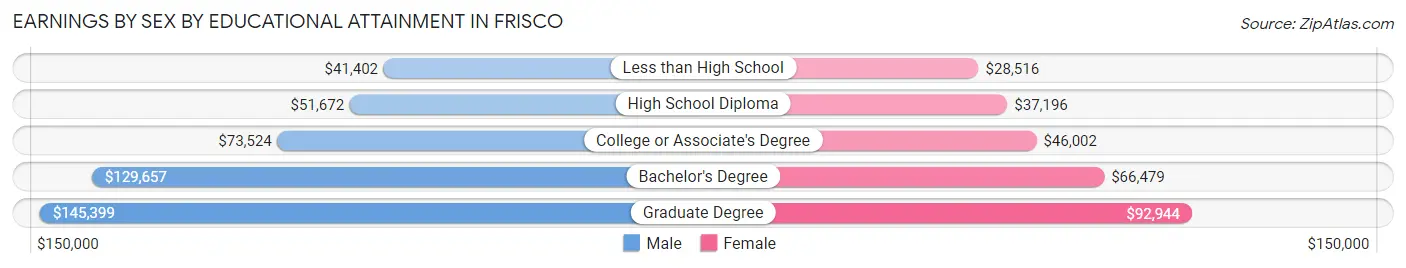
Earnings by Sex by Educational Attainment in Frisco
Average earnings in Frisco are $116,629 for men and $63,381 for women, a difference of 45.7%. Men with an educational attainment of graduate degree enjoy the highest average annual earnings of $145,399, while those with less than high school education earn the least with $41,402. Women with an educational attainment of graduate degree earn the most with the average annual earnings of $92,944, while those with less than high school education have the smallest earnings of $28,516.
| Educational Attainment | Male Income | Female Income |
| Less than High School | $41,402 | $28,516 |
| High School Diploma | $51,672 | $37,196 |
| College or Associate's Degree | $73,524 | $46,002 |
| Bachelor's Degree | $129,657 | $66,479 |
| Graduate Degree | $145,399 | $92,944 |
| Total | $116,629 | $63,381 |
Family Income in Frisco
Family Income Brackets in Frisco
According to the Frisco family income data, there are 21,044 families falling into the $200,000+ income range, which is the most common income bracket and makes up 39.8% of all families. Conversely, the $10,000 to $14,999 income bracket is the least frequent group with only 264 families (0.5%) belonging to this category.
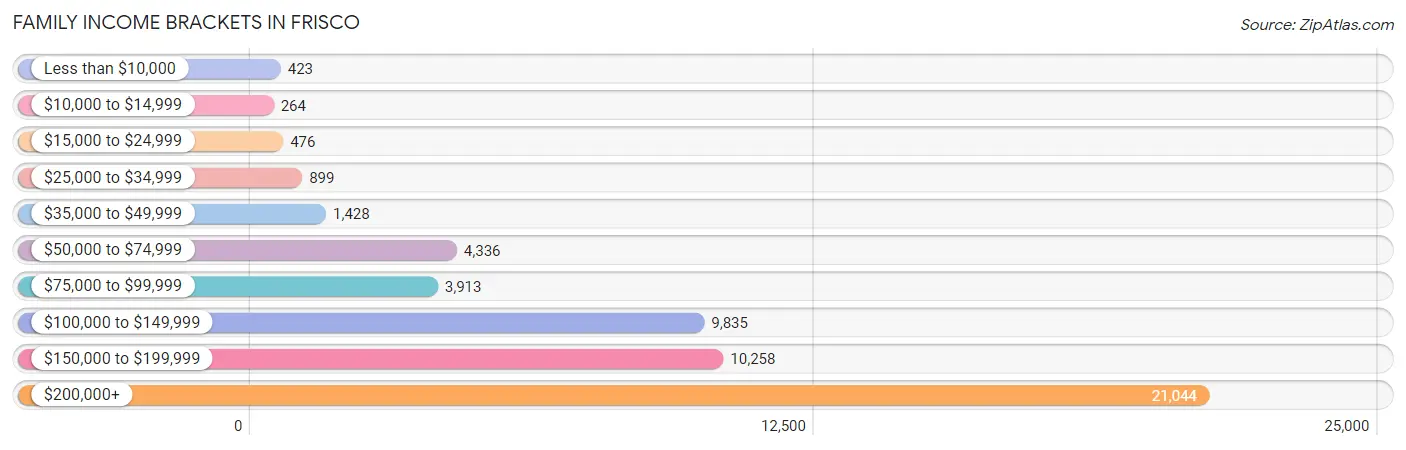
| Income Bracket | # Families | % Families |
| Less than $10,000 | 423 | 0.8% |
| $10,000 to $14,999 | 264 | 0.5% |
| $15,000 to $24,999 | 476 | 0.9% |
| $25,000 to $34,999 | 899 | 1.7% |
| $35,000 to $49,999 | 1,428 | 2.7% |
| $50,000 to $74,999 | 4,336 | 8.2% |
| $75,000 to $99,999 | 3,913 | 7.4% |
| $100,000 to $149,999 | 9,835 | 18.6% |
| $150,000 to $199,999 | 10,258 | 19.4% |
| $200,000+ | 21,044 | 39.8% |
Family Income by Famaliy Size in Frisco
7+ person families (557 | 1.1%) account for the highest median family income in Frisco with $221,094 per family, while 2-person families (15,831 | 29.9%) have the highest median income of $61,909 per family member.
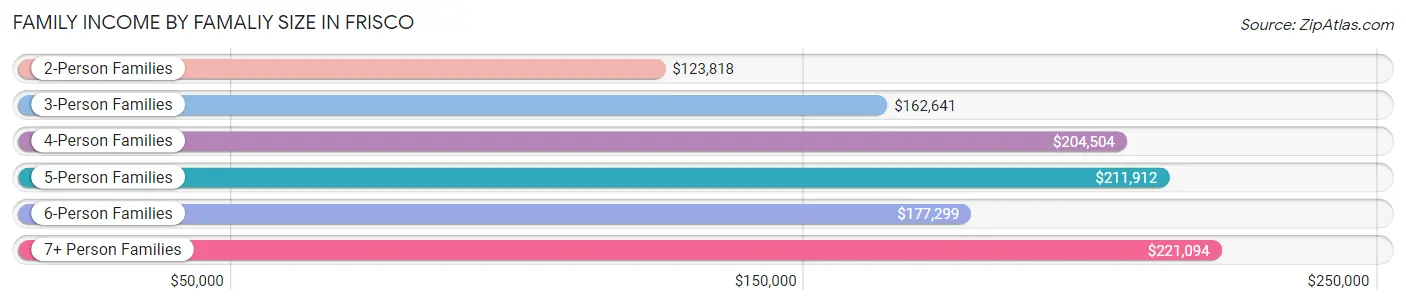
| Income Bracket | # Families | Median Income |
| 2-Person Families | 15,831 (29.9%) | $123,818 |
| 3-Person Families | 12,641 (23.9%) | $162,641 |
| 4-Person Families | 16,682 (31.6%) | $204,504 |
| 5-Person Families | 5,784 (10.9%) | $211,912 |
| 6-Person Families | 1,379 (2.6%) | $177,299 |
| 7+ Person Families | 557 (1.1%) | $221,094 |
| Total | 52,874 (100.0%) | $172,003 |
Family Income by Number of Earners in Frisco
The median family income in Frisco is $172,003, with families comprising 3+ earners (6,732) having the highest median family income of $212,902, while families with no earners (3,231) have the lowest median family income of $72,134, accounting for 12.7% and 6.1% of families, respectively.
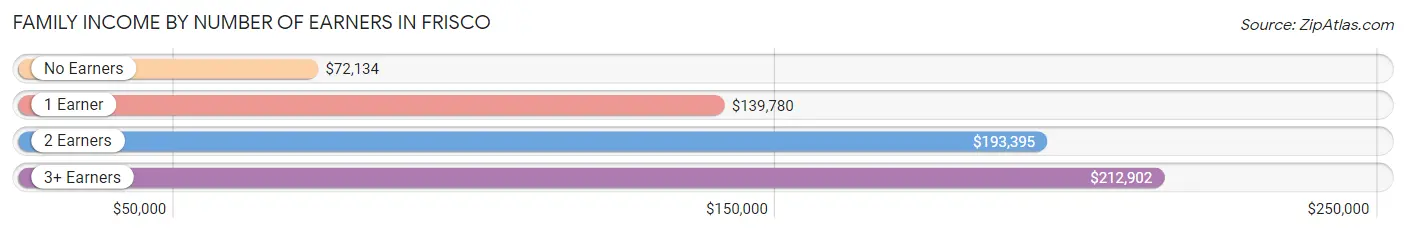
| Number of Earners | # Families | Median Income |
| No Earners | 3,231 (6.1%) | $72,134 |
| 1 Earner | 15,737 (29.8%) | $139,780 |
| 2 Earners | 27,174 (51.4%) | $193,395 |
| 3+ Earners | 6,732 (12.7%) | $212,902 |
| Total | 52,874 (100.0%) | $172,003 |
Household Income in Frisco
Household Income Brackets in Frisco
With 22,631 households falling in the category, the $200,000+ income range is the most frequent in Frisco, accounting for 32.1% of all households. In contrast, only 776 households (1.1%) fall into the $10,000 to $14,999 income bracket, making it the least populous group.
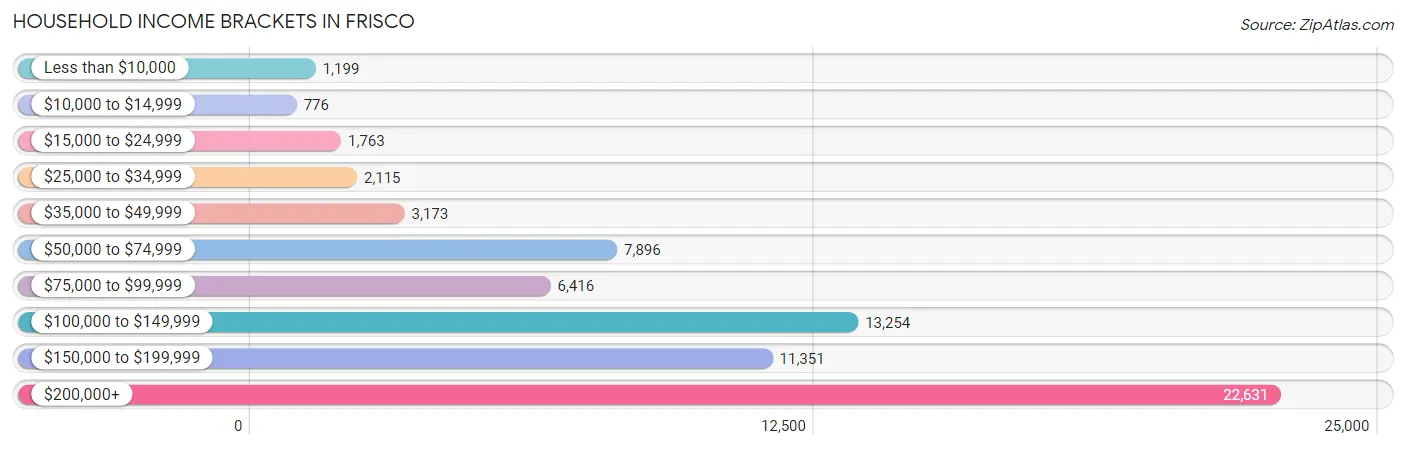
| Income Bracket | # Households | % Households |
| Less than $10,000 | 1,199 | 1.7% |
| $10,000 to $14,999 | 776 | 1.1% |
| $15,000 to $24,999 | 1,763 | 2.5% |
| $25,000 to $34,999 | 2,115 | 3.0% |
| $35,000 to $49,999 | 3,173 | 4.5% |
| $50,000 to $74,999 | 7,896 | 11.2% |
| $75,000 to $99,999 | 6,416 | 9.1% |
| $100,000 to $149,999 | 13,254 | 18.8% |
| $150,000 to $199,999 | 11,351 | 16.1% |
| $200,000+ | 22,631 | 32.1% |
Household Income by Householder Age in Frisco
The median household income in Frisco is $144,567, with the highest median household income of $179,904 found in the 45 to 64 years age bracket for the primary householder. A total of 30,010 households (42.6%) fall into this category. Meanwhile, the 15 to 24 years age bracket for the primary householder has the lowest median household income of $48,703, with 2,057 households (2.9%) in this group.
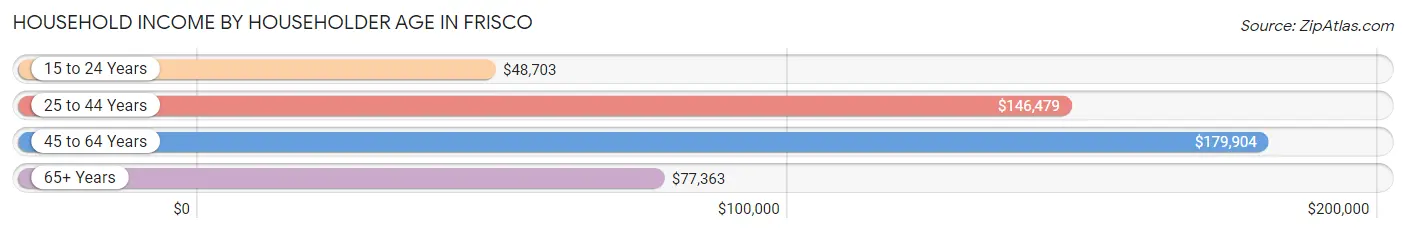
| Income Bracket | # Households | Median Income |
| 15 to 24 Years | 2,057 (2.9%) | $48,703 |
| 25 to 44 Years | 28,763 (40.8%) | $146,479 |
| 45 to 64 Years | 30,010 (42.6%) | $179,904 |
| 65+ Years | 9,672 (13.7%) | $77,363 |
| Total | 70,502 (100.0%) | $144,567 |
Poverty in Frisco
Income Below Poverty by Sex and Age in Frisco
With 3.0% poverty level for males and 3.2% for females among the residents of Frisco, 18 to 24 year old males and 65 to 74 year old females are the most vulnerable to poverty, with 594 males (7.8%) and 325 females (5.3%) in their respective age groups living below the poverty level.
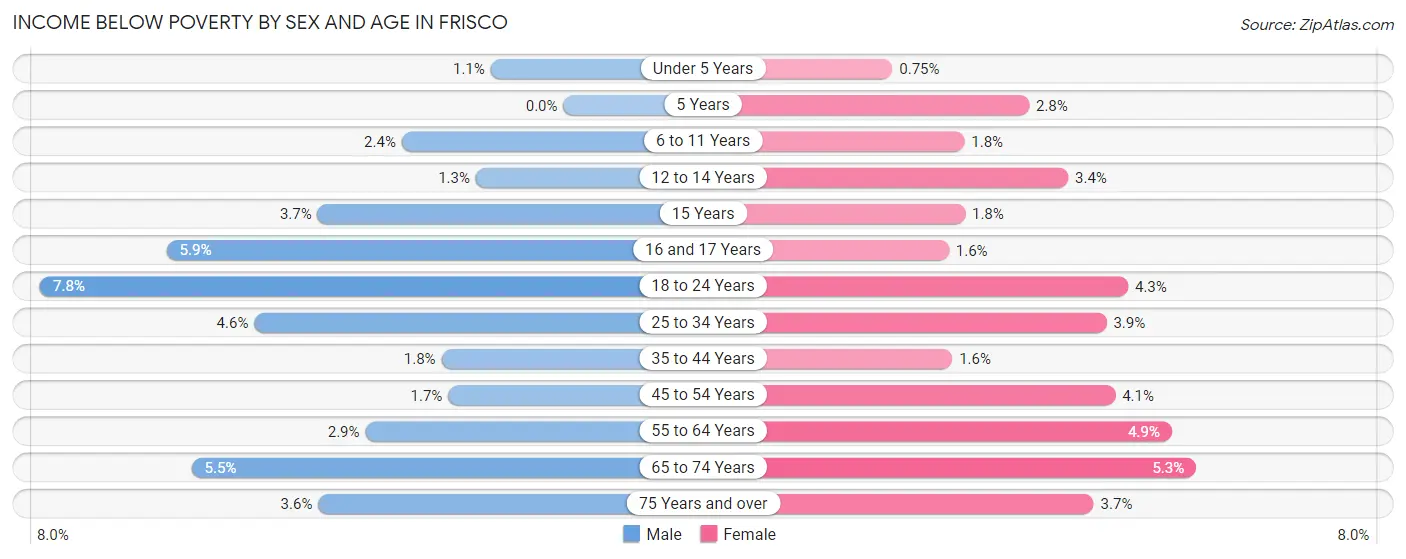
| Age Bracket | Male | Female |
| Under 5 Years | 66 (1.1%) | 37 (0.7%) |
| 5 Years | 0 (0.0%) | 40 (2.8%) |
| 6 to 11 Years | 249 (2.4%) | 184 (1.8%) |
| 12 to 14 Years | 75 (1.3%) | 173 (3.4%) |
| 15 Years | 75 (3.6%) | 38 (1.8%) |
| 16 and 17 Years | 237 (5.9%) | 59 (1.6%) |
| 18 to 24 Years | 594 (7.8%) | 325 (4.3%) |
| 25 to 34 Years | 434 (4.6%) | 420 (3.9%) |
| 35 to 44 Years | 307 (1.8%) | 319 (1.6%) |
| 45 to 54 Years | 323 (1.7%) | 685 (4.1%) |
| 55 to 64 Years | 259 (2.9%) | 429 (4.9%) |
| 65 to 74 Years | 283 (5.5%) | 325 (5.3%) |
| 75 Years and over | 109 (3.6%) | 180 (3.7%) |
| Total | 3,011 (3.0%) | 3,214 (3.2%) |
Income Above Poverty by Sex and Age in Frisco
According to the poverty statistics in Frisco, males aged 5 years and females aged under 5 years are the age groups that are most secure financially, with 100.0% of males and 99.3% of females in these age groups living above the poverty line.
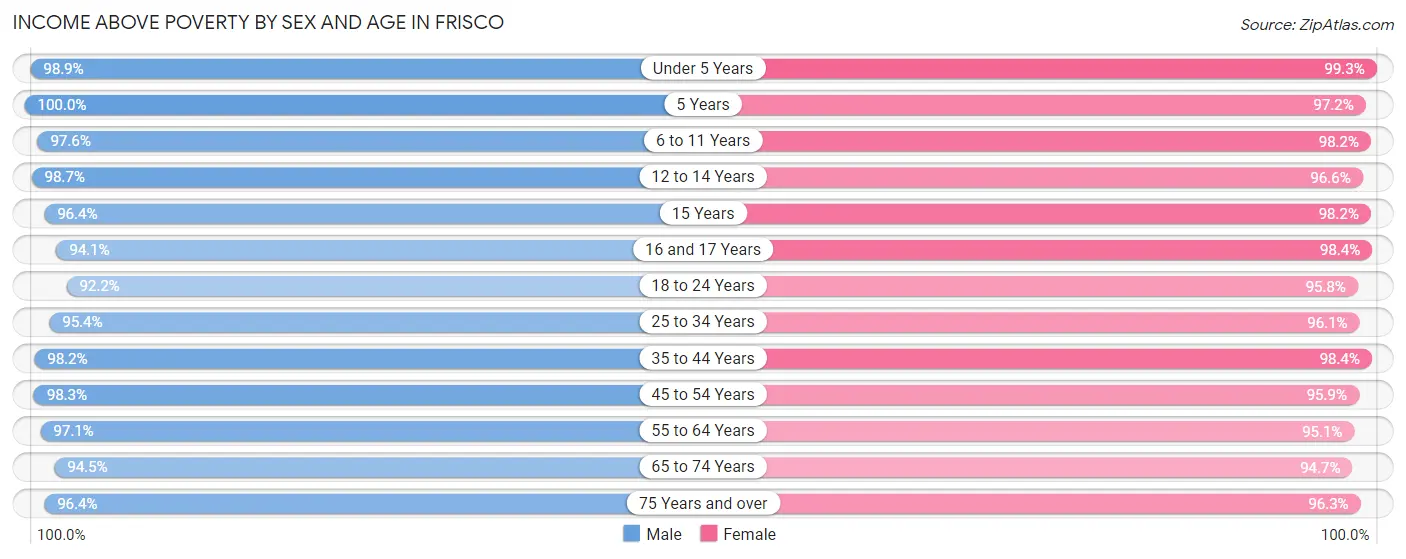
| Age Bracket | Male | Female |
| Under 5 Years | 6,054 (98.9%) | 4,878 (99.3%) |
| 5 Years | 1,303 (100.0%) | 1,397 (97.2%) |
| 6 to 11 Years | 10,127 (97.6%) | 9,932 (98.2%) |
| 12 to 14 Years | 5,699 (98.7%) | 4,971 (96.6%) |
| 15 Years | 1,979 (96.4%) | 2,035 (98.2%) |
| 16 and 17 Years | 3,785 (94.1%) | 3,651 (98.4%) |
| 18 to 24 Years | 7,051 (92.2%) | 7,330 (95.8%) |
| 25 to 34 Years | 9,020 (95.4%) | 10,256 (96.1%) |
| 35 to 44 Years | 16,672 (98.2%) | 19,142 (98.4%) |
| 45 to 54 Years | 18,572 (98.3%) | 16,184 (95.9%) |
| 55 to 64 Years | 8,559 (97.1%) | 8,335 (95.1%) |
| 65 to 74 Years | 4,847 (94.5%) | 5,852 (94.7%) |
| 75 Years and over | 2,886 (96.4%) | 4,639 (96.3%) |
| Total | 96,554 (97.0%) | 98,602 (96.8%) |
Income Below Poverty Among Married-Couple Families in Frisco
The poverty statistics for married-couple families in Frisco show that 1.7% or 804 of the total 46,508 families live below the poverty line. Families with no children have the highest poverty rate of 2.4%, comprising of 422 families. On the other hand, families with 3 or 4 children have the lowest poverty rate of 0.0%, which includes 0 families.
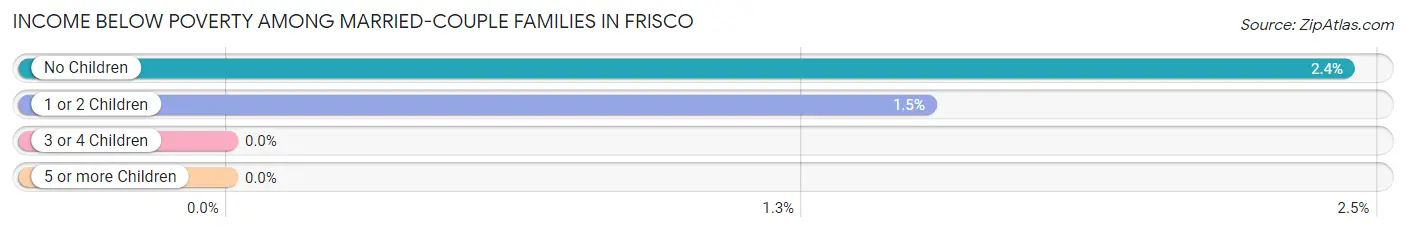
| Children | Above Poverty | Below Poverty |
| No Children | 16,923 (97.6%) | 422 (2.4%) |
| 1 or 2 Children | 24,747 (98.5%) | 382 (1.5%) |
| 3 or 4 Children | 3,888 (100.0%) | 0 (0.0%) |
| 5 or more Children | 146 (100.0%) | 0 (0.0%) |
| Total | 45,704 (98.3%) | 804 (1.7%) |
Income Below Poverty Among Single-Parent Households in Frisco
According to the poverty data in Frisco, 2.5% or 44 single-father households and 7.1% or 324 single-mother households are living below the poverty line. Among single-father households, those with 1 or 2 children have the highest poverty rate, with 32 households (2.7%) experiencing poverty. Likewise, among single-mother households, those with 3 or 4 children have the highest poverty rate, with 19 households (8.4%) falling below the poverty line.
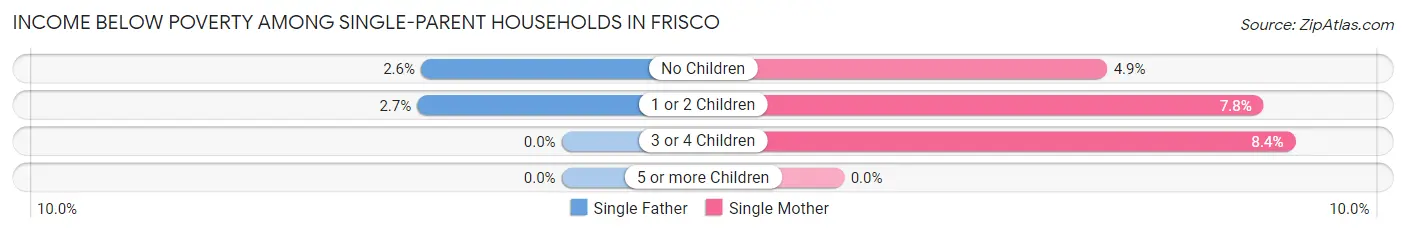
| Children | Single Father | Single Mother |
| No Children | 12 (2.6%) | 60 (4.9%) |
| 1 or 2 Children | 32 (2.7%) | 245 (7.8%) |
| 3 or 4 Children | 0 (0.0%) | 19 (8.4%) |
| 5 or more Children | 0 (0.0%) | 0 (0.0%) |
| Total | 44 (2.5%) | 324 (7.1%) |
Income Below Poverty Among Married-Couple vs Single-Parent Households in Frisco
The poverty data for Frisco shows that 804 of the married-couple family households (1.7%) and 368 of the single-parent households (5.8%) are living below the poverty level. Within the married-couple family households, those with no children have the highest poverty rate, with 422 households (2.4%) falling below the poverty line. Among the single-parent households, those with 1 or 2 children have the highest poverty rate, with 277 household (6.4%) living below poverty.
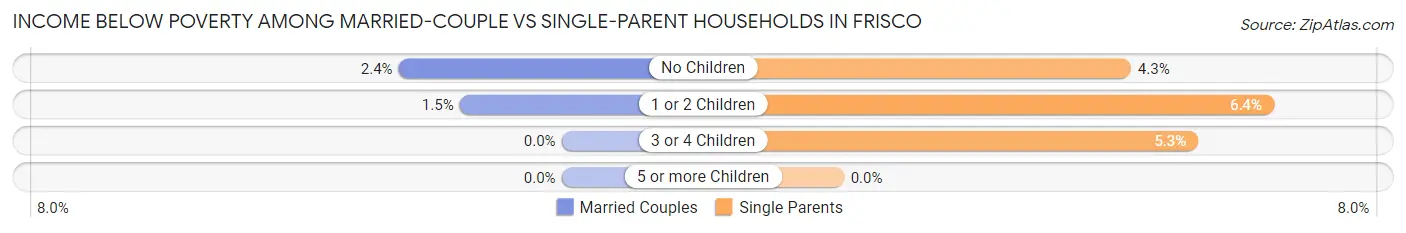
| Children | Married-Couple Families | Single-Parent Households |
| No Children | 422 (2.4%) | 72 (4.3%) |
| 1 or 2 Children | 382 (1.5%) | 277 (6.4%) |
| 3 or 4 Children | 0 (0.0%) | 19 (5.3%) |
| 5 or more Children | 0 (0.0%) | 0 (0.0%) |
| Total | 804 (1.7%) | 368 (5.8%) |
Race in Frisco
The most populous races in Frisco are White / Caucasian (108,370 | 53.6%), Asian (51,471 | 25.5%), and Hispanic or Latino (25,605 | 12.7%).
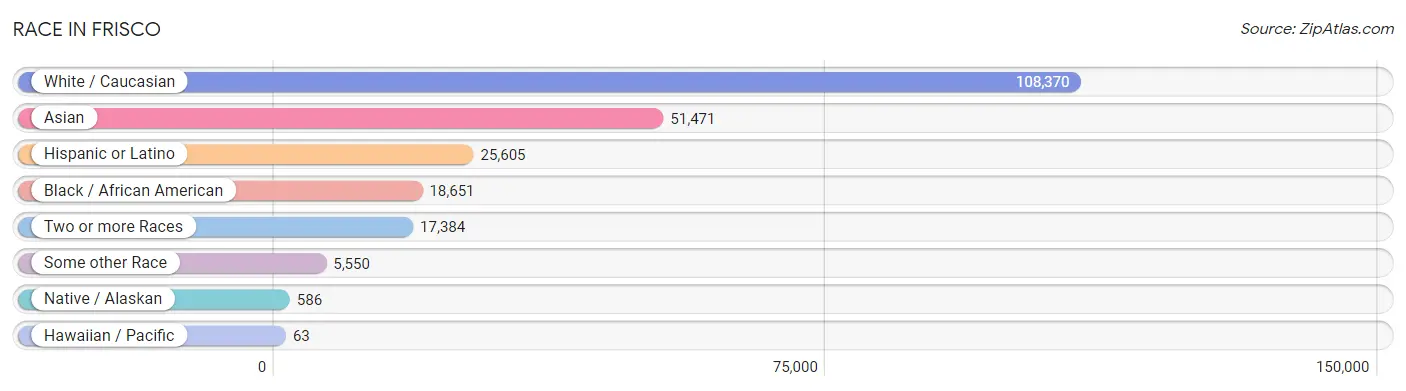
| Race | # Population | % Population |
| Asian | 51,471 | 25.5% |
| Black / African American | 18,651 | 9.2% |
| Hawaiian / Pacific | 63 | 0.0% |
| Hispanic or Latino | 25,605 | 12.7% |
| Native / Alaskan | 586 | 0.3% |
| White / Caucasian | 108,370 | 53.6% |
| Two or more Races | 17,384 | 8.6% |
| Some other Race | 5,550 | 2.8% |
| Total | 202,075 | 100.0% |
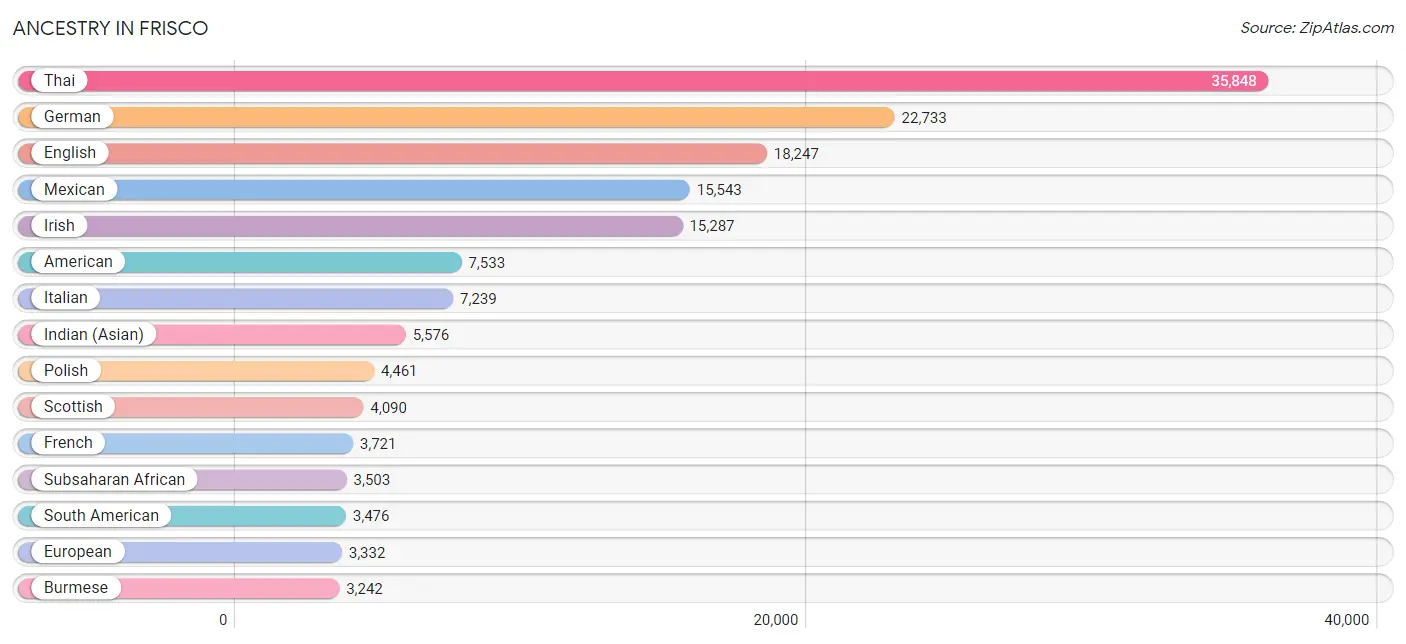
Ancestry in Frisco
The most populous ancestries reported in Frisco are Thai (35,848 | 17.7%), German (22,733 | 11.3%), English (18,247 | 9.0%), Mexican (15,543 | 7.7%), and Irish (15,287 | 7.6%), together accounting for 53.3% of all Frisco residents.
| Ancestry | # Population | % Population |
| Afghan | 39 | 0.0% |
| African | 951 | 0.5% |
| Albanian | 68 | 0.0% |
| American | 7,533 | 3.7% |
| Arab | 1,890 | 0.9% |
| Argentinean | 211 | 0.1% |
| Armenian | 105 | 0.1% |
| Assyrian / Chaldean / Syriac | 297 | 0.2% |
| Australian | 102 | 0.1% |
| Austrian | 381 | 0.2% |
| Bahamian | 6 | 0.0% |
| Bangladeshi | 59 | 0.0% |
| Basque | 20 | 0.0% |
| Belgian | 155 | 0.1% |
| Bhutanese | 1,414 | 0.7% |
| Blackfeet | 52 | 0.0% |
| Bolivian | 90 | 0.0% |
| Brazilian | 471 | 0.2% |
| British | 1,939 | 1.0% |
| Bulgarian | 99 | 0.1% |
| Burmese | 3,242 | 1.6% |
| Cajun | 225 | 0.1% |
| Canadian | 505 | 0.3% |
| Celtic | 26 | 0.0% |
| Central American | 1,629 | 0.8% |
| Central American Indian | 182 | 0.1% |
| Cherokee | 703 | 0.4% |
| Chickasaw | 51 | 0.0% |
| Chilean | 205 | 0.1% |
| Chinese | 8 | 0.0% |
| Chippewa | 41 | 0.0% |
| Choctaw | 163 | 0.1% |
| Colombian | 884 | 0.4% |
| Comanche | 47 | 0.0% |
| Costa Rican | 69 | 0.0% |
| Creek | 137 | 0.1% |
| Croatian | 59 | 0.0% |
| Cuban | 537 | 0.3% |
| Czech | 840 | 0.4% |
| Czechoslovakian | 131 | 0.1% |
| Danish | 796 | 0.4% |
| Dominican | 135 | 0.1% |
| Dutch | 1,382 | 0.7% |
| Eastern European | 553 | 0.3% |
| Ecuadorian | 325 | 0.2% |
| Egyptian | 265 | 0.1% |
| English | 18,247 | 9.0% |
| Ethiopian | 59 | 0.0% |
| European | 3,332 | 1.7% |
| Filipino | 682 | 0.3% |
| Finnish | 129 | 0.1% |
| French | 3,721 | 1.8% |
| French Canadian | 550 | 0.3% |
| German | 22,733 | 11.3% |
| Ghanaian | 3 | 0.0% |
| Greek | 758 | 0.4% |
| Guamanian / Chamorro | 22 | 0.0% |
| Guatemalan | 712 | 0.4% |
| Guyanese | 14 | 0.0% |
| Haitian | 75 | 0.0% |
| Honduran | 111 | 0.1% |
| Hungarian | 358 | 0.2% |
| Indian (Asian) | 5,576 | 2.8% |
| Iranian | 1,258 | 0.6% |
| Iraqi | 71 | 0.0% |
| Irish | 15,287 | 7.6% |
| Iroquois | 34 | 0.0% |
| Israeli | 60 | 0.0% |
| Italian | 7,239 | 3.6% |
| Jamaican | 209 | 0.1% |
| Jordanian | 207 | 0.1% |
| Kenyan | 130 | 0.1% |
| Korean | 2,549 | 1.3% |
| Laotian | 158 | 0.1% |
| Lebanese | 451 | 0.2% |
| Liberian | 61 | 0.0% |
| Lithuanian | 306 | 0.2% |
| Lumbee | 4 | 0.0% |
| Luxembourger | 39 | 0.0% |
| Macedonian | 13 | 0.0% |
| Mexican | 15,543 | 7.7% |
| Mexican American Indian | 40 | 0.0% |
| Mongolian | 49 | 0.0% |
| Moroccan | 119 | 0.1% |
| Native Hawaiian | 356 | 0.2% |
| New Zealander | 48 | 0.0% |
| Nicaraguan | 40 | 0.0% |
| Nigerian | 1,990 | 1.0% |
| Northern European | 259 | 0.1% |
| Norwegian | 1,411 | 0.7% |
| Osage | 65 | 0.0% |
| Pakistani | 170 | 0.1% |
| Palestinian | 70 | 0.0% |
| Panamanian | 176 | 0.1% |
| Pennsylvania German | 56 | 0.0% |
| Peruvian | 427 | 0.2% |
| Polish | 4,461 | 2.2% |
| Portuguese | 526 | 0.3% |
| Potawatomi | 18 | 0.0% |
| Puerto Rican | 2,618 | 1.3% |
| Romanian | 388 | 0.2% |
| Russian | 933 | 0.5% |
| Salvadoran | 518 | 0.3% |
| Samoan | 118 | 0.1% |
| Scandinavian | 513 | 0.3% |
| Scotch-Irish | 1,400 | 0.7% |
| Scottish | 4,090 | 2.0% |
| Serbian | 76 | 0.0% |
| Sierra Leonean | 35 | 0.0% |
| Sioux | 36 | 0.0% |
| Slovak | 234 | 0.1% |
| Slovene | 84 | 0.0% |
| South African | 250 | 0.1% |
| South American | 3,476 | 1.7% |
| Spaniard | 906 | 0.4% |
| Spanish | 442 | 0.2% |
| Sri Lankan | 2,647 | 1.3% |
| Subsaharan African | 3,503 | 1.7% |
| Swedish | 1,449 | 0.7% |
| Swiss | 198 | 0.1% |
| Syrian | 82 | 0.0% |
| Thai | 35,848 | 17.7% |
| Trinidadian and Tobagonian | 3 | 0.0% |
| Turkish | 253 | 0.1% |
| Ukrainian | 360 | 0.2% |
| Venezuelan | 1,312 | 0.6% |
| Vietnamese | 372 | 0.2% |
| Welsh | 1,106 | 0.5% |
| West Indian | 20 | 0.0% |
| Yugoslavian | 130 | 0.1% |
| Zimbabwean | 39 | 0.0% | View All 131 Rows |
Immigrants in Frisco
The most numerous immigrant groups reported in Frisco came from Asia (35,788 | 17.7%), South Central Asia (25,180 | 12.5%), India (21,791 | 10.8%), Latin America (7,917 | 3.9%), and Eastern Asia (5,940 | 2.9%), together accounting for 47.8% of all Frisco residents.
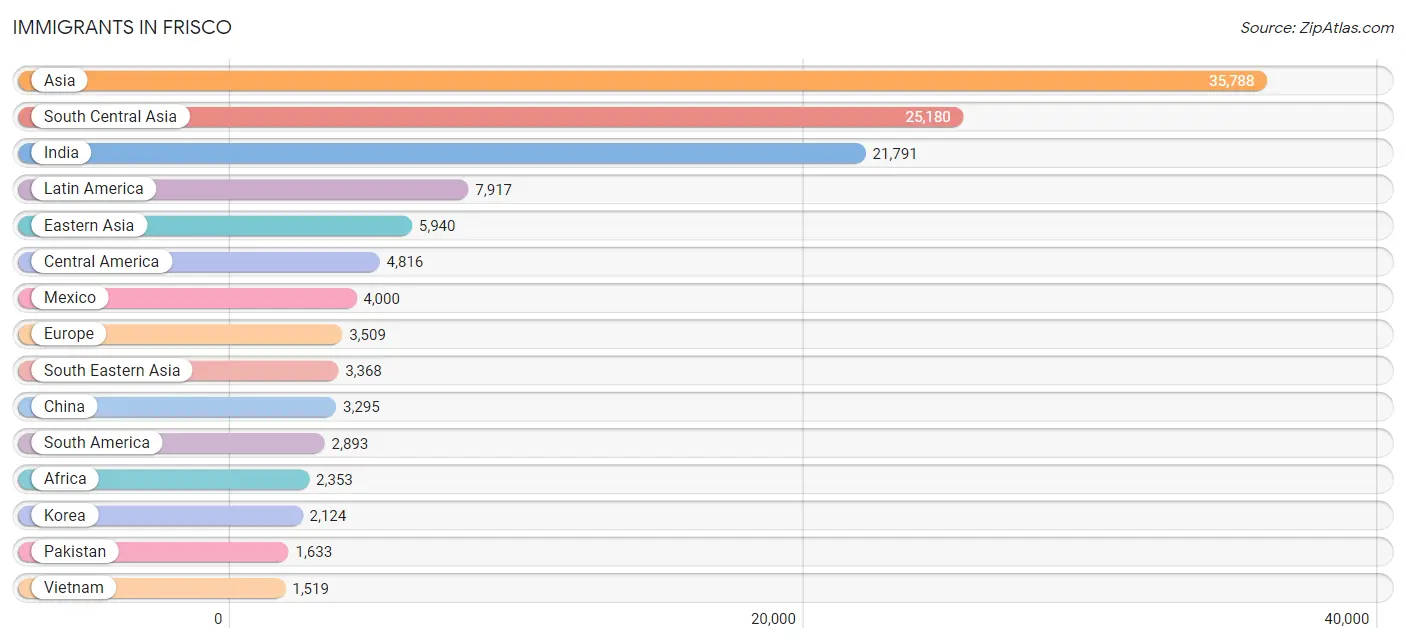
| Immigration Origin | # Population | % Population |
| Afghanistan | 50 | 0.0% |
| Africa | 2,353 | 1.2% |
| Albania | 13 | 0.0% |
| Argentina | 103 | 0.1% |
| Armenia | 29 | 0.0% |
| Asia | 35,788 | 17.7% |
| Australia | 170 | 0.1% |
| Bangladesh | 323 | 0.2% |
| Belarus | 39 | 0.0% |
| Belgium | 38 | 0.0% |
| Bolivia | 31 | 0.0% |
| Bosnia and Herzegovina | 111 | 0.1% |
| Brazil | 854 | 0.4% |
| Bulgaria | 49 | 0.0% |
| Cambodia | 44 | 0.0% |
| Cameroon | 37 | 0.0% |
| Canada | 1,354 | 0.7% |
| Caribbean | 208 | 0.1% |
| Central America | 4,816 | 2.4% |
| Chile | 180 | 0.1% |
| China | 3,295 | 1.6% |
| Colombia | 374 | 0.2% |
| Congo | 9 | 0.0% |
| Costa Rica | 43 | 0.0% |
| Cuba | 64 | 0.0% |
| Czechoslovakia | 26 | 0.0% |
| Dominican Republic | 35 | 0.0% |
| Eastern Africa | 559 | 0.3% |
| Eastern Asia | 5,940 | 2.9% |
| Eastern Europe | 1,180 | 0.6% |
| Ecuador | 194 | 0.1% |
| Egypt | 59 | 0.0% |
| El Salvador | 352 | 0.2% |
| England | 422 | 0.2% |
| Ethiopia | 120 | 0.1% |
| Europe | 3,509 | 1.7% |
| Fiji | 35 | 0.0% |
| France | 60 | 0.0% |
| Germany | 463 | 0.2% |
| Ghana | 35 | 0.0% |
| Greece | 106 | 0.1% |
| Guatemala | 326 | 0.2% |
| Guyana | 11 | 0.0% |
| Honduras | 40 | 0.0% |
| Hong Kong | 323 | 0.2% |
| Hungary | 11 | 0.0% |
| India | 21,791 | 10.8% |
| Indonesia | 136 | 0.1% |
| Iran | 1,122 | 0.6% |
| Iraq | 138 | 0.1% |
| Ireland | 34 | 0.0% |
| Israel | 91 | 0.1% |
| Italy | 134 | 0.1% |
| Jamaica | 97 | 0.1% |
| Japan | 521 | 0.3% |
| Jordan | 142 | 0.1% |
| Kazakhstan | 5 | 0.0% |
| Kenya | 201 | 0.1% |
| Korea | 2,124 | 1.1% |
| Kuwait | 137 | 0.1% |
| Laos | 16 | 0.0% |
| Latin America | 7,917 | 3.9% |
| Lebanon | 239 | 0.1% |
| Liberia | 86 | 0.0% |
| Lithuania | 7 | 0.0% |
| Malaysia | 125 | 0.1% |
| Mexico | 4,000 | 2.0% |
| Middle Africa | 46 | 0.0% |
| Morocco | 44 | 0.0% |
| Nepal | 159 | 0.1% |
| Netherlands | 57 | 0.0% |
| Nicaragua | 44 | 0.0% |
| Nigeria | 1,078 | 0.5% |
| Northern Africa | 256 | 0.1% |
| Northern Europe | 1,325 | 0.7% |
| Oceania | 220 | 0.1% |
| Pakistan | 1,633 | 0.8% |
| Panama | 11 | 0.0% |
| Peru | 132 | 0.1% |
| Philippines | 1,315 | 0.6% |
| Poland | 56 | 0.0% |
| Portugal | 26 | 0.0% |
| Romania | 196 | 0.1% |
| Russia | 220 | 0.1% |
| Saudi Arabia | 116 | 0.1% |
| Scotland | 10 | 0.0% |
| Senegal | 17 | 0.0% |
| Serbia | 21 | 0.0% |
| Sierra Leone | 65 | 0.0% |
| Singapore | 60 | 0.0% |
| South Africa | 178 | 0.1% |
| South America | 2,893 | 1.4% |
| South Central Asia | 25,180 | 12.5% |
| South Eastern Asia | 3,368 | 1.7% |
| Southern Europe | 363 | 0.2% |
| Spain | 97 | 0.1% |
| Sri Lanka | 55 | 0.0% |
| Sweden | 339 | 0.2% |
| Switzerland | 23 | 0.0% |
| Taiwan | 536 | 0.3% |
| Thailand | 101 | 0.1% |
| Trinidad and Tobago | 12 | 0.0% |
| Turkey | 177 | 0.1% |
| Ukraine | 303 | 0.2% |
| Uzbekistan | 6 | 0.0% |
| Venezuela | 992 | 0.5% |
| Vietnam | 1,519 | 0.7% |
| Western Africa | 1,297 | 0.6% |
| Western Asia | 1,259 | 0.6% |
| Western Europe | 641 | 0.3% |
| Yemen | 45 | 0.0% |
| Zimbabwe | 89 | 0.0% | View All 112 Rows |
Sex and Age in Frisco
Sex and Age in Frisco
The most populous age groups in Frisco are 45 to 49 Years (11,044 | 11.1%) for men and 40 to 44 Years (10,286 | 10.1%) for women.
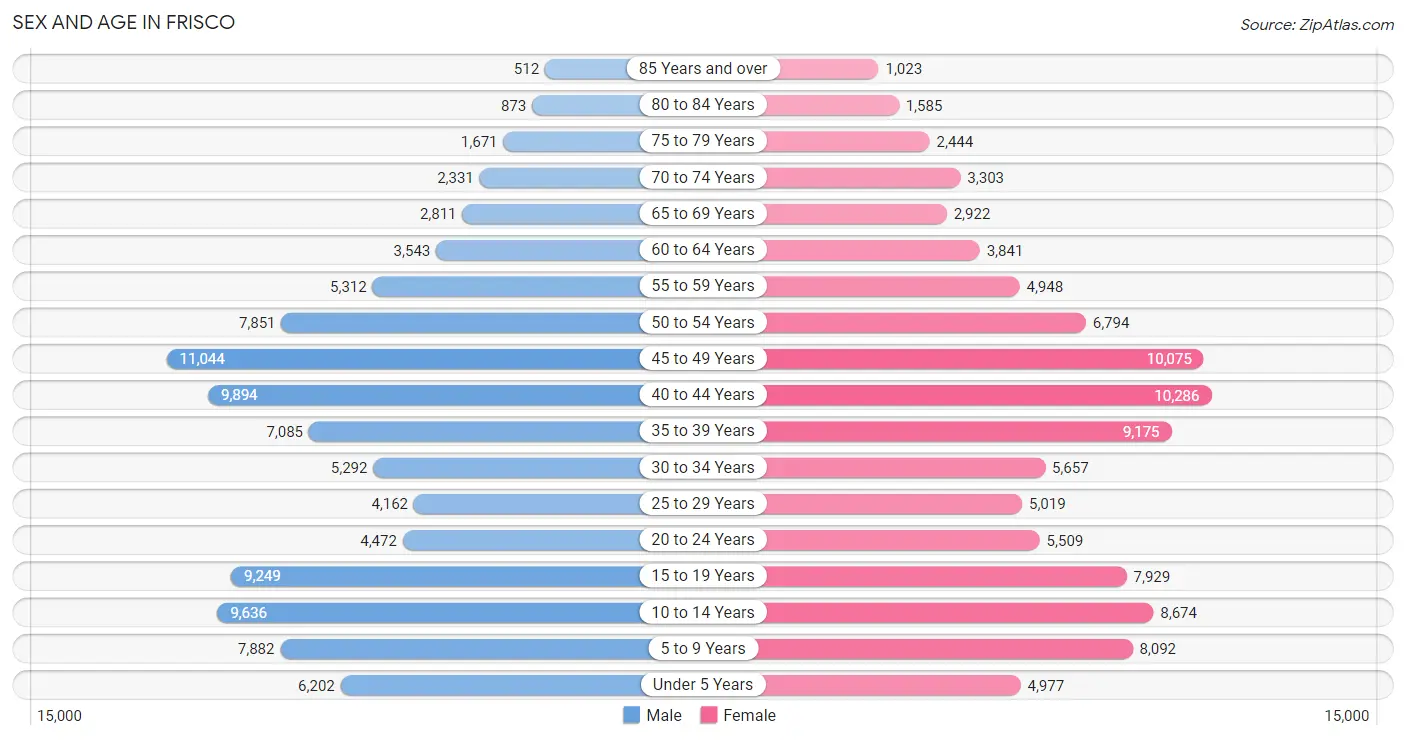
| Age Bracket | Male | Female |
| Under 5 Years | 6,202 (6.2%) | 4,977 (4.9%) |
| 5 to 9 Years | 7,882 (7.9%) | 8,092 (7.9%) |
| 10 to 14 Years | 9,636 (9.7%) | 8,674 (8.5%) |
| 15 to 19 Years | 9,249 (9.3%) | 7,929 (7.7%) |
| 20 to 24 Years | 4,472 (4.5%) | 5,509 (5.4%) |
| 25 to 29 Years | 4,162 (4.2%) | 5,019 (4.9%) |
| 30 to 34 Years | 5,292 (5.3%) | 5,657 (5.5%) |
| 35 to 39 Years | 7,085 (7.1%) | 9,175 (9.0%) |
| 40 to 44 Years | 9,894 (9.9%) | 10,286 (10.1%) |
| 45 to 49 Years | 11,044 (11.1%) | 10,075 (9.9%) |
| 50 to 54 Years | 7,851 (7.9%) | 6,794 (6.6%) |
| 55 to 59 Years | 5,312 (5.3%) | 4,948 (4.8%) |
| 60 to 64 Years | 3,543 (3.5%) | 3,841 (3.8%) |
| 65 to 69 Years | 2,811 (2.8%) | 2,922 (2.9%) |
| 70 to 74 Years | 2,331 (2.3%) | 3,303 (3.2%) |
| 75 to 79 Years | 1,671 (1.7%) | 2,444 (2.4%) |
| 80 to 84 Years | 873 (0.9%) | 1,585 (1.5%) |
| 85 Years and over | 512 (0.5%) | 1,023 (1.0%) |
| Total | 99,822 (100.0%) | 102,253 (100.0%) |
Families and Households in Frisco
Median Family Size in Frisco
The median family size in Frisco is 3.38 persons per family, with married-couple families (46,508 | 88.0%) accounting for the largest median family size of 3.43 persons per family. On the other hand, single female/mother families (4,584 | 8.7%) represent the smallest median family size with 2.99 persons per family.
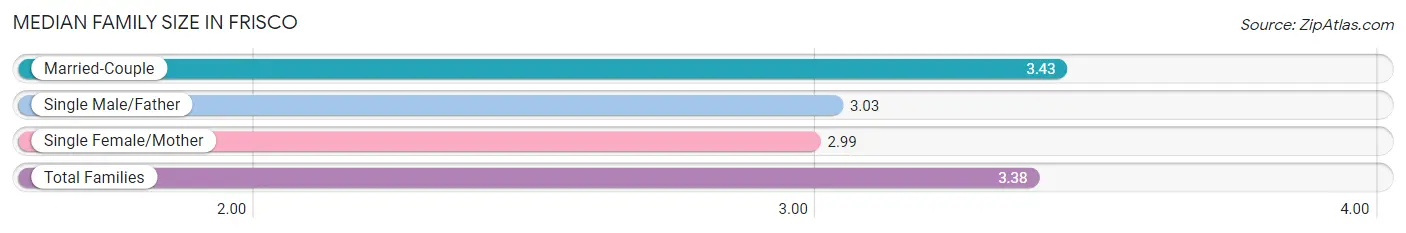
| Family Type | # Families | Family Size |
| Married-Couple | 46,508 (88.0%) | 3.43 |
| Single Male/Father | 1,782 (3.4%) | 3.03 |
| Single Female/Mother | 4,584 (8.7%) | 2.99 |
| Total Families | 52,874 (100.0%) | 3.38 |
Median Household Size in Frisco
The median household size in Frisco is 2.86 persons per household, with married-couple households (46,508 | 66.0%) accounting for the largest median household size of 3.44 persons per household. non-family households (17,628 | 25.0%) represent the smallest median household size with 1.20 persons per household.
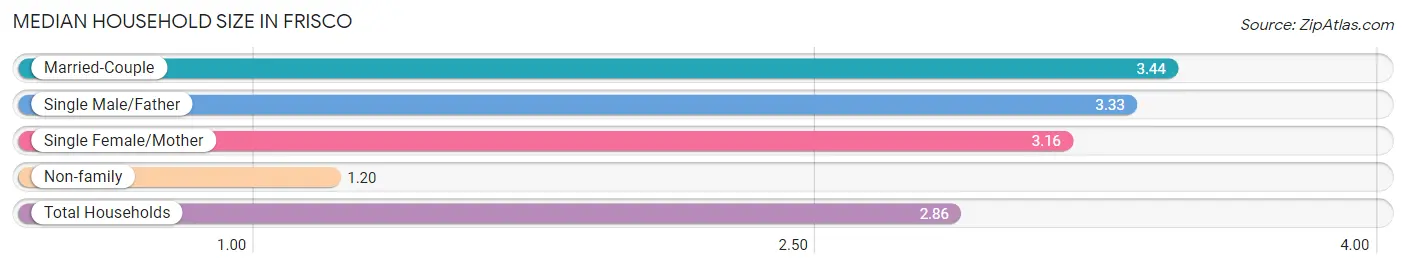
| Household Type | # Households | Household Size |
| Married-Couple | 46,508 (66.0%) | 3.44 |
| Single Male/Father | 1,782 (2.5%) | 3.33 |
| Single Female/Mother | 4,584 (6.5%) | 3.16 |
| Non-family | 17,628 (25.0%) | 1.20 |
| Total Households | 70,502 (100.0%) | 2.86 |
Household Size by Marriage Status in Frisco
Out of a total of 70,502 households in Frisco, 52,874 (75.0%) are family households, while 17,628 (25.0%) are nonfamily households. The most numerous type of family households are 4-person households, comprising 17,088, and the most common type of nonfamily households are 1-person households, comprising 14,945.
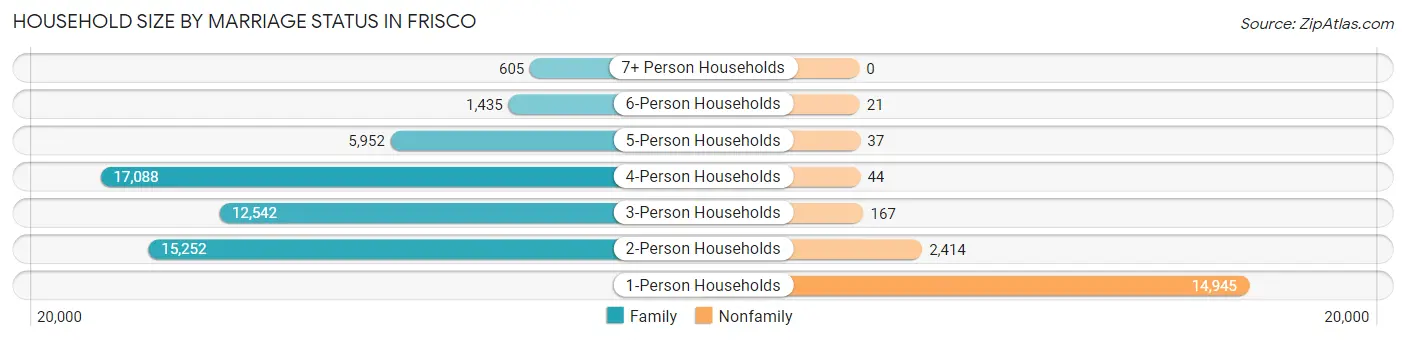
| Household Size | Family Households | Nonfamily Households |
| 1-Person Households | - | 14,945 (21.2%) |
| 2-Person Households | 15,252 (21.6%) | 2,414 (3.4%) |
| 3-Person Households | 12,542 (17.8%) | 167 (0.2%) |
| 4-Person Households | 17,088 (24.2%) | 44 (0.1%) |
| 5-Person Households | 5,952 (8.4%) | 37 (0.1%) |
| 6-Person Households | 1,435 (2.0%) | 21 (0.0%) |
| 7+ Person Households | 605 (0.9%) | 0 (0.0%) |
| Total | 52,874 (75.0%) | 17,628 (25.0%) |
Female Fertility in Frisco
Fertility by Age in Frisco
Average fertility rate in Frisco is 51.0 births per 1,000 women. Women in the age bracket of 20 to 34 years have the highest fertility rate with 110.0 births per 1,000 women. Women in the age bracket of 20 to 34 years acount for 63.6% of all women with births.
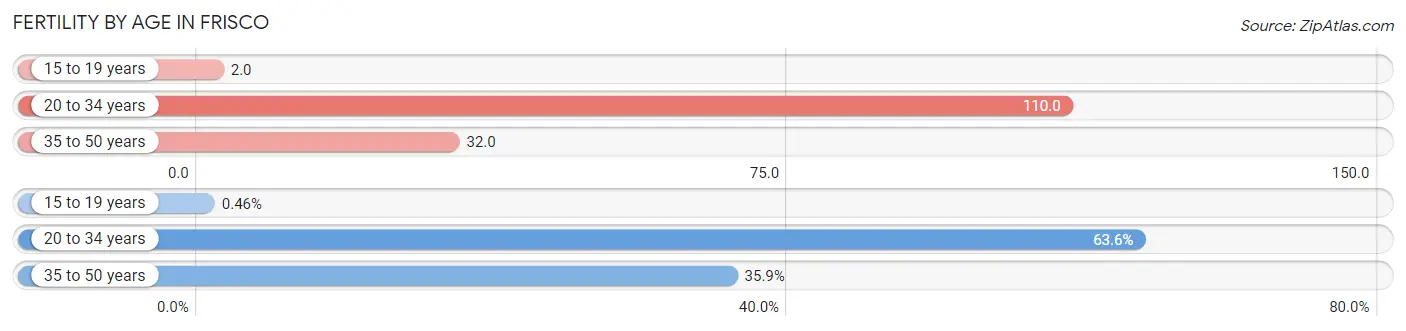
| Age Bracket | Women with Births | Births / 1,000 Women |
| 15 to 19 years | 13 (0.5%) | 2.0 |
| 20 to 34 years | 1,782 (63.6%) | 110.0 |
| 35 to 50 years | 1,007 (35.9%) | 32.0 |
| Total | 2,802 (100.0%) | 51.0 |
Fertility by Age by Marriage Status in Frisco
83.8% of women with births (2,802) in Frisco are married. The highest percentage of unmarried women with births falls into 15 to 19 years age bracket with 100.0% of them unmarried at the time of birth, while the lowest percentage of unmarried women with births belong to 35 to 50 years age bracket with 3.2% of them unmarried.
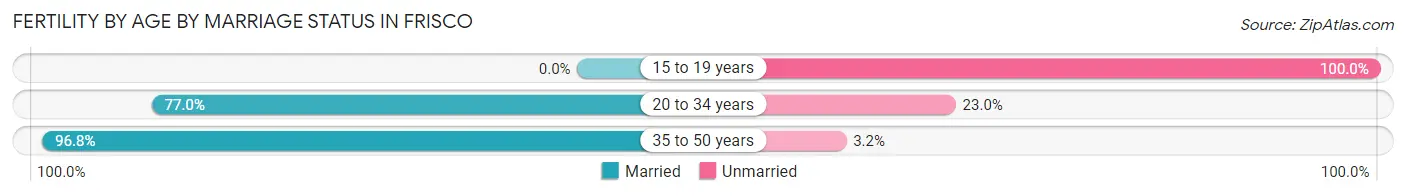
| Age Bracket | Married | Unmarried |
| 15 to 19 years | 0 (0.0%) | 13 (100.0%) |
| 20 to 34 years | 1,372 (77.0%) | 410 (23.0%) |
| 35 to 50 years | 975 (96.8%) | 32 (3.2%) |
| Total | 2,348 (83.8%) | 454 (16.2%) |
Fertility by Education in Frisco
Average fertility rate in Frisco is 51.0 births per 1,000 women. Women with the education attainment of graduate degree have the highest fertility rate of 63.0 births per 1,000 women, while women with the education attainment of less than high school have the lowest fertility at 8.0 births per 1,000 women. Women with the education attainment of bachelor's degree represent 43.1% of all women with births.
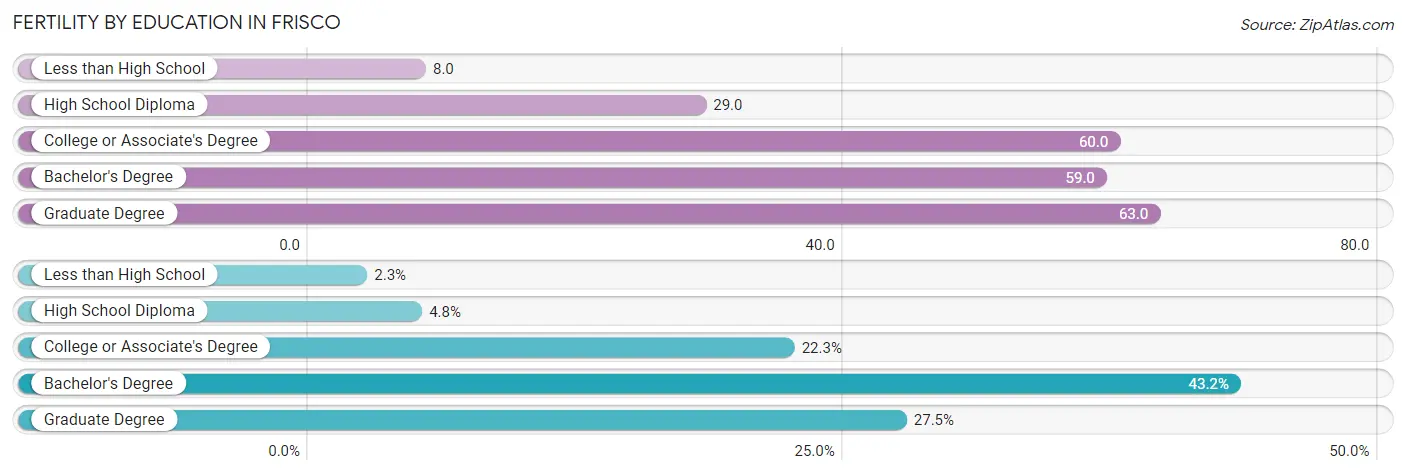
| Educational Attainment | Women with Births | Births / 1,000 Women |
| Less than High School | 63 (2.2%) | 8.0 |
| High School Diploma | 135 (4.8%) | 29.0 |
| College or Associate's Degree | 624 (22.3%) | 60.0 |
| Bachelor's Degree | 1,209 (43.1%) | 59.0 |
| Graduate Degree | 771 (27.5%) | 63.0 |
| Total | 2,802 (100.0%) | 51.0 |
Fertility by Education by Marriage Status in Frisco
16.2% of women with births in Frisco are unmarried. Women with the educational attainment of less than high school are most likely to be married with 100.0% of them married at childbirth, while women with the educational attainment of college or associate's degree are least likely to be married with 38.5% of them unmarried at childbirth.
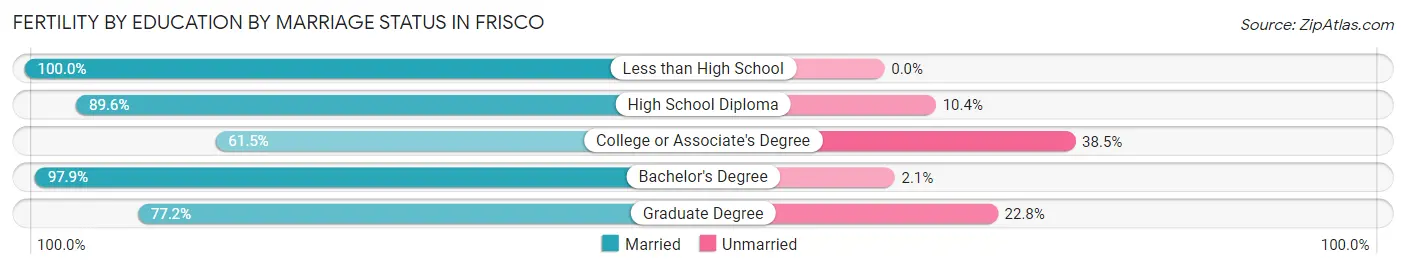
| Educational Attainment | Married | Unmarried |
| Less than High School | 63 (100.0%) | 0 (0.0%) |
| High School Diploma | 121 (89.6%) | 14 (10.4%) |
| College or Associate's Degree | 384 (61.5%) | 240 (38.5%) |
| Bachelor's Degree | 1,184 (97.9%) | 25 (2.1%) |
| Graduate Degree | 595 (77.2%) | 176 (22.8%) |
| Total | 2,348 (83.8%) | 454 (16.2%) |
Employment Characteristics in Frisco
Employment by Class of Employer in Frisco
Among the 103,867 employed individuals in Frisco, private company employees (81,010 | 78.0%), self-employed (not incorporated) (5,288 | 5.1%), and self-employed (incorporated) (5,267 | 5.1%) make up the most common classes of employment.
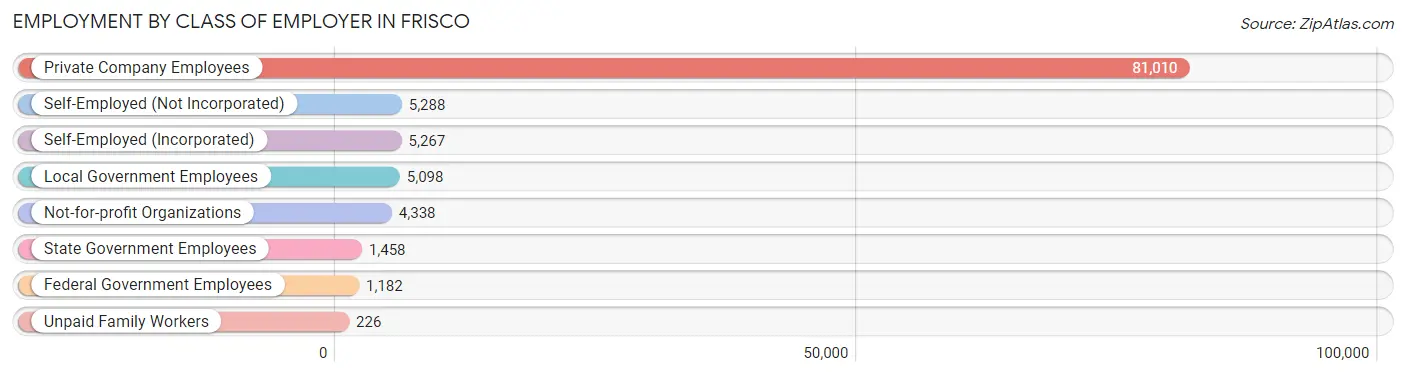
| Employer Class | # Employees | % Employees |
| Private Company Employees | 81,010 | 78.0% |
| Self-Employed (Incorporated) | 5,267 | 5.1% |
| Self-Employed (Not Incorporated) | 5,288 | 5.1% |
| Not-for-profit Organizations | 4,338 | 4.2% |
| Local Government Employees | 5,098 | 4.9% |
| State Government Employees | 1,458 | 1.4% |
| Federal Government Employees | 1,182 | 1.1% |
| Unpaid Family Workers | 226 | 0.2% |
| Total | 103,867 | 100.0% |
Employment Status by Age in Frisco
According to the labor force statistics for Frisco, out of the total population over 16 years of age (152,485), 71.7% or 109,332 individuals are in the labor force, with 3.9% or 4,264 of them unemployed. The age group with the highest labor force participation rate is 25 to 29 years, with 87.7% or 8,052 individuals in the labor force. Within the labor force, the 16 to 19 years age range has the highest percentage of unemployed individuals, with 10.7% or 547 of them being unemployed.
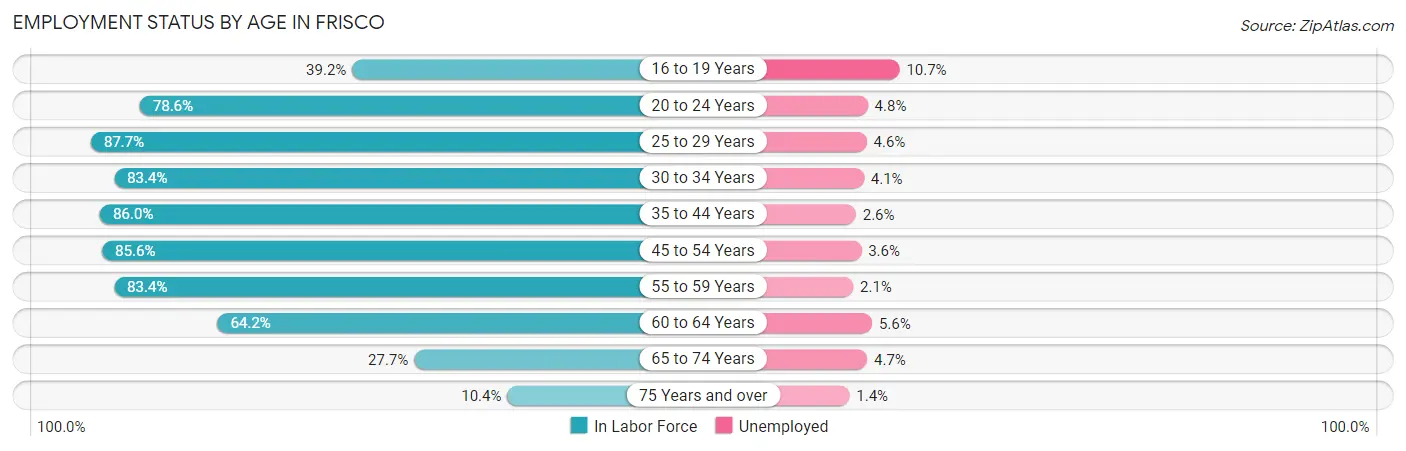
| Age Bracket | In Labor Force | Unemployed |
| 16 to 19 Years | 5,116 (39.2%) | 547 (10.7%) |
| 20 to 24 Years | 7,845 (78.6%) | 377 (4.8%) |
| 25 to 29 Years | 8,052 (87.7%) | 370 (4.6%) |
| 30 to 34 Years | 9,131 (83.4%) | 374 (4.1%) |
| 35 to 44 Years | 31,338 (86.0%) | 815 (2.6%) |
| 45 to 54 Years | 30,614 (85.6%) | 1,102 (3.6%) |
| 55 to 59 Years | 8,557 (83.4%) | 180 (2.1%) |
| 60 to 64 Years | 4,741 (64.2%) | 265 (5.6%) |
| 65 to 74 Years | 3,149 (27.7%) | 148 (4.7%) |
| 75 Years and over | 843 (10.4%) | 12 (1.4%) |
| Total | 109,332 (71.7%) | 4,264 (3.9%) |
Employment Status by Educational Attainment in Frisco
According to labor force statistics for Frisco, 84.1% of individuals (92,491) out of the total population between 25 and 64 years of age (109,978) are in the labor force, with 3.4% or 3,145 of them being unemployed. The group with the highest labor force participation rate are those with the educational attainment of bachelor's degree or higher, with 85.6% or 65,445 individuals in the labor force. Within the labor force, individuals with college / associate degree education have the highest percentage of unemployment, with 4.9% or 893 of them being unemployed.
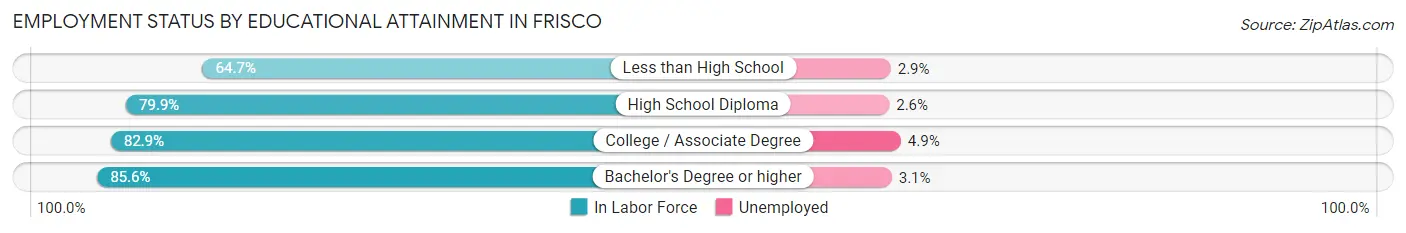
| Educational Attainment | In Labor Force | Unemployed |
| Less than High School | 1,902 (64.7%) | 85 (2.9%) |
| High School Diploma | 6,879 (79.9%) | 224 (2.6%) |
| College / Associate Degree | 18,217 (82.9%) | 1,077 (4.9%) |
| Bachelor's Degree or higher | 65,445 (85.6%) | 2,370 (3.1%) |
| Total | 92,491 (84.1%) | 3,739 (3.4%) |
Employment Occupations by Sex in Frisco
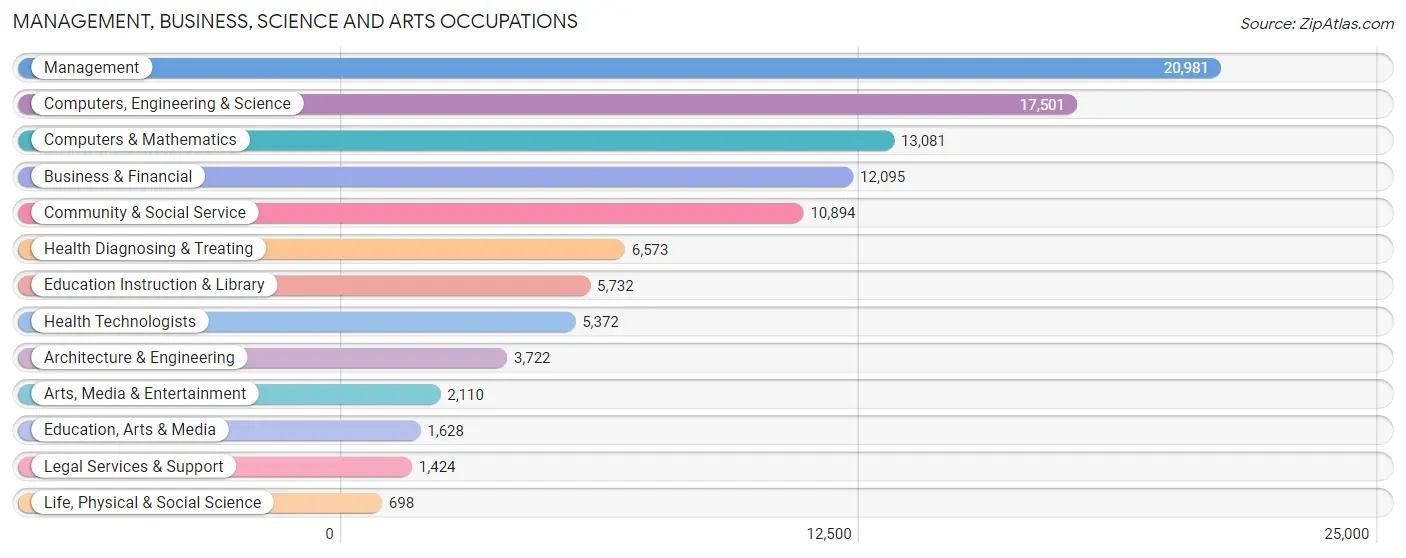
Management, Business, Science and Arts Occupations
The most common Management, Business, Science and Arts occupations in Frisco are Management (20,981 | 20.0%), Computers, Engineering & Science (17,501 | 16.7%), Computers & Mathematics (13,081 | 12.4%), Business & Financial (12,095 | 11.5%), and Community & Social Service (10,894 | 10.4%).
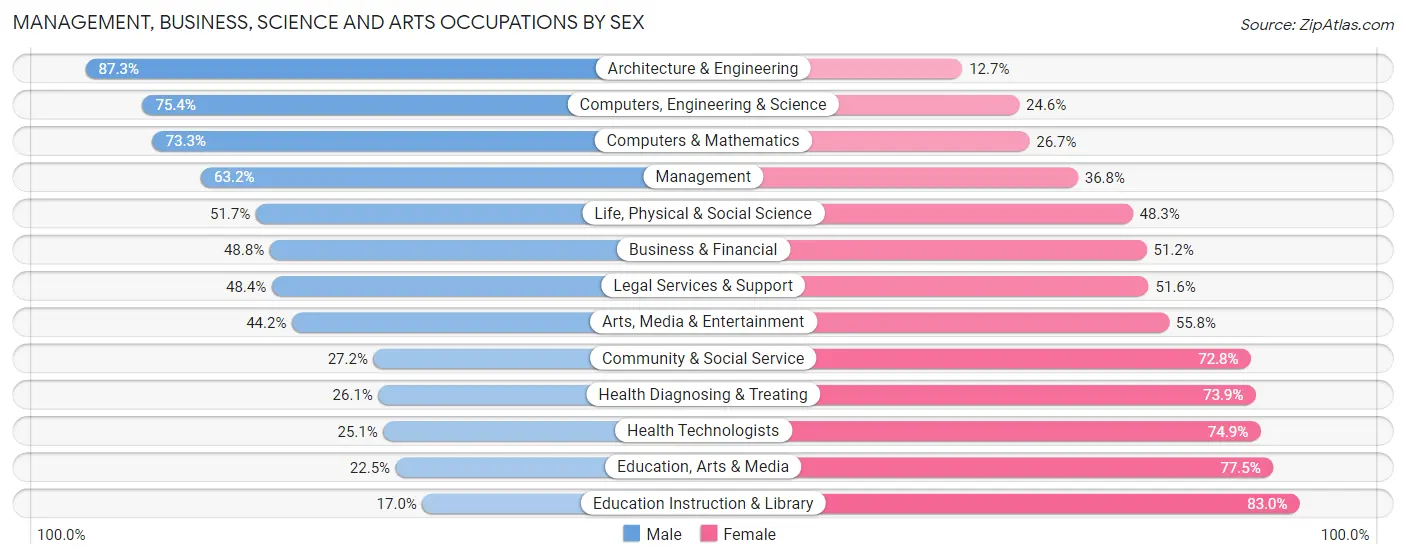
Management, Business, Science and Arts Occupations by Sex
Within the Management, Business, Science and Arts occupations in Frisco, the most male-oriented occupations are Architecture & Engineering (87.3%), Computers, Engineering & Science (75.4%), and Computers & Mathematics (73.3%), while the most female-oriented occupations are Education Instruction & Library (83.0%), Education, Arts & Media (77.5%), and Health Technologists (74.9%).
| Occupation | Male | Female |
| Management | 13,251 (63.2%) | 7,730 (36.8%) |
| Business & Financial | 5,904 (48.8%) | 6,191 (51.2%) |
| Computers, Engineering & Science | 13,195 (75.4%) | 4,306 (24.6%) |
| Computers & Mathematics | 9,586 (73.3%) | 3,495 (26.7%) |
| Architecture & Engineering | 3,248 (87.3%) | 474 (12.7%) |
| Life, Physical & Social Science | 361 (51.7%) | 337 (48.3%) |
| Community & Social Service | 2,960 (27.2%) | 7,934 (72.8%) |
| Education, Arts & Media | 367 (22.5%) | 1,261 (77.5%) |
| Legal Services & Support | 689 (48.4%) | 735 (51.6%) |
| Education Instruction & Library | 972 (17.0%) | 4,760 (83.0%) |
| Arts, Media & Entertainment | 932 (44.2%) | 1,178 (55.8%) |
| Health Diagnosing & Treating | 1,718 (26.1%) | 4,855 (73.9%) |
| Health Technologists | 1,350 (25.1%) | 4,022 (74.9%) |
| Total (Category) | 37,028 (54.4%) | 31,016 (45.6%) |
| Total (Overall) | 57,584 (54.8%) | 47,515 (45.2%) |
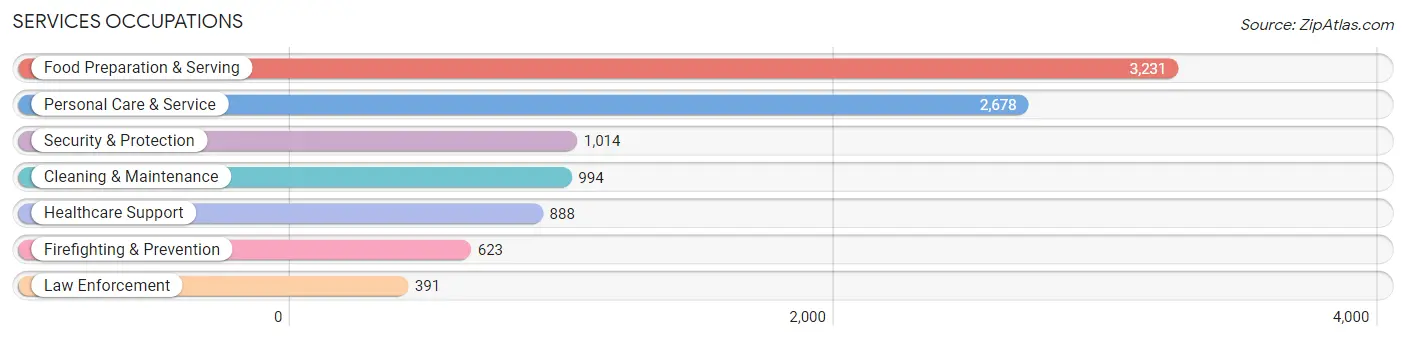
Services Occupations
The most common Services occupations in Frisco are Food Preparation & Serving (3,231 | 3.1%), Personal Care & Service (2,678 | 2.5%), Security & Protection (1,014 | 1.0%), Cleaning & Maintenance (994 | 0.9%), and Healthcare Support (888 | 0.8%).
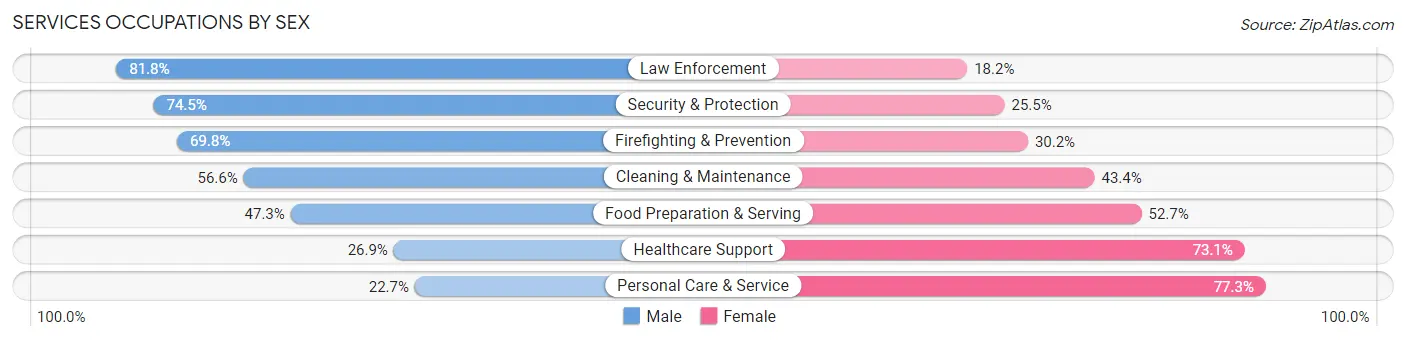
Services Occupations by Sex
Within the Services occupations in Frisco, the most male-oriented occupations are Law Enforcement (81.8%), Security & Protection (74.5%), and Firefighting & Prevention (69.8%), while the most female-oriented occupations are Personal Care & Service (77.3%), Healthcare Support (73.1%), and Food Preparation & Serving (52.7%).
| Occupation | Male | Female |
| Healthcare Support | 239 (26.9%) | 649 (73.1%) |
| Security & Protection | 755 (74.5%) | 259 (25.5%) |
| Firefighting & Prevention | 435 (69.8%) | 188 (30.2%) |
| Law Enforcement | 320 (81.8%) | 71 (18.2%) |
| Food Preparation & Serving | 1,529 (47.3%) | 1,702 (52.7%) |
| Cleaning & Maintenance | 563 (56.6%) | 431 (43.4%) |
| Personal Care & Service | 609 (22.7%) | 2,069 (77.3%) |
| Total (Category) | 3,695 (42.0%) | 5,110 (58.0%) |
| Total (Overall) | 57,584 (54.8%) | 47,515 (45.2%) |
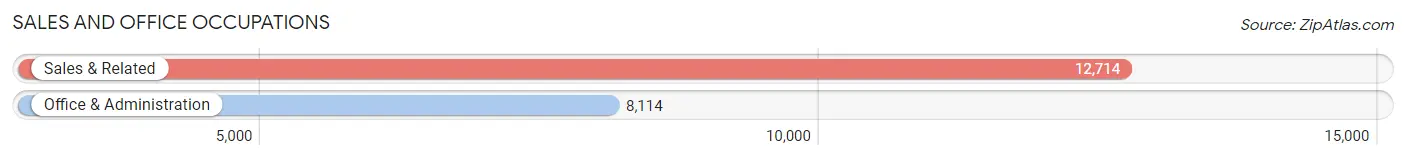
Sales and Office Occupations
The most common Sales and Office occupations in Frisco are Sales & Related (12,714 | 12.1%), and Office & Administration (8,114 | 7.7%).
Sales and Office Occupations by Sex
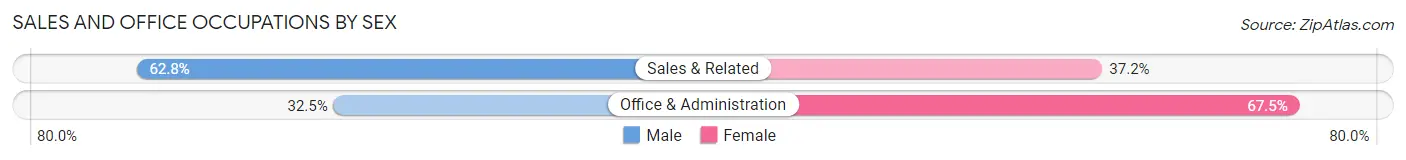
| Occupation | Male | Female |
| Sales & Related | 7,983 (62.8%) | 4,731 (37.2%) |
| Office & Administration | 2,635 (32.5%) | 5,479 (67.5%) |
| Total (Category) | 10,618 (51.0%) | 10,210 (49.0%) |
| Total (Overall) | 57,584 (54.8%) | 47,515 (45.2%) |
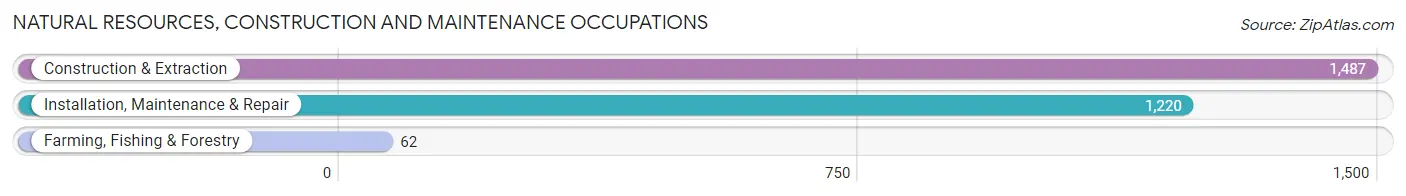
Natural Resources, Construction and Maintenance Occupations
The most common Natural Resources, Construction and Maintenance occupations in Frisco are Construction & Extraction (1,487 | 1.4%), Installation, Maintenance & Repair (1,220 | 1.2%), and Farming, Fishing & Forestry (62 | 0.1%).
Natural Resources, Construction and Maintenance Occupations by Sex
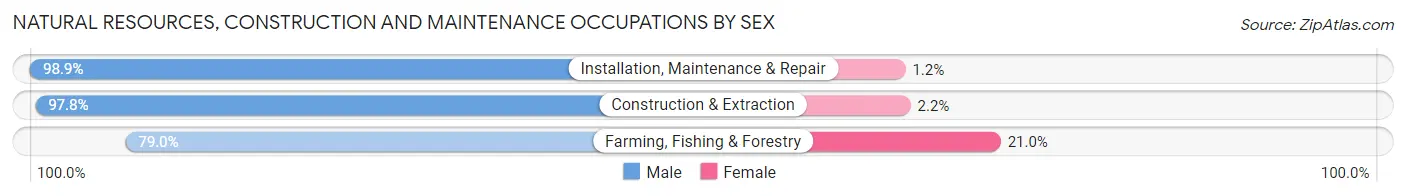
| Occupation | Male | Female |
| Farming, Fishing & Forestry | 49 (79.0%) | 13 (21.0%) |
| Construction & Extraction | 1,454 (97.8%) | 33 (2.2%) |
| Installation, Maintenance & Repair | 1,206 (98.9%) | 14 (1.1%) |
| Total (Category) | 2,709 (97.8%) | 60 (2.2%) |
| Total (Overall) | 57,584 (54.8%) | 47,515 (45.2%) |
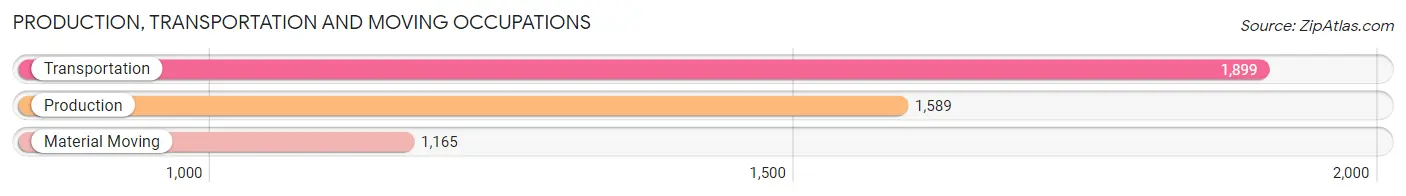
Production, Transportation and Moving Occupations
The most common Production, Transportation and Moving occupations in Frisco are Transportation (1,899 | 1.8%), Production (1,589 | 1.5%), and Material Moving (1,165 | 1.1%).
Production, Transportation and Moving Occupations by Sex
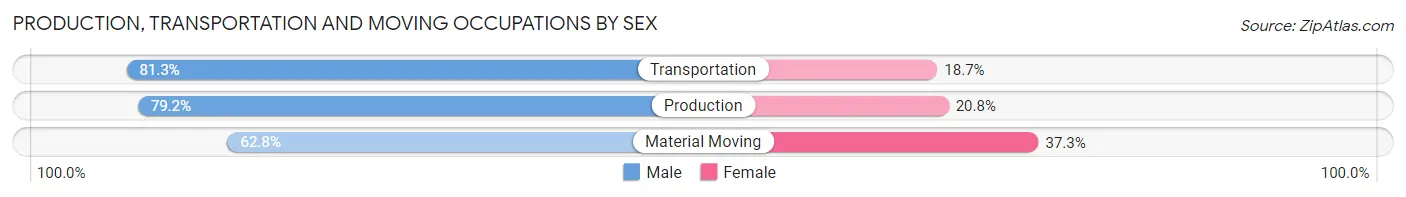
| Occupation | Male | Female |
| Production | 1,259 (79.2%) | 330 (20.8%) |
| Transportation | 1,544 (81.3%) | 355 (18.7%) |
| Material Moving | 731 (62.7%) | 434 (37.2%) |
| Total (Category) | 3,534 (75.9%) | 1,119 (24.0%) |
| Total (Overall) | 57,584 (54.8%) | 47,515 (45.2%) |
Employment Industries by Sex in Frisco
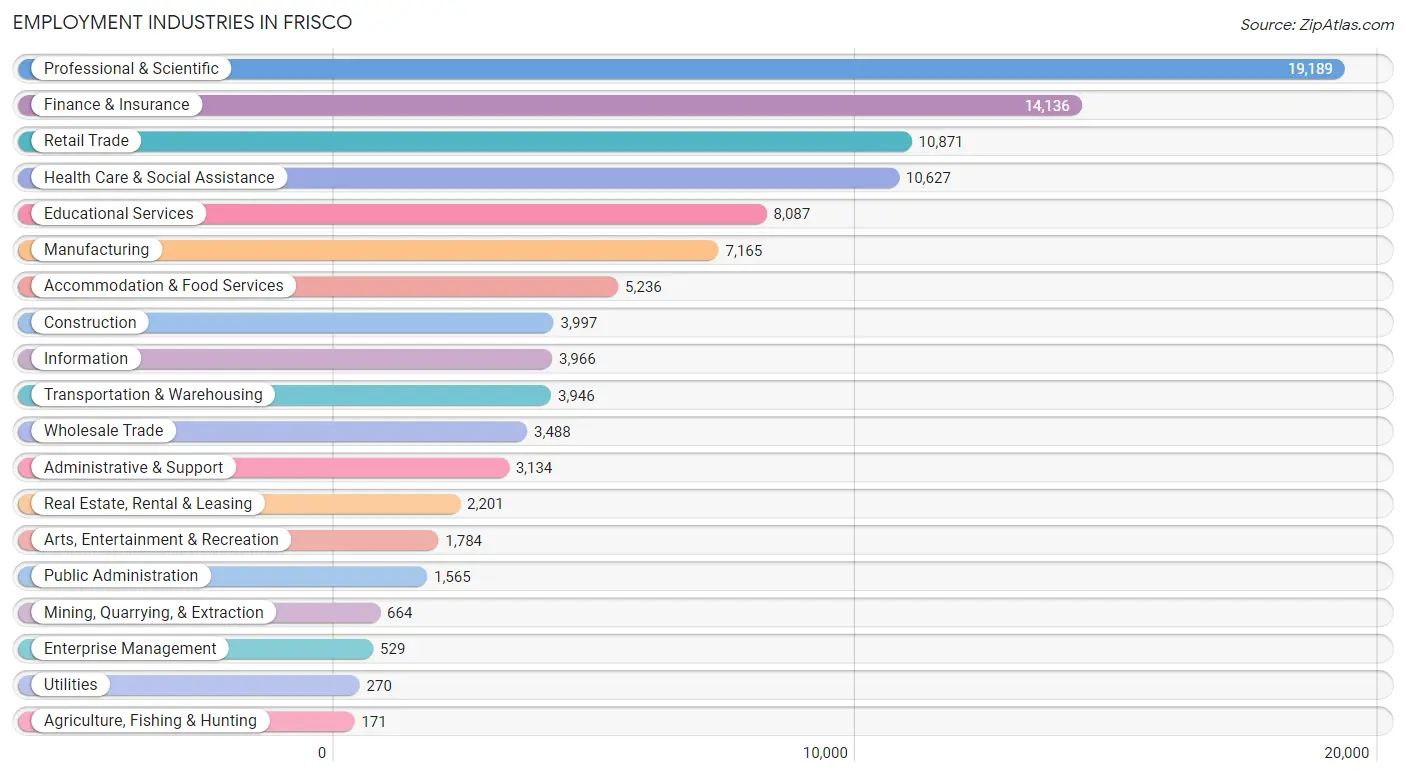
Employment Industries in Frisco
The major employment industries in Frisco include Professional & Scientific (19,189 | 18.3%), Finance & Insurance (14,136 | 13.5%), Retail Trade (10,871 | 10.3%), Health Care & Social Assistance (10,627 | 10.1%), and Educational Services (8,087 | 7.7%).
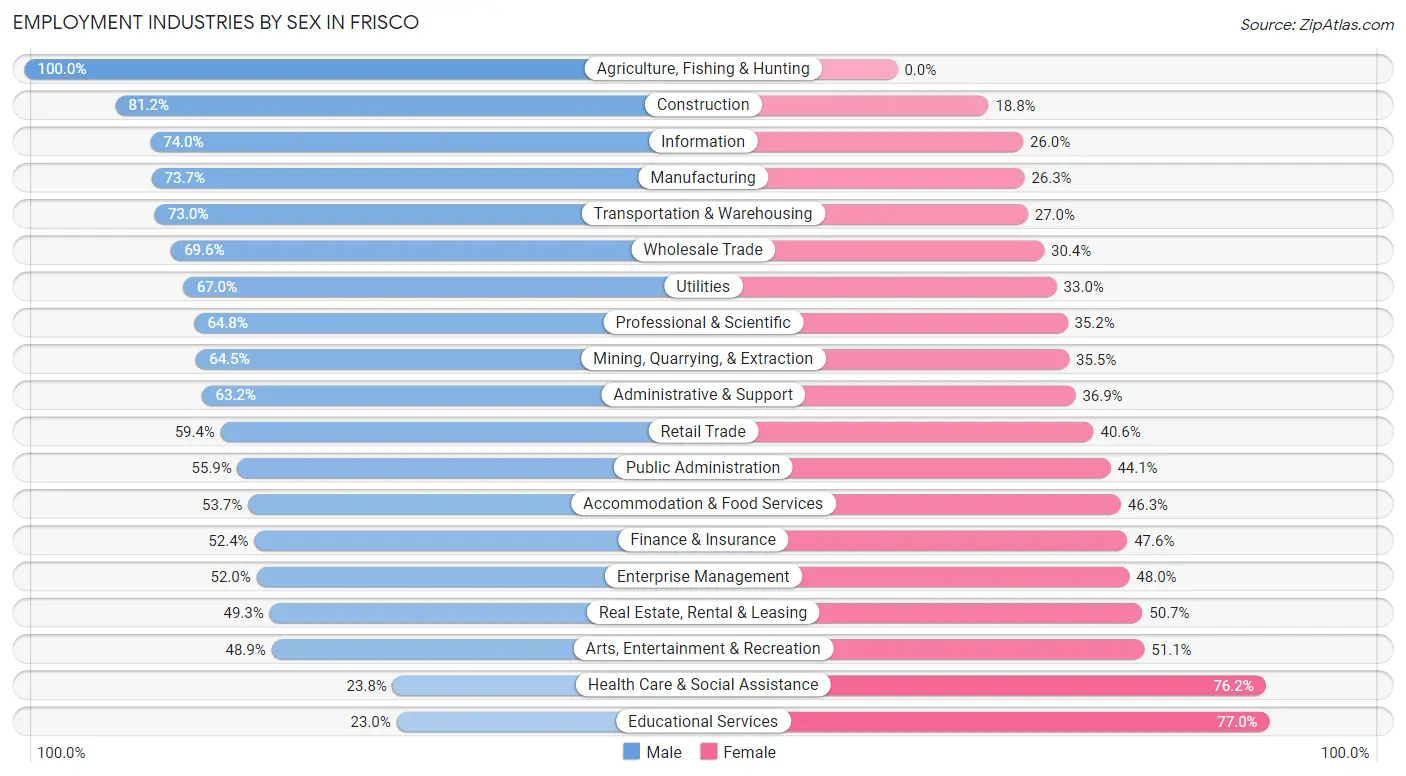
Employment Industries by Sex in Frisco
The Frisco industries that see more men than women are Agriculture, Fishing & Hunting (100.0%), Construction (81.2%), and Information (74.0%), whereas the industries that tend to have a higher number of women are Educational Services (77.0%), Health Care & Social Assistance (76.2%), and Arts, Entertainment & Recreation (51.1%).
| Industry | Male | Female |
| Agriculture, Fishing & Hunting | 171 (100.0%) | 0 (0.0%) |
| Mining, Quarrying, & Extraction | 428 (64.5%) | 236 (35.5%) |
| Construction | 3,244 (81.2%) | 753 (18.8%) |
| Manufacturing | 5,281 (73.7%) | 1,884 (26.3%) |
| Wholesale Trade | 2,429 (69.6%) | 1,059 (30.4%) |
| Retail Trade | 6,458 (59.4%) | 4,413 (40.6%) |
| Transportation & Warehousing | 2,881 (73.0%) | 1,065 (27.0%) |
| Utilities | 181 (67.0%) | 89 (33.0%) |
| Information | 2,934 (74.0%) | 1,032 (26.0%) |
| Finance & Insurance | 7,412 (52.4%) | 6,724 (47.6%) |
| Real Estate, Rental & Leasing | 1,085 (49.3%) | 1,116 (50.7%) |
| Professional & Scientific | 12,434 (64.8%) | 6,755 (35.2%) |
| Enterprise Management | 275 (52.0%) | 254 (48.0%) |
| Administrative & Support | 1,979 (63.1%) | 1,155 (36.8%) |
| Educational Services | 1,861 (23.0%) | 6,226 (77.0%) |
| Health Care & Social Assistance | 2,531 (23.8%) | 8,096 (76.2%) |
| Arts, Entertainment & Recreation | 872 (48.9%) | 912 (51.1%) |
| Accommodation & Food Services | 2,814 (53.7%) | 2,422 (46.3%) |
| Public Administration | 875 (55.9%) | 690 (44.1%) |
| Total | 57,584 (54.8%) | 47,515 (45.2%) |
Education in Frisco
School Enrollment in Frisco
The most common levels of schooling among the 62,100 students in Frisco are high school (15,716 | 25.3%), middle school (14,093 | 22.7%), and elementary school (13,110 | 21.1%).
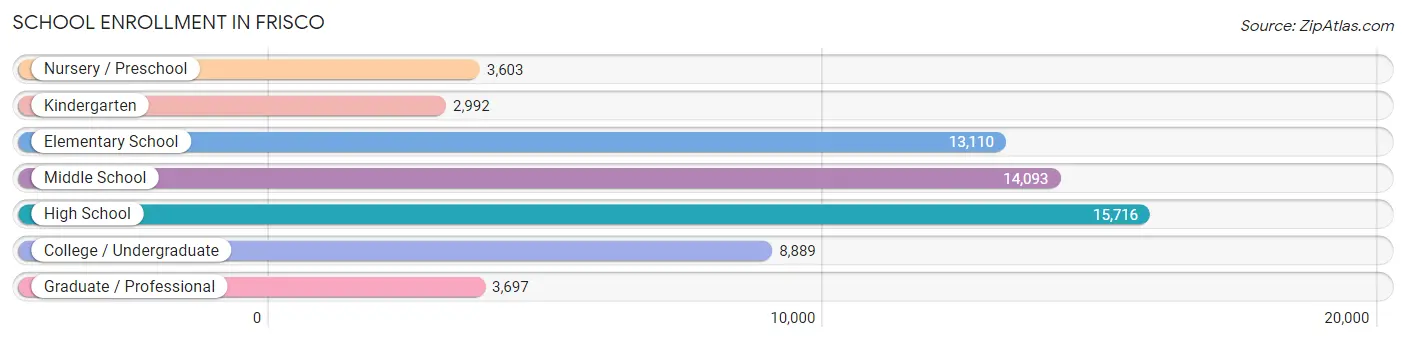
| School Level | # Students | % Students |
| Nursery / Preschool | 3,603 | 5.8% |
| Kindergarten | 2,992 | 4.8% |
| Elementary School | 13,110 | 21.1% |
| Middle School | 14,093 | 22.7% |
| High School | 15,716 | 25.3% |
| College / Undergraduate | 8,889 | 14.3% |
| Graduate / Professional | 3,697 | 5.9% |
| Total | 62,100 | 100.0% |
School Enrollment by Age by Funding Source in Frisco
Out of a total of 62,100 students who are enrolled in schools in Frisco, 9,315 (15.0%) attend a private institution, while the remaining 52,785 (85.0%) are enrolled in public schools. The age group of 3 to 4 year olds has the highest likelihood of being enrolled in private schools, with 1,839 (66.1% in the age bracket) enrolled. Conversely, the age group of 10 to 14 year olds has the lowest likelihood of being enrolled in a private school, with 16,998 (93.5% in the age bracket) attending a public institution.
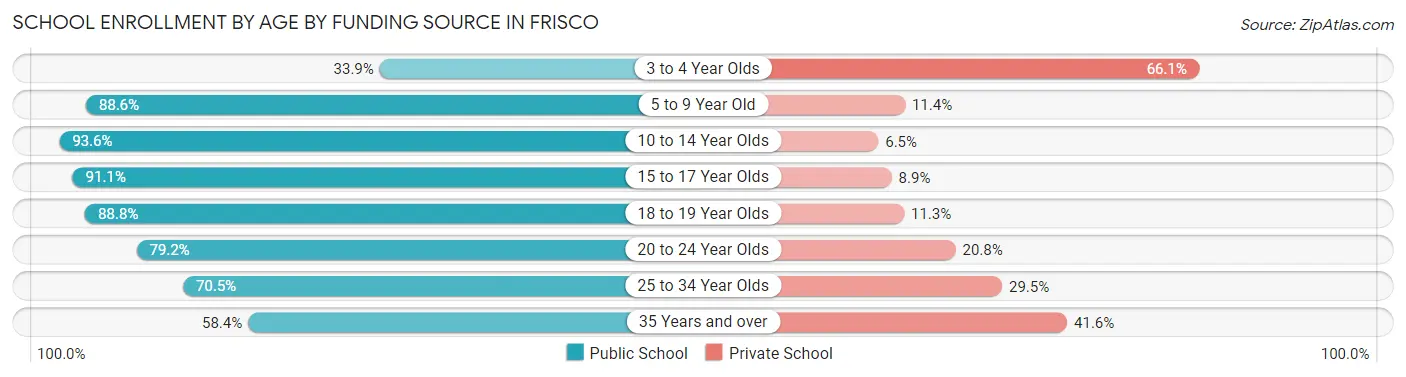
| Age Bracket | Public School | Private School |
| 3 to 4 Year Olds | 942 (33.9%) | 1,839 (66.1%) |
| 5 to 9 Year Old | 13,504 (88.6%) | 1,741 (11.4%) |
| 10 to 14 Year Olds | 16,998 (93.5%) | 1,172 (6.5%) |
| 15 to 17 Year Olds | 10,602 (91.1%) | 1,041 (8.9%) |
| 18 to 19 Year Olds | 3,976 (88.7%) | 504 (11.3%) |
| 20 to 24 Year Olds | 3,233 (79.2%) | 851 (20.8%) |
| 25 to 34 Year Olds | 1,233 (70.5%) | 516 (29.5%) |
| 35 Years and over | 2,305 (58.4%) | 1,643 (41.6%) |
| Total | 52,785 (85.0%) | 9,315 (15.0%) |
Educational Attainment by Field of Study in Frisco
Business (24,112 | 26.5%), engineering (13,330 | 14.6%), computers & mathematics (8,704 | 9.6%), science & technology (7,988 | 8.8%), and education (5,645 | 6.2%) are the most common fields of study among 90,987 individuals in Frisco who have obtained a bachelor's degree or higher.
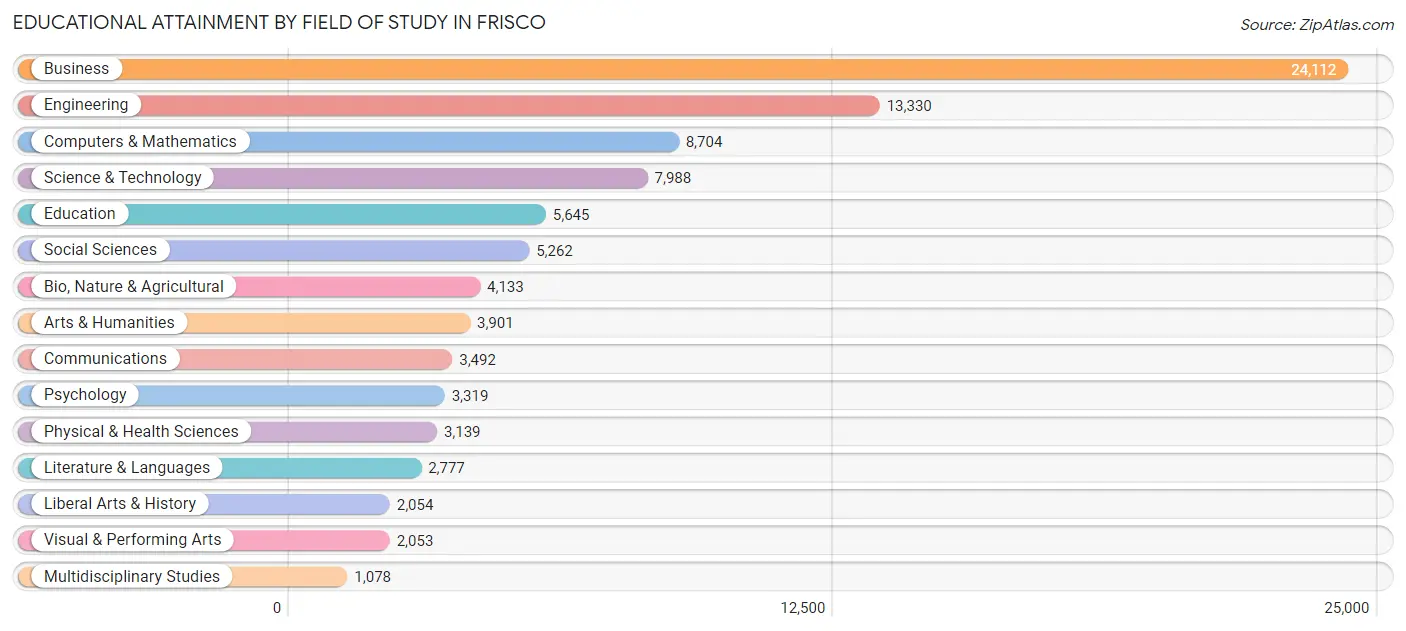
| Field of Study | # Graduates | % Graduates |
| Computers & Mathematics | 8,704 | 9.6% |
| Bio, Nature & Agricultural | 4,133 | 4.5% |
| Physical & Health Sciences | 3,139 | 3.5% |
| Psychology | 3,319 | 3.6% |
| Social Sciences | 5,262 | 5.8% |
| Engineering | 13,330 | 14.6% |
| Multidisciplinary Studies | 1,078 | 1.2% |
| Science & Technology | 7,988 | 8.8% |
| Business | 24,112 | 26.5% |
| Education | 5,645 | 6.2% |
| Literature & Languages | 2,777 | 3.0% |
| Liberal Arts & History | 2,054 | 2.3% |
| Visual & Performing Arts | 2,053 | 2.3% |
| Communications | 3,492 | 3.8% |
| Arts & Humanities | 3,901 | 4.3% |
| Total | 90,987 | 100.0% |
Transportation & Commute in Frisco
Vehicle Availability by Sex in Frisco
The most prevalent vehicle ownership categories in Frisco are males with 2 vehicles (29,304, accounting for 51.1%) and females with 2 vehicles (22,158, making up 62.9%).
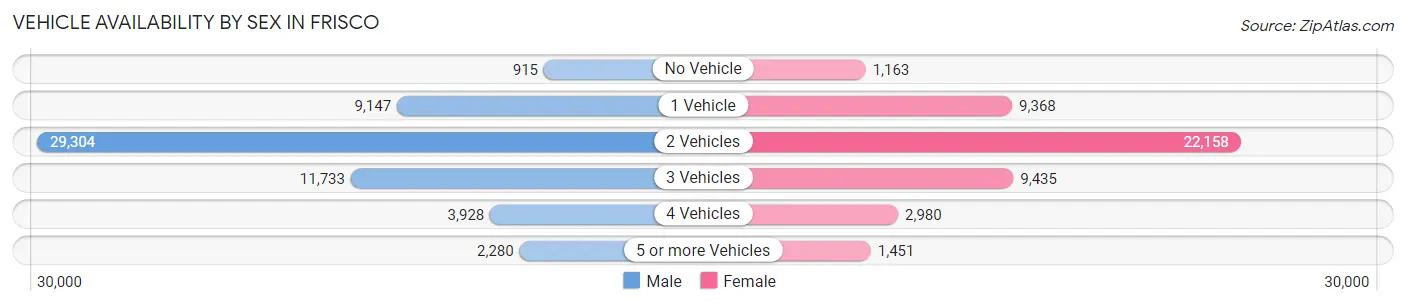
| Vehicles Available | Male | Female |
| No Vehicle | 915 (1.6%) | 1,163 (2.5%) |
| 1 Vehicle | 9,147 (16.0%) | 9,368 (20.1%) |
| 2 Vehicles | 29,304 (51.1%) | 22,158 (47.6%) |
| 3 Vehicles | 11,733 (20.5%) | 9,435 (20.3%) |
| 4 Vehicles | 3,928 (6.9%) | 2,980 (6.4%) |
| 5 or more Vehicles | 2,280 (4.0%) | 1,451 (3.1%) |
| Total | 57,307 (100.0%) | 46,555 (100.0%) |
Commute Time in Frisco
The most frequently occuring commute durations in Frisco are 15 to 19 minutes (11,074 commuters, 15.1%), 30 to 34 minutes (10,700 commuters, 14.6%), and 45 to 59 minutes (8,471 commuters, 11.6%).
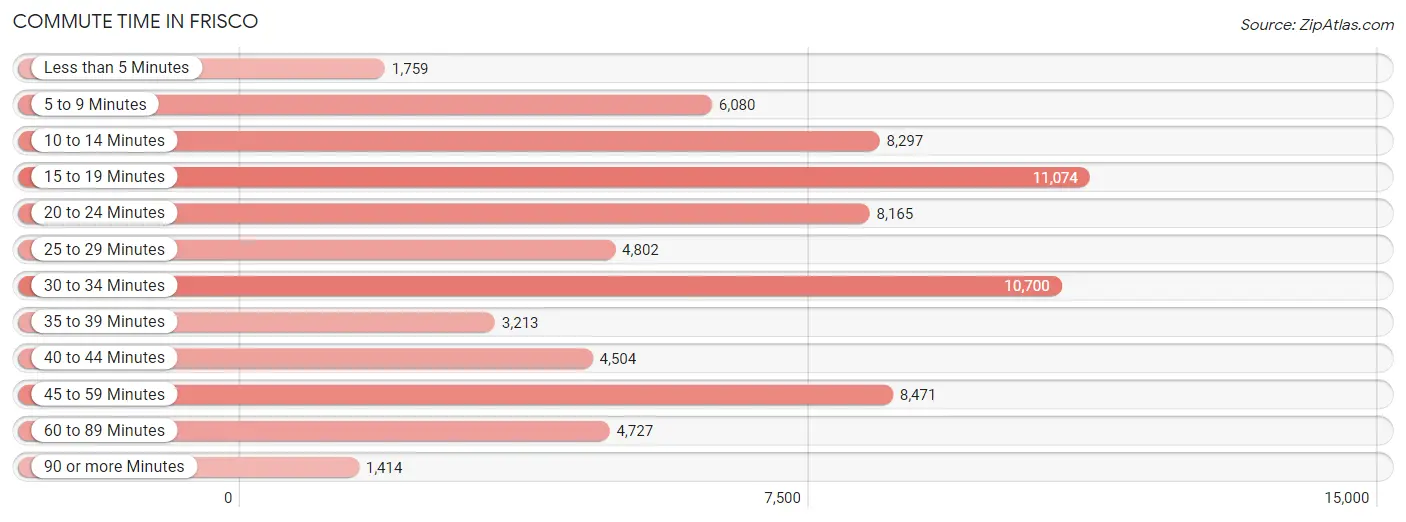
| Commute Time | # Commuters | % Commuters |
| Less than 5 Minutes | 1,759 | 2.4% |
| 5 to 9 Minutes | 6,080 | 8.3% |
| 10 to 14 Minutes | 8,297 | 11.3% |
| 15 to 19 Minutes | 11,074 | 15.1% |
| 20 to 24 Minutes | 8,165 | 11.2% |
| 25 to 29 Minutes | 4,802 | 6.6% |
| 30 to 34 Minutes | 10,700 | 14.6% |
| 35 to 39 Minutes | 3,213 | 4.4% |
| 40 to 44 Minutes | 4,504 | 6.1% |
| 45 to 59 Minutes | 8,471 | 11.6% |
| 60 to 89 Minutes | 4,727 | 6.5% |
| 90 or more Minutes | 1,414 | 1.9% |
Commute Time by Sex in Frisco
The most common commute times in Frisco are 30 to 34 minutes (6,528 commuters, 16.1%) for males and 15 to 19 minutes (5,978 commuters, 18.3%) for females.
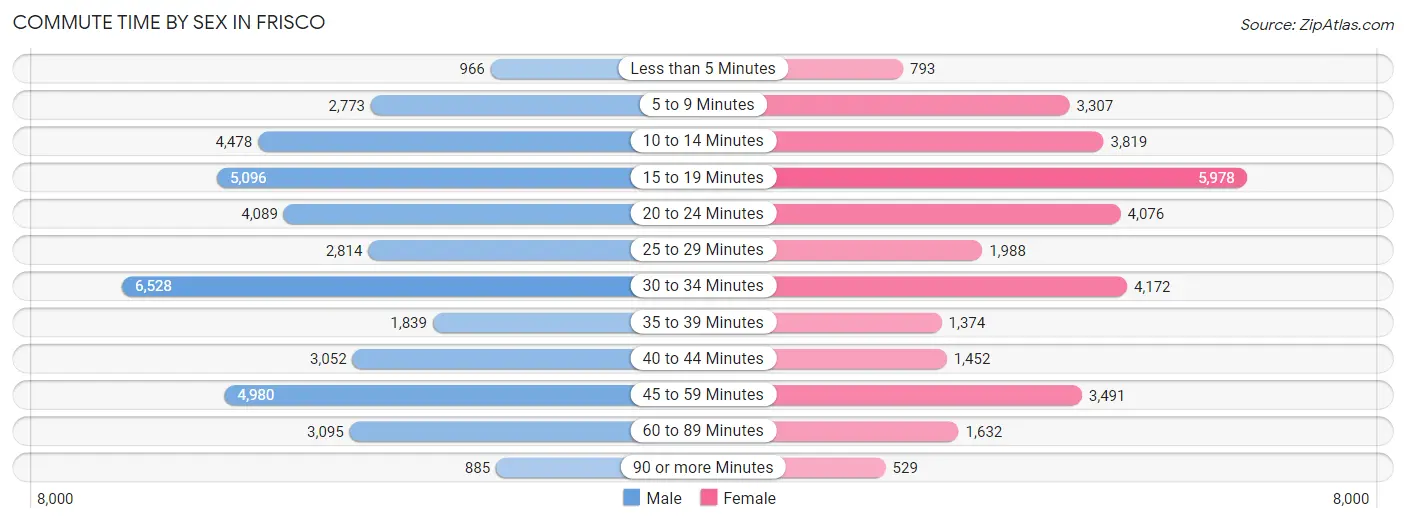
| Commute Time | Male | Female |
| Less than 5 Minutes | 966 (2.4%) | 793 (2.4%) |
| 5 to 9 Minutes | 2,773 (6.8%) | 3,307 (10.1%) |
| 10 to 14 Minutes | 4,478 (11.0%) | 3,819 (11.7%) |
| 15 to 19 Minutes | 5,096 (12.6%) | 5,978 (18.3%) |
| 20 to 24 Minutes | 4,089 (10.1%) | 4,076 (12.5%) |
| 25 to 29 Minutes | 2,814 (6.9%) | 1,988 (6.1%) |
| 30 to 34 Minutes | 6,528 (16.1%) | 4,172 (12.8%) |
| 35 to 39 Minutes | 1,839 (4.5%) | 1,374 (4.2%) |
| 40 to 44 Minutes | 3,052 (7.5%) | 1,452 (4.4%) |
| 45 to 59 Minutes | 4,980 (12.3%) | 3,491 (10.7%) |
| 60 to 89 Minutes | 3,095 (7.6%) | 1,632 (5.0%) |
| 90 or more Minutes | 885 (2.2%) | 529 (1.6%) |
Time of Departure to Work by Sex in Frisco
The most frequent times of departure to work in Frisco are 7:00 AM to 7:29 AM (6,296, 15.5%) for males and 8:00 AM to 8:29 AM (5,275, 16.2%) for females.
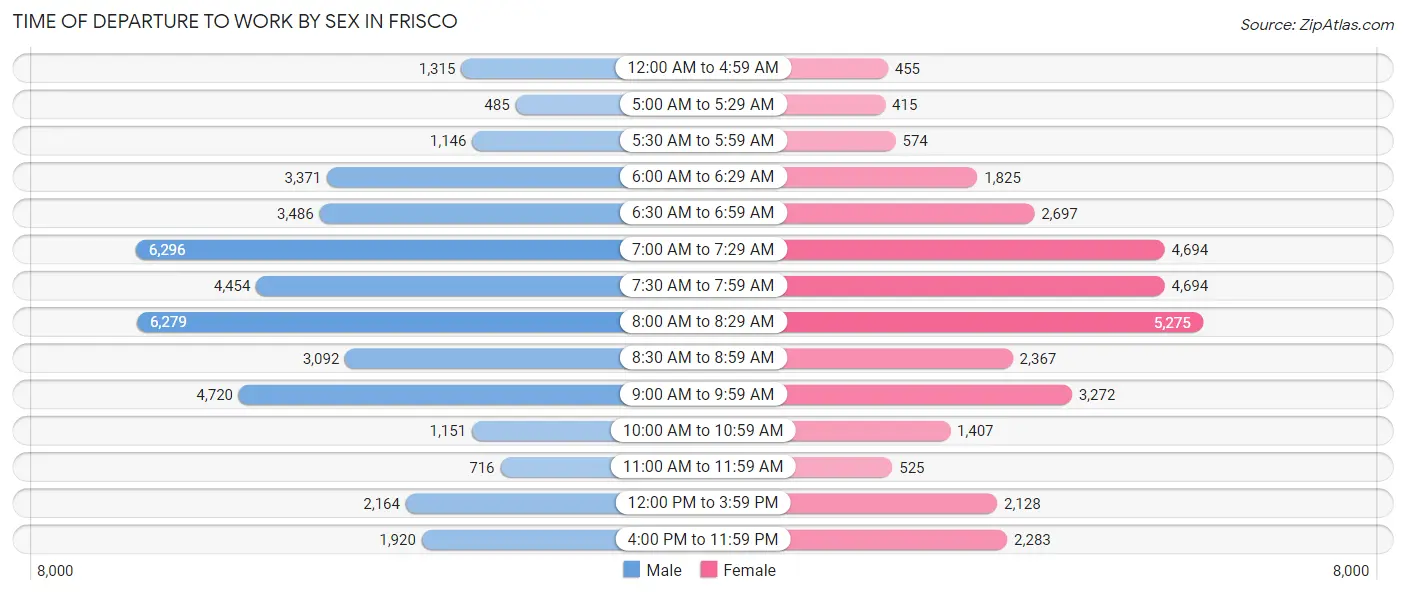
| Time of Departure | Male | Female |
| 12:00 AM to 4:59 AM | 1,315 (3.2%) | 455 (1.4%) |
| 5:00 AM to 5:29 AM | 485 (1.2%) | 415 (1.3%) |
| 5:30 AM to 5:59 AM | 1,146 (2.8%) | 574 (1.8%) |
| 6:00 AM to 6:29 AM | 3,371 (8.3%) | 1,825 (5.6%) |
| 6:30 AM to 6:59 AM | 3,486 (8.6%) | 2,697 (8.3%) |
| 7:00 AM to 7:29 AM | 6,296 (15.5%) | 4,694 (14.4%) |
| 7:30 AM to 7:59 AM | 4,454 (11.0%) | 4,694 (14.4%) |
| 8:00 AM to 8:29 AM | 6,279 (15.5%) | 5,275 (16.2%) |
| 8:30 AM to 8:59 AM | 3,092 (7.6%) | 2,367 (7.3%) |
| 9:00 AM to 9:59 AM | 4,720 (11.6%) | 3,272 (10.0%) |
| 10:00 AM to 10:59 AM | 1,151 (2.8%) | 1,407 (4.3%) |
| 11:00 AM to 11:59 AM | 716 (1.8%) | 525 (1.6%) |
| 12:00 PM to 3:59 PM | 2,164 (5.3%) | 2,128 (6.5%) |
| 4:00 PM to 11:59 PM | 1,920 (4.7%) | 2,283 (7.0%) |
| Total | 40,595 (100.0%) | 32,611 (100.0%) |
Housing Occupancy in Frisco
Occupancy by Ownership in Frisco
Of the total 70,502 dwellings in Frisco, owner-occupied units account for 47,364 (67.2%), while renter-occupied units make up 23,138 (32.8%).
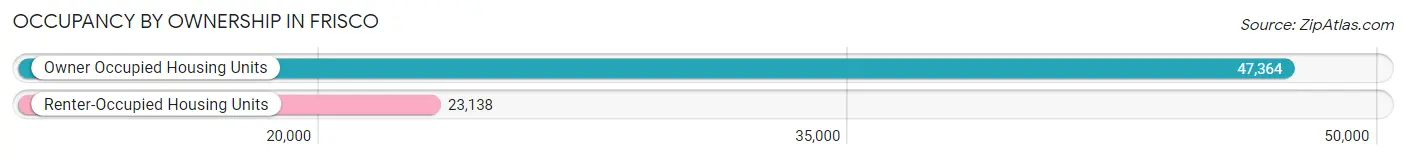
| Occupancy | # Housing Units | % Housing Units |
| Owner Occupied Housing Units | 47,364 | 67.2% |
| Renter-Occupied Housing Units | 23,138 | 32.8% |
| Total Occupied Housing Units | 70,502 | 100.0% |
Occupancy by Household Size in Frisco
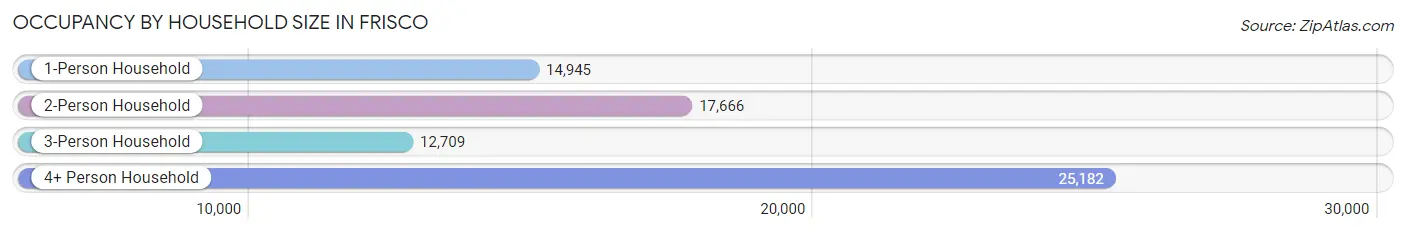
| Household Size | # Housing Units | % Housing Units |
| 1-Person Household | 14,945 | 21.2% |
| 2-Person Household | 17,666 | 25.1% |
| 3-Person Household | 12,709 | 18.0% |
| 4+ Person Household | 25,182 | 35.7% |
| Total Housing Units | 70,502 | 100.0% |
Occupancy by Ownership by Household Size in Frisco
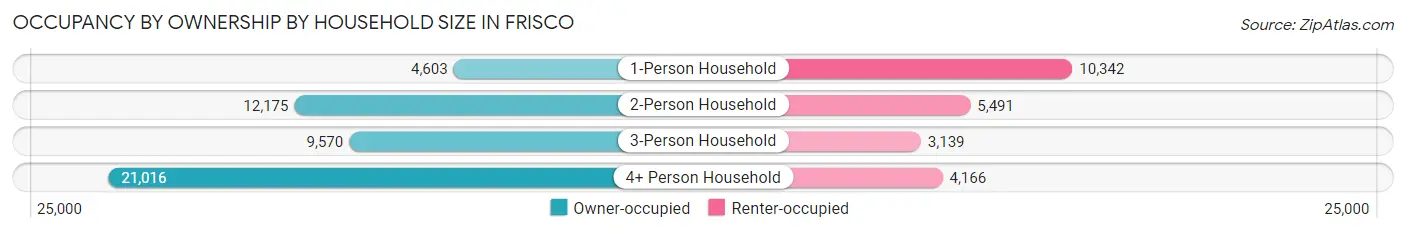
| Household Size | Owner-occupied | Renter-occupied |
| 1-Person Household | 4,603 (30.8%) | 10,342 (69.2%) |
| 2-Person Household | 12,175 (68.9%) | 5,491 (31.1%) |
| 3-Person Household | 9,570 (75.3%) | 3,139 (24.7%) |
| 4+ Person Household | 21,016 (83.5%) | 4,166 (16.5%) |
| Total Housing Units | 47,364 (67.2%) | 23,138 (32.8%) |
Occupancy by Educational Attainment in Frisco
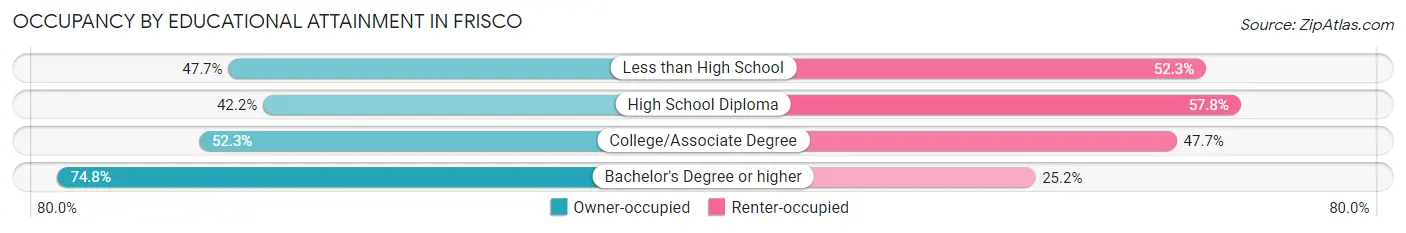
| Household Size | Owner-occupied | Renter-occupied |
| Less than High School | 728 (47.7%) | 799 (52.3%) |
| High School Diploma | 2,216 (42.2%) | 3,037 (57.8%) |
| College/Associate Degree | 7,522 (52.3%) | 6,849 (47.7%) |
| Bachelor's Degree or higher | 36,898 (74.8%) | 12,453 (25.2%) |
Occupancy by Age of Householder in Frisco
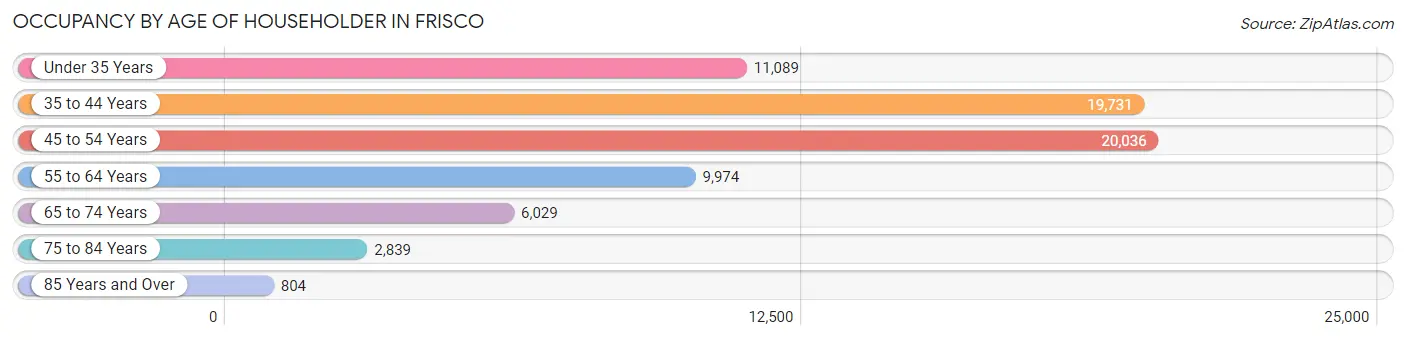
| Age Bracket | # Households | % Households |
| Under 35 Years | 11,089 | 15.7% |
| 35 to 44 Years | 19,731 | 28.0% |
| 45 to 54 Years | 20,036 | 28.4% |
| 55 to 64 Years | 9,974 | 14.1% |
| 65 to 74 Years | 6,029 | 8.6% |
| 75 to 84 Years | 2,839 | 4.0% |
| 85 Years and Over | 804 | 1.1% |
| Total | 70,502 | 100.0% |
Housing Finances in Frisco
Median Income by Occupancy in Frisco
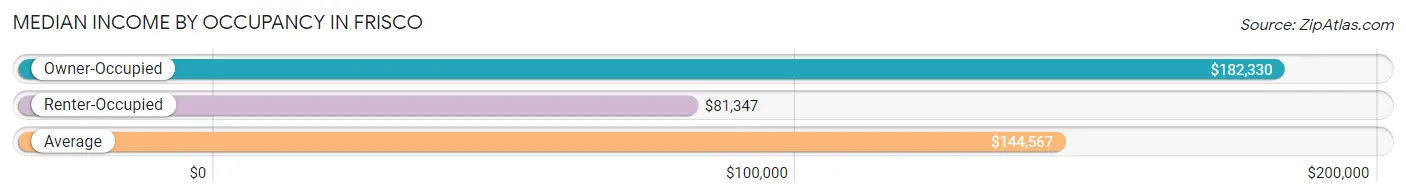
| Occupancy Type | # Households | Median Income |
| Owner-Occupied | 47,364 (67.2%) | $182,330 |
| Renter-Occupied | 23,138 (32.8%) | $81,347 |
| Average | 70,502 (100.0%) | $144,567 |
Occupancy by Householder Income Bracket in Frisco
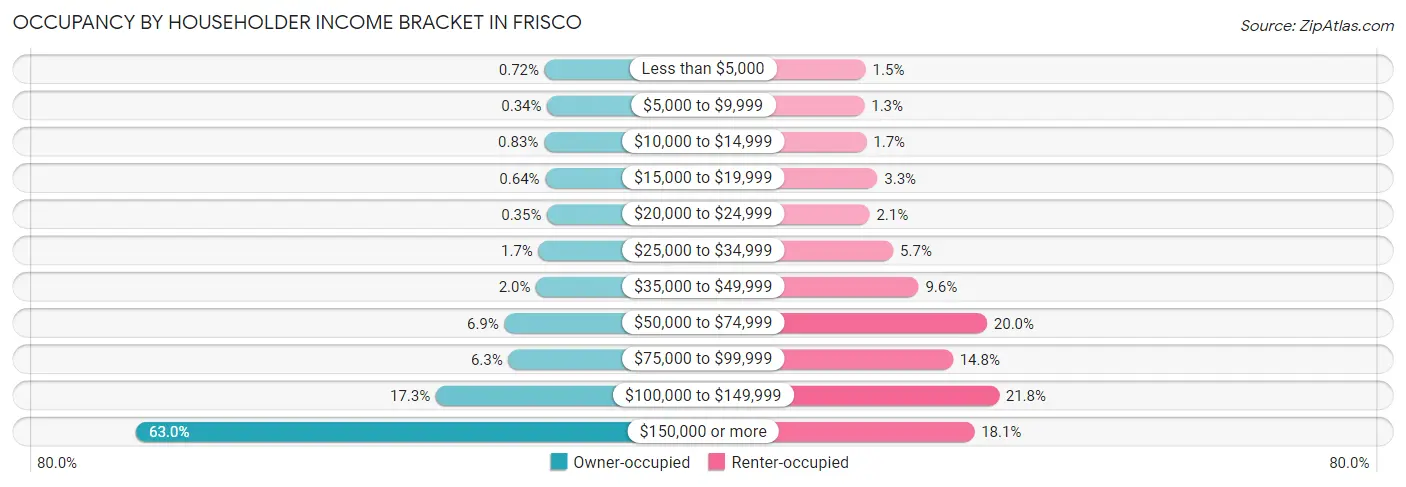
| Income Bracket | Owner-occupied | Renter-occupied |
| Less than $5,000 | 342 (0.7%) | 357 (1.5%) |
| $5,000 to $9,999 | 162 (0.3%) | 307 (1.3%) |
| $10,000 to $14,999 | 392 (0.8%) | 382 (1.7%) |
| $15,000 to $19,999 | 303 (0.6%) | 769 (3.3%) |
| $20,000 to $24,999 | 168 (0.4%) | 490 (2.1%) |
| $25,000 to $34,999 | 784 (1.7%) | 1,326 (5.7%) |
| $35,000 to $49,999 | 963 (2.0%) | 2,218 (9.6%) |
| $50,000 to $74,999 | 3,248 (6.9%) | 4,629 (20.0%) |
| $75,000 to $99,999 | 2,964 (6.3%) | 3,427 (14.8%) |
| $100,000 to $149,999 | 8,192 (17.3%) | 5,050 (21.8%) |
| $150,000 or more | 29,846 (63.0%) | 4,183 (18.1%) |
| Total | 47,364 (100.0%) | 23,138 (100.0%) |
Monthly Housing Cost Tiers in Frisco
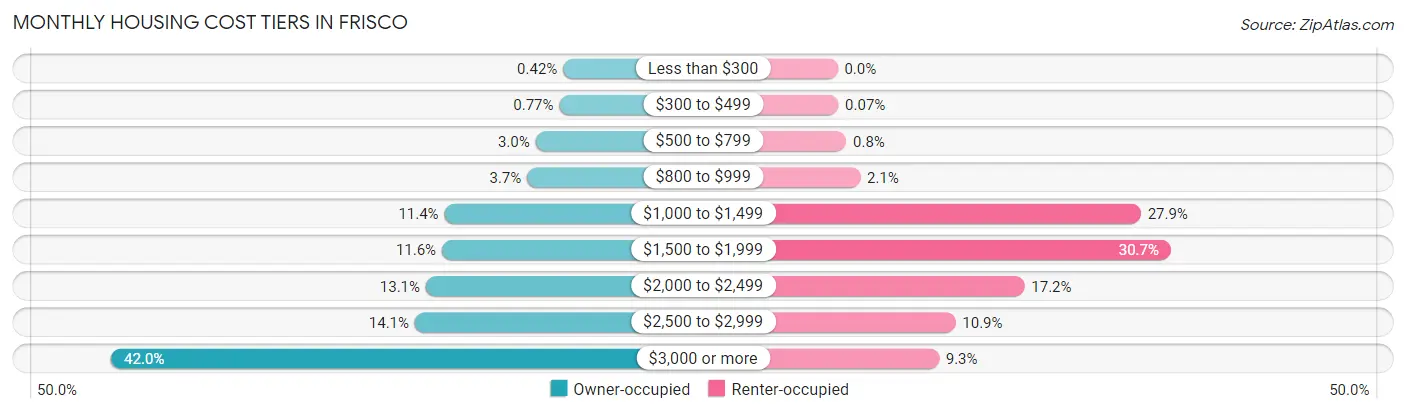
| Monthly Cost | Owner-occupied | Renter-occupied |
| Less than $300 | 200 (0.4%) | 0 (0.0%) |
| $300 to $499 | 363 (0.8%) | 16 (0.1%) |
| $500 to $799 | 1,404 (3.0%) | 185 (0.8%) |
| $800 to $999 | 1,773 (3.7%) | 481 (2.1%) |
| $1,000 to $1,499 | 5,378 (11.4%) | 6,461 (27.9%) |
| $1,500 to $1,999 | 5,483 (11.6%) | 7,100 (30.7%) |
| $2,000 to $2,499 | 6,186 (13.1%) | 3,982 (17.2%) |
| $2,500 to $2,999 | 6,663 (14.1%) | 2,512 (10.9%) |
| $3,000 or more | 19,914 (42.0%) | 2,159 (9.3%) |
| Total | 47,364 (100.0%) | 23,138 (100.0%) |
Physical Housing Characteristics in Frisco
Housing Structures in Frisco
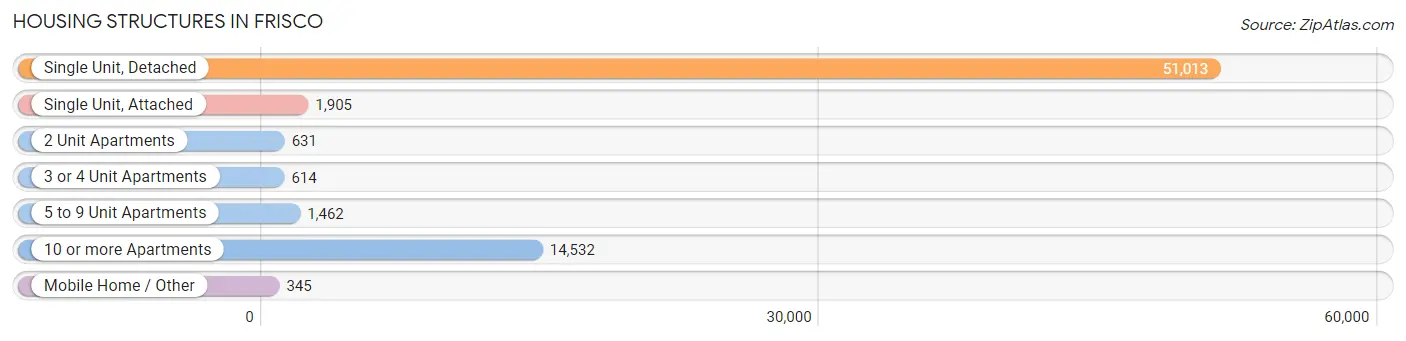
| Structure Type | # Housing Units | % Housing Units |
| Single Unit, Detached | 51,013 | 72.4% |
| Single Unit, Attached | 1,905 | 2.7% |
| 2 Unit Apartments | 631 | 0.9% |
| 3 or 4 Unit Apartments | 614 | 0.9% |
| 5 to 9 Unit Apartments | 1,462 | 2.1% |
| 10 or more Apartments | 14,532 | 20.6% |
| Mobile Home / Other | 345 | 0.5% |
| Total | 70,502 | 100.0% |
Housing Structures by Occupancy in Frisco
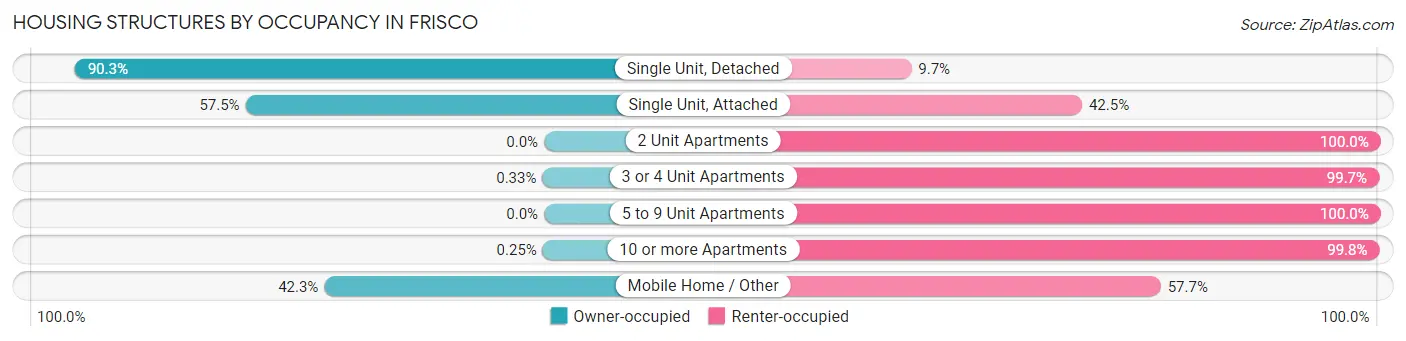
| Structure Type | Owner-occupied | Renter-occupied |
| Single Unit, Detached | 46,085 (90.3%) | 4,928 (9.7%) |
| Single Unit, Attached | 1,095 (57.5%) | 810 (42.5%) |
| 2 Unit Apartments | 0 (0.0%) | 631 (100.0%) |
| 3 or 4 Unit Apartments | 2 (0.3%) | 612 (99.7%) |
| 5 to 9 Unit Apartments | 0 (0.0%) | 1,462 (100.0%) |
| 10 or more Apartments | 36 (0.3%) | 14,496 (99.8%) |
| Mobile Home / Other | 146 (42.3%) | 199 (57.7%) |
| Total | 47,364 (67.2%) | 23,138 (32.8%) |
Housing Structures by Number of Rooms in Frisco
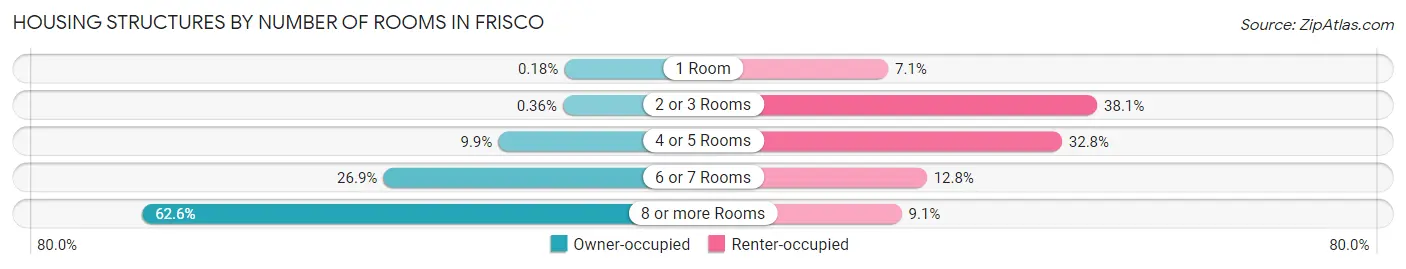
| Number of Rooms | Owner-occupied | Renter-occupied |
| 1 Room | 84 (0.2%) | 1,649 (7.1%) |
| 2 or 3 Rooms | 169 (0.4%) | 8,806 (38.1%) |
| 4 or 5 Rooms | 4,705 (9.9%) | 7,599 (32.8%) |
| 6 or 7 Rooms | 12,759 (26.9%) | 2,971 (12.8%) |
| 8 or more Rooms | 29,647 (62.6%) | 2,113 (9.1%) |
| Total | 47,364 (100.0%) | 23,138 (100.0%) |
Housing Structure by Heating Type in Frisco
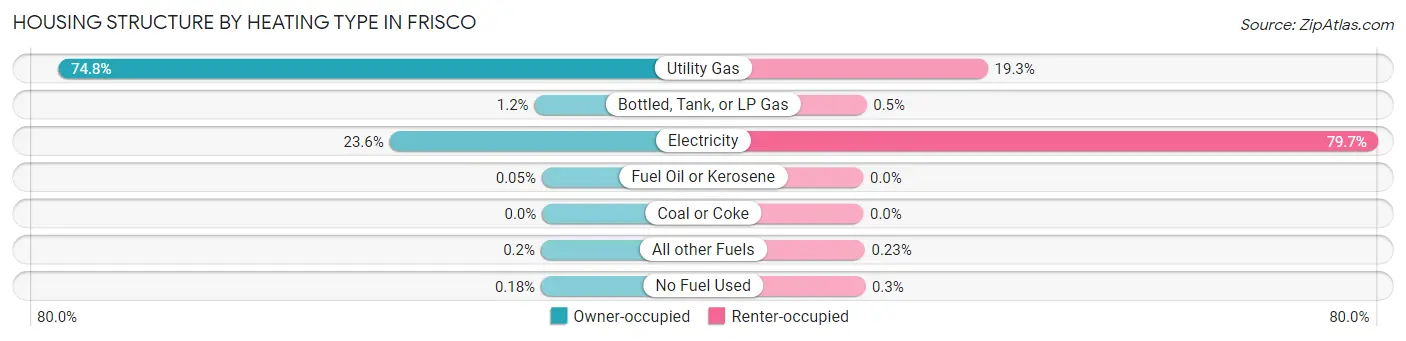
| Heating Type | Owner-occupied | Renter-occupied |
| Utility Gas | 35,435 (74.8%) | 4,457 (19.3%) |
| Bottled, Tank, or LP Gas | 563 (1.2%) | 115 (0.5%) |
| Electricity | 11,167 (23.6%) | 18,444 (79.7%) |
| Fuel Oil or Kerosene | 23 (0.1%) | 0 (0.0%) |
| Coal or Coke | 0 (0.0%) | 0 (0.0%) |
| All other Fuels | 93 (0.2%) | 53 (0.2%) |
| No Fuel Used | 83 (0.2%) | 69 (0.3%) |
| Total | 47,364 (100.0%) | 23,138 (100.0%) |
Household Vehicle Usage in Frisco
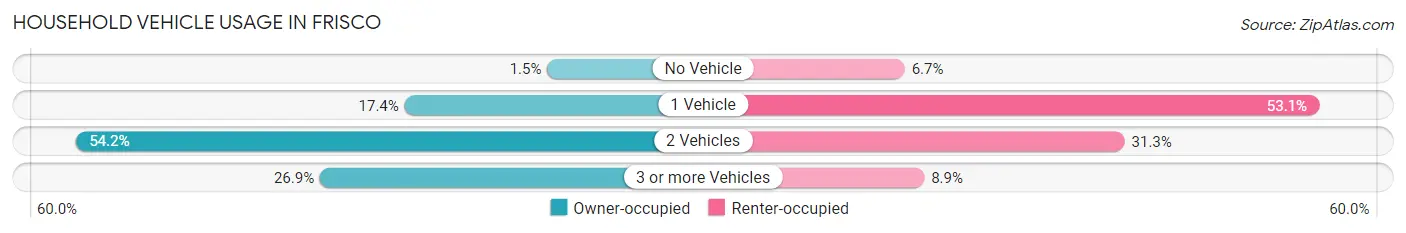
| Vehicles per Household | Owner-occupied | Renter-occupied |
| No Vehicle | 688 (1.5%) | 1,550 (6.7%) |
| 1 Vehicle | 8,254 (17.4%) | 12,284 (53.1%) |
| 2 Vehicles | 25,675 (54.2%) | 7,250 (31.3%) |
| 3 or more Vehicles | 12,747 (26.9%) | 2,054 (8.9%) |
| Total | 47,364 (100.0%) | 23,138 (100.0%) |
Real Estate & Mortgages in Frisco
Real Estate and Mortgage Overview in Frisco
| Characteristic | Without Mortgage | With Mortgage |
| Housing Units | 11,117 | 36,247 |
| Median Property Value | $498,600 | $540,100 |
| Median Household Income | $149,475 | $24,302 |
| Monthly Housing Costs | $1,255 | $19,618 |
| Real Estate Taxes | $8,487 | $345 |
Property Value by Mortgage Status in Frisco
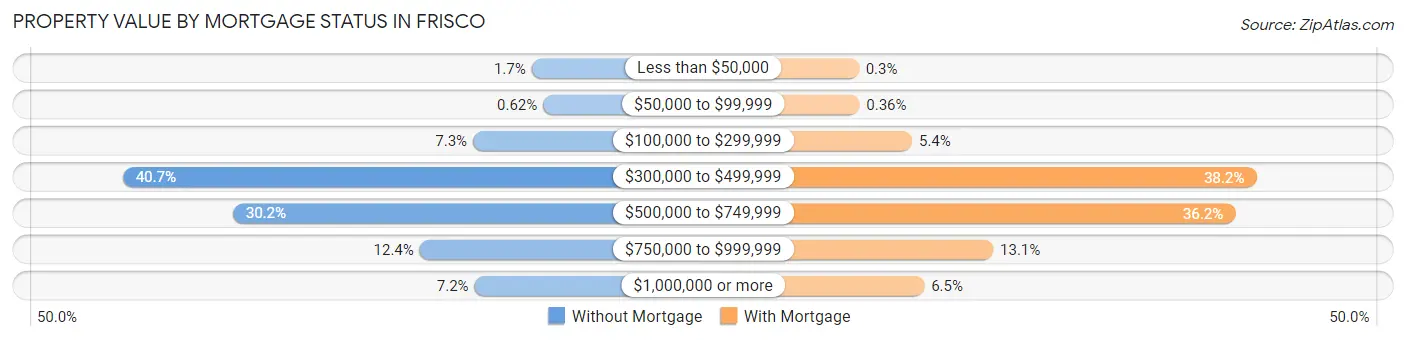
| Property Value | Without Mortgage | With Mortgage |
| Less than $50,000 | 191 (1.7%) | 109 (0.3%) |
| $50,000 to $99,999 | 69 (0.6%) | 129 (0.4%) |
| $100,000 to $299,999 | 812 (7.3%) | 1,950 (5.4%) |
| $300,000 to $499,999 | 4,519 (40.6%) | 13,833 (38.2%) |
| $500,000 to $749,999 | 3,354 (30.2%) | 13,104 (36.1%) |
| $750,000 to $999,999 | 1,376 (12.4%) | 4,750 (13.1%) |
| $1,000,000 or more | 796 (7.2%) | 2,372 (6.5%) |
| Total | 11,117 (100.0%) | 36,247 (100.0%) |
Household Income by Mortgage Status in Frisco
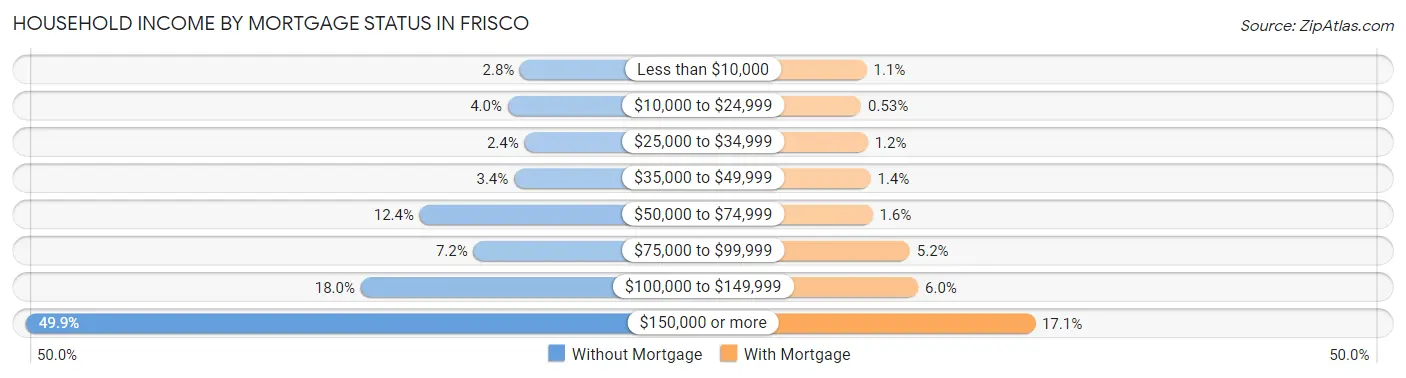
| Household Income | Without Mortgage | With Mortgage |
| Less than $10,000 | 311 (2.8%) | 379 (1.1%) |
| $10,000 to $24,999 | 442 (4.0%) | 193 (0.5%) |
| $25,000 to $34,999 | 266 (2.4%) | 421 (1.2%) |
| $35,000 to $49,999 | 376 (3.4%) | 518 (1.4%) |
| $50,000 to $74,999 | 1,374 (12.4%) | 587 (1.6%) |
| $75,000 to $99,999 | 805 (7.2%) | 1,874 (5.2%) |
| $100,000 to $149,999 | 1,999 (18.0%) | 2,159 (6.0%) |
| $150,000 or more | 5,544 (49.9%) | 6,193 (17.1%) |
| Total | 11,117 (100.0%) | 36,247 (100.0%) |
Property Value to Household Income Ratio in Frisco
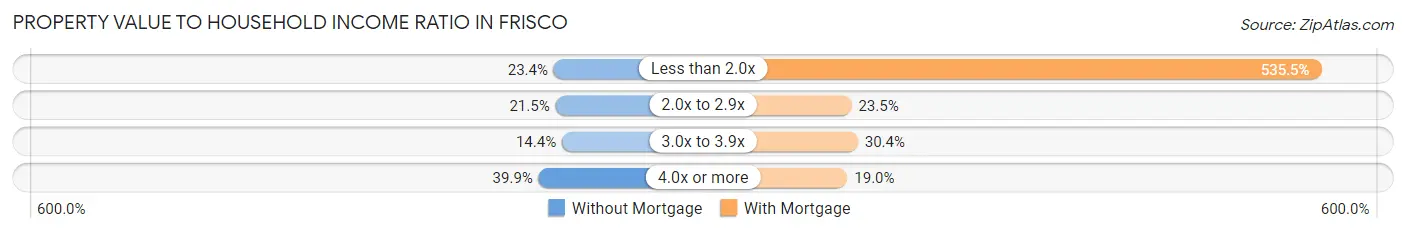
| Value-to-Income Ratio | Without Mortgage | With Mortgage |
| Less than 2.0x | 2,598 (23.4%) | 194,094 (535.5%) |
| 2.0x to 2.9x | 2,390 (21.5%) | 8,519 (23.5%) |
| 3.0x to 3.9x | 1,603 (14.4%) | 11,007 (30.4%) |
| 4.0x or more | 4,431 (39.9%) | 6,895 (19.0%) |
| Total | 11,117 (100.0%) | 36,247 (100.0%) |
Real Estate Taxes by Mortgage Status in Frisco
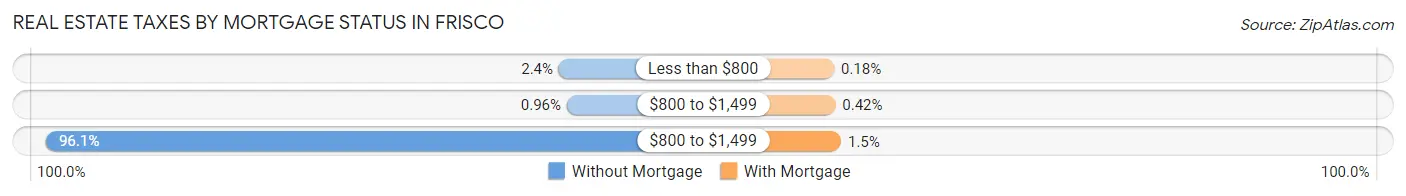
| Property Taxes | Without Mortgage | With Mortgage |
| Less than $800 | 269 (2.4%) | 66 (0.2%) |
| $800 to $1,499 | 107 (1.0%) | 154 (0.4%) |
| $800 to $1,499 | 10,682 (96.1%) | 530 (1.5%) |
| Total | 11,117 (100.0%) | 36,247 (100.0%) |
Health & Disability in Frisco
Health Insurance Coverage by Age in Frisco
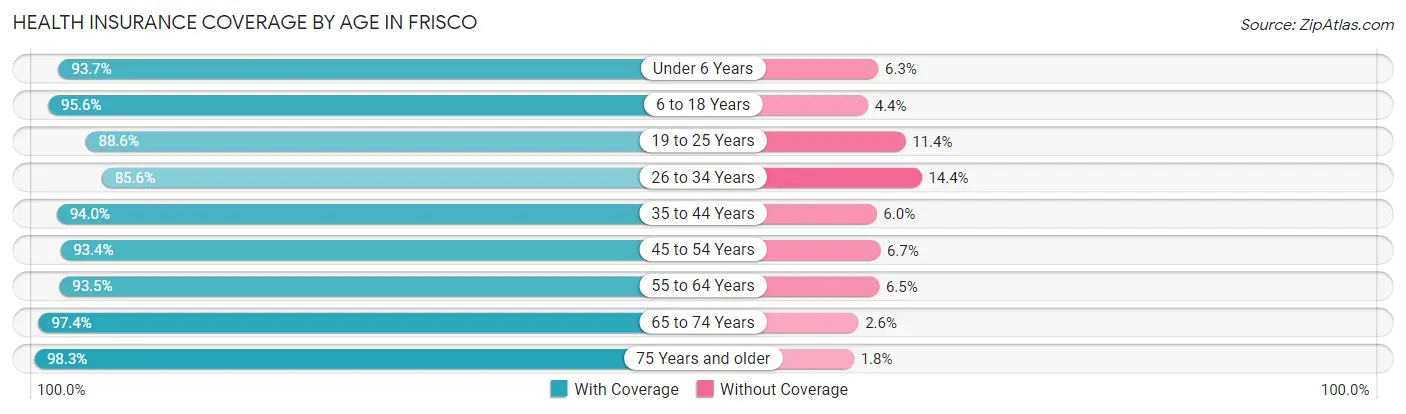
| Age Bracket | With Coverage | Without Coverage |
| Under 6 Years | 13,071 (93.7%) | 879 (6.3%) |
| 6 to 18 Years | 44,065 (95.6%) | 2,020 (4.4%) |
| 19 to 25 Years | 12,921 (88.6%) | 1,657 (11.4%) |
| 26 to 34 Years | 15,480 (85.6%) | 2,603 (14.4%) |
| 35 to 44 Years | 34,247 (94.0%) | 2,182 (6.0%) |
| 45 to 54 Years | 33,369 (93.3%) | 2,378 (6.7%) |
| 55 to 64 Years | 16,433 (93.5%) | 1,136 (6.5%) |
| 65 to 74 Years | 11,014 (97.4%) | 293 (2.6%) |
| 75 Years and older | 7,677 (98.3%) | 137 (1.8%) |
| Total | 188,277 (93.4%) | 13,285 (6.6%) |
Health Insurance Coverage by Citizenship Status in Frisco
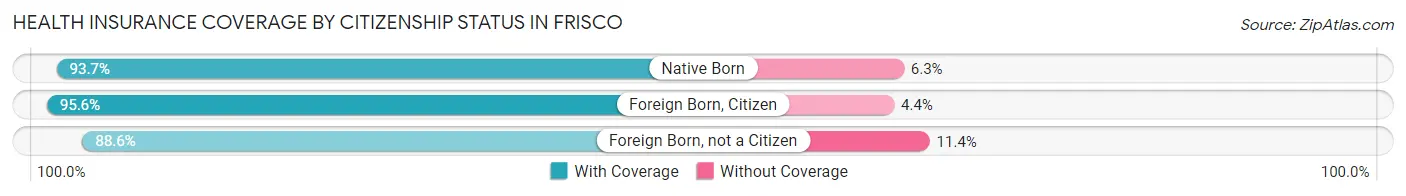
| Citizenship Status | With Coverage | Without Coverage |
| Native Born | 13,071 (93.7%) | 879 (6.3%) |
| Foreign Born, Citizen | 44,065 (95.6%) | 2,020 (4.4%) |
| Foreign Born, not a Citizen | 12,921 (88.6%) | 1,657 (11.4%) |
Health Insurance Coverage by Household Income in Frisco
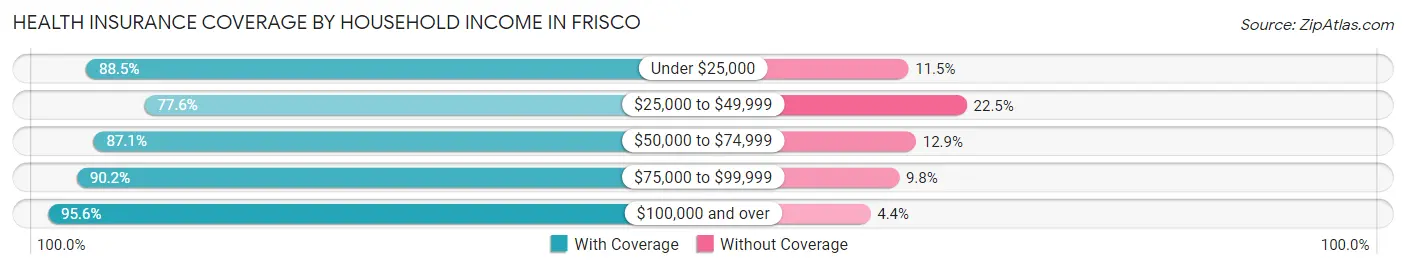
| Household Income | With Coverage | Without Coverage |
| Under $25,000 | 5,032 (88.5%) | 655 (11.5%) |
| $25,000 to $49,999 | 7,449 (77.5%) | 2,156 (22.5%) |
| $50,000 to $74,999 | 14,821 (87.1%) | 2,200 (12.9%) |
| $75,000 to $99,999 | 13,714 (90.2%) | 1,487 (9.8%) |
| $100,000 and over | 147,239 (95.6%) | 6,783 (4.4%) |
Public vs Private Health Insurance Coverage by Age in Frisco
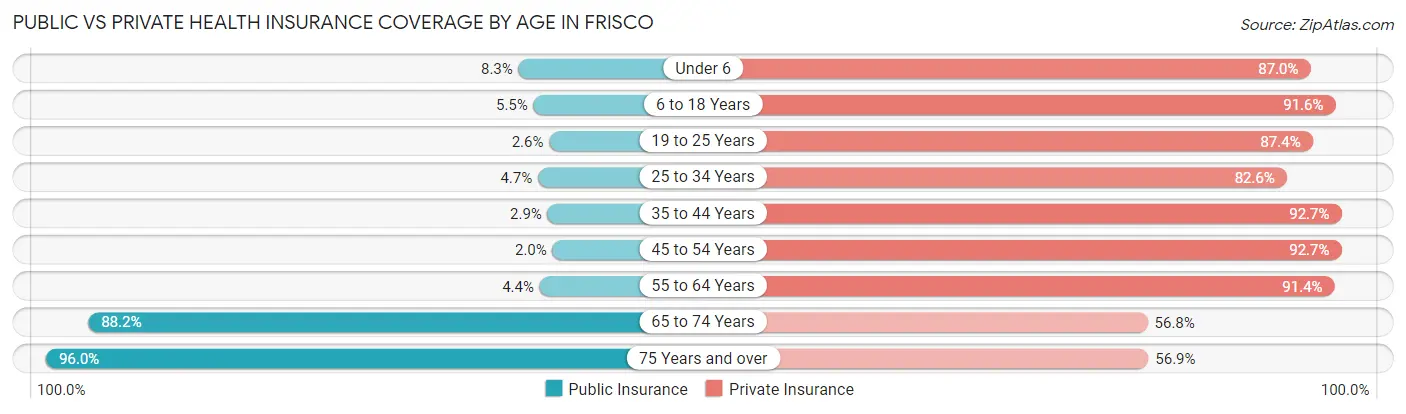
| Age Bracket | Public Insurance | Private Insurance |
| Under 6 | 1,158 (8.3%) | 12,133 (87.0%) |
| 6 to 18 Years | 2,542 (5.5%) | 42,216 (91.6%) |
| 19 to 25 Years | 380 (2.6%) | 12,735 (87.4%) |
| 25 to 34 Years | 850 (4.7%) | 14,931 (82.6%) |
| 35 to 44 Years | 1,060 (2.9%) | 33,775 (92.7%) |
| 45 to 54 Years | 713 (2.0%) | 33,140 (92.7%) |
| 55 to 64 Years | 767 (4.4%) | 16,064 (91.4%) |
| 65 to 74 Years | 9,971 (88.2%) | 6,418 (56.8%) |
| 75 Years and over | 7,504 (96.0%) | 4,446 (56.9%) |
| Total | 24,945 (12.4%) | 175,858 (87.3%) |
Disability Status by Sex by Age in Frisco
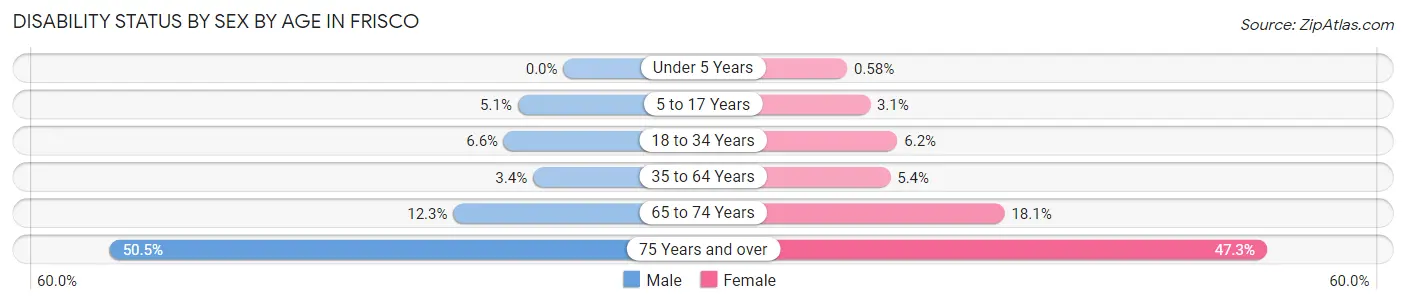
| Age Bracket | Male | Female |
| Under 5 Years | 0 (0.0%) | 29 (0.6%) |
| 5 to 17 Years | 1,198 (5.1%) | 709 (3.1%) |
| 18 to 34 Years | 1,131 (6.6%) | 1,133 (6.2%) |
| 35 to 64 Years | 1,509 (3.4%) | 2,436 (5.4%) |
| 65 to 74 Years | 629 (12.3%) | 1,119 (18.1%) |
| 75 Years and over | 1,513 (50.5%) | 2,281 (47.3%) |
Disability Class by Sex by Age in Frisco
Disability Class: Hearing Difficulty
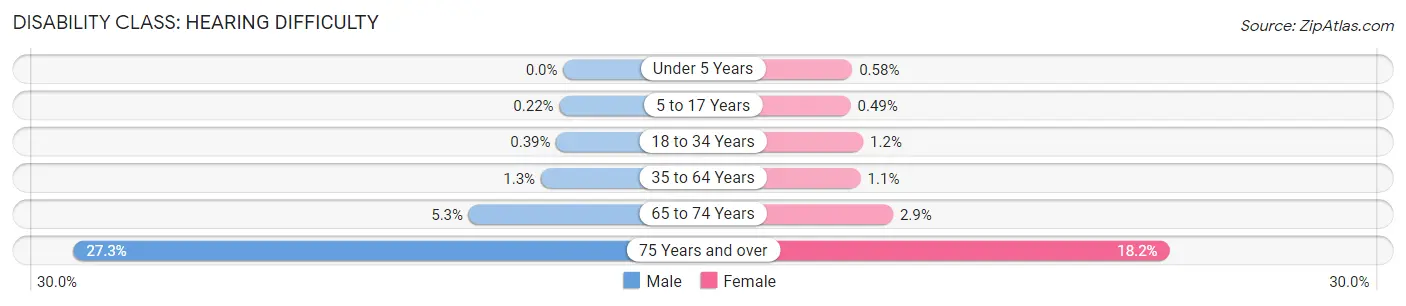
| Age Bracket | Male | Female |
| Under 5 Years | 0 (0.0%) | 29 (0.6%) |
| 5 to 17 Years | 51 (0.2%) | 110 (0.5%) |
| 18 to 34 Years | 67 (0.4%) | 217 (1.2%) |
| 35 to 64 Years | 560 (1.3%) | 472 (1.1%) |
| 65 to 74 Years | 270 (5.3%) | 176 (2.9%) |
| 75 Years and over | 817 (27.3%) | 879 (18.2%) |
Disability Class: Vision Difficulty
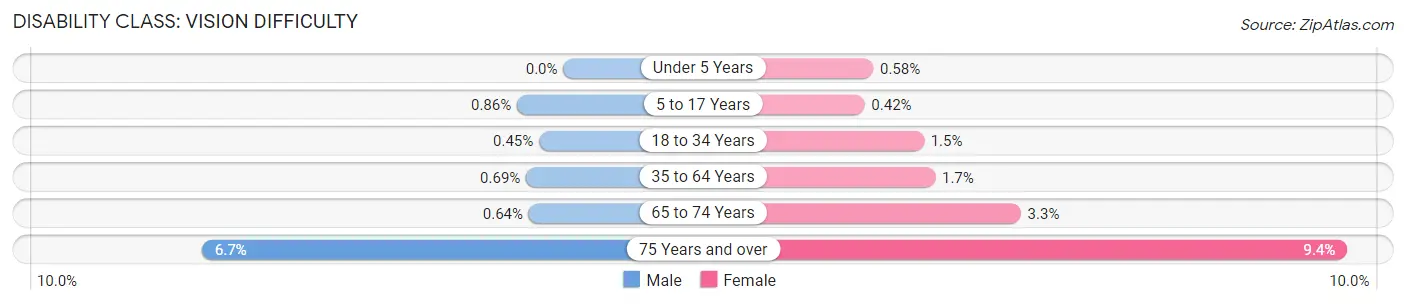
| Age Bracket | Male | Female |
| Under 5 Years | 0 (0.0%) | 29 (0.6%) |
| 5 to 17 Years | 203 (0.9%) | 95 (0.4%) |
| 18 to 34 Years | 77 (0.4%) | 278 (1.5%) |
| 35 to 64 Years | 310 (0.7%) | 780 (1.7%) |
| 65 to 74 Years | 33 (0.6%) | 205 (3.3%) |
| 75 Years and over | 201 (6.7%) | 452 (9.4%) |
Disability Class: Cognitive Difficulty
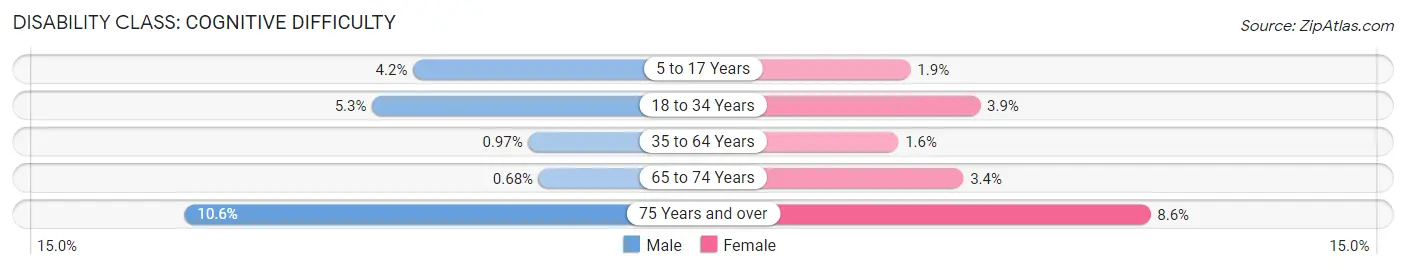
| Age Bracket | Male | Female |
| 5 to 17 Years | 986 (4.2%) | 430 (1.9%) |
| 18 to 34 Years | 908 (5.3%) | 705 (3.8%) |
| 35 to 64 Years | 432 (1.0%) | 709 (1.6%) |
| 65 to 74 Years | 35 (0.7%) | 209 (3.4%) |
| 75 Years and over | 316 (10.5%) | 414 (8.6%) |
Disability Class: Ambulatory Difficulty
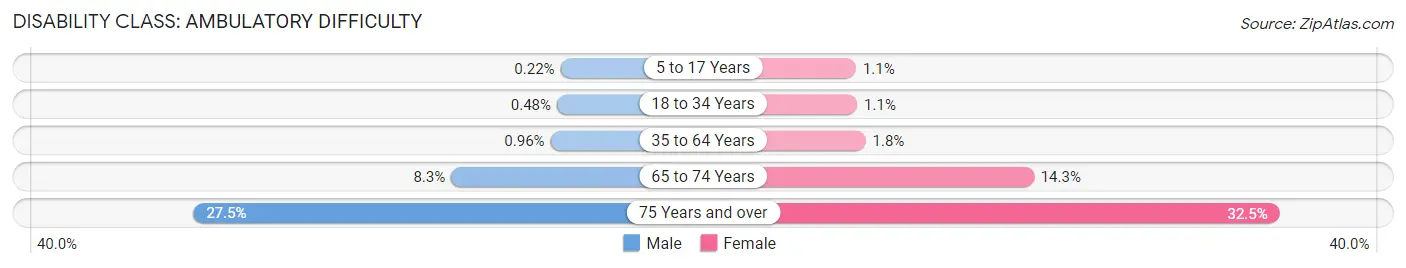
| Age Bracket | Male | Female |
| 5 to 17 Years | 53 (0.2%) | 236 (1.1%) |
| 18 to 34 Years | 82 (0.5%) | 209 (1.1%) |
| 35 to 64 Years | 427 (1.0%) | 798 (1.8%) |
| 65 to 74 Years | 428 (8.3%) | 880 (14.2%) |
| 75 Years and over | 823 (27.5%) | 1,566 (32.5%) |
Disability Class: Self-Care Difficulty
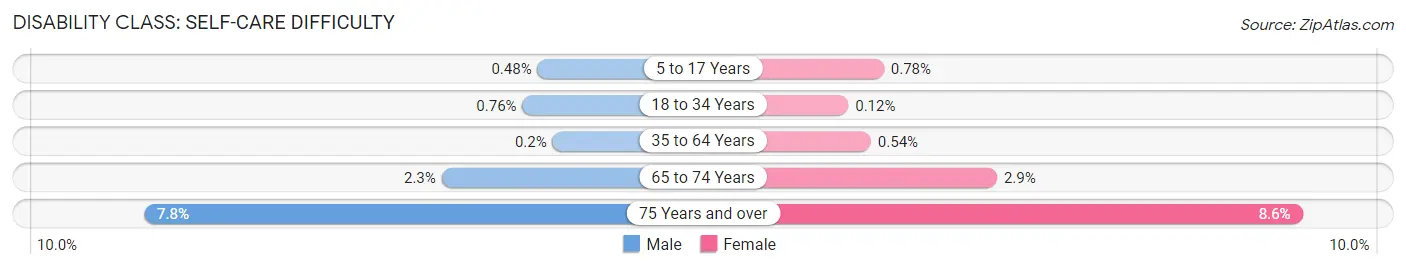
| Age Bracket | Male | Female |
| 5 to 17 Years | 113 (0.5%) | 175 (0.8%) |
| 18 to 34 Years | 130 (0.8%) | 22 (0.1%) |
| 35 to 64 Years | 90 (0.2%) | 242 (0.5%) |
| 65 to 74 Years | 116 (2.3%) | 178 (2.9%) |
| 75 Years and over | 233 (7.8%) | 412 (8.6%) |
Technology Access in Frisco
Computing Device Access in Frisco
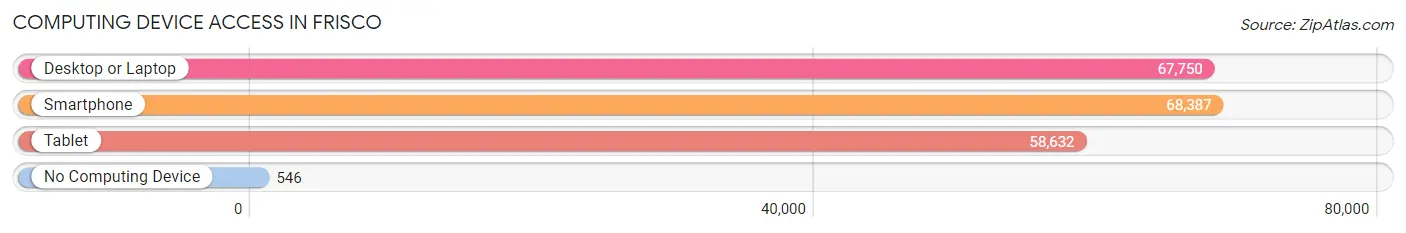
| Device Type | # Households | % Households |
| Desktop or Laptop | 67,750 | 96.1% |
| Smartphone | 68,387 | 97.0% |
| Tablet | 58,632 | 83.2% |
| No Computing Device | 546 | 0.8% |
| Total | 70,502 | 100.0% |
Internet Access in Frisco
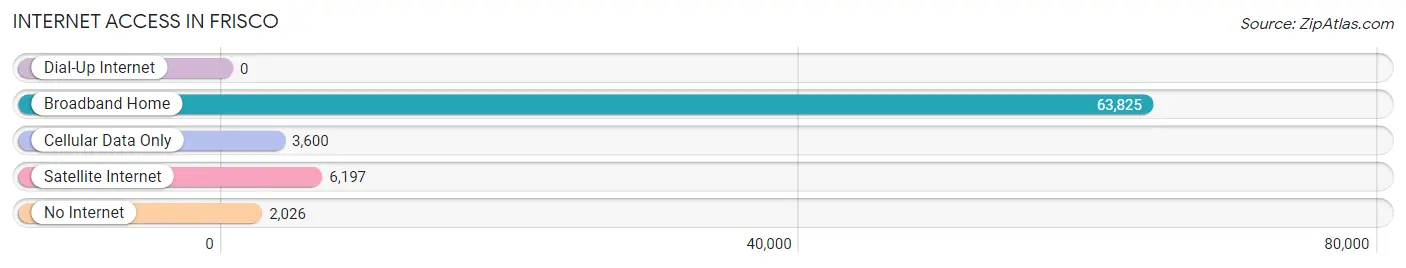
| Internet Type | # Households | % Households |
| Dial-Up Internet | 0 | 0.0% |
| Broadband Home | 63,825 | 90.5% |
| Cellular Data Only | 3,600 | 5.1% |
| Satellite Internet | 6,197 | 8.8% |
| No Internet | 2,026 | 2.9% |
| Total | 70,502 | 100.0% |
Frisco Summary
Frisco, Texas is a city located in Collin and Denton counties in the U.S. state of Texas. It is a part of the Dallas-Fort Worth metroplex, and is located approximately 25 miles (40 km) north of Dallas and 40 miles (64 km) northeast of Fort Worth. As of the 2010 census, the city had a population of 116,989, making it the fastest-growing city in the United States.
History
Frisco was founded in 1902 as a small farming community. The city was named after the Frisco Railroad, which ran through the area. The railroad was built in 1876 and was the first to connect Dallas and Sherman. The city was incorporated in 1908 and grew slowly until the 1950s, when the population began to increase rapidly.
In the late 1980s, the city began to experience a population boom due to the growth of the Dallas-Fort Worth metroplex. The city was also home to the Dallas Cowboys' practice facility from 1995 to 2016. In 2002, the city was named the "Fastest Growing City in America" by the U.S. Census Bureau.
Geography
Frisco is located in Collin and Denton counties in the U.S. state of Texas. It is part of the Dallas-Fort Worth metroplex, and is located approximately 25 miles (40 km) north of Dallas and 40 miles (64 km) northeast of Fort Worth. The city has a total area of 62.4 square miles (161.3 km2), of which 62.2 square miles (160.9 km2) is land and 0.2 square miles (0.4 km2) is water.
Economy
Frisco's economy is largely based on the service industry, with many businesses providing services to the Dallas-Fort Worth metroplex. The city is home to several corporate headquarters, including Dr Pepper Snapple Group, Pizza Hut, and Frito-Lay. The city is also home to several shopping centers, including Stonebriar Centre, The Shops at Starwood, and Frisco Square.
Demographics
As of the 2010 census, the city had a population of 116,989. The racial makeup of the city was 75.3% White, 8.2% African American, 0.5% Native American, 8.2% Asian, 0.1% Pacific Islander, 4.2% from other races, and 3.5% from two or more races. Hispanic or Latino of any race were 15.3% of the population.
The median income for a household in the city was $90,945, and the median income for a family was $103,945. The per capita income for the city was $37,945. About 4.2% of families and 5.7% of the population were below the poverty line, including 6.7% of those under age 18 and 4.2% of those age 65 or over.
Common Questions
What is Per Capita Income in Frisco?
Per Capita income in Frisco is $63,571.
What is the Median Family Income in Frisco?
Median Family Income in Frisco is $172,003.
What is the Median Household income in Frisco?
Median Household Income in Frisco is $144,567.
What is Income or Wage Gap in Frisco?
Income or Wage Gap in Frisco is 46.0%.
Women in Frisco earn 54.0 cents for every dollar earned by a man.
What is Inequality or Gini Index in Frisco?
Inequality or Gini Index in Frisco is 0.42.
What is the Total Population of Frisco?
Total Population of Frisco is 202,075.
What is the Total Male Population of Frisco?
Total Male Population of Frisco is 99,822.
What is the Total Female Population of Frisco?
Total Female Population of Frisco is 102,253.
What is the Ratio of Males per 100 Females in Frisco?
There are 97.62 Males per 100 Females in Frisco.
What is the Ratio of Females per 100 Males in Frisco?
There are 102.44 Females per 100 Males in Frisco.
What is the Median Population Age in Frisco?
Median Population Age in Frisco is 37.8 Years.
What is the Average Family Size in Frisco
Average Family Size in Frisco is 3.4 People.
What is the Average Household Size in Frisco
Average Household Size in Frisco is 2.9 People.
How Large is the Labor Force in Frisco?
There are 109,332 People in the Labor Forcein in Frisco.
What is the Percentage of People in the Labor Force in Frisco?
71.7% of People are in the Labor Force in Frisco.
What is the Unemployment Rate in Frisco?
Unemployment Rate in Frisco is 3.9%.